Article

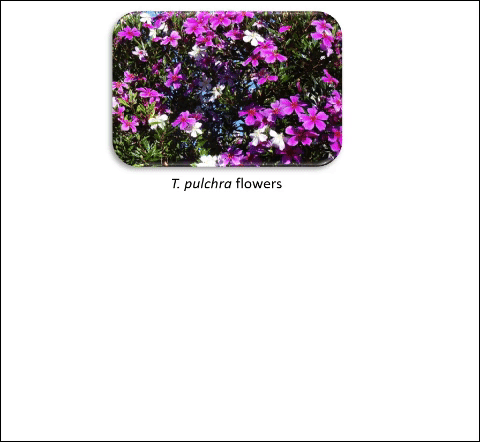
Acylated Flavonoid Glycosides are the Main Pigments that Determine the Flower Colour of the Brazilian Native Tree Tibouchina pulchra (Cham.) Cogn.

1
Botany Department, Institute of Bioscience, University of São Paulo (USP), São Paulo 05508-060, Brazil
2
Center for Nanomedicine and Theranostics, Department of Chemistry, Technical University of Denmark, Kgs. 2800 Lyngby, Denmark
*
Authors to whom correspondence should be addressed.
Molecules 2019, 24(4), 718; https://doi.org/10.3390/molecules24040718
Submission received: 25 January 2019 / Revised: 13 February 2019 / Accepted: 14 February 2019 / Published: 16 February 2019
(This article belongs to the Special Issue Natural Product Isolation, Identification and Biological Activity)

Abstract

:
Tibouchina pulchra (Cham.) Cogn. is a plant native to Brazil whose genus and family (Melastomataceae) are poorly studied with regards to its metabolite profile. Phenolic pigments of pink flowers were studied by ultra-performance liquid chromatography with a photodiode array detector and electrospray ionization quadrupole time-of-flight mass spectrometry. Therein, twenty-three flavonoids were identified with eight flavonols isolated by preparative high-performance liquid chromatography and analysed by one- and two-dimensional nuclear magnetic resonance. Kaempferol derivatives were the main flavonols, encompassing almost half of the detected compounds with different substitution patterns, such as glucoside, pentosides, galloyl-glucoside, p-coumaroyl-glucoside, and glucuronide. Concerning the anthocyanins, petunidin p-coumaroyl-hexoside acetylpentoside and malvidin p-coumaroyl-hexoside acetylpentoside were identified and agreed with previous reports on acylated anthocyanins from Melastomataceae. A new kaempferol glucoside was identified as kaempferol-(2′′-O-methyl)-4′-O-α-d-glucopyranoside. Moreover, twelve compounds were described for the first time in the genus with five being new to the family, contributing to the chemical characterisation of these taxa.

1. Introduction

Tibouchina Aubl., the most representative genus within Melastomataceae, has approximately 460 species [1,2,3]. Melastomataceae can be recognised among eudicots by the characteristic leaf acrodromous venation pattern [4]. The family is the fifth largest group among Angiosperms in Brazil [5], comprising 4500 species and approximately 170 genera. In spite of pantropical distribution, the greatest diversity of species is found in the Neotropics (ca. 3000 species), with 929 species native to Brazil [6]. Out of the 166 Tibouchina species reported in Brazil, 105 are endemic [6], occurring mainly in the Atlantic Rainforest and in the Cerrado (Brazilian savannahs); both biomes are recognised as biodiversity hotspots [7]. This native vegetation is constantly under illegal deforestation and agribusiness expansion, generating a need for programmes for biodiversity conservation and, consciously, resources exploitation.
Tibouchina species occur in open areas, such as forest edges and clearings, and are considered important for restoration/reforestation purposes [8]. Moreover, Tibouchina granulosa (Desr.) Cogn. and Tibouchina pulchra (Cham.) Cogn. have been characterised as possible biomonitors of air pollution, such as particulate matter and ozone [9,10,11,12,13,14,15,16]. Despite the ecological importance of this genus, the main use of Tibouchina is urban ornamentation and nowadays, several cultivars are available in the flower market. A large contributor to the beauty and fascinating feature of T. pulchra is the colour change of the flowers from white to intense pink during development [17].
Few examples of traditional uses are described in the literature for Tibouchina. Among them are anti-inflammatory, antioxidant [18], antinociceptive (relieving chronic pain) [19], antibacterial [20,21], antifungal [22,23], antiparasitic [20,24,25], and anticancer [26] activities of leaf extracts. Nonetheless, the chemical composition of Tibouchina largely remains elusive, with only eleven species being characterised phytochemically. These few reports described the presence of several natural products, such as flavonoids (flavonol glycosides, isoflavonoids and anthocyanins), phenolic derivatives, tannins, and triterpenes in distinct organs of the plant. Structural elucidation by nuclear magnetic resonance (NMR) was performed only for some triterpenes, tannins, flavonols and anthocyanins in T. urvilleana (DC.) Cogn. and T. lepidota (Bonpl.) Baill. [27,28,29] (Table 1).
Due to the importance of Tibouchina species for ornamentation and ecological purposes, the present work aimed to assess the qualitative profile of acidified alcoholic extract from T. pulchra flowers. An ultra-performance liquid chromatography with photodiode array detector and electrospray ionization quadrupole time-of-flight mass spectrometry (UPLC-PAD-ESI-QTOF-MS) method was established, and thirty-two compounds were detected with twenty-three identified, many of them reported for the first time in the species, genus, and family, as well as a new flavonol: kaempferol-(2′′-O-methyl)-4′-O-α-d-glucopyranoside.

2. Results and Discussion

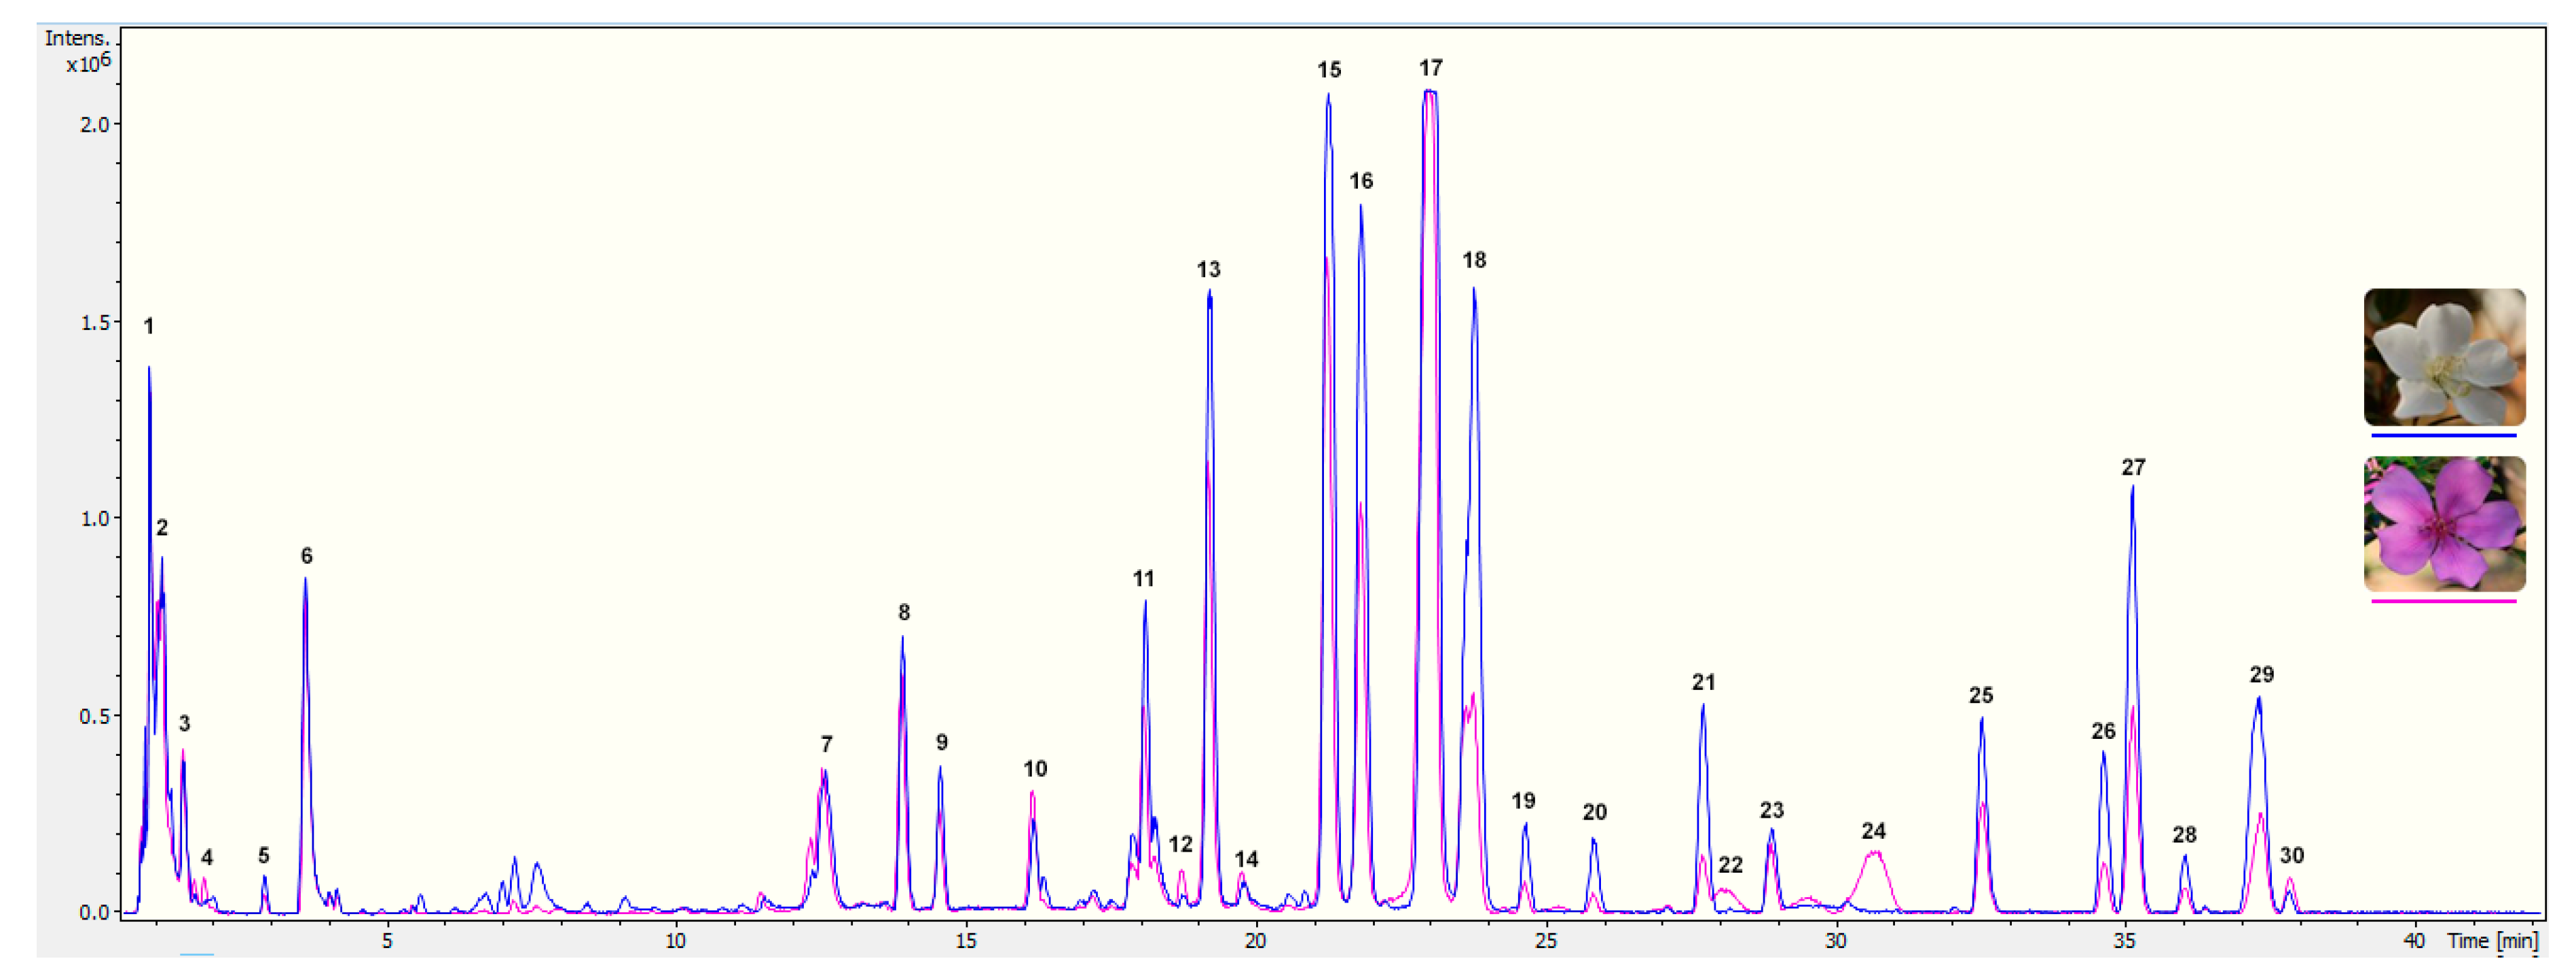
2.1. Chemical Screening of Tibouchina pulchra Flowers

To explore the pigment profiling of T. pulchra petals, the first step was to analyse acidic alcoholic extracts from white and pink flowers by UPLC-PAD-ESI-QTOF-MS. The exclusive difference between the two floral stages was the presence of anthocyanins in pink flower extracts (Figure 1). In order to perform a complete characterisation of floral pigments, the pink floral stage was chosen for isolation and identification of constituents.
In the chromatograms shown in Figure 1, two classes of phenolics were found: phenolic acids (including cinnamic derivatives, constituents 1 to 6) and flavonoids (flavonols and anthocyanins, constituents 7 to 30). Based on analysis of the MS data (Figure S1), the presence of thirty-two compounds is suggested (Table 2), due to the co-elution of some compounds in the chromatographic analysis.
The main flavonols identified in the petal extract were kaempferol, quercetin, and myricetin (Table 2 and Table 3), which were previously described in leaves of T. pulchra but only with hexosyl and pentosyl substituents [10,36]. The most abundant flavonol skeleton was kaempferol (m/z 287.0548) with different substituents as glucuronyl methyl ester (constituent 23), galloylhexosides (constituents 13, 16 and 19), and p-coumaroylhexosides (21, 27, 28 and 30). Quercetin derivatives (m/z 303.0496, constituents 10, 11, 12 and 25) were the second most abundant flavonol identified, followed by myricetin derivatives (m/z 319.0445, constituents 8 and 9).
Compounds 8, 9, 11, 15 and 17 showed the loss of 162 amu during MS analysis, indicating the presence of a hexose, probably a galactosyl or a glucosyl group (Figure S1). Pentoses, as arabinose, apiose or xylose, were also found as substituents in the case of compounds 18 and 20, which exhibited a mass loss of 132 amu. Compounds 12 and 23 showed hexauronic acids as substituents, identified by the mass loss of 176 and 190 amu, respectively. The difference is presumably the methyl group in compound 23 as consequence of solvent artefact during extraction procedures. Compound 23 was analysed by NMR and confirmed as glucuronic acid methyl ester substituent. Literature describes glucose as the most commonly identified sugar in flavonoids, while galactose, rhamnose, xylose, and arabinose are less frequent. Yet, mannose, fructose, glucuronic, and galacturonic acids are rare [41,42,43].
Mass loss of 314 amu indicates the presence of galloylhexoside. This group was identified in compound 10, a quercetin derivative, and in the isomers 13, 16 and 19, which are kaempferol derivatives. The fragment m/z 153.0181 was intense for these compounds, which can be ascribed to a galloyl substituent and to a typical ion signal from a fragment of A-ring+ [41], generated by retro Diels–Alder fragmentation of the C-ring (Table 3). The mass spectrum of compound 19 showed the fragment m/z 449.1071, a loss of 152 amu from m/z 601.1170 [M + H]+, corroborating the galloyl substitution [41,44,45]. Moreover, the additional mass loss of 162 amu confirmed the presence of hexoside (glucoside or galactoside).
Regarding the p-coumaroyl group, we identified eight compounds with this acylation pattern: 21, 22, 24, 25, 26, 27, 28, and 30. A mass loss of 308 amu is indicative of p-coumaroylhexose substitution, but it can also indicate a rutinosyl group (6-rhamnosylglucose) as substituent. The fragment of m/z 147.0439 found in compounds 25, 27, 28, and 30 confirmed the presence of either a p-coumaroyl or a rhamnosyl substituent. Furthermore, acylation with hydroxycinnamic acids, as p-coumaric acid, shifts the band I from ultraviolet/visible (UV/VIS) spectra of the flavonols to a lower wavelength, resulting in a peak or shoulder at 305–310 nm. In addition, acylation of the sugar moiety also increases retention time in a chromatographic analysis [46,47,48], as shown in Table 2.
Concerning anthocyanins, malvidin and petunidin were the aglycones identified (Table 2 and Table 4). Petunidin p-coumaroylhexoside acetylpentoside (22) showed a molecular ion of m/z 799.2077 [M + H]+, in which fragmentation resulted in m/z 625.1552 [M − 174]+, m/z 491.1176 [M − 308]+ and m/z 317.0665 [M − 482]+, corresponding to the neutral loss of acetylpentoside and p-coumaroylhexoside from a petunidin. The other anthocyanin, malvidin p-coumaroylhexoside acetylpentoside (24), exhibited a fragment of m/z 813.2243 [M + H]+, whose fragmentation resulted in m/z 639.1716 [M − 174]+, m/z 505.1336 [M − 308]+ and m/z 331.0812 [M − 482]+ consistent with the loss of acetylpentoside and p-coumaroylhexoside from malvidin (Figure S1). Although previously reported in T. lepdota and T. urvilleana [27,29], acylated anthocyanins were identified here for the first time in T. pulchra.
The chemical composition of polar extracts of T. pulchra revealed thirty-two compounds, with twenty-three identified by UV/VIS and MS. Nuclear magnetic resonance spectroscopy was used as additional technique to support the structural elucidation of eight compounds.

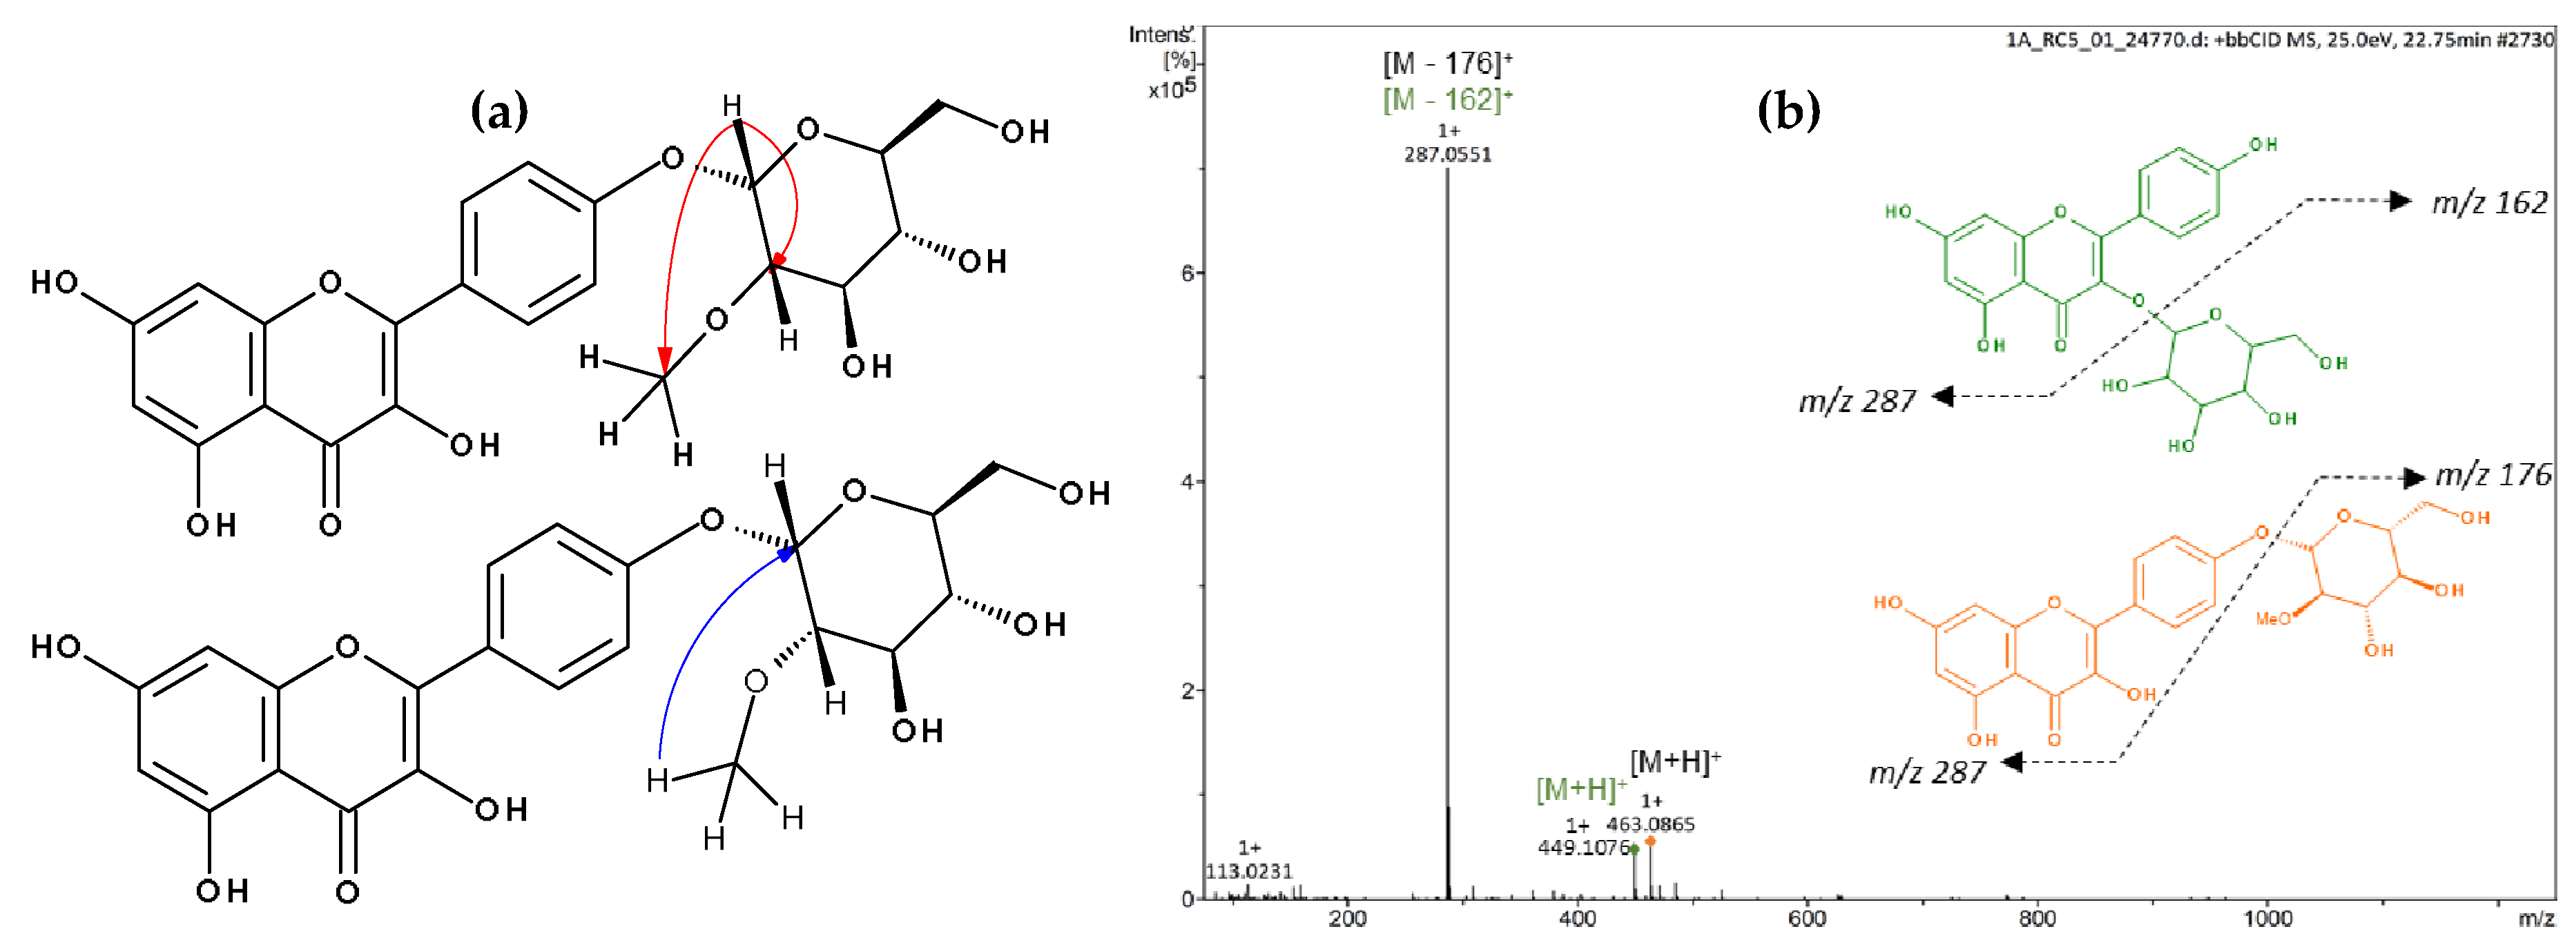
2.2. Structural Elucidation of Acylated Flavonoids by NMR and Identification of a New Flavonol Glucoside

Flavonoid acylation can influence the biological activity of compounds by altering their solubility, stability, reactivity, and interaction with cellular targets [49], and with regards to the colour of flowers, esterification typically enhances the intensity [50]. Thus, we further isolated the acylated flavonoids by preparative high-performance liquid chromatography (HPLC) to investigate their structure through NMR spectroscopy. Successful isolation was achieved for kaempferol 3-O-(2′′-O-galloyl)-β-d-glucopyranoside (13, 16 or 19; Figures S2–S8 and Table S1), kaempferol 3-O-(6′′-O-galloyl)-β-d-glucopyranoside (13, 16 or 19; Figures S9–S15 and Table S1), kaempferol 3-O-glucuronide-6′′-O-methylester (23; Figures S22–S26 and Table S2), quercetin 3-O-(6′′-O-p-coumaroyl)-β-d-glucopyranoside (25; Figures S27–S31 and Table S3), kaempferol 3-O-(6′′-O-p-coumaroyl)-β-d-glucopyranoside (27; Figures S32–S38 and Table S3), kaempferol (29; Figures S39–S41 and Table S4), and a mixture of kaempferol 3-O-β-d-glucopyranoside and kaempferol-(2′′-O-methyl)-4′-O-α-d-glucopyranoside (17; Table 5, Figure 2 and Figure S16–S21), which furnished a new compound.
The mass spectrum of 17 was indicative of a mixture of two compounds, which differed from each other in 14 amu, suggesting the presence of an additional methyl group in one of the structures (Figure 2). In the NMR spectrum of 17, seven signals typical of aromatic hydrogens were observed: three doublets at δ 6.22 (1H, d, J = 2.0 Hz, H6), δ 6.21 (1H, d, J = 2.0 Hz, H6), and δ 6.46 (2H, s, H8), corresponding to a meta-coupling of these protons which were attributed to the flavonoid A-ring; and another three doublets with ortho-coupling constants at δ 6.89 (2H, d, J = 8.4 Hz, H3′ and 5′), δ 6.93 (2H, d, J = 8.5 Hz, H3′ and 5′) and δ 8.04 (4H, d, J = 8.4 Hz, H2′ and 6′), suggesting two para-substituted B-rings of flavonoids. The anomeric protons appeared at δ 5.46 (1H, d, J = 7.6 Hz, H1′′) and δ 4.51 (1H, d, J = 3.6 Hz, H1′′). The smaller coupling constant of the latter suggests an α-linked carbohydrate. Signals between δ 3.09 and δ 3.58 were attributed to the hydrogens of the sugar moiety. The presence of a methyl group was confirmed by signals at δ 3.26 (s, 3H) and δ 54.74 (OMe). Furthermore, the heteronuclear multiple bond correlation (HMBC) spectrum showed two relevant correlations: the first between the anomeric protons at δ 5.46 with C3 (δ 133.63) from the flavonoid C-ring, confirming the position of the sugar moiety in kaempferol 3-O-β-d-glucopyranoside (astragalin), and the second one, the anomeric proton (δ 4.51) with the methyl group at δ 54.74, suggesting the presence of 2-methoxyglycosyl moiety (Figure 2). Although the correlation between the anomeric proton and carbon C4′ of the flavonoid was not observed, the position of the glycoside was supported by the 13C NMR chemical shifts at C2 (δ 147.27) and C3 (δ 136.10) positions of the flavonoid, which is consistent with the presence of a free hydroxyl group at C3 [51].
Astragalin is a common flavonol present in red wine and in many plants [52]. Flavonols are usually substituted at positions 3 and 7 [53]. The 4′ moiety is unusual but kaempferol 4′-O-β-d-glucopyranoside has already been described [54]. However, to the best of our knowledge, the 2′′ methylated, α-linked sugar in the 4′ position of the kaempferol-(2′′-O-methyl)-4′-O-α-d-glucopyranoside has not previously been reported in the literature.

2.3. Flavonoids in Tibouchina and Melastomataceae

In this work, seventeen compounds were described for the first time in T. pulchra, with twelve described for the first time in Tibouchina. Flavonols, especially myricetin derivatives, are characteristic within Mytales [4]. In Tibouchina, the most common flavonols are quercetin and isorhamnetin and in T. pulchra, kaempferol was the main flavonol. Moreover, kaempferol derivatives have only been described before in T. ciliaris and T. pereirae. Regarding anthocyanins, malvidin has already been identified in T. lepidota, T. grandiflora, T. semidecantra, and T. urvelleana, while petunidin has been described exclusively in T. granulosa (Table 1). Although the acylation of anthocyanins has already been reported for the Melastomatoideae [4], this is the first characterisation of anthocyanins (i.e., malvidin and petunidin derivatives) in T. pulchra.
The most common acyl groups generally found as flavonoid substituents are hydroxycinnamic acids (e.g., caffeic, ferulic and p-coumaric acids) [55]. Flavonoids with a p-coumaroyl group have already been described for Tibouchina, such as T. ciliaris (kaempferol 7-O-p-coumaroyl), T. grandiflora (malvidin 3-(p-coumaroyl)-sambubioside-5-glucoside), malvidin 3-(p-coumaroyl-glucoside)-5-glucoside), and T. urvilleana (malvidin 3-O-(6-O-p-coumaryl-β-d-glucopyranoside)-5-O-(2-O-acetyl-β-d-xylopyranoside)) [27,30,31,40], which are in agreement with the results obtained for T. pulchra.
Acylation with hydroxybenzoic acids, such as gallic acid, is rare in angiosperms because the active production of hydrolysable tannins is restricted to certain orders as Alismatales, Cornales, Dilleniales, Ericales, Fagales, Geraniales, Juglandales, Myrtales, Proteales, Rosales, Sapindales, and Saxifragales [56]. Tannin occurrence has been described in at least three species of Tibouchina: T. semidecantra, T. pulchra and T. multiflora [10,12,34,36,38] (Table 1). Although hydrolysable tannins were neither identified in T. ciliaris nor in T. granulosa, the presence of quercetin 6′′-O-gallate and quercetin 3-(O-galloyl)-hexoside, respectively [31,34], is indicative of the existence of this class of metabolites. Here, we found quercetin galloylhexoside and three isomers of kaempferol galloylhexoside (13, 16 and 19), with two of them successfully isolated for NMR analysis (kaempferol-3-O-(6′′-O-galloyl)-β-d-glucopyranoside and kaempferol-3-O-(2′′-O-galloyl)-β-d-glucopyranoside) and one not isolated. This substitution pattern agrees with previous findings of tannins in T. pulchra [10,12,36].
Although in Melastomataceae, many compounds have been isolated and identified by extensive spectrometric analyses. However, considering the size of the family, the number of studied species is still low. The most commonly found natural products in this family are terpenes, simple phenolics, quinones, lignans and flavonoids, as well as a vast range of tannins, mainly hydrolysable ones [57].
The results obtained for T. pulchra in the present study describe, for the first time, the presence of five compounds in this family: kaempferol 3-O-(6′′-O-galloyl)-β-d-glucopyranoside (13, 16 or 19), kaempferol 3-O-(2′′-O-galloyl)-β-d-glucopyranoside (13, 16 or 19), kaempferol-(2′′-O-methyl)-4′-O-α-d-glucopyranoside (17), kaempferol 3-O-glucuronide-6′′-O-methylester (23) and kaempferol 3-O-(6′′-O-p-coumaroyl)- β-d-glucopyranoside (27). Serna and Martinéz (2015) reviewed the chemical characterisation of Melastomataceae by considering only constituents identified by NMR. Kaempferol 3-O substitute was found only in Miconia cabucu Hoehne and M. rubiginosa (Bonpl.) DC., but usually kaempferol is 7-O substituted in this family [58]. Kaempferol aglycone (29) was also found in Medinilla magnifica Lindley and Centradenia floribunda Planch [57]. Regarding anthocyanins, malvidin p-coumaroylhexoside acetylpentoside (24) was the major anthocyanin in T. pulchra, which agrees with the proposition of malvidin as the most common anthocyanin nucleus in Melastomataceae [57]. This was the first description of petunidin p-coumaroylhexoside acetylpentoside (22) in T. pulchra and in Melastomataceae, since previous studies had described pelargonidin, cyanidin, peonidin, delphinidin, and malvidin glycosides or acylglycosides [57] in this species and family. Further NMR studies of T. pulchra anthocyanins are necessary to underpin the identification performed here by MS and UV.
The large number of flavonols identified in the pink stage of T. pulchra flowers might be an effect of co-pigmentation. It is known that this class of substances is related with white colour and co-pigmentation in coloured tissues. Co-pigmentation can be defined as the formation of noncovalent complexes involving an anthocyanin or anthocyanin-derived pigment and a co-pigment (in the presence or absence of metal ions), as well as subsequent changes in optical properties of the pigment. There are over ten thousand compounds of different classes of phenolic compounds (e.g., hydrolysable tannins, flavonoids, and phenolic acids) that help to stabilise the colour of flowers and increase colour intensity. In addition, glycosylation and acylation enhance the brightness of anthocyanin colours [50].
In conclusion, the Melastomataceae, and in particular, Tibouchina taxa are poorly characterised chemically. Here, out of the seventeen compounds described for the first time in T. pulchra, five of them are reported in the family: 13, 16, and 19 (we isolated two isomers); 17 (only kaempferol-(2′′-O-methyl)-4′-O-α-d-glucopyranoside); 23; and 27. Moreover, a novel flavonol was identified as kaempferol 4′-O-(2′′-methyl)-α-d-glucopyranoside. Recent advances in spectrometric techniques offer a unique opportunity to improve our knowledge about the chemical structure of natural products. Studies about flower anthocyanins are scarce, and the understanding of their structure, biosynthesis, and the regulatory mechanisms involved in their accumulation pattern helps to improve our knowledge about plant secondary metabolism—as well as the relationship between flower colour and the attraction of pollinators—and brings new insights for future biotechnological applications.

3. Materials and Methods

3.1. Plant Material

A pool of white and pink petals of Tibouchina pulchra were sampled from five different plants at Praça Carlos José Gíglio, São Paulo (Latitude: −23.57998, Longitude: −46.73403) in the most vigorous flowering period (May and June 2016) between 08:00 and 09:00. Petals were immediately frozen in liquid nitrogen and stored at −80 °C until processing. Freeze-dried (K202, Liobras, São Carlos, Brazil) samples were crushed in a ball mill for further analyses. A voucher (ID: Furlan73) was deposited in the Herbarium of the University of São Paulo.

3.2. Extraction and Analysis by UPLC-PAD-ESI-QTOF-MS

Phenolic compounds were extracted from 100 mg of petal powder twice with 1.5 mL of 0.2% hydrochloric acid (HCl) in methanol (MeOH). The samples were sonicated for 10 min and centrifuged at 10,000 rpm for 10 min. The extract was filtered (0.45 μm) and analysed by UPLC-PAD-ESI-QTOF-MS. The MS/MS analysis was performed with a Broadband Collision Induced Dissociation (bbCID) detector (Bruker, Bremen, Germany). Separation was achieved by using a C18 column at a flow rate of 0.3 mL min−1 and 4 µL of injection volume. The column temperature was 45 °C, and the solvent system was composed of 1% formic acid in water (A) and 1% formic acid in acetonitrile (B). Gradient elutions were as follow: 5 to 25% of B (0–40 min), 25 to 100% of B (40–42 min), 100% of B (42.0–42.5 min), 100 to 5% of B (42.5–43.0 min), and 5% of B (43–46 min). Separated compounds were first monitored using a photodiode array detector (PAD) (200 to 600 nm), and then MS scans were performed in positive ion mode (MS+) in the range m/z 75–1250, under the following conditions: capillary voltage set to 4500 V, end plate offset at −500 V, nebulizer at 2 Bar, dry gas flow of 12 L min−1 and dry gas temperature at 200 °C. The MS signal was calibrated using sodium formate. All data were processed using data analysis.

3.3. Isolation by Preparative HPLC and Identification by NMR

Acylated flavonoids were isolated from 10 g of pink petal powder by extracting four times with 200 mL of 0.2% HCl in MeOH. Samples were sonicated for 15 min, pillowed for 10 min, and vacuum filtered and concentrated using a rotary evaporator. The crude extract was diluted to approximately 250 mg/mL and analysed by preparative HPLC with a PAD. Separation was achieved on a C18 column at a flow rate of 20 mL min−1 using 1 mL of injection volume and a solvent system composed of 1% formic acid in water (A) and 1% formic acid in acetonitrile (B). Gradient elution were as follow: 10% of B (0–3 min), 10 to 15% of B (3–30 min), 15% of B (30–50 min), 15 to 20% of B (50–60 min), 20 to 25% of B (60–80 min), 25 to 35% of B (80–90 min), 35 to 45% of B (90–95 min), 45 to 100% of B (95–96 min), 100% of B (96–98 min), 100 to 10% of B (98.0–98.5 min), 10% of B (98.5–102.0 min) and monitored using PAD (200 to 600 nm). All the fractions were concentrated using a rotary evaporator. An aliquot was resuspended in 0.2% HCl in MeOH to check the purity by UPLC-MS. For the isolated compounds, the dried sample was dissolved in deuterated dimethyl sulfoxide (DMSO-d6) for NMR analysis. 1H and 13C NMR spectra were obtained using an AVANCE III HD spectrometer operating at frequency of 800.182 and 201.2 MHz, respectively, and equipped with a 5 mm TCI CryoProbe. Analyses of HMBC and heteronuclear single quantum coherence (HSQC) were also performed. All data were processed using MestreNova.

3.4. NMR Description

Kaempferol 3-O-(6′′-O-galloyl)-β-d-glucoside (13, 16 or 19) appears as pale-yellow amorphous powder (yield of 0.6 mg). UV λmax = 266, 290, 350 nm. [M + H]+ m/z 601.1183. 1H NMR (800 MHz, DMSO-d6): δH 12.52 (1H, s, OH-C5), 10.87 (1H, s, OH-C7), 10.06 (1H, s, OH-C4′), 7.94 (2H, d, J = 8.8 Hz, H-2′, H-6′), 6.92 (2H, s, H-2′′′, H-6′′′), 6.77 (2H, d, J = 8.8 Hz, H-3′, H-5′), 6.45 (1H, d, J = 2.0 Hz, H-8), 6.21 (1H, d, J = 2.0 Hz, H-6), 5.45 (1H, d, J = 7.6 Hz, H-1′′), 4.28 (1H, dd, J = 2.1, 11.8 Hz, H-6′′b), 4.17 (1H, dd, J = 12.0, 3.8 Hz, H-6′′a), 3.51 -3.48 (4H, m, H-2′′- H-5′′). 13C NMR (200 MHz, DMSO-d6): δC 165.36 (C-7′′′), 164.50 (C-7), 161.90 (C-5), 157.26 (C-9), 157.15 (C-2), 150.58 (C-4′); 146.11 (C-3′′′, C-5′′′), 138.94 (C-4′′′), 133.52 (C-3), 131.19 (C-2′, C-6′), 121.04 (C-1′), 120.00 (C-1′′′), 116.46 (C-3′, C-5′), 109.70 (C-2′′′, C-6′′′), 104.66 (C-10), 102.17 (C-1′′), 99.58 (C-6), 94.91 (C-8), 76.51 (C-3′′), 74.60 (C-5′′), 74.52 (C-2′′), 69.89 (C-4′′), 63.15 (C-6′′). Signal assignments were performed by comparison to similar data from the literature [42,51,59].
Kaempferol 3-O-(2′′-O-galloyl)-β-d-glucoside (13, 16 or 19) is a pale-yellow amorphous powder (yield of 3,9 mg). UV λmax: 260,300 sh, 348 nm. [M + H]+ m/z 601.1183. 1H NMR (800 MHz, DMSO-d6): δH 8.04 (2H, d, J = 8.8 Hz, H-2′, H-6′), 6.90 (2H, s, H-2′′′, H-6′′′), 6.89/6.93 (2H, d, J = 8.8 Hz, H-3′, H-5′), 6.45 (1H, d, J = 2.0 Hz, H-8), 6.21 (1H, d, J = 2.0 Hz, H-6), 5.47 (1H, d, J = 7.6 Hz, H-1′′), 3.62/3.38 (2H, H6′’), 3.51 -3.48 (4H, m, H- 2′′- H-5′′). 13C NMR (200 MHz, DMSO-d6): δC 163.30 (C-7), 162.11 (C-7′′′), 160.0 (C-5), 158.40 (C-4′), 155.50 (C-9), 155.46 (C-2), 145.96 (C-3′′′, C-5′′′), 138.86 (C-4′′′), 133.22 (C-3), 129.54 (C-2′,C-6′), 124.0 (C-1′′′), 120.90 (C-1′), 114.66 (C-3′, C-5′), 108.45 (C-2′′′, C-6′′′), 102.70 (C-10), 100.38 (C-1′′), 98.02 (C-6), 93.05 (C-8), 76.74 (C-5′′), 75.87 (C-3′′), 73.68 (C-2′′), 69.48 (C-4′′), 60.68 (C-6′′). Signal assignments were performed by comparison to similar data from the literature [43,52,60].
The mixture of kaempferol 3-O-β-d-glucopyranoside, kaempferol-(2′′-O-methyl)-4′-O-α-d-glucopyranoside (17) appears a pale yellow to dark amorphous powder (yield of 4.2 mg). UV λmax = 266, 348 nm. [M + H]+ m/z 449.1079 and m/z 463.0865. 1H NMR (800 MHz, DMSO-d6) and 13C NMR (200 MHz, DMSO-d6) are shown in in Table 5. Correlations of HMBC spectrum are shown in Figure 2. Signal assignments were performed by comparison to similar data from the literature [42,51,54,59].
Kaempferol 3-O-glucuronide-6′′-O-methylester (23) is a pale-yellow liquid (yield of 0.5 mg). UV λmax = 268, 320 nm. [M + H]+ m/z 477.1031. 1H NMR (800 MHz, DMSO-d6) δH 8.02 (2H, d, J = 8.9 Hz, H-2′ and 6′), 6.89 (2H, d, J = 8.9 Hz, H-3′ and 5′), 6.45 (1H, d, J = 2.0 Hz, H-8), 6.23 (1H, d, J = 2.0 Hz, H--6), 5.47 (1H, d, J = 7.7 Hz, H-1′′), 3.57 (3H, s, OMe). The HMBC spectrum showed three relevant correlations: the anomeric hydrogen (δ 5.47) with C3 (δ 133.58) from the flavonoid C-ring, the H5′′ (δ 3.73) from the sugar moiety and the methoxyl group (δ 3.57) both with C6′′ (δ 169.52) from the carboxyl group in the glucuronic acid. Analyses of HSQC and HMBC spectra confirmed the assignment of the carbon signals aggressed with previously reported data [42,51,60].
Quercetin 3-O-(6′′-O-p-coumaroyl)-β-d-glucopyranoside (25) is a light pink to dark amorphous powder (yield of 0,5 mg). UV λmax = 271, 312 nm. [M + H]+ m/z 611.1393. 1H NMR (800 MHz, DMSO-d6) δH 7.66 (1H, dd, J = 8.5 Hz and J = 2.3 Hz, H6′), 7.52 (1H, d, J = 2.3 Hz, H-2′), 7.37 (2H, d, J = 8.4 Hz, H-2′′′, H-6′′′), 7.36 (1H, d, J = 15.7 Hz, H7′′′).6.83 (2H, d, J = 8.4 Hz, H-3′′, H-5′′′), 6.78 (1H, d, J = 8.4 Hz, H5′), 6.38 (1H, d, J = 2.1 Hz, H-8), 6.14 (1H, d, J = 2.1 Hz, H-6), 6.13 (1H, d, J = 15.7 Hz, H8′′′), 5.42 (1H, d, J = 7.8 Hz) and 4.12 (1H, dd, J = 11.5 Hz and J = 4.6 Hz, H-1′′′, H-6′′′). HSQC spectrum allowed assignment of carbon signals in agreement with data from the literature [42,51,61].
Kaempferol 3-O-(6′′-O-p-coumaroyl)-β-d-glucopyranoside (27) appears as light pink to dark amorphous powder (yield of 0,7 mg). UV λmax = 268, 314 nm. [M + H]+ m/z 595.1418. 1H NMR (800 MHz, DMSO-d6) δH 8.05 (2H, d, J = 8.4 Hz, H-2′, H-6′), 7.34 (1H, d, J = 15.9 Hz, H-7′′′), 6.86 (2H, d, J = 8.7 Hz, H-2′′′, H-6′′′), 6.78 (2H, d, J = 8.4 Hz, H-3′, H-5′), 6.40 (1H, d, J = 2.1 Hz, H-8), 6.14 (1H, d, J = 2.1 Hz, H-6), 6.11 (1H, d, J = 15.9 Hz, H-8′′′), 5.41 (1H, d, J = 7.7 Hz, H-1′′), 4.10 (2H, d, J = 6.2 Hz, H-6′’). The HMBC spectrum showed one relevant correlation confirming the p-coumaroyl position: the H6′′ (δ 4.10) from the sugar moiety with the C9′′′ from the p-coumaroyl group. HSQC and HMBC spectra reinforced the assignment of the carbon signals in accordance to the literature [42,51,62].
Kaempferol (29) is a pale-yellow amorphous powder (yield of 2,1 mg). UV λmax (MeOH): 260,300 sh, 348 nm. [M + H]+ m/z 287.0546. 1H NMR (800 MHz, DMSO-d6): δH 12.48 (1H, s, OH-C5), 10.83 (1H, s, OH-C7), 10.13 (1H, s, OH-C4′), 8.05 (2H, d, J = 8.9 Hz, H-2′, H-6′), 6.94 (2H, d, J = 8.9 Hz, H-3′, H-5′), 6.46 (1H, d, J = 2.0 Hz, H-8), 6.21 (1H, d, J = 2.0 Hz, H-6). 13C NMR (200 MHz, DMSO-d6): δC 176.36 (C-4), 164.38 (C-7), 161.15 (C-5), 159.67 (C-4′), 156.63 (C-9), 147.27 (C-2), 136.11 (C-3), 129.95 (C-2′, C-6′), 122.12 (C-1′), 115.91 (C- 3′, C-5′), 103.49 (C-10), 96.68 (C-6), 93.95 (C-8) [42,51,63,64].

Supplementary Materials

The following are available online, Figure S1: MS+ spectra of compounds 1 to 30, Figures S2–S8: NMR spectra of kaempferol 3-O-(2″-galloyl)-β-d-glucopyranoside (13, 16 or 19), Figures S9–S15: NMR spectra of kaempferol 3-O-(6″-galloyl)-β-d-glucopyranoside (13, 16 or 19), Figures S16–S21: NMR spectra of mixture (17), Figures S22–S26: NMR spectra of kaempferol 3-O-glucoronide-6″-O-methylester (23), Figures S27–S31: NMR spectra of quercetin 3-O-(6″-p-coumaroyl)-β-d-glucopyranoside (25), Figures S32–S38: NMR spectra of kaempferol 3-O-(6″-p-coumaroyl)-β-d-glucopyranoside (27), Figures S39–S41: NMR spectra of kaempferol (29).

Author Contributions

Conceptualization, methodology, F.M.R., M.R. and C.M.F.; formal analysis, investigation, data curation, writing—original draft preparation, F.M.R.; chemical identification, F.M.R., C.M.F. and M.J.P.F.; writing—review and editing, M.H.C., M.J.P.F., M.R., C.M.F.; supervision, project administration, C.M.F., funding acquisition, M.H.C., M.R. and C.M.F.

Funding

This research was funded by FAPESP (2013-10413-0, Brazil) and CAPES (Finance Code 001, Brazil). M.R. and M.J.P.F. were funded by a fellowship from CNPq. M.H.C. was supported by the Carlsberg Foundation (grant no. CF14-0564). The 800 MHz NMR data were recorded at the NMR Center at DTU supported by the Villum Foundation.

Acknowledgments

We thank Thomas Ostenfeld Larsen for providing the UPLC-PAD-ESI-QTOF-HRMS. We also thank the technicians Andreas H. R. Heidemann and Christopher Phippen (Department of Biotechnology and Biomedicine, DTU, Denmark), Philip Charlie Johansen and Kasper Enemark-Rasmussen (Department of Chemiitry, DTU, Denmark), Silvia Regina Blanco, Leandro S. Santos, Mourisa M. de Souza Ferreira, and Aline Bertinatto Cruz (Department of Botany, Bioscience Institute, USP, Brazil) for assistance in the management of the equipment.

Conflicts of Interest

The authors declare no conflict of interest.

References

  1. Clausing, G.; Renner, S.S. Molecular phylogenetics of Melastomataceae and Memecylaceae: Implications for character evolution. Am. J. Bot. 2001, 88, 486–498. [Google Scholar] [CrossRef] [PubMed]
  2. Tropicos Missouri Botanical Garden. Available online: http://www.tropicos.org (accessed on 27 August 2017).
  3. Guimarães, P.J.F. Two New Species of Tibouchina (Melastomataceae) from Brazil. Novon St. Louis Mo. 2014, 23, 42–46. [Google Scholar] [CrossRef]
  4. Angiosperm Phylogeny Website. Available online: http://www.mobot.org/MOBOT/research/APweb/ (accessed on 21 January 2019).
  5. BFG [The Brazilian Flora Group]. Growing knowledge: An overview of Seed Plant diversity in Brazil. Rodriguésia 2015, 66, 1085–1113. [Google Scholar] [CrossRef]
  6. Flora do Brasil Jardim Botânico do Rio de Janeiro. Available online: http://floradobrasil.jbrj.gov.br/reflora/floradobrasil/FB9876 (accessed on 6 October 2018).
  7. Myers, N.; Mittermeier, R.A.; Mittermeier, C.G.; Fonseca, G.A.B.; Kent, J. Biodiversity hotspots for conservation priorities. Nat. Lond. 2000, 403, 853–858. [Google Scholar] [CrossRef] [PubMed]
  8. Ellison, A.M.; Denslow, J.S.; Loiselle, B.A.; Brénes, D.M. Seed and seedling ecology of Neotropical Melastomataceae. Ecology 1993, 6, 1733–1749. [Google Scholar] [CrossRef]
  9. Klumpp, G.; Furlan, C.M.; Domingos, M.; Klumpp, A. Response of stress indicators and growth parameters of Tibouchina pulchra Cogn. exposed to air and soil pollution near the industrial complex of Cubatão, Brazil. Sci. Total Environ. 2000, 246, 79–91. [Google Scholar] [CrossRef]
  10. Furlan, C.M.; Salatino, A.; Domingos, M. Influence of air pollution on leaf chemistry, herbivore feeding and gall frequency on Tibouchina pulchra leaves in Cubatão (Brazil). Biochem. Syst. Ecol. 2004, 32, 253–263. [Google Scholar] [CrossRef]
  11. Furlan, C.M.; Moraes, R.M.; Bulbovas, P.; Sanz, M.J.; Domingos, M.; Salatino, A. Tibouchina pulchra (Cham.) Cogn., a native Atlantic Forest species, as a bioindicator of ozone: Visible injury. Environ. Pollut. 2008, 152, 361–365. [Google Scholar] [CrossRef]
  12. Dos Santos, A.C.; Furlan, C.M. Levels of phenolic compounds in Tibouchina pulchra after fumigation with ozone. Atmos. Pollut. Res. 2013, 4, 250–256. [Google Scholar] [CrossRef]
  13. Zampieri, M.C.T.; Sarkis, J.E.S.; Pestana, R.C.B.; Tavares, A.R.; Melo-de-Pinna, G.F.A. Characterization of Tibouchina granulosa (Desr.) Cong. (Melastomataceae) as a biomonitor of air pollution and quantification of particulate matter adsorbed by leaves. Ecol. Eng. 2013, 61, 316–327. [Google Scholar] [CrossRef]
  14. Esposito, M.P.; Domingos, M. Establishing the redox potential of Tibouchina pulchra (Cham.) Cogn., a native tree species from the Atlantic Rainforest in the vicinity of an oil refinery in SE Brazil. Environ. Sci. Pollut. Res. Int. 2014, 21, 5484–5495. [Google Scholar] [CrossRef] [PubMed]
  15. Esposito, M.P.; Pedroso, A.N.V.; Domingos, M. Assessing redox potential of a native tree from the Brazilian Atlantic Rainforest: A successful evaluation of oxidative stress associated to a new power generation source of an oil refinery. Sci. Total Environ. 2016, 550, 861–870. [Google Scholar] [CrossRef] [PubMed]
  16. Pedroso, A.N.V.; Bussotti, F.; Papini, A.; Tani, C.; Domingos, M. Pollution emissions from a petrochemical complex and other environmental stressors induce structural and ultrastructural damage in leaves of a biosensor tree species from the Atlantic Rain Forest. Ecol. Indic. 2016, 67, 215–226. [Google Scholar] [CrossRef] [Green Version]
  17. Brito, V.L.; Weynans, K.; Sazima, M.; Lunau, K. Trees as huge flowers and flowers as oversized floral guides: The role of floral colour change and retention of old flowers in Tibouchina pulchra. Front. Plant Sci. 2015, 6, 1–6. [Google Scholar] [CrossRef] [PubMed]
  18. Jiménez, N.; Carrillo-Hormaza, L.; Pujol, A.; Álzate, F.; Osorio, E.; Lara-Guzman, O. Antioxidant capacity and phenolic content of commonly used anti-inflammatory medicinal plants in Colombia. Ind. Crops Prod. 2015, 70, 272–279. [Google Scholar] [CrossRef]
  19. Dias, Ê.R.; Dias, T.L.M.F.; Alexandre-Moreira, M.S.; Branco, A. Antinociceptive activity of Tibouchina pereirae, an endemic plant from the Brazilian semiarid region. Z Naturforsch C. 2016, 71, 261–265. [Google Scholar] [CrossRef] [PubMed]
  20. Tracanna, M.I.; Fortuna, A.M.; Contreras Cárdenas, A.V.; Marr, A.K.; McMaster, W.R.; Gõmez-Velasco, A.; Sánchez Arreola, E.; Hernández, L.R.; Bach, H. Anti-Leishmanial, anti-inflammatory and antimicrobial activities of phenolic derivatives from Tibouchina paratropica. Phytother. Res. 2015, 29, 393–397. [Google Scholar] [CrossRef] [PubMed]
  21. Dos Santos, F.M.; de Souza, M.G.; Crotti, A.E.M.; Martins, C.H.G.; Ambrósio, S.R.; Veneziani, R.C.S.; Silva, M.L.A.; Cunha, W.R. Evaluation of antimicrobial activity of extracts of Tibouchina candolleana (melastomataceae), isolated compounds and semi-synthetic derivatives against endodontic bacteria. Braz. J Microbiol. 2012, 43, 793–799. [Google Scholar] [CrossRef]
  22. Niño, J.; Espinal, C.M.; Mosquera, O.M.; Correa, Y.M. Antimycotic activity of 20 plants from Colombian flora. Pharm. Biol. 2003, 41, 491–496. [Google Scholar] [CrossRef]
  23. Kuster, R.M.; Arnold, N.; Wessjohann, L. Anti-fungal flavonoids from Tibouchina grandifolia. Biochem. Syst. Ecol. 2009, 37, 63–65. [Google Scholar] [CrossRef]
  24. Singha, U.K.; Guru, P.Y.; Sen, A.B.; Tandon, J.S. Antileishmanial activity of traditional plants against Leishmania donovani in Golden hamsters. Int. J. Pharmacogn. 1992, 30, 289–295. [Google Scholar] [CrossRef]
  25. Cunha, W.R.; dos Santos, F.M.; Peixoto, J.; Veneziani, E.C.S.; Crotti, A.E.M.; Silva, M.L.A.; da Silva Filho, A.A.; Albuquerque, S.; Turatti, I.C.C.; Nastos, J.K. Screening of plant extracts from the Brazilian Cerrado for their in vitro trypanocidal activity. Pharm. Biol. 2009, 47, 744–749. [Google Scholar] [CrossRef] [Green Version]
  26. Jones, E.; Ekundayo, O.; Kingston, D.G.I. Plant anticancer agents. XI. 2, 6-Dimethoxybenzoquinone as a cytotoxic constituent of Tibouchina pulchra. J. Nat. Prod. 1981, 44, 493–494. [Google Scholar] [CrossRef]
  27. Terahara, N.; Suzuki, H.; Toki, K.; Kuwano, H.; Saito, N.; Honda, T.J. A diacylated anthocyanin from Tibouchina urvilleana flowers. J. Nat. Prod. 1993, 56, 335–340. [Google Scholar] [CrossRef]
  28. Pérez-Castorena, A.L. Triterpenes and other metabolites from Tibouchina urvilleana. J. Mex. Chem. Soc. 2014, 58, 218–222. [Google Scholar] [CrossRef]
  29. Hendra, R.; Keller, P.A. Flowers in Australia: Phytochemical Studies on the Illawarra Flame Tree and Alstonville. Aust. J. Chem. 2016, 69, 925–927. [Google Scholar] [CrossRef]
  30. Colorado, A.; Maya, D.C.; Díaz, G.S.J.; Isaza, M.J.H.; Tapias, I.L.J.; Veloza, L.A.; Ramírez, A.L.S. Flavonoides del extracto isopropanol- agua de Tibouchina ciliaris. Scientia Técnica 2007, 3, 355–357. [Google Scholar] [CrossRef]
  31. Bobbio, F.O.; Bobbio, P.A.; Degáspari, C.H. Anthocyanins from Tibouchina grandiflora. Food Chem. 1985, 18, 153–159. [Google Scholar] [CrossRef]
  32. Okumura, F.; Soares, M.; Barbosa, H.F.; Cavalheiro, E.T.G. Identificação de pigmentos naturais de espécies vegetais utilizando-se cromatografia em papel. Quim. Nova. 2002, 25, 680–683. [Google Scholar] [CrossRef] [Green Version]
  33. Sobrinho, A.P.; Minho, A.S.; Ferreira, L.L.; Martins, G.R.; Boylan, F.; Fernandes, P.D. Characterization of anti-inflammatory effect and possible mechanism of action of Tibouchina granulosa. J. Pharm. Pharmacol. 2017, 69, 706–713. [Google Scholar] [CrossRef] [PubMed]
  34. Yoshida, T.; Amakura, Y.; Yokura, N.; Ito, H.; Isaza, J.H.; Ramírez, S.; Pelaez, D.P.; Renner, S.S. Oligomeric hydrolyzable tannins from Tibouchina multiflora. Phytochemistry 1999, 52, 1661–1666. [Google Scholar] [CrossRef]
  35. Dias, E.R. Phytochemical study and evaluation of the biological activity of Tibouchina pereirae Aubl. (Melastomataceae). Master’s Thesis, Satate University of Feira de Santana, Bahia, Brazil, 30 October 2013. [Google Scholar]
  36. Motta, L.B.; Kraus, J.E.; Salatino, A.; Salatino, M.L.F. Distribution of metabolites in galled and non-galled foliar tissues of Tibouchina pulchra. Biochem. Syst. Ecol. 2012, 33, 971–981. [Google Scholar] [CrossRef]
  37. Sirat, H.M.; Rezali, M.F.; Ujang, Z. Isolation and identification of radical scavenging and tyrosinase inhibition of polyphenols from Tibouchina semidecandra L. J. Agric. Food Chem. 2010, 58, 10404–10409. [Google Scholar] [CrossRef] [PubMed]
  38. Yoshida, T.; Ohbayashi, H.; Ishihara, K.; Ohwashi, W.; Haba, K.; Okano, Y.; Shingu, T.; Okuda, T. Tannins and related polyphenols of Melastomataceous plants I. Hydrolyzable tannins from Tibouchina semidecandra Cogn. Chem. Pharm. Bull. 1991, 39, 2233–2240. [Google Scholar] [CrossRef]
  39. Harbone, J.B. Plant Polyphenols- XI. The structure of acylated anthocyanins. Phytochemistry 1964, 3, 151–160. [Google Scholar] [CrossRef]
  40. Lowry, J.B. Anthocyanins of the Melastomataceae, Myrtaceae and some allied families. Pytochemistry 1976, 15, 513–516. [Google Scholar] [CrossRef]
  41. Cuyckens, F.; Claeys, M. Mass spectrometry in the structural analysis of flavonoids. J. Mass Spectrom. 2004, 39, 1–15. [Google Scholar] [CrossRef] [PubMed]
  42. Markham, K.R. Techniques of Flavonoid Identification; Academic Press: London, UK, 1982; ISBN 0-12-472680-1. [Google Scholar]
  43. Iwashina, T. The structure and distribution of the flavonoids in plants. J. Plant Res. 2000, 113, 287–299. [Google Scholar] [CrossRef]
  44. Ducrey, B.; Wolfender, J.L.; Marston, A.; Hostettmann, K. Analysis of flavonol glycosides of thirteen Epilobium species (Onagraceae) by LC–UV and thermospray LC-MS. Phytochemistry 1995, 38, 129–137. [Google Scholar] [CrossRef]
  45. Mahmoud, I.I.; Marzouk, M.S.A.; Moharram, F.A.; El-Gindi, M.R.; Hassan, A.M.K. Acylated flavonol glycosides from Eugenia jambolana leaves. Phytochemistry 2001, 58, 1239–1244. [Google Scholar] [CrossRef]
  46. Tamura, H.; Hayashi, Y.; Sugisawa, H.; Kondo, T. Structure determination of acylated anthocyanins in muscat baily A grapes by homonuclear Hartmann–Hahn (HOHAHA) spectroscopy and liquid chromatography–mass spectrometry. Phytochem. Anal. 1994, 5, 190–196. [Google Scholar] [CrossRef]
  47. Wang, H.; Race, E.J.; Shrikhande, J. Characterization of anthocyanins in grape juices by ion trap liquid chromatography–Mass Spectrometry. J. Agric. Food Chem. 2003, 51, 1839–1844. [Google Scholar] [CrossRef] [PubMed]
  48. Atoui, A.K.; Mansouri, A.; Boskou, G.; Kefalas, P. Tea and herbal infusions: Their antioxidant activity and phenolic profile. Food Chem. 2005, 89, 27–36. [Google Scholar] [CrossRef]
  49. Ferrer, J.-L.; Austin, M.B.; Stewart, C.; Noel, J.P. Structure and function of enzymes involved in the biosynthesis of phenylpropanoids. Plant Physiol. Biochem. 2008, 46, 356–370. [Google Scholar] [CrossRef] [PubMed] [Green Version]
  50. Khoo, H.E.; Azlan, A.; Tang, S.T.; Lim, S.M. Anthocyanidins and anthocyanins: Colored pigments as food, pharmaceutical ingredients, and the potential health benefits. Food Nutr. Res. 2017, 61, 1–21. [Google Scholar] [CrossRef]
  51. Agrawal, P.K. Carbon-13 NMR of Flavonoids; Elsevier: Amsterdam, The Netherlands, 1989; ISBN 0-444-87449-6. [Google Scholar]
  52. Riaz, A.; Rasul, A.; Hussain, G.; Zahoor, M.K.; Jabeen, F.; Subhani, Z.; Younis, T.; Ali, M.; Sarfraz, I.; Selamoglu, Z. Astragalin: A Bioactive Phytochemical with Potential Therapeutic Activities. Adv. Pharmacol. Sci. 2018, 2018, 1–15. [Google Scholar] [CrossRef]
  53. Strack, D. Phenolic Metabolism. In Plant Biochemistry, 3nd ed.; Dey, P.M., Harbone, J.B., Eds.; Academic Press: San Diego, CA, USA, 1997; pp. 386–416. ISBN 0-12-214674-3. [Google Scholar]
  54. Scheer, T.; Wichtl, M. Zum Vorkommen von Kämpferol-4′-O-β-D-glucopyranosid in Filipendula ulmaria und Allium cepa1. Planta Med. 1987, 53, 573–574. [Google Scholar] [CrossRef]
  55. Willians, C.A.; Grayer, R.J. Anthocyanins and other flavonoids. Nat. Prod. Rep. 2004, 21, 539–573. [Google Scholar] [CrossRef]
  56. Haslam, E. Vegetable tannins—lessons of a phytochemical lifetime. Phytochemistry 2007, 68, 2713–2721. [Google Scholar] [CrossRef]
  57. Serna, D.M.O.; Martínez, J.H.I. Phenolics and polyphenolics from Melastomataceae species. Molecules 2015, 20, 17818–17847. [Google Scholar] [CrossRef]
  58. Rodrigues, J.; Rinaldo, D.; dos Santos, L.C.; Vilegas, W. An unusual linked flavonoid from Miconia cabucu (Melastomataceae). Phytochemistry 2007, 68, 1781–1784. [Google Scholar] [CrossRef] [PubMed]
  59. Wei, Y.; Xie, Q.; Fisher, D.; Sutherland, I.A. Separation of patuletin-3-O-glucoside, astragalin, quercetin, kaempferol and isorhamnetin from Flaveria bidentis (L.) Kuntze by elution-pump-out high-performance counter-current chromatography. J. Chromatogr. A 2011, 1218, 6206–6211. [Google Scholar] [CrossRef] [PubMed]
  60. Jung, H.A.; Kim, J.E.; Chung, H.Y.; Choi, J.S. Antioxidant principles of Nelumbo nucifera stamens. Arch. Pharmacal. Res. 2003, 26, 279–285. [Google Scholar] [CrossRef]
  61. Lavault, M.; Richomme, P. Constituents of Helichrysum stoechas variety olonnense. Chem. Nat. Compd. 2004, 40, 118–121. [Google Scholar] [CrossRef]
  62. Nikaido, T.; Ohmoto, T.; Sankawa, U. Inhibitors of adenosine 3’, 5’-cyclic monophosphate phosphodiesterase in Daphne genkwa Sieb. et Zucc. Chem. Pharm. Bull. 1987, 35, 675–681. [Google Scholar] [CrossRef] [PubMed]
  63. Guo, D.; Xue, W.J.; Zou, G.A.; Aisa, H.A. Chemical Composition of Alhagi sparsifolia Flowers. Chem. Nat. Compd. 2016, 52, 1095–1097. [Google Scholar] [CrossRef]
  64. Wahab, A.; Begum, S.; Ayub, A.; Mahmood, I.; Mahmood, T.; Ahmad, A.; Fayyaz, N. Luteolin and kaempferol from Cassia alata, antimicrobial and antioxidant activity of its methanolic extracts. FUUAST J. Biol. 2014, 4, 1–5. [Google Scholar] [CrossRef]
Sample Availability: Samples of freeze-dried petals and few amounts of compounds 17, 23, 25, 27 and 29 are available from the authors.
Figure 1. Chromatogram obtained by UPLC-PDA-ESI-QTOF-MS from T. pulchra petals extracted with acidified methanol. Chromatographic separation was performed with a column Waters Acquity UPLC C18 (1.7 µm, 100 × 2.1 mm) at a flow rate of 0.3 mL min−1, using 4 µL of injection volume, column temperature of 45°C and a solvent system composing 1% formic acid in water (A) and 1% formic acid in acetonitrile (B). Gradient elution were as follow: 5 to 25% of B (0–40 min), 25 to 100% of B (40–42 min), 100% of B (42.0–42.5 min), 100 to 5% of B (42.5–43.0 min) and 5% of B (43–46 min). MS scans were performed in positive ion mode (MS+) in the range m/z 75−1,250, and in the following conditions: capillary voltage set to 4,500 V, end plate offset at −500 V, nebulizer at 2 Bar, dry gas at 12 L min−1 and dry gas temperature at 200°C. MS was calibrated using sodium formate. All data were processed using Data analysis software 4.2 (Bruker). Numbers correspond to the identification presented in Table 2.
Molecules 24 00718 g001
Figure 2. Spectrometric analyses of mixture 17. (a) Principal HMBC correlations of kaempferol-(2′′-O-methyl)-4′-O-α-d-glucopyranoside. (b) Mass Spectrum and main fragmentation.
Molecules 24 00718 g002
Table 1. Natural products reported for Tibouchina species.
SpeciesMetabolite SubclassCompoundPlant MaterialReference
T. candolleana Cogn.flavone/isoflavoid/steroid/triterpeneluteolin/genistein/β- sitosterol/α- and β-amyrin, oleanolic and ursolic acidsaerial parts[21]
T. ciliaris
(Vent.) Cogn.
flavonolkaempferol 7-O-p-coumaroyl, quercetin 3-O-rhamnopyranoside, quercetin 3-O-arabnosideleaves[30]
T. grandiflora Cogn.anthocyanin/flavonolpeonidin 3-sophoroside, peonidin 3-sambubioside, malvidin 3,5-diglucoside, malvidin 3-(p-coumaroyl)-sambubioside-5-glucoside/quercetin 3-O-β-d-glucuronide, quercetin 3-O-β-d-glucopyranoside, quercetin 3-O-β-d-galactopyranoside, quercetin 3-O-α-l-rhamnopyranoside, quercetin 3-O-β-l-arabinopyranoside, quercetin 3-O-β-d-(6″-p-coumaroyl)-glucopyranosideleaves/flowers[23,31]
T. granulosa
(Desr.) Cogn.
anthocyanin/flavone/flavonol/proanthocyanidinpetunidin, pelargonidin/hispidulin 7-O-glucoside/isorhamnetin 3-O-glucuronide, isorhamnetin 3-O-diglucoside, isorhamnetin 3-O-rutinoside, quercetin 3-(O-galloyl)-hexoside/β-type procyanidin monomer, dimer, trimer and pentamerflowers/leaves[32,33]
T. lepidota
(Bonpl.) Baill.
anthocyanin/flavonol/phenolic acidmalvidin 3-(p-coumaryl-glucoside)-5-(acetyl-xyloside)/quercetin 3-O-arabnoside, quercetin, quercetin 3-glucoside, isorhamnetin 3-rutinoside/gallic acid, 2,3,5-trihydroxybenzoic acidflowers[29]
T. multiflora
Cogn.
tanninnobotanins O and Pleaves[34]
T. paratropica
(Grised.) Cogn.
flavonol/phenolic derivativeisoquercitrin/2,8-dihydroxy-7H-furo (2,3-f)-chromen-7-oneaerial parts[20]
T. pereirae
Brade & Markgr.
flavonolisorhamnetin 3-O-galloyl-glucoside, isorhamnetin-3-O-glucoside, kaempferol 3-O-rutinoside, quercetin 3-O-(galloyl)-glucoside, rutinaerial parts[35]
T. pulchra
(Cham.) Cogn.
flavone/flavonol/phenolic acidluteolin/kaempferol 3-O-galactoside, kaempferol 3-O-glucoside, myricetin 3-O-galactoside, myricetin 3-O-glucoside, quercetin, myricetin, kaempferol/gallic acidleaves[10,36]
T. semidecantra
(Mart & Schrank ex DC.) Cogn.
anthocyanin/flavonol/proanthocyanidin/tanninmalvidin 3-(p-coumaroylglucoside)-5-glucoside/quercetin, myricetin, quercetin 3-O-(6″-O-galloyl) galactoside, quercetin 3-O-α-l-(2″-O-acetyl) arabinofuranoside, quercetin 3-O-arabnoside, quercetin 3-O-rhamnopyranoside/leucodelphinidin, leucocyanidin/1,2,6-tri-O-galloyl-β-d-glucose, 1,4,6-tri-O-galloyl-β-d-glucoside, 1,2,3,6-tetra-O-galloyl-β-d-glucoside, nobotanin A, B, C, D, E and F, casuarictin, pedunculagin, praecoxin A and B, casuarinin, 2,3-O-(S)-hexahydroxydiphenoyl-d-glucopyranoside, castalagin, vescalagin, 1-O-methylvescalaginnobotanins A, B, F, 3,3′-O-dimethyl ellagic acid 4-O-α-l-rhamnopyranosideaerial parts [37,38,39,40]
T. urvilleana
(DC.) Cong.
anthocyanin/flavone/flavonol/steroid/triterpenemalvidin 3-O-(6-O-p-coumaryl-β-d-glucopyranoside)- 5-O-(2-O-acetyl-β-d-xylopyranosyl)/hispidulin 7-O-β-d-glucopyranoside/quercetin 3-O-arabinoside/β- sitosterol/α- and β-amyrin, glutinol, taraxerol, oleanolic and ursolic acidsaerial parts [27,28]
Table 2. Chromatographic and spectrometric data (UPLC-PAD-ESI-QTOF-MS) of phenolic constituents from T. pulchra petal extracts (acidified methanol).
CompoundRT 1 (min)UV/VIS (nm)Mass Spectrum MS/MSSuggestion
100.97278L.Q. 3Phenolic acid
201.13278, (sh 2) 308L.Q.Cinnamic acid derivative
301.55278L.Q.Phenolic acid
401.76278L.Q.Phenolic acid
502.95278, (sh) 308L.Q.Cinnamic acid derivative
603.65278L.Q.Phenolic acid
712.69270453.0083 [M + H]+, 303.0134 [M − 150]+N.I. 4
814.05268, 294 (sh), 354481.0967 [M + H]+, 319.0446 [M − 162]+Myricetin galactoside
914.70268, 294 (sh), 354481.0964 [M + H]+, 319.0445 [M − 162]+Myricetin glucoside
1016.33269, 290 (sh), 354639.0946 [M+Na]+, 617.1121 [M + H]+, 303.0498 [M − 314]+Quercetin galloylhexoside
1118.25269, 290 (sh), 355465.1020 [M + H]+, 303.0499 [M − 162]+Quercetin hexoside
1218.89269, 290 (sh), 355479.0804 [M + H]+, 303.0493 [M − 176]+Quercetin glucuronide
1319.36266,290,350601.1183 [M + H]+, 287.0552 [M − 314]+Kaempferol galloylhexoside
1419.95270453.0083 [M + H]+, 303.0134 [M − 150]+N.I.
1521.42266, 346471.0894 [M + Na]+, 449.1073 [M + H]+, 287.0549 [M − 162]+Kaempferol hexoside
1622.00266,290,350601.1184 [M + H]+, 287.0551 [M − 314]+Kaempferol galloylhexoside
1723.18266, 348449.1079 [M + H]+, 287.0551 [M − 162]+/463.0865 [M + H]+, 287.0551 [M − 176]+Mixture: Kaempferol 3-O-β-d-glucopyranoside (Astragalin)/Kaempferol-(2″-O-methyl)-4′-O-α-d-glucopyranoside
1823.93266, 355441.0790 [M + Na]+, 419.0971 [M + H]+, 287.0551 [M − 132]+Kaempferol pentoside
1924.81266,290,350623.1000 [M + Na]+, 601.117 [M + H]+, 287.0547 [M − 314]+Kaempferol galloylhexoside
2025.98266, 355441.0785 [M + Na]+, 419.0959 [M + H]+, 287.0545 [M − 132]+Kaempferol pentoside
2127.87268, 314595.1445 [M + H]+, 287.0551 [M − 308]+Kaempferol p-coumaroylhexoside
2228.24282, 305(sh), 530799.2077 [M + H]+, 625.1552 {M − 174]+, 491.1176 [M − 308]+, 317.0655 [M − 482]+Petunidin p-coumaroylhexoside acetylpentoside
2329.04268, 320, 530499.0839 [M + Na]+, 477.1031 [M + H]+, 287.0547 [M − 190]+/771.2138 [M + H]+, 317.0665 [M − 454]+Mixture- Kaempferol 3-O-glucuronide-6″-O-methylester/Petunidin derivative
2430.82282, 310(sh), 534813.2243 [M + H]+, 639.1716 [M − 174]+, 505.1336 [M − 308]+, 331.0812 [M − 482]+Malvidin p-coumaroylhexoside acetylpentoside
2532.68271, 312633.1203 [M + Na]+, 611.1393 [M + H]+, 303.0496 [M − 308]+Quercetin 3-O-(6″-O-p-coumaroyl)-β-d-glucopyranoside (Helichrysoside)
2634.78266, 349593.0892 [M + H]+, 285.0603 [M − 308]+N.I.
2735.27268, 314617.1258 [M + Na]+, 595.1437 [M + H]+, 287.0546 [M − 308]+Kaempferol 3-O-(6″-O-p-coumaroyl)-β-d-glucopyranoside (Tiliroside)
2836.17268, 314617.1256 [M + Na]+, 595.1418 [M + H]+, 287.0545 [M − 308]+Kaempferol p-coumaroylhexoside
2937.48270, 368287.0546 [M + H]+Kaempferol
3037.98268, 314617.1248 [M + Na]+, 595.1455 [M + H]+, 287.0549 [M − 308]+Kaempferol p-coumaroylhexoside
1 retention time in minutes, 2 shoulder, 3 low quality spectrum, 4 not identified. Numbers highlighted in bold indicate compounds identified for the first time in T. pulchra.
Table 3. Flavonol structures and substituents groups in T. pulchra flower extracts identified by UPLC-PAD-ESI-QTOF-MS and NMR (only bold compounds).
Molecules 24 00718 i001
CompoundR1R2R3R4
8OHOHOHgalactosyl
9OHOHOHglucosyl
10OHOHHgalloylhexoside
11OHOHHhexosyl
12OHOHHglucuronyl
13HOHHgalloylhexoside
15HOHHhexosyl
16HOHHgalloylhexoside
17HOHH3-O-β-d-glucopyranosyl
17H2″-O-methyl-4′-O-α-d-glucopyranosideHH
18HOHHpentosyl
19HOHHgalloylhexoside
20HOHHpentosyl
21HOHHp-coumaroylhexoside
23HOHH3-O-glucuronide-6″-O-methylester
25OHOHH3-O-(6″-O-p-coumaroyl)-β-d-glucopyranosyl
27HOHH3-O-(6″-O-p-coumaroyl)-β-d-glucopyranosyl
28HOHHp-coumaroylhexoside
29HOHHH
30HOHHp-coumaroylhexoside
* R1, R2, R3 and R4 indicate substituents. In the chemical formula continuous arrow indicates retro Dies–Alder fragmentation, and dotted arrow indicates the usual acyl and glucosyl lost.
Table 4. Anthocyanin structures and substituents groups in T. pulchra flower extracts identified by UPLC-PAD-ESI-QTOF-MS.
Molecules 24 00718 i002
CompoundR1R2R3R4
22OHOCH3p-coumaroylhexosideacetylpentoside
24OCH3OCH3p-coumaroylhexosideacetylpentoside
* R1, R2, R3 and R4 indicate substituents.
Table 5. Chemical formula and NMR data of mixture 17: Astragalin and Kaempferol-(2″-O-methyl)-4′-O-α-D-glucopyranoside.
Molecules 24 00718 i003
AstragalinKaempferol-(2″-O-methyl)-4′-O-α-d-glucopyranoside
Carbon Number1H13CHMBC1H13CHMBC
2-156.62--147.27-
3-133.63--136.10-
4-177.92--176.35-
5-161.65--161.13-
66.22 d (J = 2.0 Hz)99.16C5, C7, C8, C106.21 d (J = 2.0 Hz)98.68C5, C7, C8, C10
7-164.62--164.40-
86.46 sl94.12C4, C6, C7, C9, C106.46 sl93.95C6, C7, C9
9-156.82--156.71-
10-104.45--103.48-
1′-122.33--122.10-
2′,6′8.04 d (J = 8.4 Hz)131.33C2, C4′, C3′ or 5′, C2′ or 6′8.04 d (J = 8.5 Hz)129.95C2, C3′ or 5′, C4′
3′,5′6.89 d (J = 8.4 Hz)115.58C1, C3′ or 5′, C4′6.93 d (J = 8.5 Hz)115.91C1′, C3′ or 5′, C4′
4′-160.44--159.68-
1″5.46 d (J = 7.6 Hz)101.81C3, C5″4.51 d (J = 3.6 Hz)100.12C2″, OMe
2″3.18 m74.67C1″, C3″, C4″3.37 m73.84C3″
3″3.22 m76.88C2″, C4″3.18 m72.44C2″
4″3.09 m70.33C6″, C5″3.29 m73.04C1″
5″3.09 m77.96C6″, C4″3.04 m70.79C6″, C4″
6″3.58 d (J = 11.6 Hz)
3.33 d (J = 11.6 Hz)
61.28C5″, C4″3.62 d (J = 11.7 Hz)
3.44 m
61.42C5″, C4″
2″OMe---3.26 s54.74C1″

