
Isolation of a Halogen-Bonded Complex Formed between Methane and Chlorine Monofluoride and Characterisation by Rotational Spectroscopy and Ab Initio Calculations

 , and
, and
Abstract
1. Introduction
- (1)
- Along the axis of a non-bonding electron (n) pair carried by the acceptor atom Z of B with the order of the atoms Z···δ+H–Xδ- or Z···δ+X–Yδ-, as appropriate, or
- (2)
- Alongthe local symmetry axis of a π- or pseudo-π pair if B carries no n pairs, with the order of the atoms as ⁎···δ+H–Xδ- or ⁎···δ+X–Yδ-, where ⁎ lies on the π-pair axis or
- (3)
- Alongthe axis of a n-pair when B carries both n- and π- electron pairs.
2. Experimental and Theoretical Methods
3. Results
3.1. Determination of Spectroscopic Constants
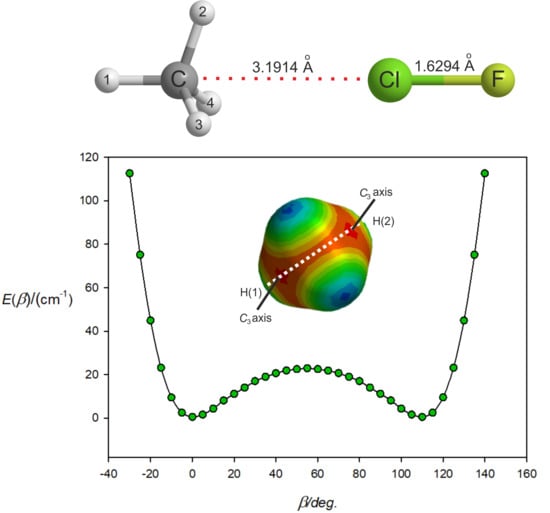
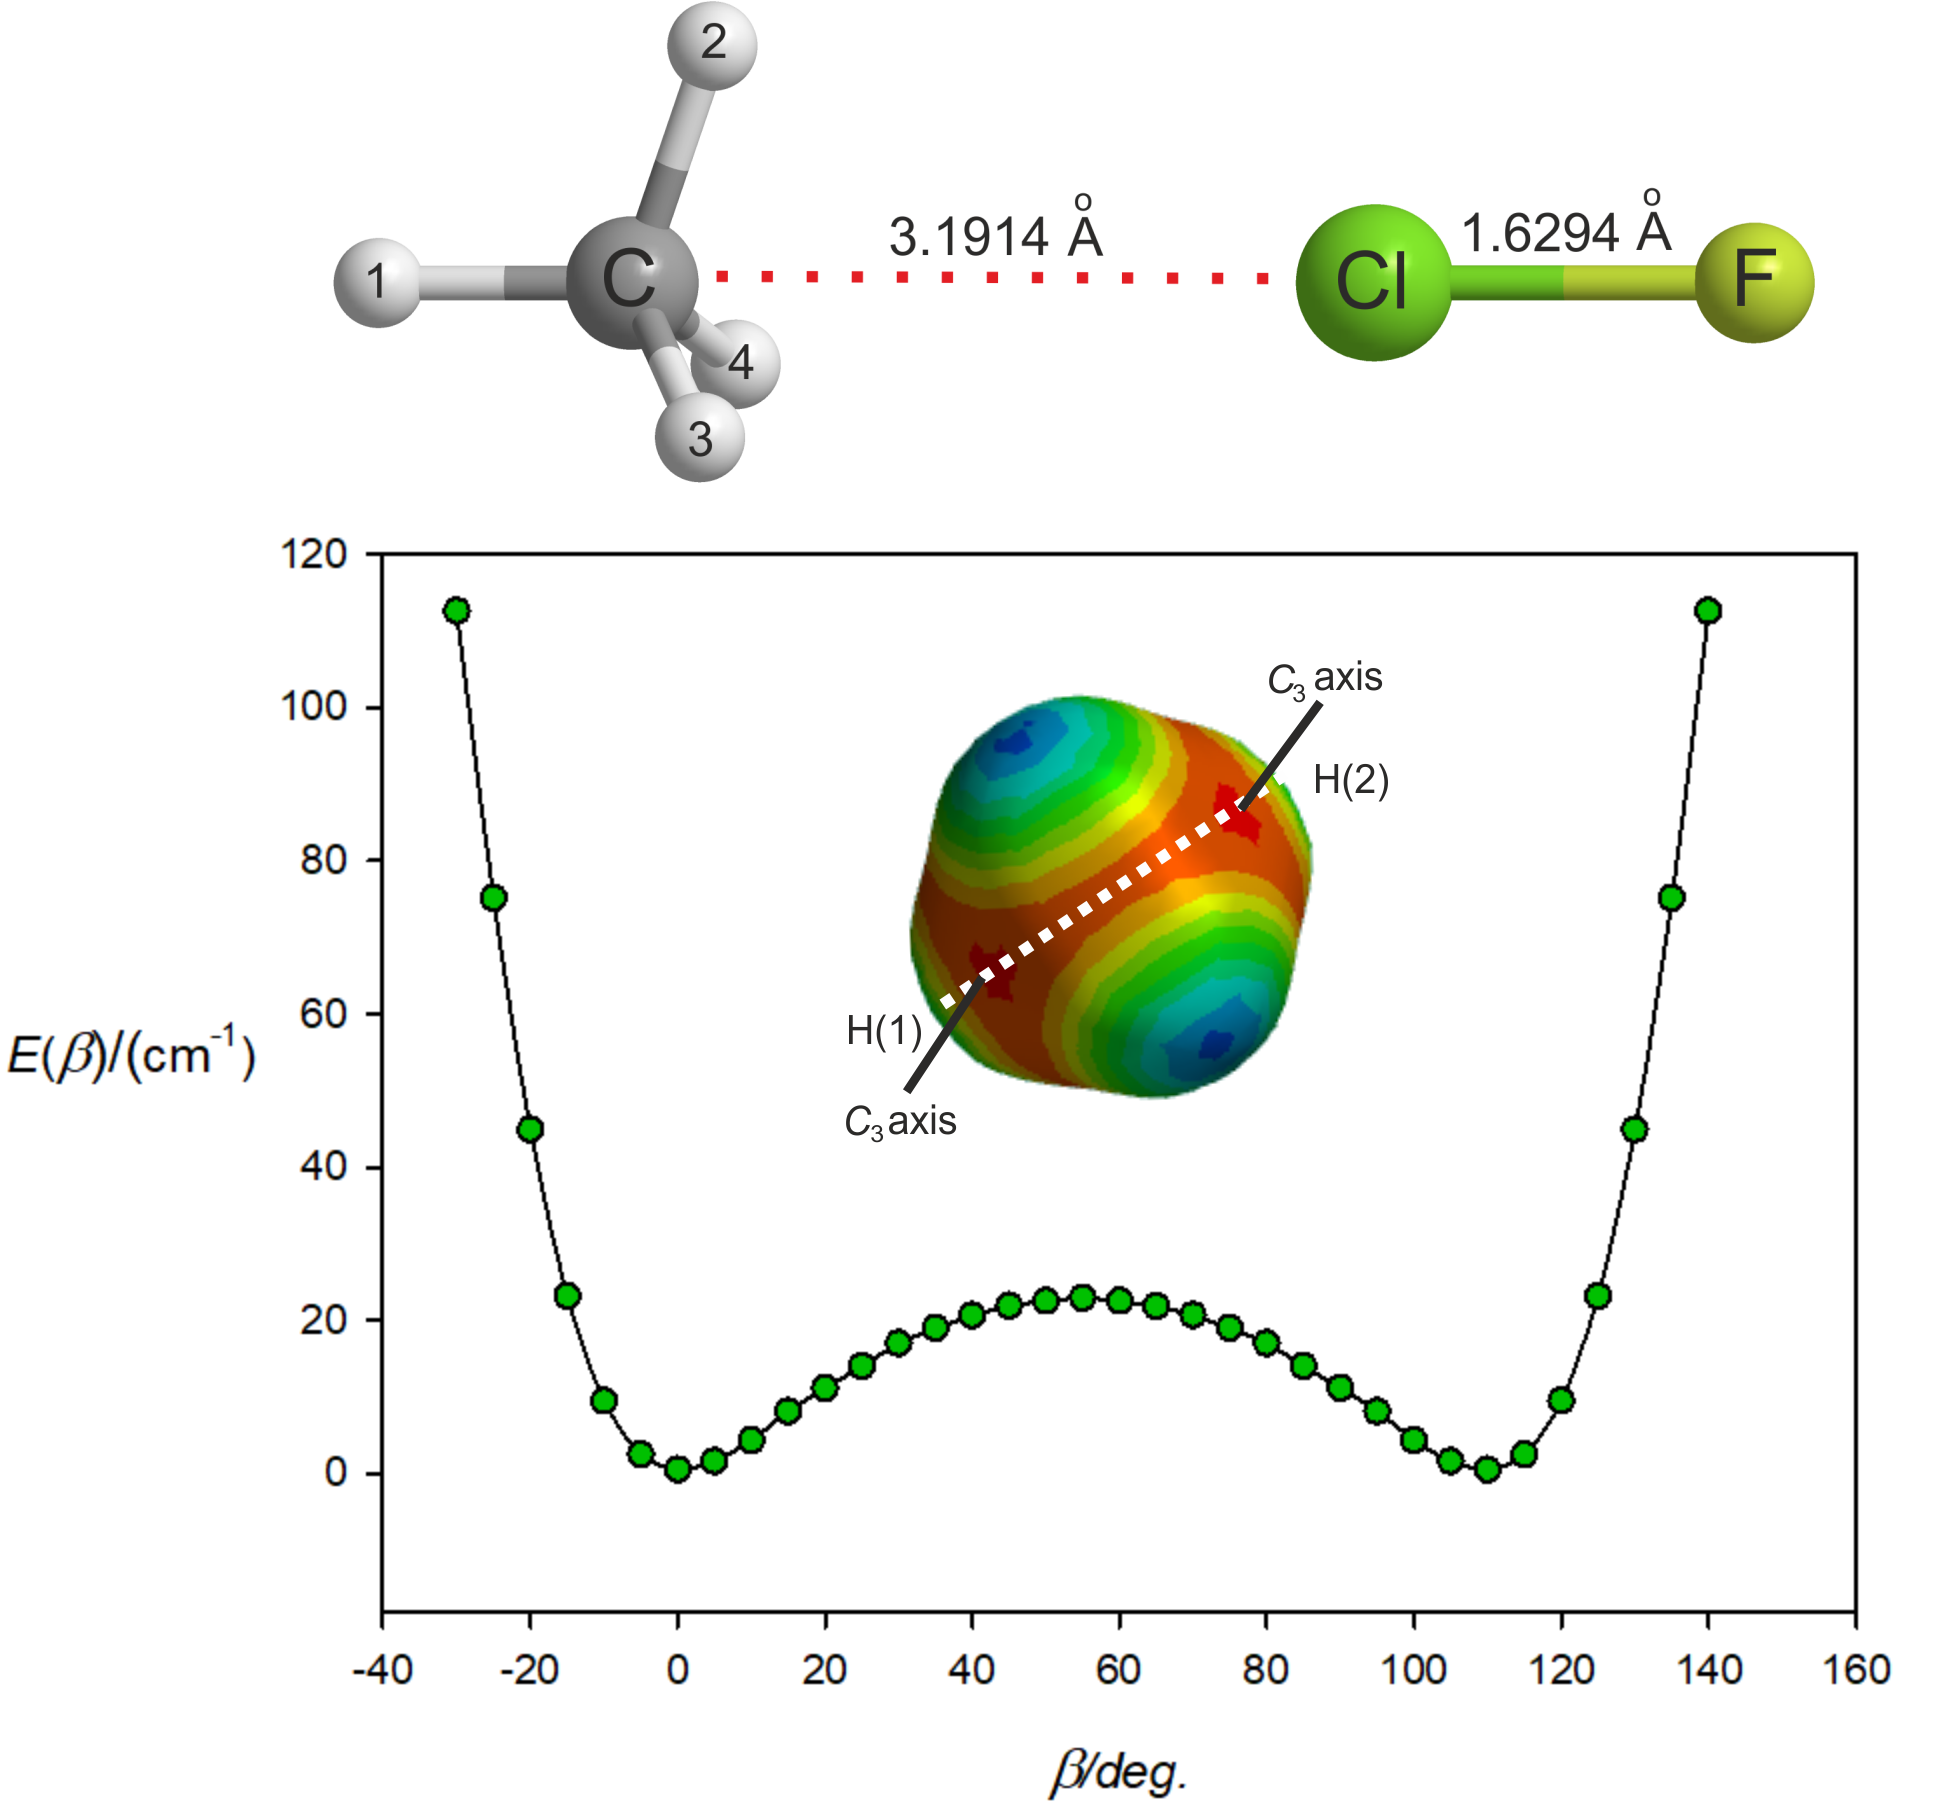
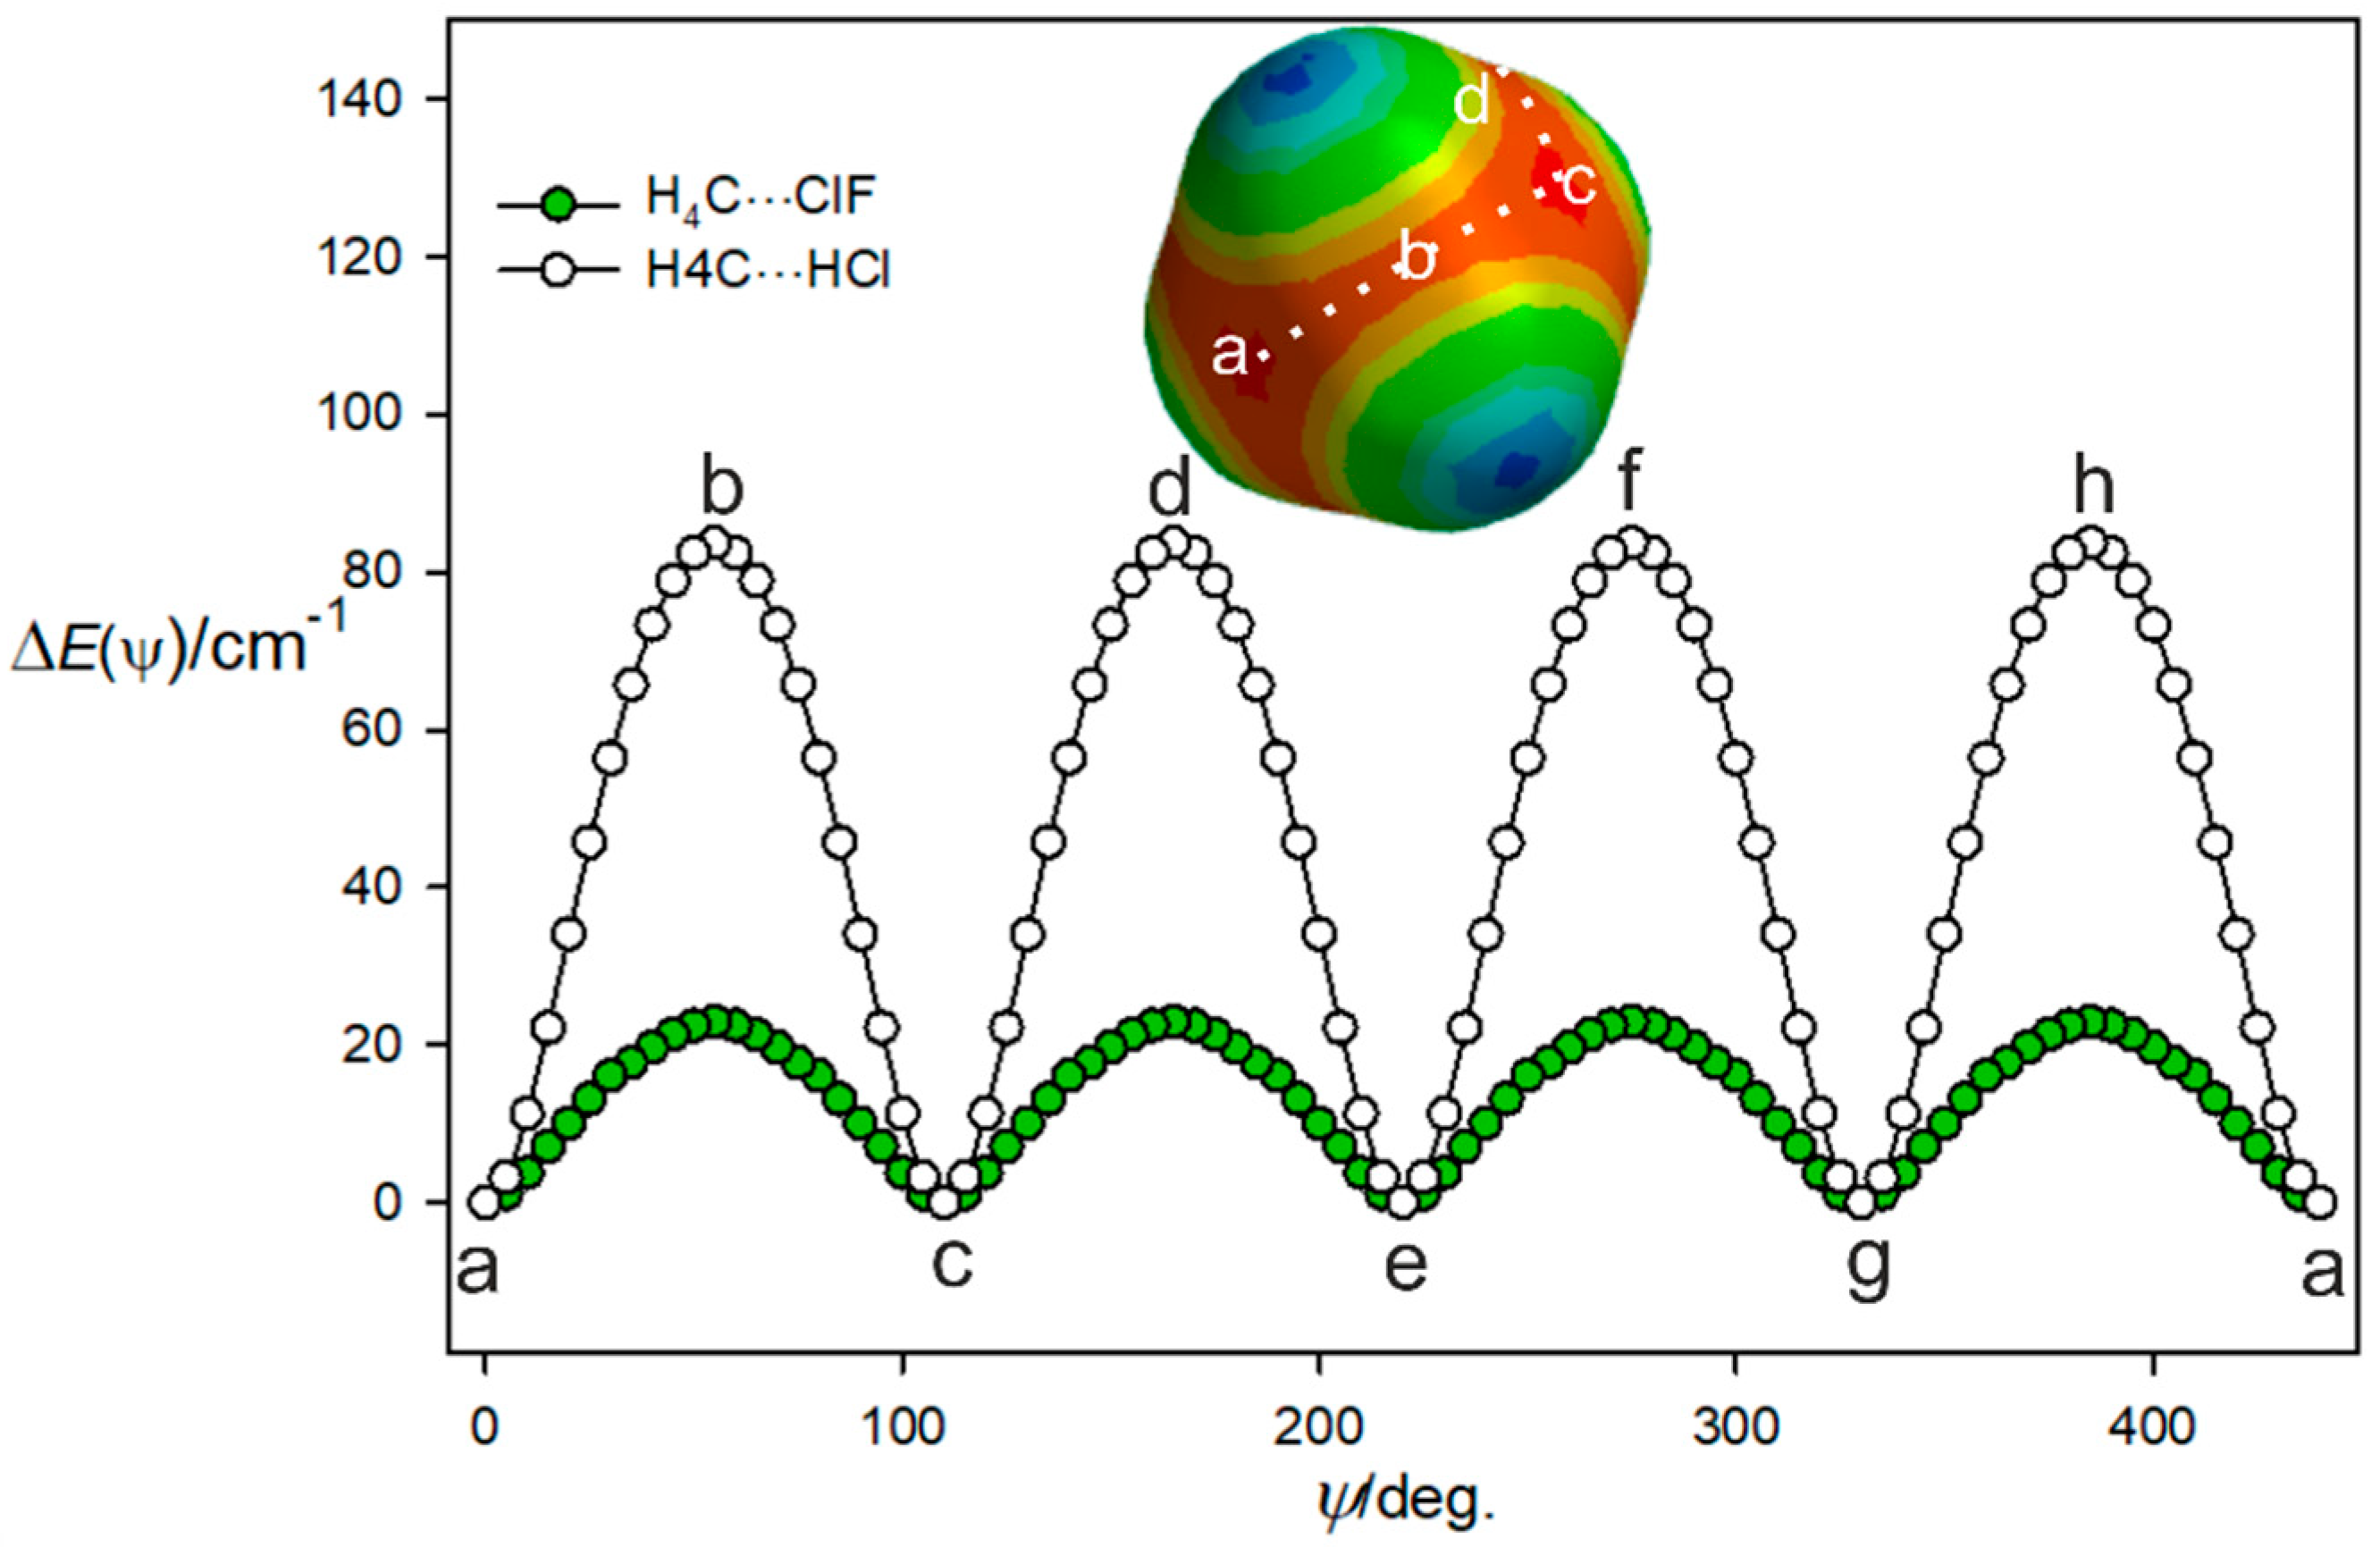
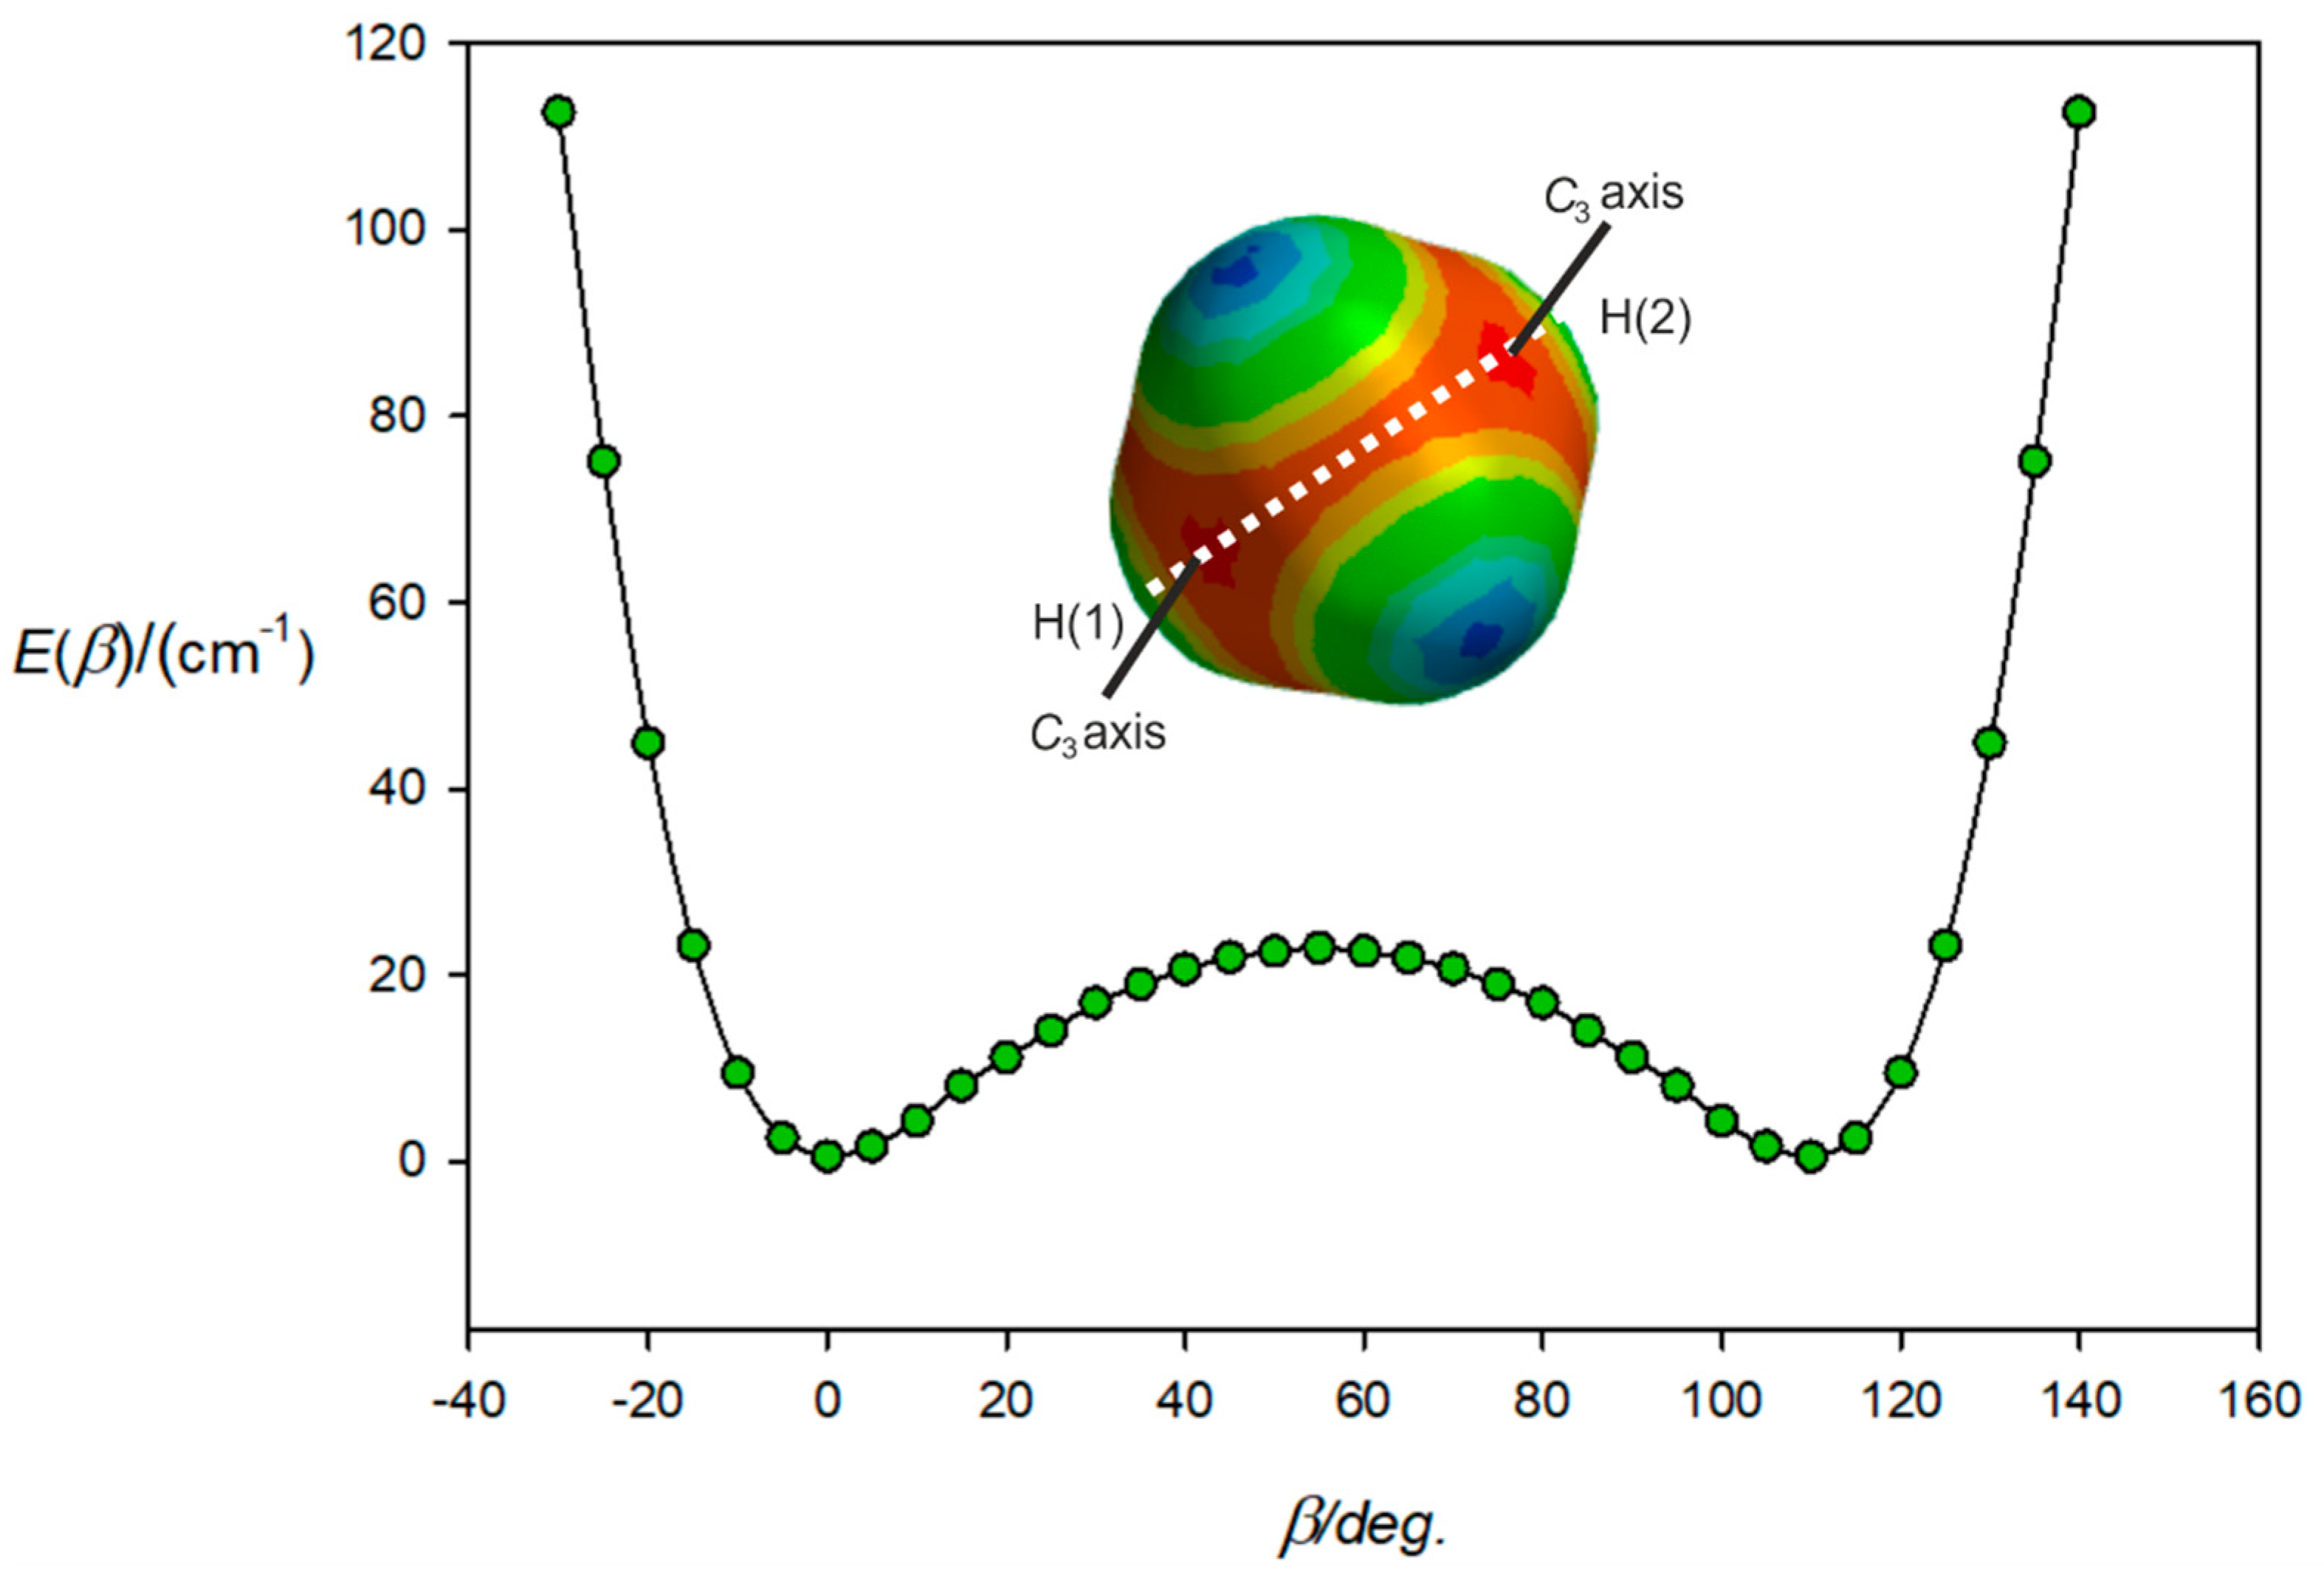
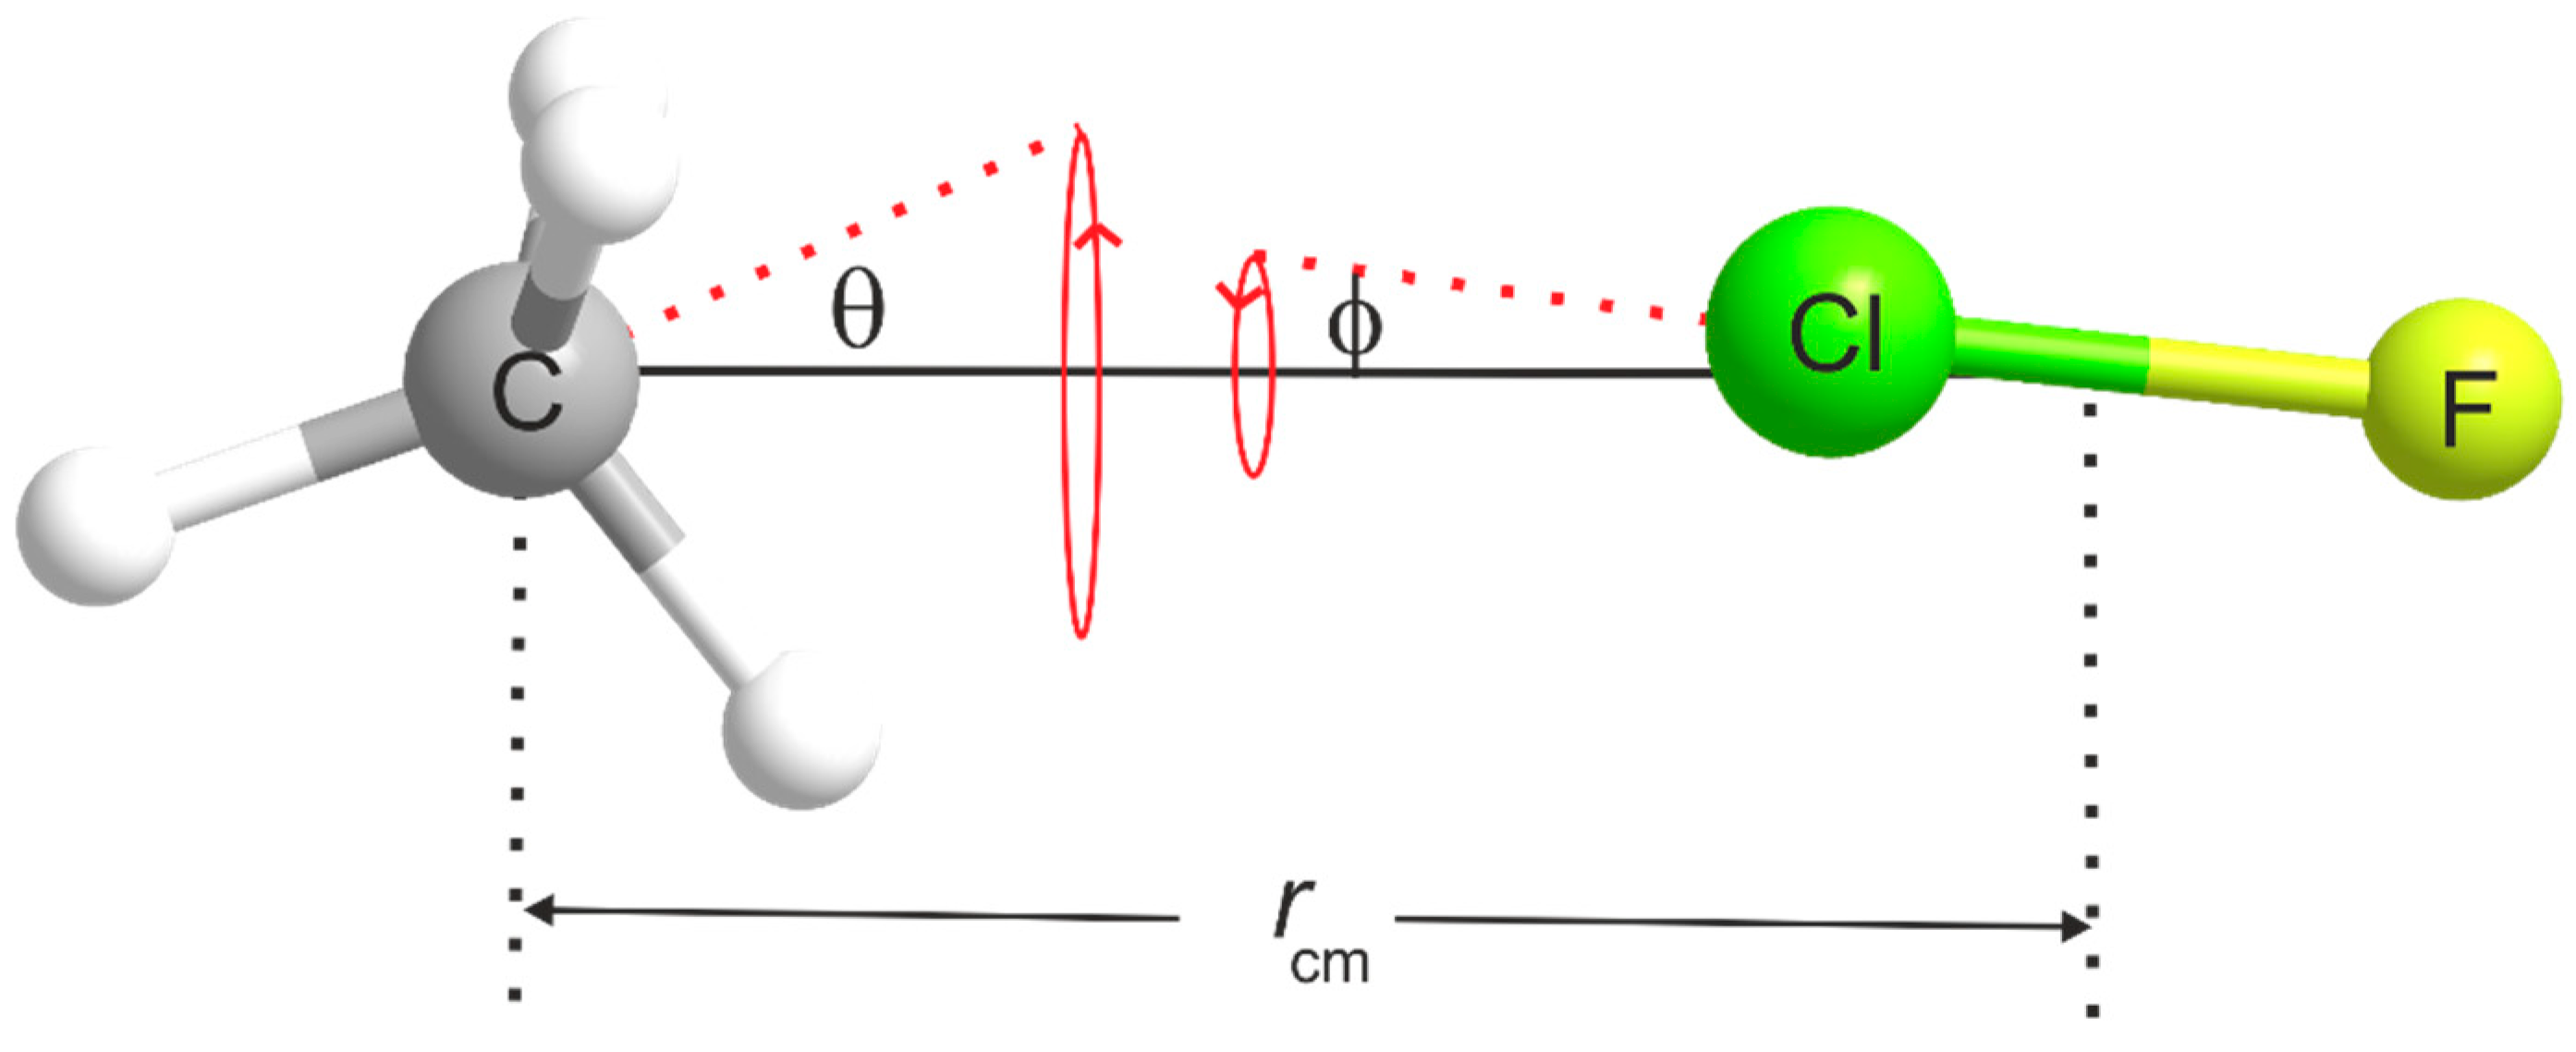
3.2. The Equilibrium Geometry of H4C···ClF and Variation of the Potential Energy Function with Internal Rotation of the CH4 Subunit
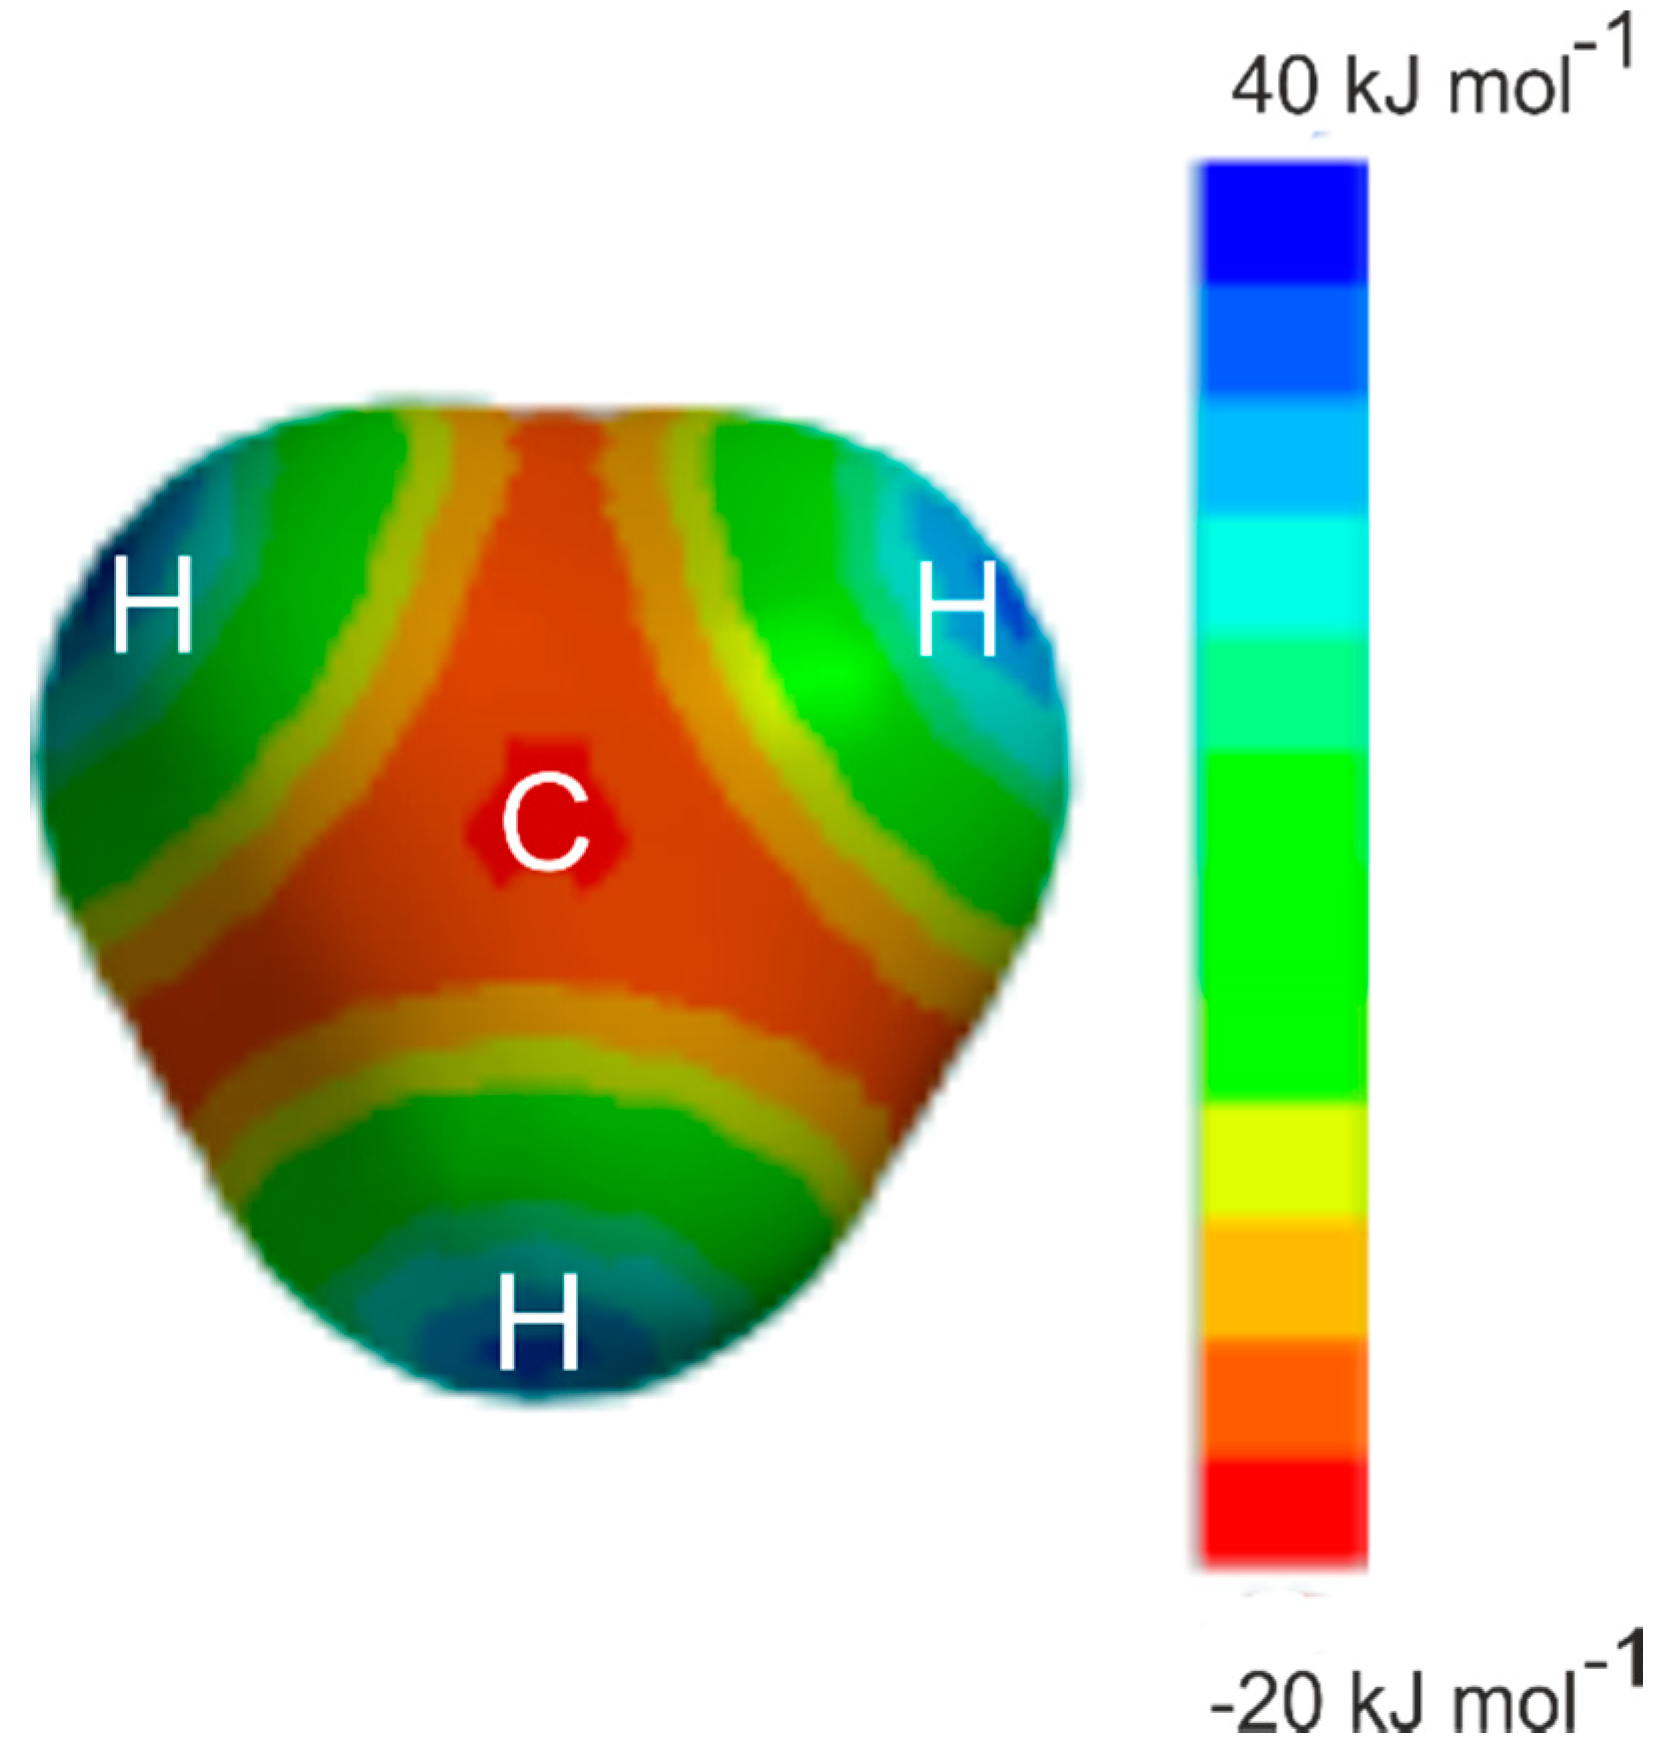
3.3. Interpretation of the Ground-State Spectroscopic Constant of H4C···ClF
4. Conclusions
Supplementary Materials
Author Contributions
Funding
Acknowledgments
Conflicts of Interest
References
- Legon, A.C.; Millen, D.J. Determination of properties of hydrogen-bonded dimers by rotational spectroscopy and a classification of dimer geometries. Faraday Discuss. Chem. Soc. 1982, 73, 71–87. [Google Scholar] [CrossRef]
- Legon, A.C. Pre-reactive complexes of dihalogens XY with Lewis bases B in the gas phase: A systematic case for the ‘halogen’ analogue B⋯XY of the hydrogen bond B⋯HX. Angew. Chem. Int. Ed. Engl. 1999, 38, 2686–2714. [Google Scholar] [CrossRef]
- Legon, A.C.; Aldrich, P.D.; Flygare, W.H. The rotational spectrum and molecular structure of the acetylene⋯HCl dimer. J. Chem. Phys. 1981, 75, 625–630. [Google Scholar] [CrossRef]
- Hinds, K.; Holloway, J.H.; Legon, A.C. Evidence for a pre-reactive intermediate in a gaseous mixture of ethyne and chlorine monofluoride. The rotational spectrum of the Mulliken bπ.aσ* complex C2H2⋯ClF. J. Chem. Soc. Faraday Trans. 1996, 92, 1291–1296. [Google Scholar] [CrossRef]
- Aldrich, P.D.; Legon, A.C.; Flygare, W.H. The rotational spectrum, structure and molecular properties of the ethylene⋯HCl dimer. J. Chem. Phys. 1981, 75, 2126–2134. [Google Scholar] [CrossRef]
- Bloemink, H.I.; Holloway, J.H.; Legon, A.C. Geometry and nature of the binding of the pre-reactive complex C2H4⋯ClF from its rotational spectrum. Chem. Phys. Lett. 1996, 250, 567–575. [Google Scholar] [CrossRef]
- Legon, A.C.; Willoughby, L.C. Detection and characterisation of a weakly bound dimer of allene and hydrogen fluoride by rotational spectroscopy. Chem. Phys. Lett. 1988, 143, 214–220. [Google Scholar] [CrossRef]
- Cooke, S.A.; Holloway, J.H.; Legon, A.C. The rotational spectrum and angular geometry of a pre-reactive complex of allene and chlorine monofluoride. Chem. Phys. Lett. 1997, 266, 61–69. [Google Scholar] [CrossRef]
- Legon, A.C.; Aldrich, P.D.; Flygare, W.H. The rotational spectrum, chlorine nuclear quadrupole coupling constants, and molecular geometry of a hydrogen-bonded dimer of cyclopropane and hydrogen chloride. J. Am. Chem. Soc. 1982, 104, 1486–1490. [Google Scholar] [CrossRef]
- Hinds, K.; Holloway, J.H.; Legon, A.C. A pseudo-π analogue of a Mulliken bπ.aσ* type complex: The rotational spectrum of cyclopropane-chlorine monofluoride. J. Chem. Soc. Faraday Trans. 1997, 93, 373–378. [Google Scholar] [CrossRef]
- Read, W.G.; Campbell, E.J.; Henderson, G. The rotational spectrum and molecular structure of the benzene-hydrogen chloride complex. J. Chem. Phys. 1983, 78, 3501–3506. [Google Scholar] [CrossRef]
- Cooke, S.A.; Evans, C.M.; Holloway, J.H.; Legon, A.C. Interactions of benzene and halogens in the gas phase: Rotational spectrum of C6H6⋯ClF. J. Chem. Soc. Faraday Trans. 1998, 94, 2295–2302. [Google Scholar] [CrossRef]
- Legon, A.C.; Wallwork, A.L. The pairwise interaction of methane with hydrogen cyanide: A surprising result from rotational spectroscopy. J. Chem. Soc. Chem. Commun. 1989, 588–589. [Google Scholar] [CrossRef]
- Legon, A.C.; Wallwork, A.L. Methane as a proton acceptor: Rotational spectrum and internal dynamics of a weakly bound dimer of methane and hydrogen cyanide. J. Chem. Soc. Faraday Trans. 1992, 88, 1–9. [Google Scholar] [CrossRef]
- Legon, A.C.; Roberts, B.P.; Wallwork, A.L. Rotational spectra and geometries of the gas-phase dimers (CH4, HF) and (CH4, HCl). Chem. Phys. Lett. 1990, 173, 107–114. [Google Scholar] [CrossRef]
- Ohshima, Y.; Endo, Y. Rotational spectrum and internal rotation of a methane–HCl complex. J. Chem. Phys. 1990, 93, 6256–6265. [Google Scholar] [CrossRef]
- Atkins, M.J.; Legon, A.C.; Wallwork, A.J. The pairwise interaction of methane and hydrogen bromide: Properties of the weakly bound dimer CH4⋯HBr from microwave spectroscopy. Chem. Phys. Lett. 1992, 192, 368–374. [Google Scholar] [CrossRef]
- Suenram, R.D.; Fraser, G.T.; Lovas, F.J.; Kawashima, Y.J. The microwave spectrum of CH4-H2O. Chem. Phys. 1994, 101, 7230–7272. [Google Scholar] [CrossRef]
- Legon, A.C.; Lister, D.G. Rotational spectrum of CH4···HF. in preparation.
- Deppmeier, B.J.; Driessen, A.J.; Hehre, T.S.; Hehre, W.J.; Johnson, J.A.; Klunzinger, P.E.; Leonard, J.M.; Pham, I.N.; Pietro, W.J.; Yu, J.; et al. SPARTAN’14 Mechanics Program, Release 1.1.8; Wavefunction Inc.; SPARTAN Inc.: Irvine, CA, USA, 2014. [Google Scholar]
- Legon, A.C.; Wallwork, A.L.; Warner, H.E. Do methyl groups form hydrogen bonds? An answer from the rotational spectrum of ethane-hydrogen cyanide. Chem. Phys. Lett. 1992, 191, 97–101. [Google Scholar] [CrossRef]
- Politzer, P.; Truhlar, D.G. (Eds.) Chemical Applications of Atomic and Molecular Electrostatic Potential; Plenum Press: New York, NY, USA, 1981. [Google Scholar]
- Clark, T.; Hennemann, M.; Murray, J.S.; Politzer, P.A. Halogen bonding: The σ-hole. J. Mol. Model. 2007, 13, 291–296. [Google Scholar] [CrossRef]
- Bader, R.F.W. Atoms in Molecules: A Quantum Theory; Clarendon Press: Oxford, UK, 1990. [Google Scholar]
- Raghavendra, B.; Arunan, E. Hydrogen bonding with a hydrogen bond: The methane-water complex and penta-coordinate carbon. Chem. Phys. Lett. 2008, 467, 37–40. [Google Scholar] [CrossRef]
- Balle, T.J.; Flygare, W.H. Fabry–Perot cavity pulsed Fourier transform microwave spectrometer with a pulsed nozzle particle source. Rev. Sci. Instrum. 1981, 52, 33–45. [Google Scholar] [CrossRef]
- Legon, A.C. Fourier-Transform Microwave Spectroscopy, Chapter 9 in Atomic and Molecular Beam Methods; Scoles, G., Ed.; Oxford University Press: New York, NY, USA, 1992; Volume 2, pp. 289–308. [Google Scholar]
- Legon, A.C. Pre-reactive intermediates in gas-phase chemical reactions: A contribution from rotational spectroscopy. J. Chem. Soc. Chem. Commun. 1996, 109–116. [Google Scholar] [CrossRef]
- Schack, C.J.; Wilson, R.D. The Preparation of Chlorine Monofluoride, Synthesis and Reactivity. Inorg. Met. Org. Chem. 1973, 3, 393–396. [Google Scholar] [CrossRef]
- Knizia, G.; Adler, T.B.; Werner, H.-J. Simplified CCSD(T)-F12 methods: Theory and benchmarks. J. Chem. Phys. 2009, 130, 054104. [Google Scholar] [CrossRef] [PubMed]
- Petersen, K.A.; Adler, T.B.; Werner, H.-J. Systematically convergent basis sets for explicitly correlated wavefunctions: The atoms H, He, B–Ne, and Al–Ar. J. Chem. Phys. 2008, 128, 084102. [Google Scholar] [CrossRef]
- Werner, H.-J.; Knowles, P.J.; Knizia, G.; Manby, F.R.; Schütz, M.; Celani, P.; Györffy, W.; Kats, D.; Korona, T.; Lindh, R.; et al. MOLPRO, Version 2009.1, A Package of ab Initio Programs. Available online: http://www.molpro.net (accessed on 8 September 2019).
- Keith, T.A. AIMALL (Version 16.05.19), TK Gristmill Software, Overland Park, KS, USA. 2016. Available online: Aim.tkgristmill.com (accessed on 8 September 2019).
- Frisch, M.J.; Trucks, G.W.; Schlegel, H.B.; Scuseria, G.E.; Robb, M.A.; Cheeseman, J.R.; Scalmani, G.; Barone, V.; Mennucci, B.; Petersson, G.A.; et al. Gaussian 09; Gaussian, Inc.: Wallingford, CT, USA, 2009. [Google Scholar]
- Pickett, H.M. The Fitting and Prediction of Vibration-Rotation Spectra with Spin Interaction. J. Mol. Spectrosc. 1991, 148, 371–377. [Google Scholar] [CrossRef]
- Kisiel, Z. The Program PIFORM. Available online: http://www.ifpan.edu.pl/~kisiel/prospe.htm (accessed on 8 September 2019).
- Fraser, G.T.; Leopold, K.R.; Nelson, D.D., Jr.; Tung, A.; Klemperer, W. The rotational spectrum and structure of NH3-HCN. J. Chem. Phys. 1984, 80, 3073–3077. [Google Scholar] [CrossRef]
- Fabricant, B.; Muenter, J.S. Molecular beam Zeeman effect and dipole moment sign of ClF. J. Chem. Phys. 1977, 66, 5274–5277. [Google Scholar] [CrossRef]
- Abe, M.; Iwakuni, K.; Okubo, S.; Sasada, H. Accurate transition frequency list of the ν3 band of methane from sub-Doppler resolution comb-referenced spectroscopy. J. Opt. Soc. Am. B 2013, 30, 1027–1035. [Google Scholar] [CrossRef]
- McGurk, J.C.; Norris, C.L.; Tigelaar, H.L.; Flygare, W.H. Molecular magnetic properties of FCl. J. Chem. Phys. 1973, 58, 3118–3126. [Google Scholar] [CrossRef]
- Millen, D.J. Determination of stretching force constants of weakly bound dimers from centrifugal distortion constants. Can. J. Chem. 1985, 63, 1477–1479. [Google Scholar] [CrossRef]
- Arunan, E.; Desiraju, G.R.; Klein, R.A.; Sadlej, J.; Scheiner, S.; Alkorta, I.; Clary, D.C.; Crabtree, R.H.; Dannenberg, J.J.; Hobza, P.; et al. Definition of the hydrogen bond (IUPAC Recommendations 2011). Pure Appl. Chem. 2011, 83, 1637–1641. [Google Scholar] [CrossRef]
- Desiraju, G.R.; Ho, P.S.; Kloo, L.; Legon, A.C.; Marquardt, R.; Metrangolo, P.; Politzer, P.A.; Resnati, G.; Rissanen, K. Definition of the halogen bond (IUPAC Recommendations 2013). Pure Appl. Chem. 2013, 85, 1711–1713. [Google Scholar] [CrossRef]
- Bazua, A.; Frontera, A. RCH3···O Interactions in Biological Systems: Are They Trifurcated H-Bonds or Noncovalent Carbon Bonds? Crystals 2016, 6, 26. [Google Scholar] [CrossRef]
- Mani, D.; Arunan, E. The X-C···Y (X = O/F, Y = O/S/F/Cl/Br/N/P) ‘carbon bond’ and hydrophobic interactions. Phys. Chem. Chem. Phys. 2013, 15, 14377–14383. [Google Scholar] [CrossRef]


| Spectroscopic Constant | H4C···35ClF | H4C···37ClF | ||
|---|---|---|---|---|
| State A | State F | State A | State F | |
| B0/MHz | 2307.2111(9) a | 2287.9319(9) | 2305.6624(6) | 2286.3818(10) |
| DJ/kHz | 8.83(6) | 7.16(6) | 8.88(4) | 7.16(7) |
| χaa(Cl)/MHz | −142.483(11) | −142.425(8) | −112.322(6) | −112.287(9) |
| Mbb(F) = Mcc(F)/kHz | 2.6(10) | 2.9(9) | 2.5(7) | 2.3(11) |
| Molecule | H4C···ClF a A B | CH4 | ClF |
|---|---|---|---|
| r(C–H1)/Å | 1.0871 1.0872 | 1.0876 | - |
| r(C–Hn)/Å (n = 2,3,4) | 1.0887 1.0890 | 1.0876 | - |
| ∠Cl···C–H1/° | 180.00 180.39 | - | - |
| ∠H1 –C–Hn/° (n = 2,3,4) | 109.68 109.67 | 109.47 | - |
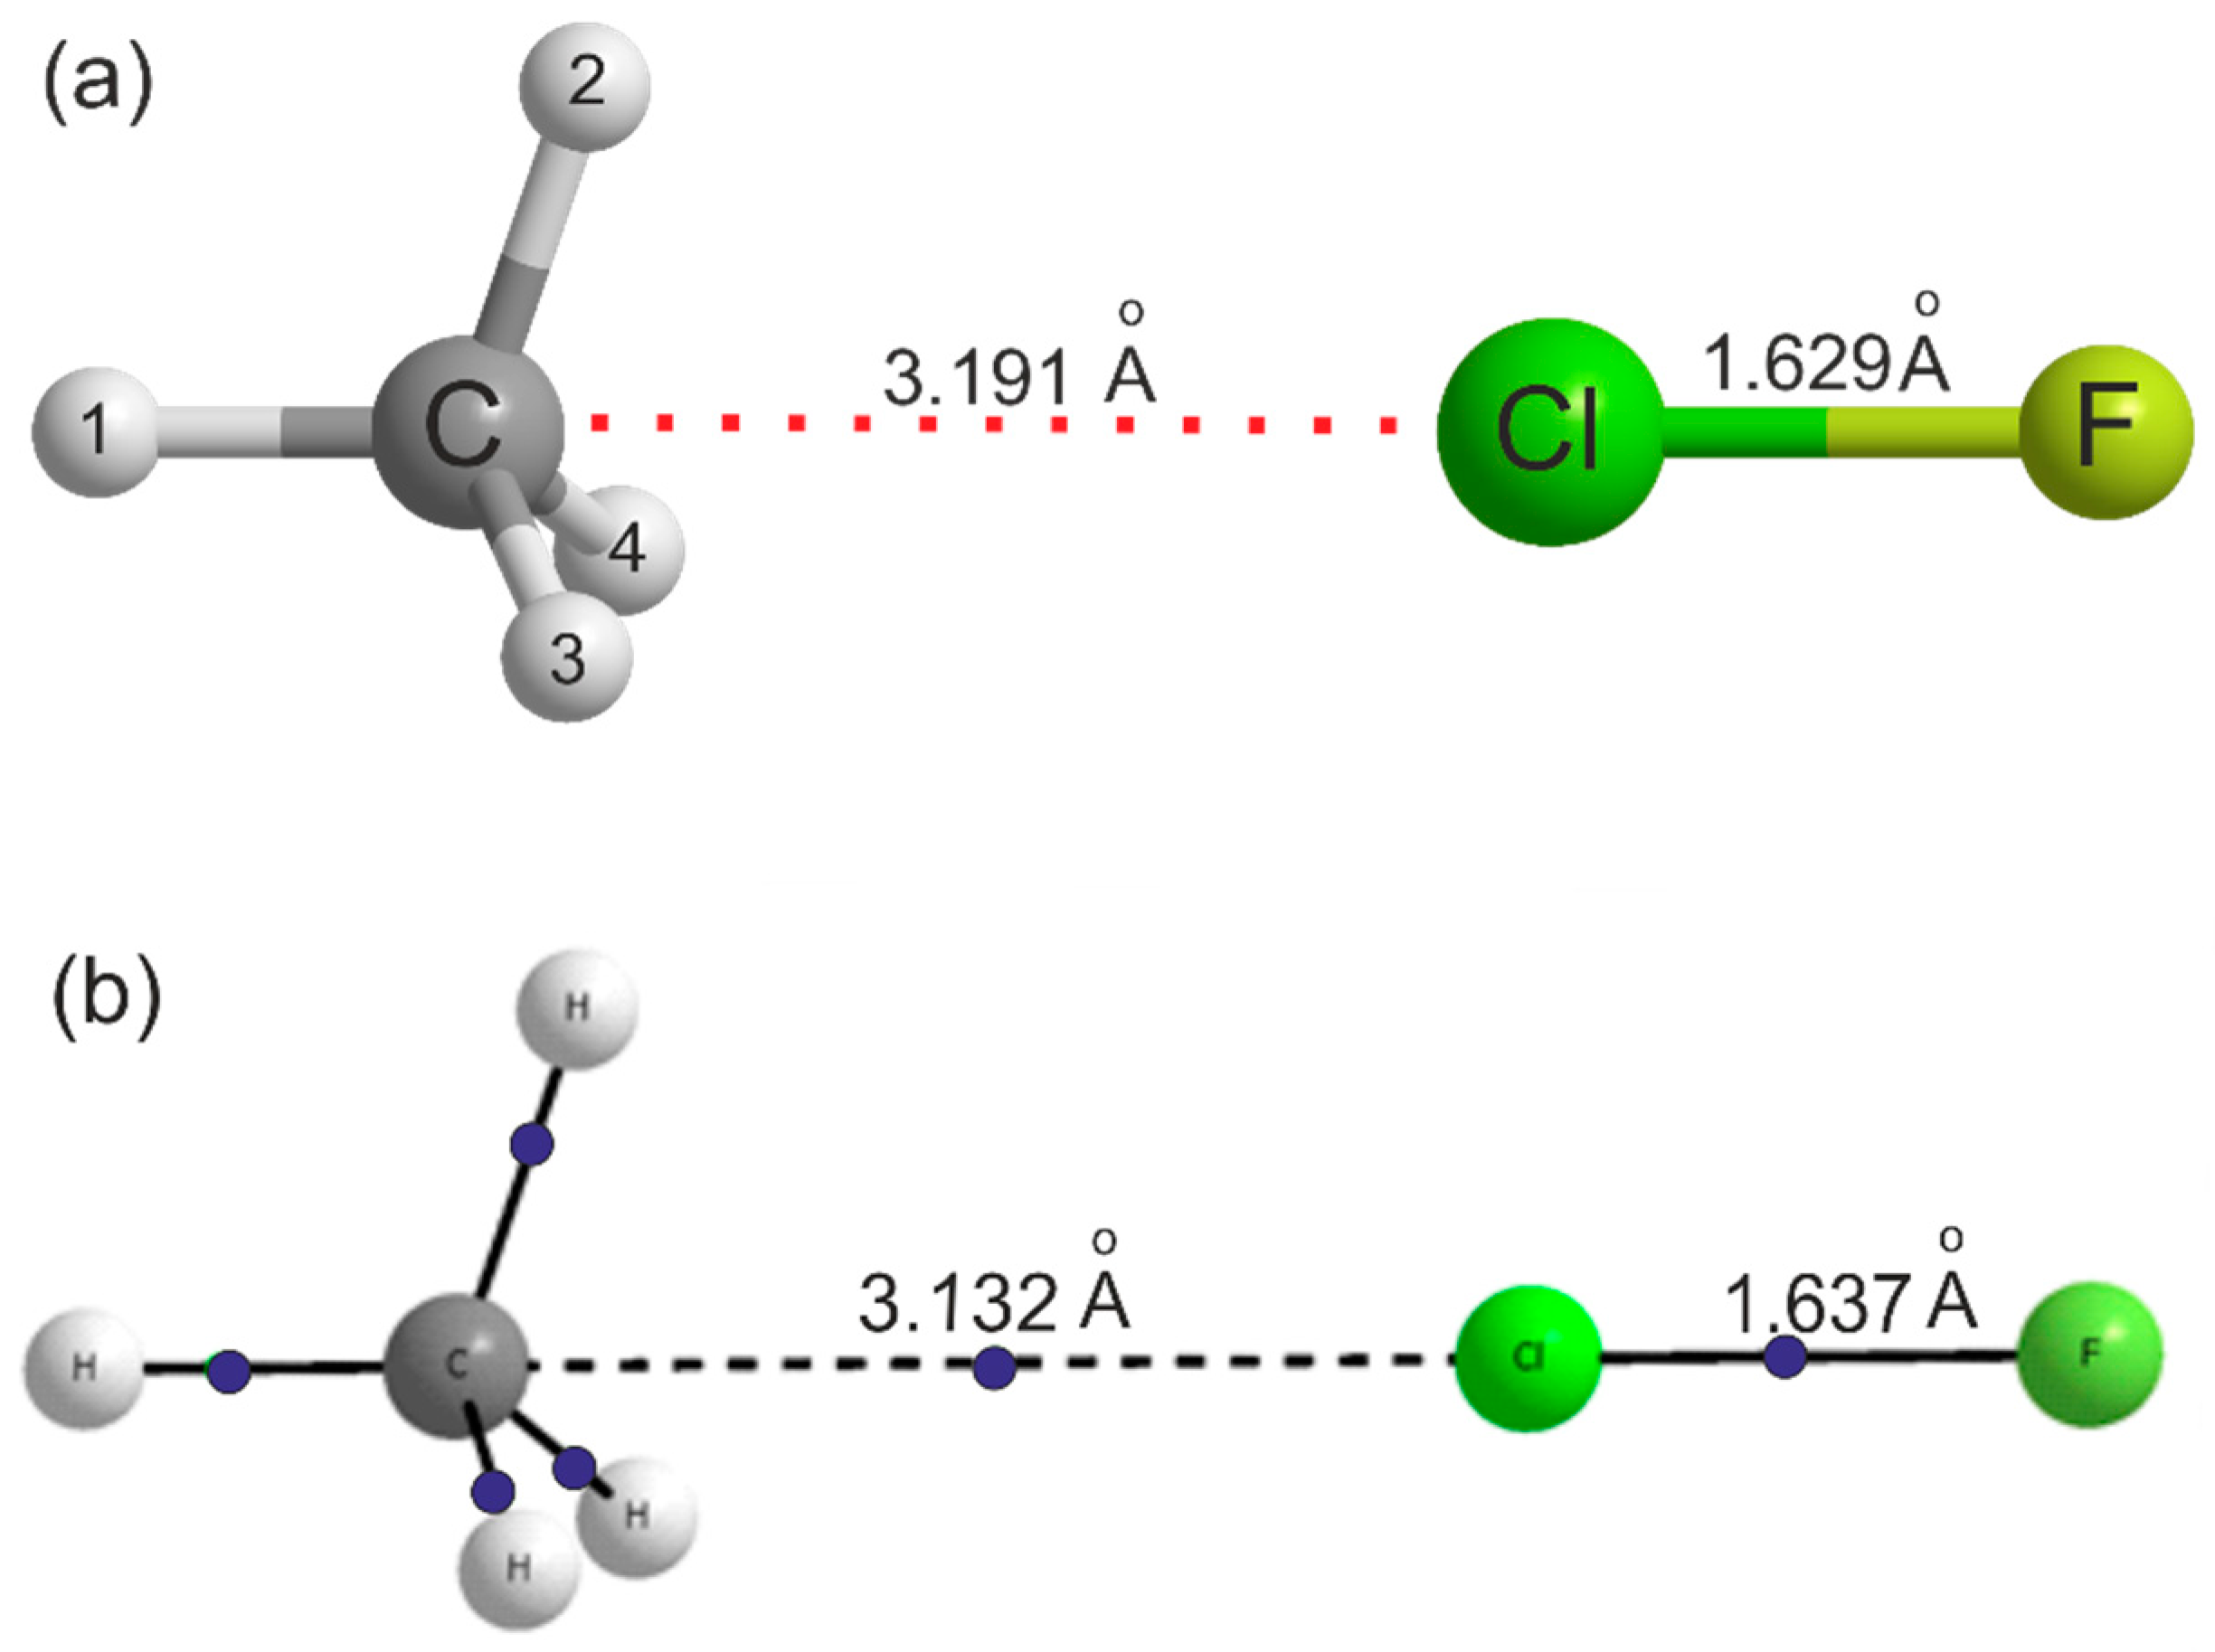
| r(C···Cl)/Å | 3.1914 3.1979 | - | - |
| r(Cl–F)/Å | 1.6294 1.6308 | - | 1.6275 |
| Property | H4C···35ClF | H4C···37ClF | ||
|---|---|---|---|---|
| State A | State F | State A | State F | |
| /° | 7.1 | 7.2 | 7.1 | 7.2 |
| rcm/Å | 3.8510 | 3.8704 | 3.8302 | 3.8496 |
| r(C···Cl)/Å | 3.2766 | 3.2960 | 3.2763 | 3.2957 |
| kσ/(N m−1) | 3.77(3) | 4.54(4) | 3.76(2) | 4.55(4) |
| Property | CH4 | 35ClF | 37ClF |
|---|---|---|---|
| B0/MHz | 157,122.6142(15) a | 15,418.251(5) b | 15,125.652(5) b |
| χ0(Cl)/MHz | −145.87182(3) c | −114.96131(6) c | |
| r0/Å) | 1.093987 d | 1.63176 e | 1.63173 e |
| r/Å | 0.000000 f | 0.57444 g | 0.55393 g |
© 2019 by the authors. Licensee MDPI, Basel, Switzerland. This article is an open access article distributed under the terms and conditions of the Creative Commons Attribution (CC BY) license (http://creativecommons.org/licenses/by/4.0/).
Share and Cite
Legon, A.C.; Lister, D.G.; Holloway, J.H.; Mani, D.; Arunan, E. Isolation of a Halogen-Bonded Complex Formed between Methane and Chlorine Monofluoride and Characterisation by Rotational Spectroscopy and Ab Initio Calculations. Molecules 2019, 24, 4257. https://doi.org/10.3390/molecules24234257
Legon AC, Lister DG, Holloway JH, Mani D, Arunan E. Isolation of a Halogen-Bonded Complex Formed between Methane and Chlorine Monofluoride and Characterisation by Rotational Spectroscopy and Ab Initio Calculations. Molecules. 2019; 24(23):4257. https://doi.org/10.3390/molecules24234257
Chicago/Turabian StyleLegon, Anthony C., David G. Lister, John H. Holloway, Devendra Mani, and Elangannan Arunan. 2019. "Isolation of a Halogen-Bonded Complex Formed between Methane and Chlorine Monofluoride and Characterisation by Rotational Spectroscopy and Ab Initio Calculations" Molecules 24, no. 23: 4257. https://doi.org/10.3390/molecules24234257
APA StyleLegon, A. C., Lister, D. G., Holloway, J. H., Mani, D., & Arunan, E. (2019). Isolation of a Halogen-Bonded Complex Formed between Methane and Chlorine Monofluoride and Characterisation by Rotational Spectroscopy and Ab Initio Calculations. Molecules, 24(23), 4257. https://doi.org/10.3390/molecules24234257