Article

Levels of Trace Elements in the Aqueous Humor of Cataract Patients Measured by the Inductively Coupled Plasma Optical Emission Spectrometry

by
Joanna Dolar-Szczasny
1,
Anna Święch
1,
Jolanta Flieger
2,*,
Małgorzata Tatarczak-Michalewska
2,
Przemysław Niedzielski
3,
Jędrzej Proch
3,
Dariusz Majerek
4,
Justyna Kawka
2 and
Jerzy Mackiewicz
1
1
Department of Retina and Vitreo and nd Surgery, Medical University of Lublin, Chmielna 1, 20-079 Lublin, Poland
2
Department of Analytical Chemistry, Medical University of Lublin, Chodźki 4A, 20-093 Lublin, Poland
3
Faculty of Chemistry, Department of Analytical Chemistry, Adam Mickiewicz University in Poznań, 89B Umultowska Street, 61-614 Poznan, Poland
4
Department of Applied Mathematics, University of Technology, Nadbystrzycka 38D, 20-618 Lublin, Poland
*
Author to whom correspondence should be addressed.
Molecules 2019, 24(22), 4127; https://doi.org/10.3390/molecules24224127
Submission received: 2 October 2019 / Revised: 12 November 2019 / Accepted: 13 November 2019 / Published: 14 November 2019
(This article belongs to the Section Analytical Chemistry)

Abstract

:
Trace elements play an important role in the pathogenesis of several serious ophthalmological disorders, such as glaucoma, age-related macular degeneration (AMD), diabetic retinopathy, cataract, etc. This study aimed to measure alterations of chemical elements’ (67) levels in the aqueous humor of patients undergoing cataract surgery. The pilot study included 115 patients, (age 74 ± 7.27, female 64.35%, male 35.65%). The aqueous levels of elements were measured by the use of the inductively coupled plasma optical emission spectrometry (ICP-OES), quality controlled with certified standards. The classification of elements based on their concentration was achieved by hierarchical cluster analysis. This is the first screening study that quantifies over 60 elements which are present in the fluid from the anterior chamber of the eye of cataract patients. The obtained results can be suitable for understanding and identifying the causes that may play a role in the initiation and progression of lens opacity.

1. Introduction

A lens opacity that gets worse with age can finally lead to blindness [1]. Several indisputable causes of cataract formation have already been identified. It is known, for example, that the risk of lens opacity doubles every ten years [2]. Other risk factors are sex [3], diabetes [3], infrared (IR) and ultraviolet B (UV-B: 280–315 nm) radiation [4,5], and smoking [6,7]. However, there is still a need for new research to understand the causes of the formation and development of cataracts. Because cataract formation is strongly associated with age and cigarette smoking, which in turn lead to the accumulation of metal ions, many studies were devoted to analyzing the content of selected metals in human lenses or aqueous humor collected from patients undergoing cataract surgery.
Up to now, elevated levels of cadmium and selenium, as well as a downward trend in the copper content in the human lens, have been noted in relation to the age of patients [7]. A significant increase in aluminum and vanadium ions, a tendency to increase the content of chromium, nickel, and lead, as well as a tendency to decrease the concentration of copper ions, have been observed in smokers’ lenses compared to non-smokers [7]. There is a high probability that the observed changes in the metal ion content contribute to the formation of cataracts by inducing oxidative stress and modifying the structure and function of the extracellular matrix of the lens.
Without a doubt, metal ions are important for the human organism because many biological functions are dependent on their presence. The toxicity of metals occurs due to an essential metal overload as well as exposure to toxic heavy metals from different sources. Therefore, a metal ions scarcity, as well as excess, may provide numerous serious disorders. Toxic effects are caused either by heavy metal ions, such as mercury and lead, or by crucial essential metals if present in excess. Among the essential metals, the most notable include Fe, Co, Ni, Ca, Cu, Zn, and Cr. The deficiency of iron and cobalt provides anemia, the deficiency of copper leads, in turn, to brain and heart diseases, a lower level of zinc leads to growth retardation and skin changes, while a lower level of calcium leads to bone deterioration and a lower level of chromium reduces the glucose tolerance [8,9,10,11,12,13]. The role of trace metals is especially visible in the central nervous system (CNS), the haematopoietic system, the liver, the kidneys, etc. Exposure to heavy toxic metals has risen within the last 50 years as a result of an industrial increase. Metal ions such as zinc (Zn), iron (Fe), manganese (Mn), and copper (Cu) take part in the neurotransmitter synthesis at the synapse [14,15,16,17]. Therefore, concentrations of these metal ions must be tightly regulated in the nervous system [18]. Abnormal levels of metal ions can cause the progression of several neurodegenerative disorders, including Alzheimer’s disease [19,20,21,22], Parkinson’s disease [23], and Huntington’s disease [24]. There is some evidence that trace elements might play a role in the pathogenesis of ophthalmological neurodegenerative diseases such as glaucoma, the leading cause of irreversible blindness in the world or age-related macular degeneration (AMD) [25,26]. Junemann et al. [26] measured levels of selected metal ions in the aqueous humor of AMD-affected eyes by the use of Flow-Injection-Inductively-Coupled-Plasma-Mass-Spectrometry (FI-ICP-MS) and found significant alterations of trace element levels. It was observed that patients with AMD had significantly higher levels of cadmium, cobalt, iron, and zinc, as well as reduced level of copper, when compared with patients without AMD. In turn, for manganese and selenium, no significant differences were observed. Abnormal metal levels in the central visual system structures of the mouse model of glaucoma were observed by DeToma et al. [27]. The authors used inductively coupled plasma mass spectrometry (ICP-MS) to examine the levels of selected elements such as iron, copper, zinc, magnesium, manganese, and calcium in the retina of mice. ICP-MS experiments showed that mice with glaucoma had lower retinal Fe, Mg, Ca, Mn and Zn concentrations than pre-glaucomatous mice. More recently, the aqueous humor levels of cadmium, iron, manganese, cobalt, copper and zinc were measured in the aqueous humor samples of patients with primary open-angle glaucoma (POAG) and pseudo-exfoliation glaucoma (PEXG) by Flow-Injection-Inductively-Coupled-Plasma-Mass-Spectrometry (FI-ICP-MS) [28]. It was found that there were significant differences in the aqueous humor levels of zinc and iron between glaucoma and control patients. These findings support the initial hypothesis assumed by the authors that zinc and iron can play a role in the pathogenesis of open-angle glaucoma. In 1990, the determination of zinc and copper in the ophthalmic fluid of cataract and glaucoma patients was described [29]. A statistically significant negative relationship was observed between the concentrations of these elements in the aqueous humor of patients with cataracts and glaucoma. The concentrations of lead and cadmium were measured using an inductively coupled plasma-mass spectrometer in the fluids and tissues of human eyes [30]. It was observed that these toxic heavy metals are able to accumulate in human ocular tissues, especially in the retinal pigment epithelium and choroid.
Schmeling et al. [31] analyzed the aqueous humor and lens samples collected from 14 cataract patients to study the presence and concentration of selected heavy metals via the use of total reflection X-ray fluorescence spectrometry (TXRF). The data obtained show that the most commonly found metals in both analyzed media were chromium and manganese. Another metal found in the aqueous humor was a nickel.
Traditionally, the analysis of trace elements in biological samples is performed using widely available flame atomic absorption spectroscopy (FAAS) or graphite atomic absorption spectroscopy (GFAAS). The disadvantages of the mentioned methods are quite a large sample volume and an insufficient sensitivity, often requiring the enrichment of the sample by a targeted analyte in order to achieve appropriate detection limits. The quantification of elements at ultra-low levels is possible owing to more sophisticated mass spectrometry (MS) or atomic spectrometry, including atomic fluorescence spectrometry (AFS), atomic absorption spectrometry (AAS), and atomic emission spectrometry (AES) or optical emission spectrometry (OES). Unfortunately, atomic spectrometry techniques require aggressive sample preparation procedures that destroy the molecular structure of chemical species. For the speciation analysis, an on-line or off-line connection of two analytical techniques is required. There are many hyphenated techniques that are a combination of different separation methods, such as high-performance liquid chromatography (HPLC), size exclusion chromatography (SEC), gas chromatography (GC) or capillary electrophoresis (CE), with sensitive atomic spectrometry detectors for the separation, detection, identification and quantification of elemental species. It should be emphasized that hyphenated techniques absolutely require the use of improved sample preparation methods to preserve the species identity. To separate target species from complex biological matrices, different extraction methods are used, ranging from the oldest liquid-liquid extraction (LLE) to more advanced methods such as the ultrasonic micro-extraction of liquid-liquid dispersion (LLME), liquid-phase microextraction (LPME), solid-phase extraction (SPE), and solid-phase microextraction (SPME). The elimination of artifacts is possible due to the species-specific isotope dilution method. To eliminate non-spectral as well as spectral interferences caused by the presence of organic compounds or salts as components of solvents, used for elution, the concept of dispersed particle extraction (DPE) was introduced [32,33,34,35]. In this case, the analyte-containing sorbent is introduced as a specific element into an inductively coupled plasma optical emission spectrometry (ICP-OES) detection device. A further improvement of the repeatability, as well as the preconcentration of the sample, are possible thanks to the flow injection system (FI), which reduces the manual steps of the sample manipulation [36]. Recently, some review papers describing the speciation of trace elements by isolated or hyphenated techniques have been published [37,38,39]. Particularly the advances in the instrumentation, calibration strategies, and method development concerning ICP-OES are presented by Donati et al. [40]. In addition to these, there is a whole range of techniques useful for direct elementary speciation, such as X-rays, electron spectroscopy, electroanalysis, magnetic resonance spectroscopy, and nuclear spectroscopy techniques [41].
In the light of current achievements, the deficiency or excess of the various metals can help to study the etiology of the diseases at the molecular level and to find the appropriate remedy. Based on this knowledge, the aim of this study was to evaluate elements of aqueous humor in cataract patients. This is the first screening study that quantifies all metal ions appearing at a concentration not below 0.001 ppm in the aqueous humor of patients with lens opacity. More than sixty metal ions were determined in 115 donors aged between 55 and 94 years old. ICP-OES was chosen for the tests due to the small sample volumes available, the wide linear range for quantification, and the low detection limit. Furthermore, ICP-OES exhibits smaller interferences and a shorter time of analysis in comparison to the commonly applied ICP-MS. The observed dysregulation in the metal levels can help to understand the pathogenesis of cataracts. The collected database can be used as a reference for future research on the analysis of elements in the eye fluid.

2. Results

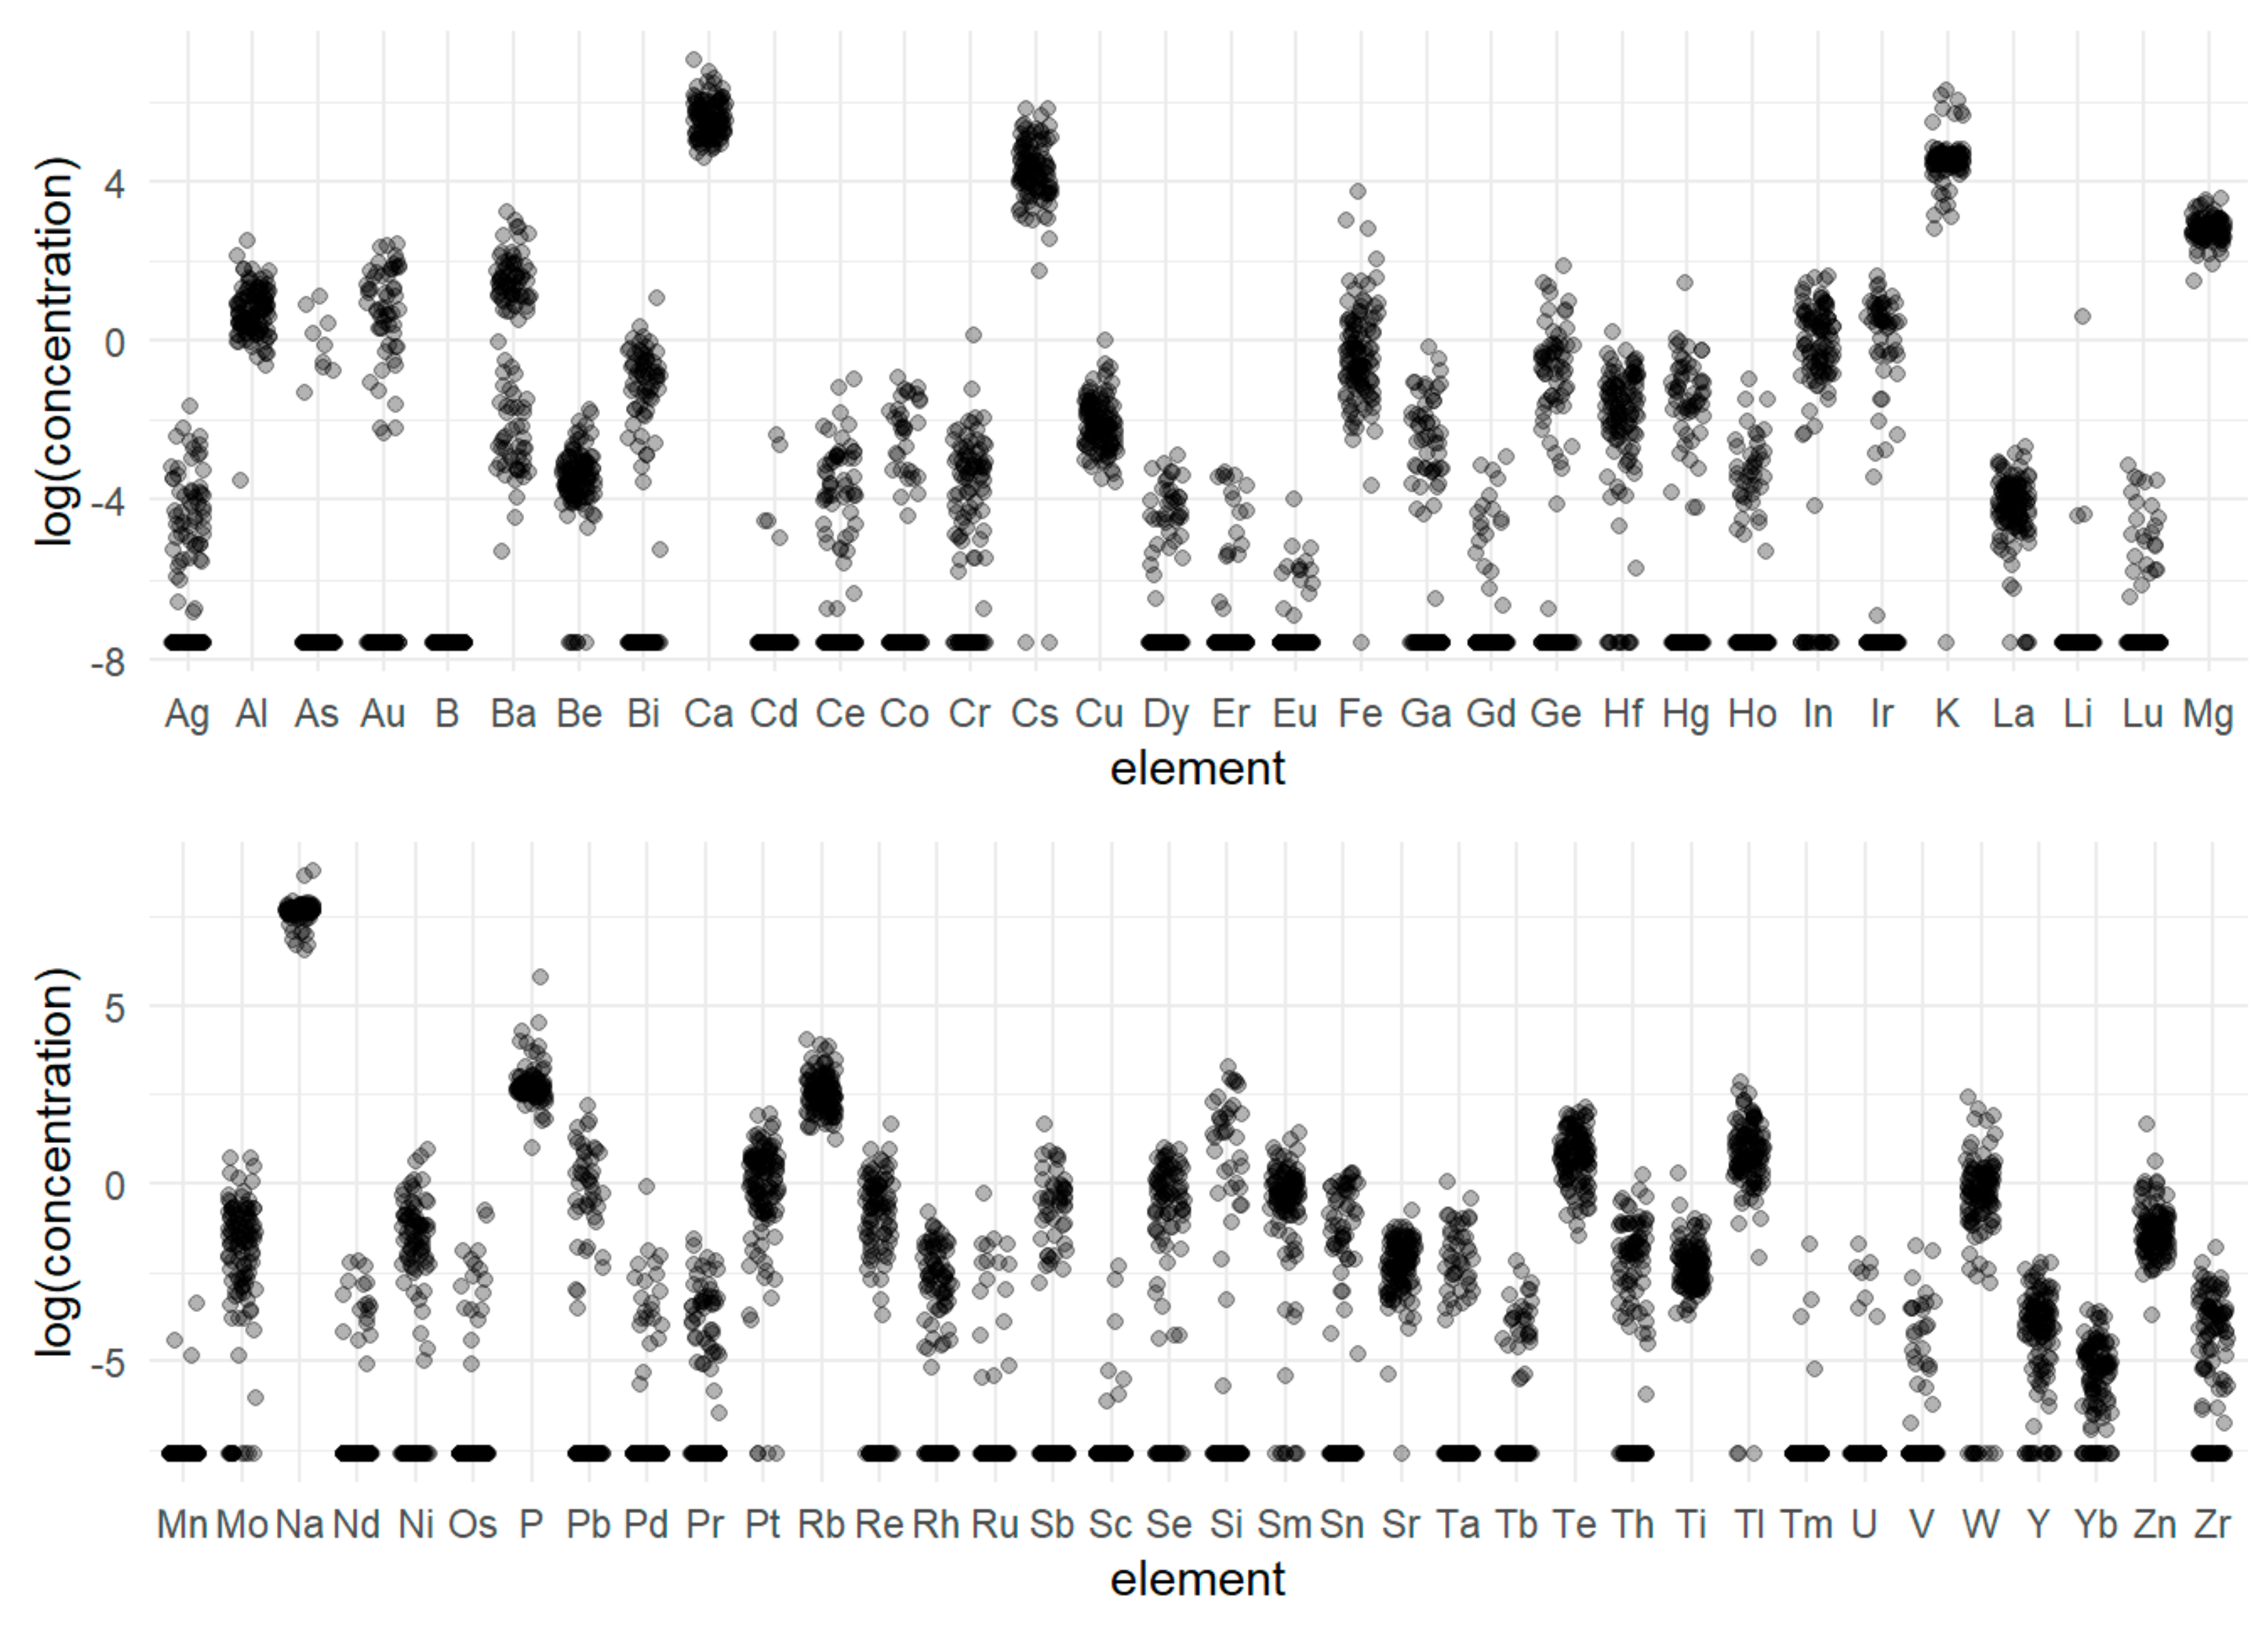
2.1. Element Content

Samples of fluid from the anterior chamber of the eye were obtained from patients undergoing cataract surgery: 115 patients between 55 and 94 years of age (age 74.94 ± 7.22, female 64.35%, male 35.65%). The levels of metals were measured by ICP-OES after an appropriate sample preparation. The measured values are collected in Table 1. Most elements showed substantial variations from patient to patient. The widest range refers to macroelements such as calcium (1062.194), sodium (5732.618), potassium (539.795), phosphorus (326.269), but also surprisingly cesium (350.0), which is highly toxic. The highest variability expressed by the CV was observed for lithium (1026.729), a fairly common element, but also for those that are dangerous such as arsenic (434.053) and cadmium (507.174). The large values of the standard deviations and wide ranges are not surprising considering the diversity of patients. There is also a significant group of elements that were not detected in most patients, which may point to their absence or occurrence at an undetectable level via the detection method that was used. This group includes transition elements: Ru, Pd, Os, Mn, Hg, Cd, Co, and V; post-transition metals like Sn; metalloids: B, Si, Ge, Sb; and rare earth elements: Tm, Tb, Sc, Pr, Lu, Ho, Ge, Gd, Eu, Er, Dy. On the other hand, the results show clear trends and provide initial information about the metal concentrations in the aqueous humor of cataract patients.
The main group, covering, i.e., sodium, potassium, and calcium, belongs to the so-called essential elements, and these elements occur at a concentration between 108.81 ppm for potassium and 2176.45 for sodium. The remaining elements occur at trace levels, though iron and zinc occur at about 1.692 and 0.357 ppm, respectively. All the other metals, as well as the three metalloids (silicon, arsenic, and selenium), occur only at ultra-trace levels, e.g., manganese and cobalt with about 0.001 and 0.039 ppm, respectively.
Among the elements found in higher concentrations, the high cesium content is noteworthy. CsCl is sold as a supplement for alternative cancer therapy. However, its effectiveness has not been proven, and the collected evidence indicates a life-threatening toxicity. There is even a case of lethal toxicity after injection of a CsCl solution into a tumor [42]. The patient’s measured cesium level in the blood was 100,000 μg L−1 (reference range <10 μg L−1). However, death from an overdose of cesium supplements is very rare. High levels of cesium cause other serious problems, such as cardiac disorders, unconsciousness, convulsions and electrolyte disturbances, including sodium and potassium. Health hazard arises from the chemical similarity of Cs to potassium. The danger of poisoning comes primarily from environmental pollution. In areas of eastern Poland where radioactive contamination of the Chernobyl nuclear power plant occurred on April 28, 1986, cesium-137 contamination of 3–8 kBq/m2 was found [43]. The comparison presented in Figure 1 shows that the content of competitive potassium is relatively stable and generally higher than the cesium content in the ophthalmic fluid; however, in 20% of cases, an elevated cesium level was observed, which indicates the accumulation of this element. Given the advanced age of patients and the place of residence (areas of eastern Poland affected by cesium contamination), this seems to be justified.
Phosphorus belongs to macro elements, and its content in the body is greater than 0.01% of the body weight, while the daily demand exceeds 100 mg/d. Phosphorus is crucial for bone and tooth health. Phosphorus performs its functions in the body provided that there is a balance between it and the amount of calcium. A possible phosphorus deficiency reduces calcium absorption. In turn, phosphorus overdosing causes leaching of calcium from the body. It is very important that the balance between these elements is maintained in the human body. When analyzing calcium and phosphorus levels, it can be seen that calcium levels are much higher compared to phosphorus. It should be remembered that the level of phosphorus affects the absorption and levels of some microelements in body fluids such as magnesium, iron, zinc, and copper. Interactions between iron, calcium, phosphorus, magnesium, copper, and zinc were studied in iron-deficient rats [44]. It has been found that iron deficiency is associated with an increase in the absorption of phosphorus and magnesium.
In the group of elements present at a trace level, the high content of aluminum, lead, tellurium, and thallium is noteworthy. Until now, no one has studied the level of these elements, although their concentrations are much higher than, e.g., copper, chromium, selenium or zinc, which was previously determined in the aqueous humor. So far, high levels of aluminum (2.3%) have been found in lenses with cataract in smokers [7]. This is the first study showing a high Al content in ophthalmic fluid in people with cataracts. Because Al is involved in neurodegenerative processes, this is a clinically relevant observation. As has been shown so far, a chronic exposure to Al causes its accumulation in various tissues [45,46,47,48,49,50,51]. It has been proven that even low doses of aluminum are neurotoxic, induce inflammatory processes, and adversely affect cognitive functions and morphological changes in the central nervous system. It is very likely that the increased accumulation of Al is due to the general increased oral exposure to this element. It has already been confirmed that silicon can have a protective effect in the case of aluminum contamination [51,52,53]. An increased intake of silicon probably mobilizes various forms of aluminum in vivo and reduces its storage in tissues. There is evidence that silicon reduces the uptake of aluminum in the intestine. High levels of aluminum (mean value: 2.427 ppm) were detected in the aqueous humor of all patients. The fairly low coefficient of variation for the occurrence of this element in the studied group (CV = 69) confirms the fact that patients are commonly exposed to this element. The co-occurrence of silicon in less than half of the patients (43.3%) seems to confirm Si–Al interactions in tissues in vivo.
All of the tested samples contained high thallium levels within 0–16.9 ppm. Thallium is a highly toxic element, comparable to lead, cadmium, and mercury. Thallium (III) compounds show a similar toxicity to mercury (II) compounds, and less toxic thallium (I) compounds are up to 10 times more toxic than lead (II) compounds. Tal has mutagenic, carcinogenic and teratogenic effects, among others. The accumulation of this element causes gastrointestinal ulcers, alopecia, and polyneuropathy. Thallium dispersion in the environment is mainly due to the activity of industry [54,55,56]. The main anthropogenic sources of thallium are solid emissions and wastes from coal, iron, non-ferrous mining, and metallurgy or cement production processes. It can get into surface waters, soils, plants and, as a consequence, into the digestive system. Hair has already been tested for thallium content [57,58], as well as blood and urine [59]. It turns out that highly-soluble thallium (I) compounds are easily absorbed, even through skin [60].
Much is known about lead toxicity [61], whose measured concentration ranges between 0–8.8 ppm; surprisingly little information is available on the presence and concentration of other toxic metals in the eye tissue and their effects on both sight and sharpness. To date, there are no studies that show such high contents of another toxic element, namely tellurium, in the ophthalmic fluid. The measured level in patients with cataracts ranges from 0.2 to 8.4 ppm. The human body absorbs tellurium with food and it accumulates in the bones, liver, and spleen. Due to human health hazards, tellurium has been classified in the Regulation of the European Parliament and of the Council (EC) No. 1272/2008w as a substance showing acute inhalation toxicity, causing serious eye damage/eye irritation, and toxic to internal organs and reproduction. Tellurium in the tested material occurs at a level comparable to lead, thallium, and aluminum. The accumulation of these toxic elements in the aqueous humor in people with cataracts is of clinical importance and sheds new light on the causes of this disease.

2.2. Statistical Analysis

The aim of the statistical analysis is to divide all chemical elements in the eye fluid of patients undergoing cataract surgery, based on their concentration. Using a statistical analysis, a non-arbitrary division was achieved. Due to the nature of the data, unsupervised machine learning methods were used [62]. The division into homogeneous groups was applied using pairwise comparisons [63] and a cluster analysis [64].
The distributions of the chemical elements in the raw data were characterized by a high right-hand side asymmetry. This phenomenon is widely known. Asymmetry is affected by the fact that many people have low levels of chemical element concentration. The lowest asymmetry is for Te (A = 1.07) and the highest for Li (A = 10.7).
There were two reasons why the transformation of the raw concentration of elements was needed. First, all of the earlier mentioned statistical methods need to resemble a symmetric distribution. Second, the division of the elements obtained from the raw data is not interesting. Using a logarithmic transformation of the elements’ concentration, a more interesting partition was obtained. Figure 2 illustrates the changes in the distribution between the transformed and raw concentrations of Ca [65].

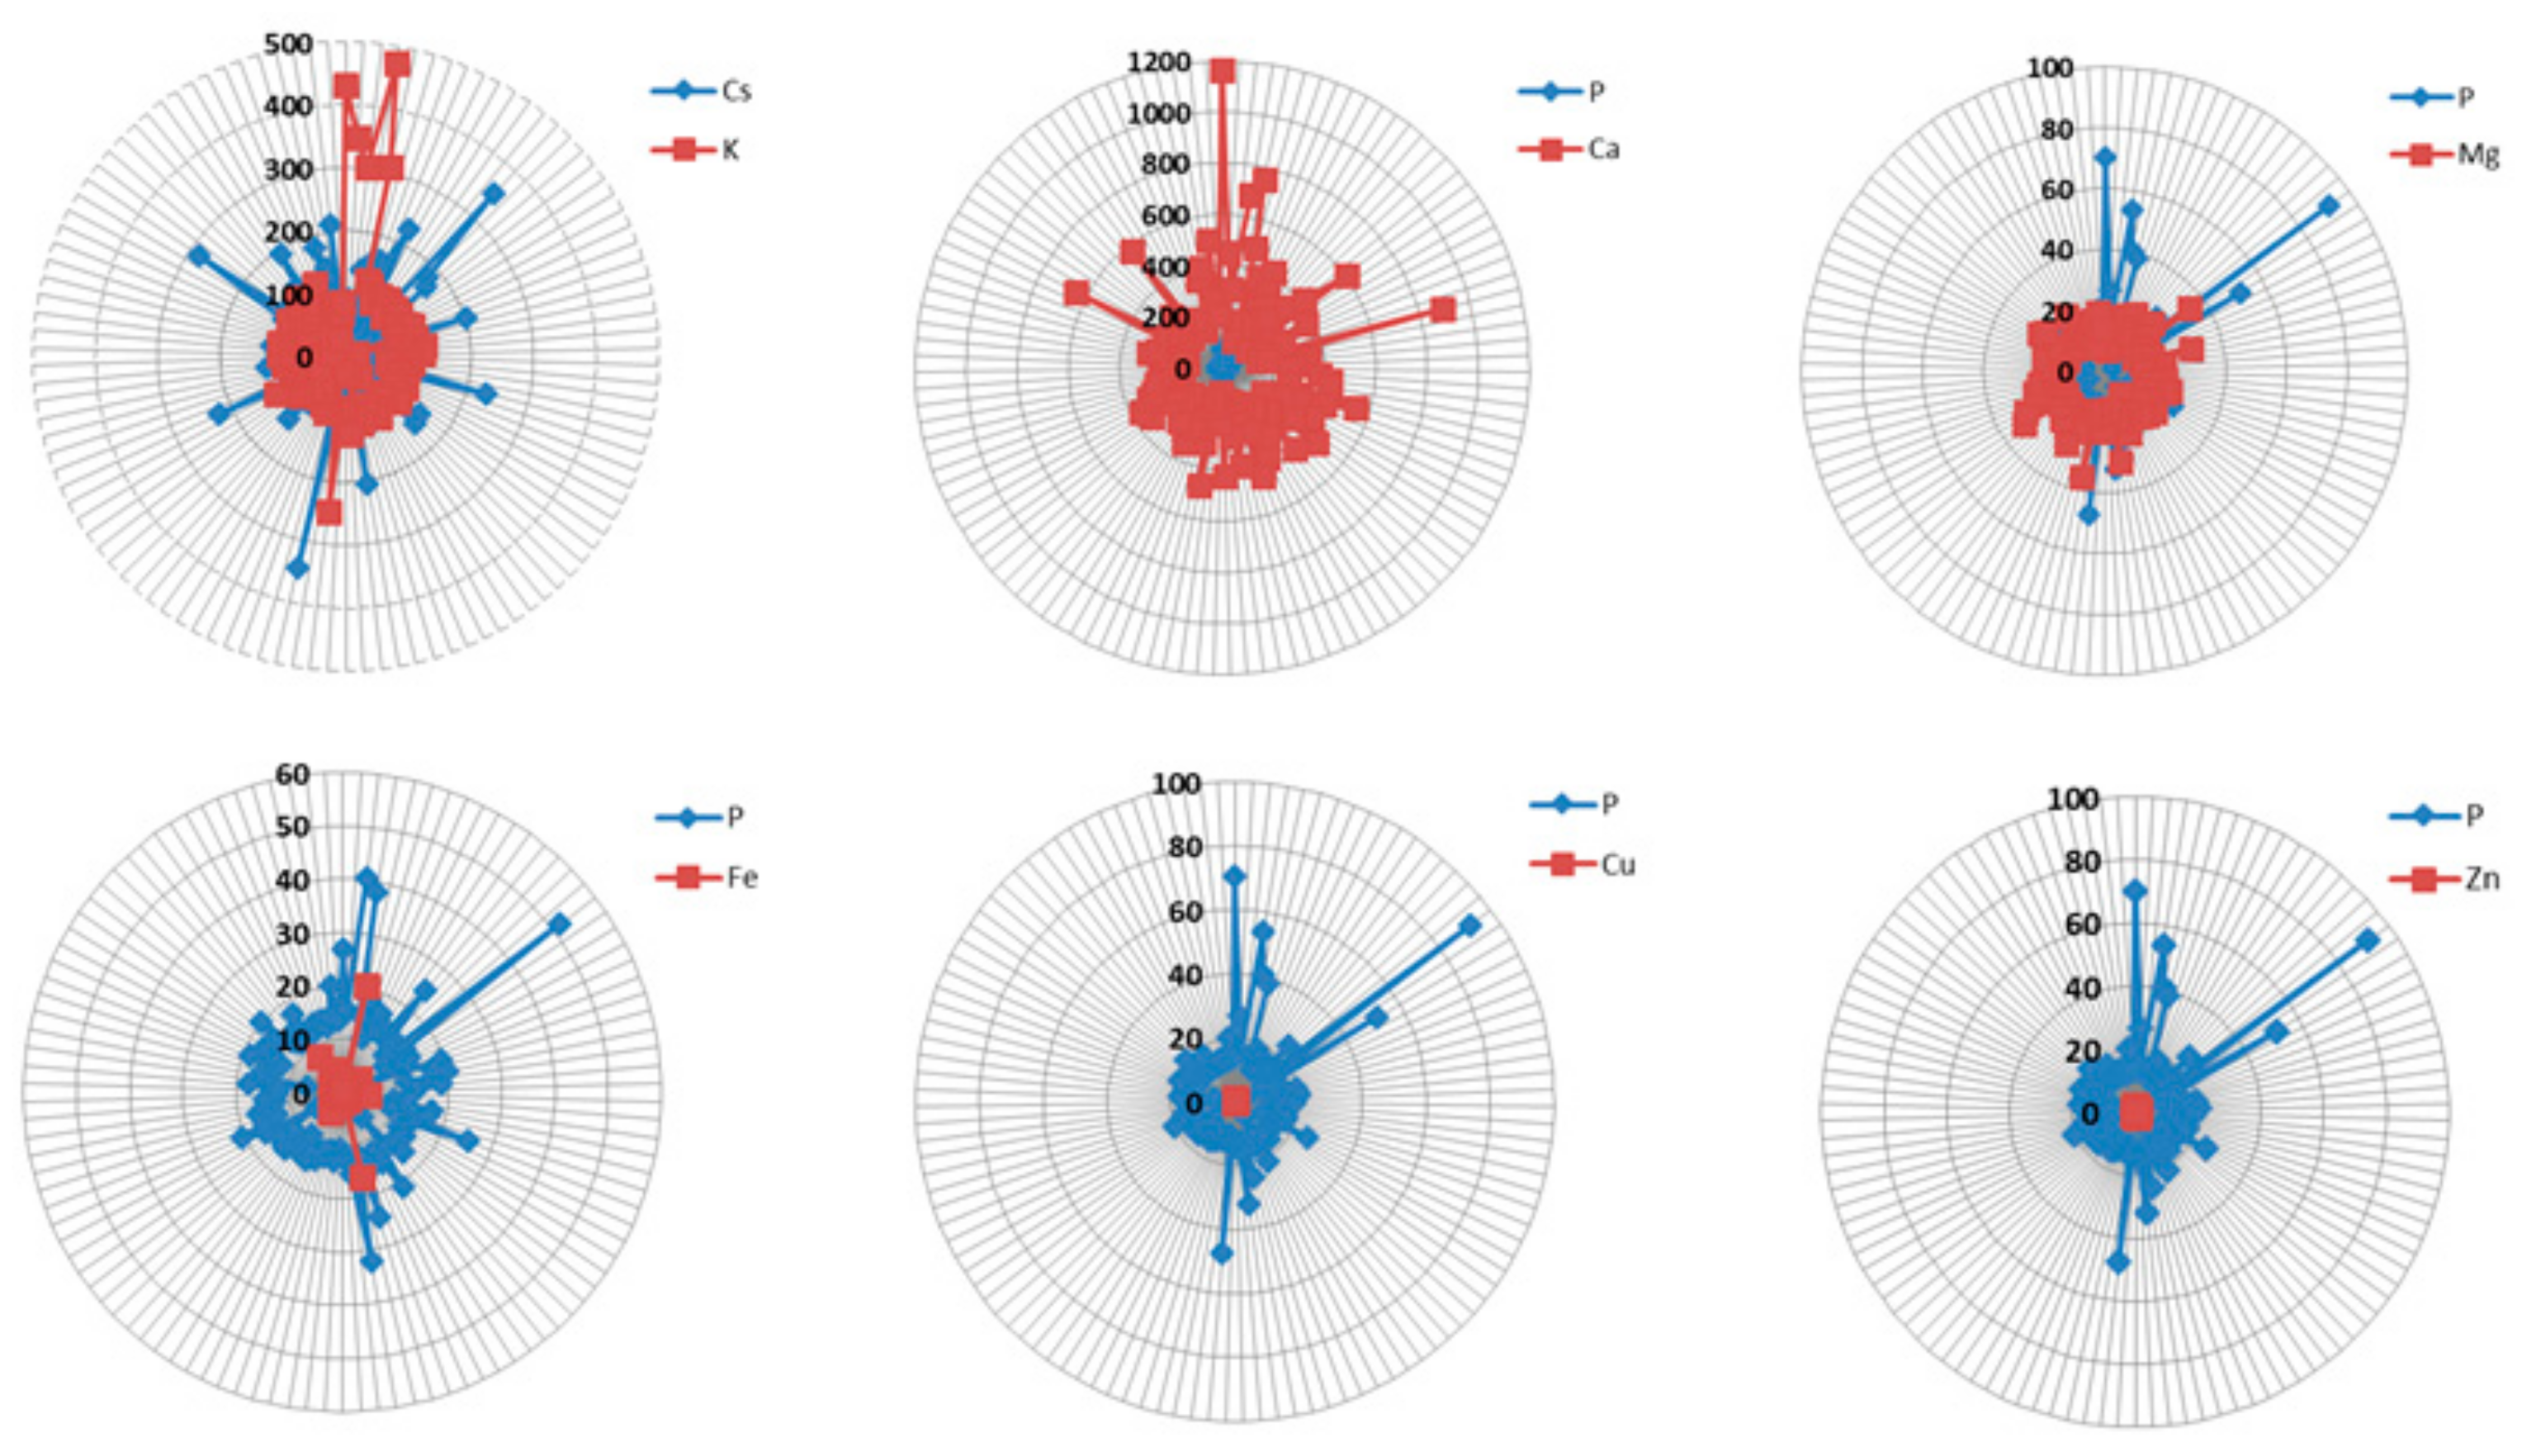
2.2.1. Division Based on Pairwise Comparisons

The idea of dividing elements into groups is based on the idea that elements that have similar levels of concentration should be in one group. However, large differences in the concentration of particular elements make it difficult to discriminate between them.
Figure 3 shows that there are differences between the concentrations of elements. A first attempt to group them in view of the concentration was based on pairwise comparisons [66]. An ANOVA test confirmed that the differences in the means of the concentrations between the elements are significant (F = 333.93 and p = 0). However, a post hoc test [66] failed in the creation of groups because almost all elements were characterized by a bimodal distribution, which means that there are two groups of observations for a particular element, one with a near-zero concentration and a second with a higher concentration (i.e., see Au in Figure 3). The groups thus obtained are superimposed on each other.

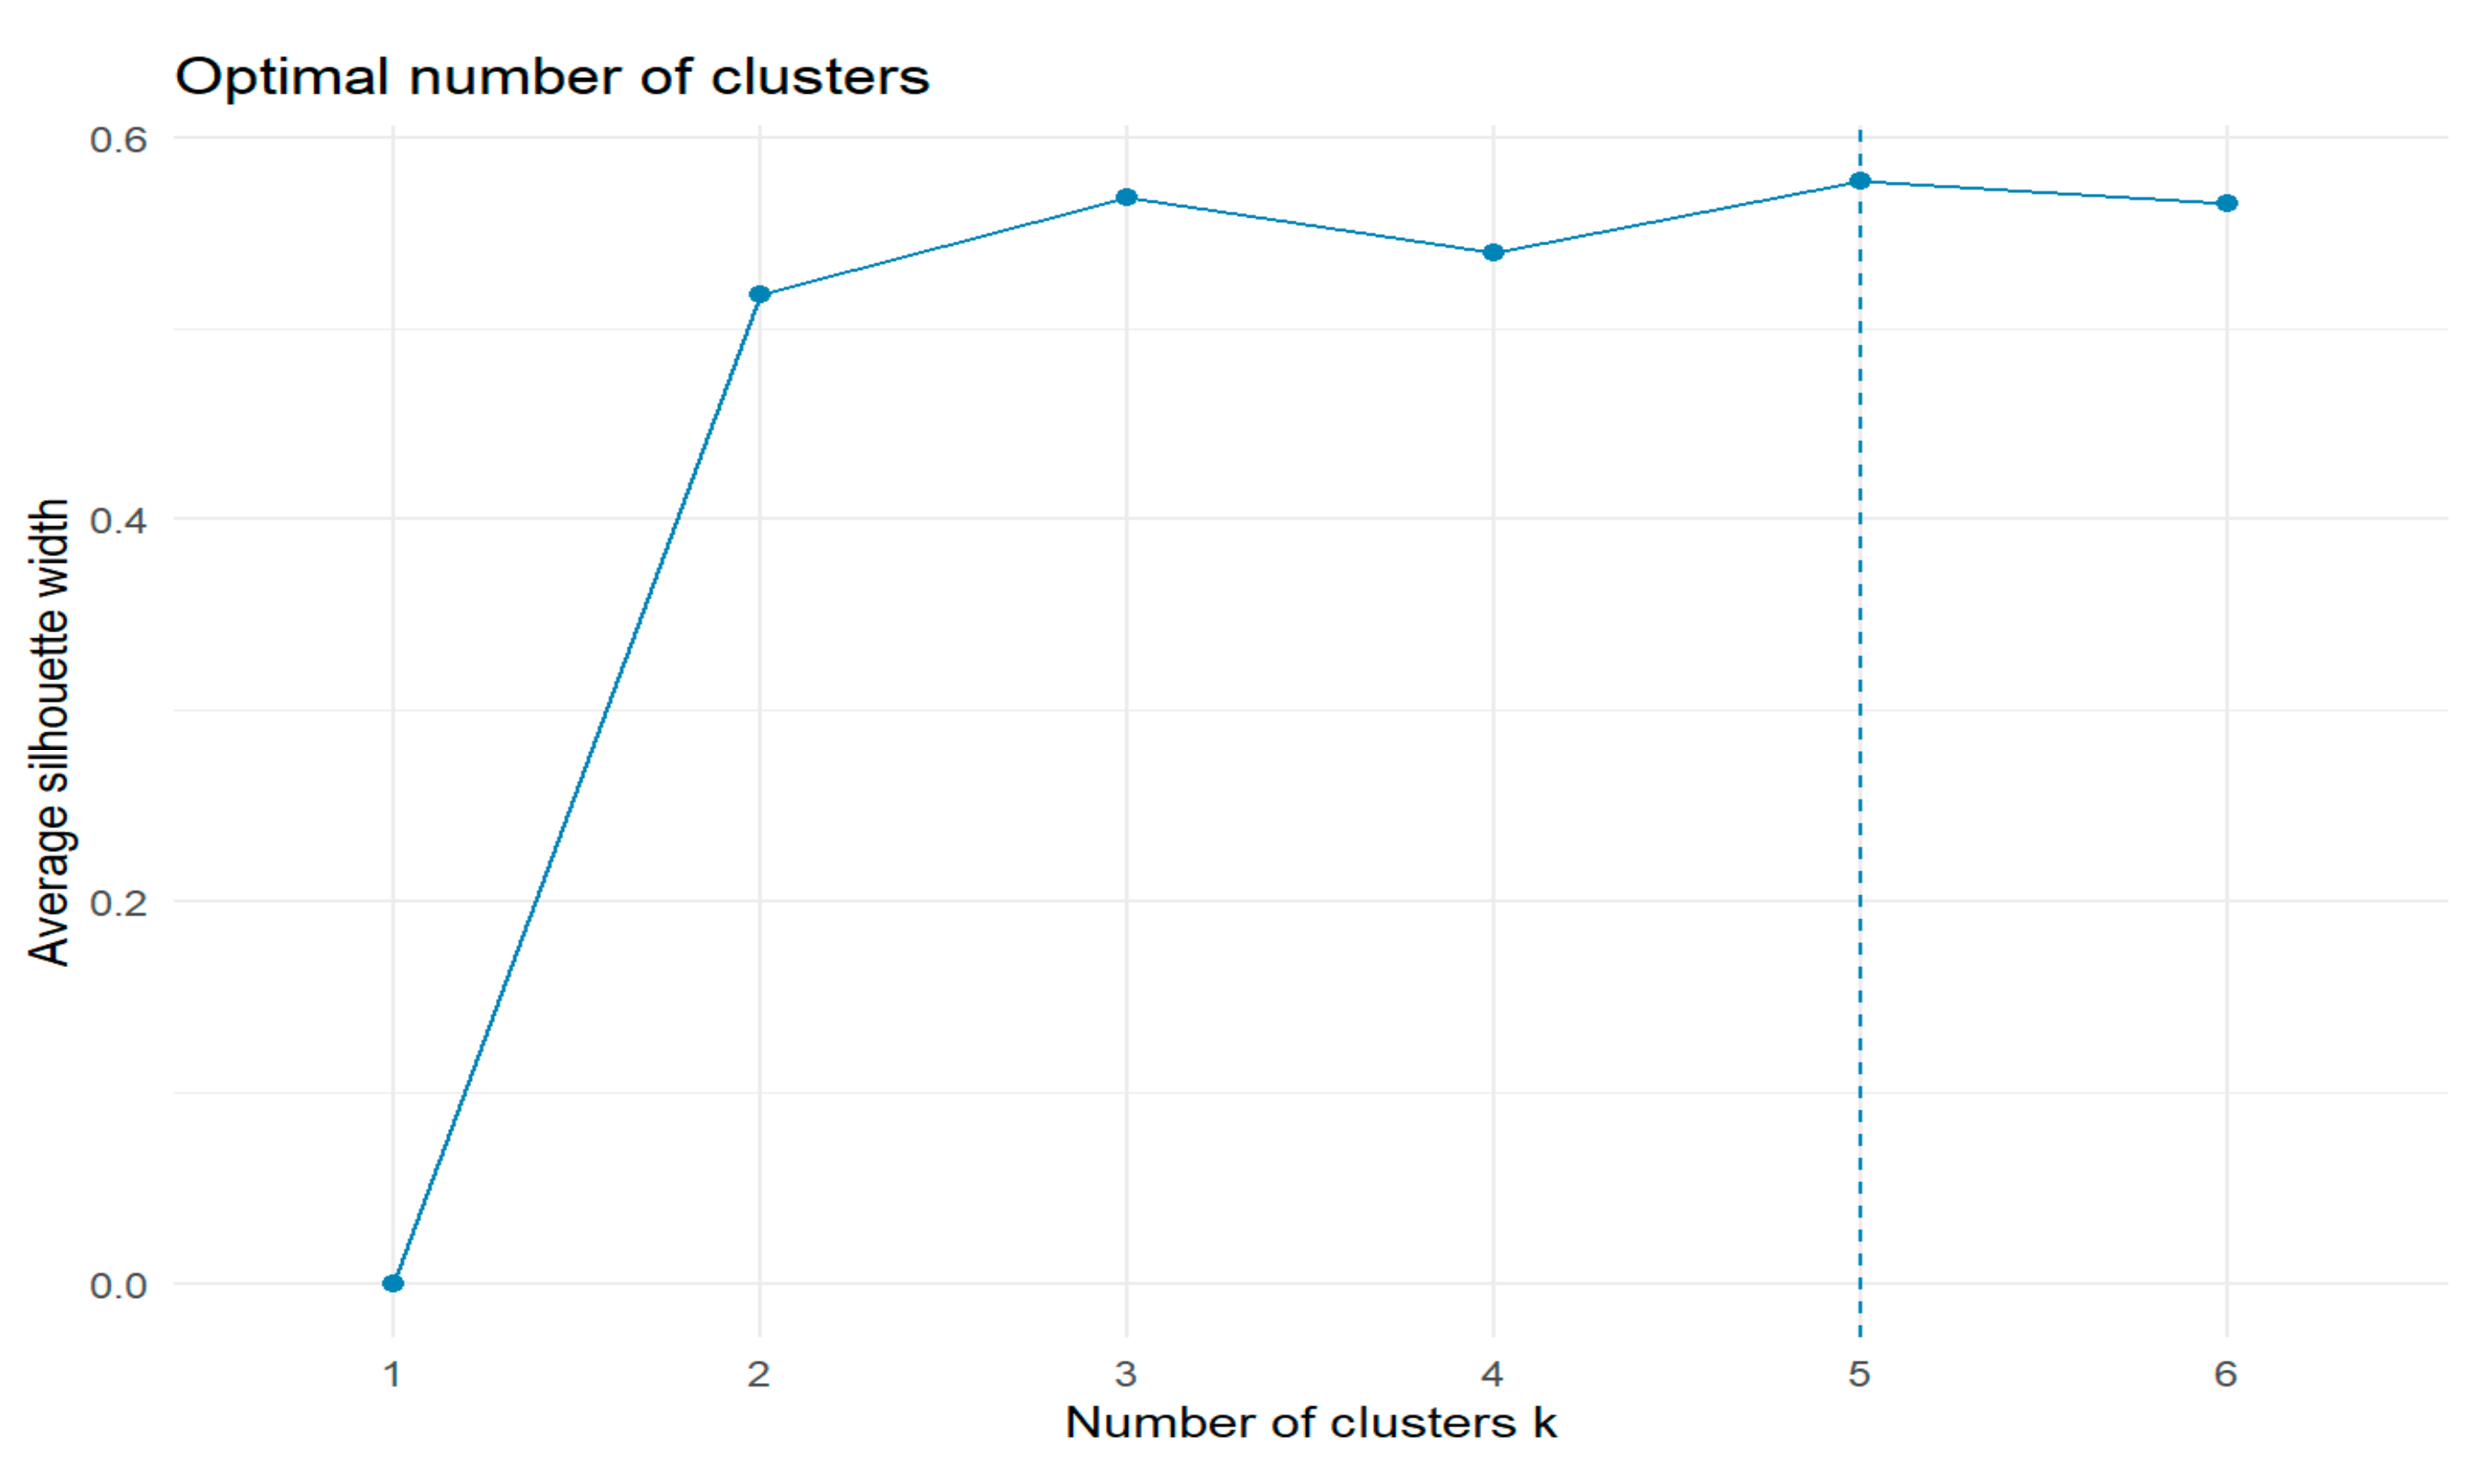
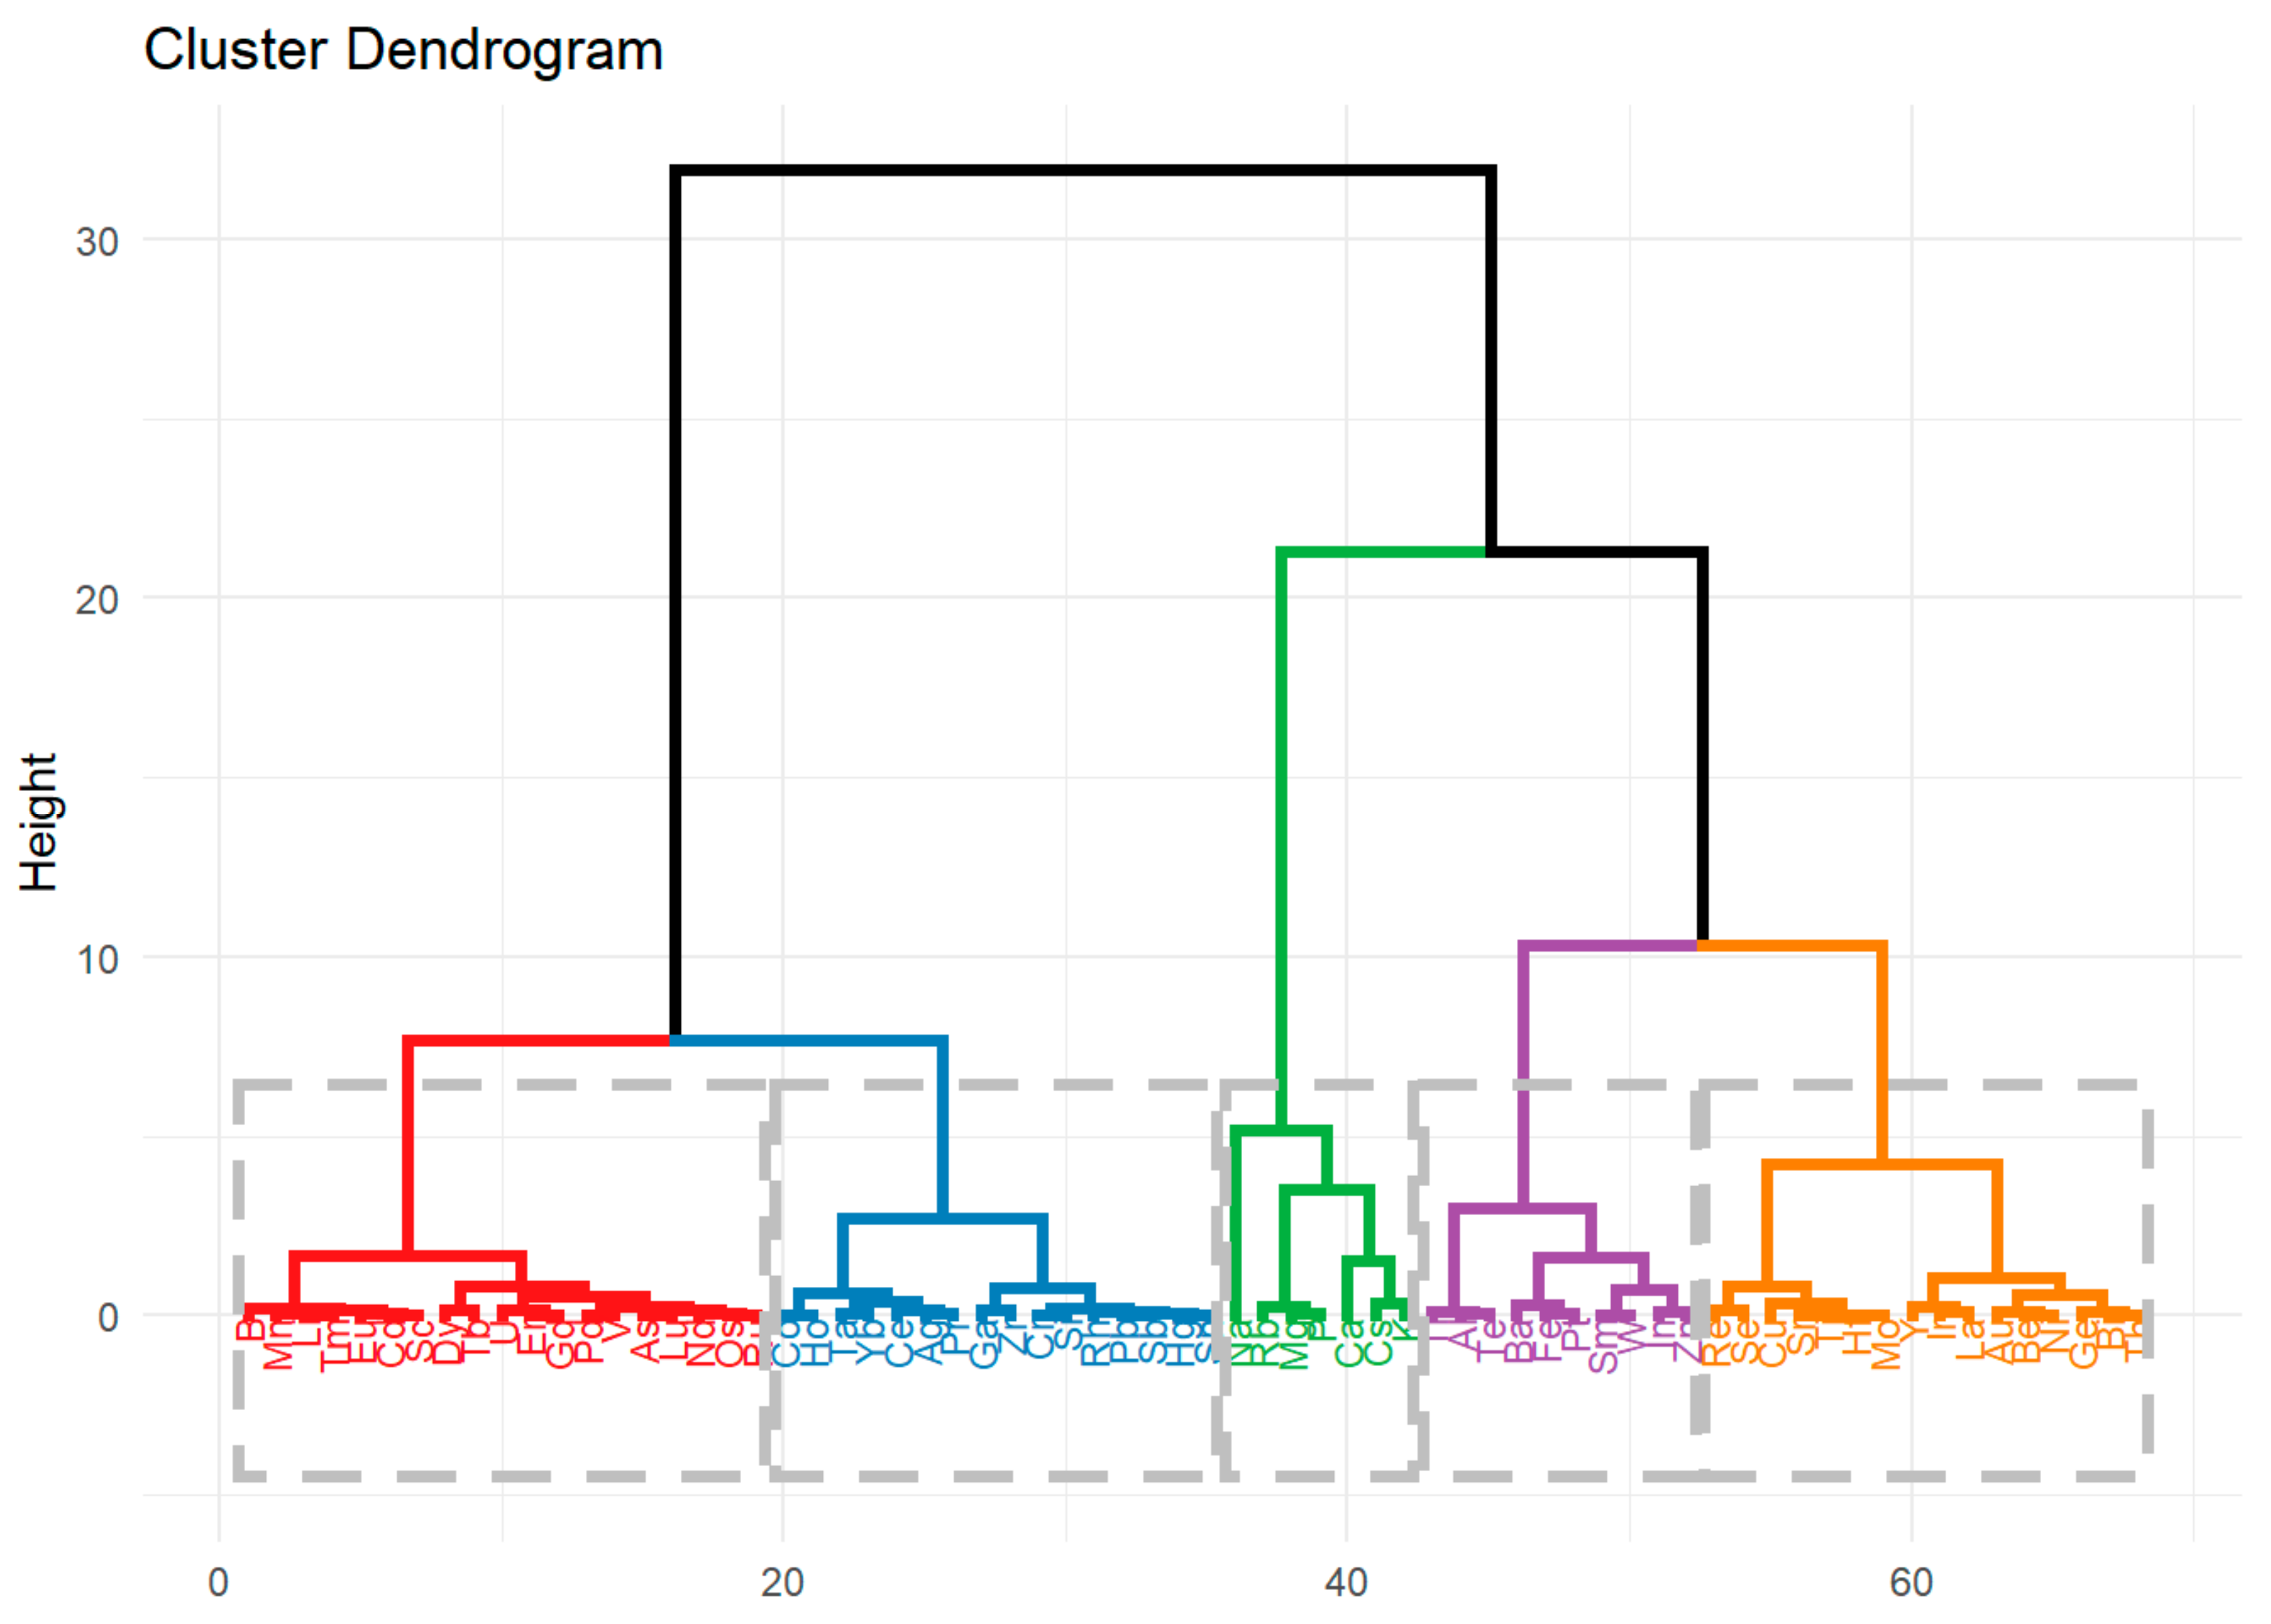
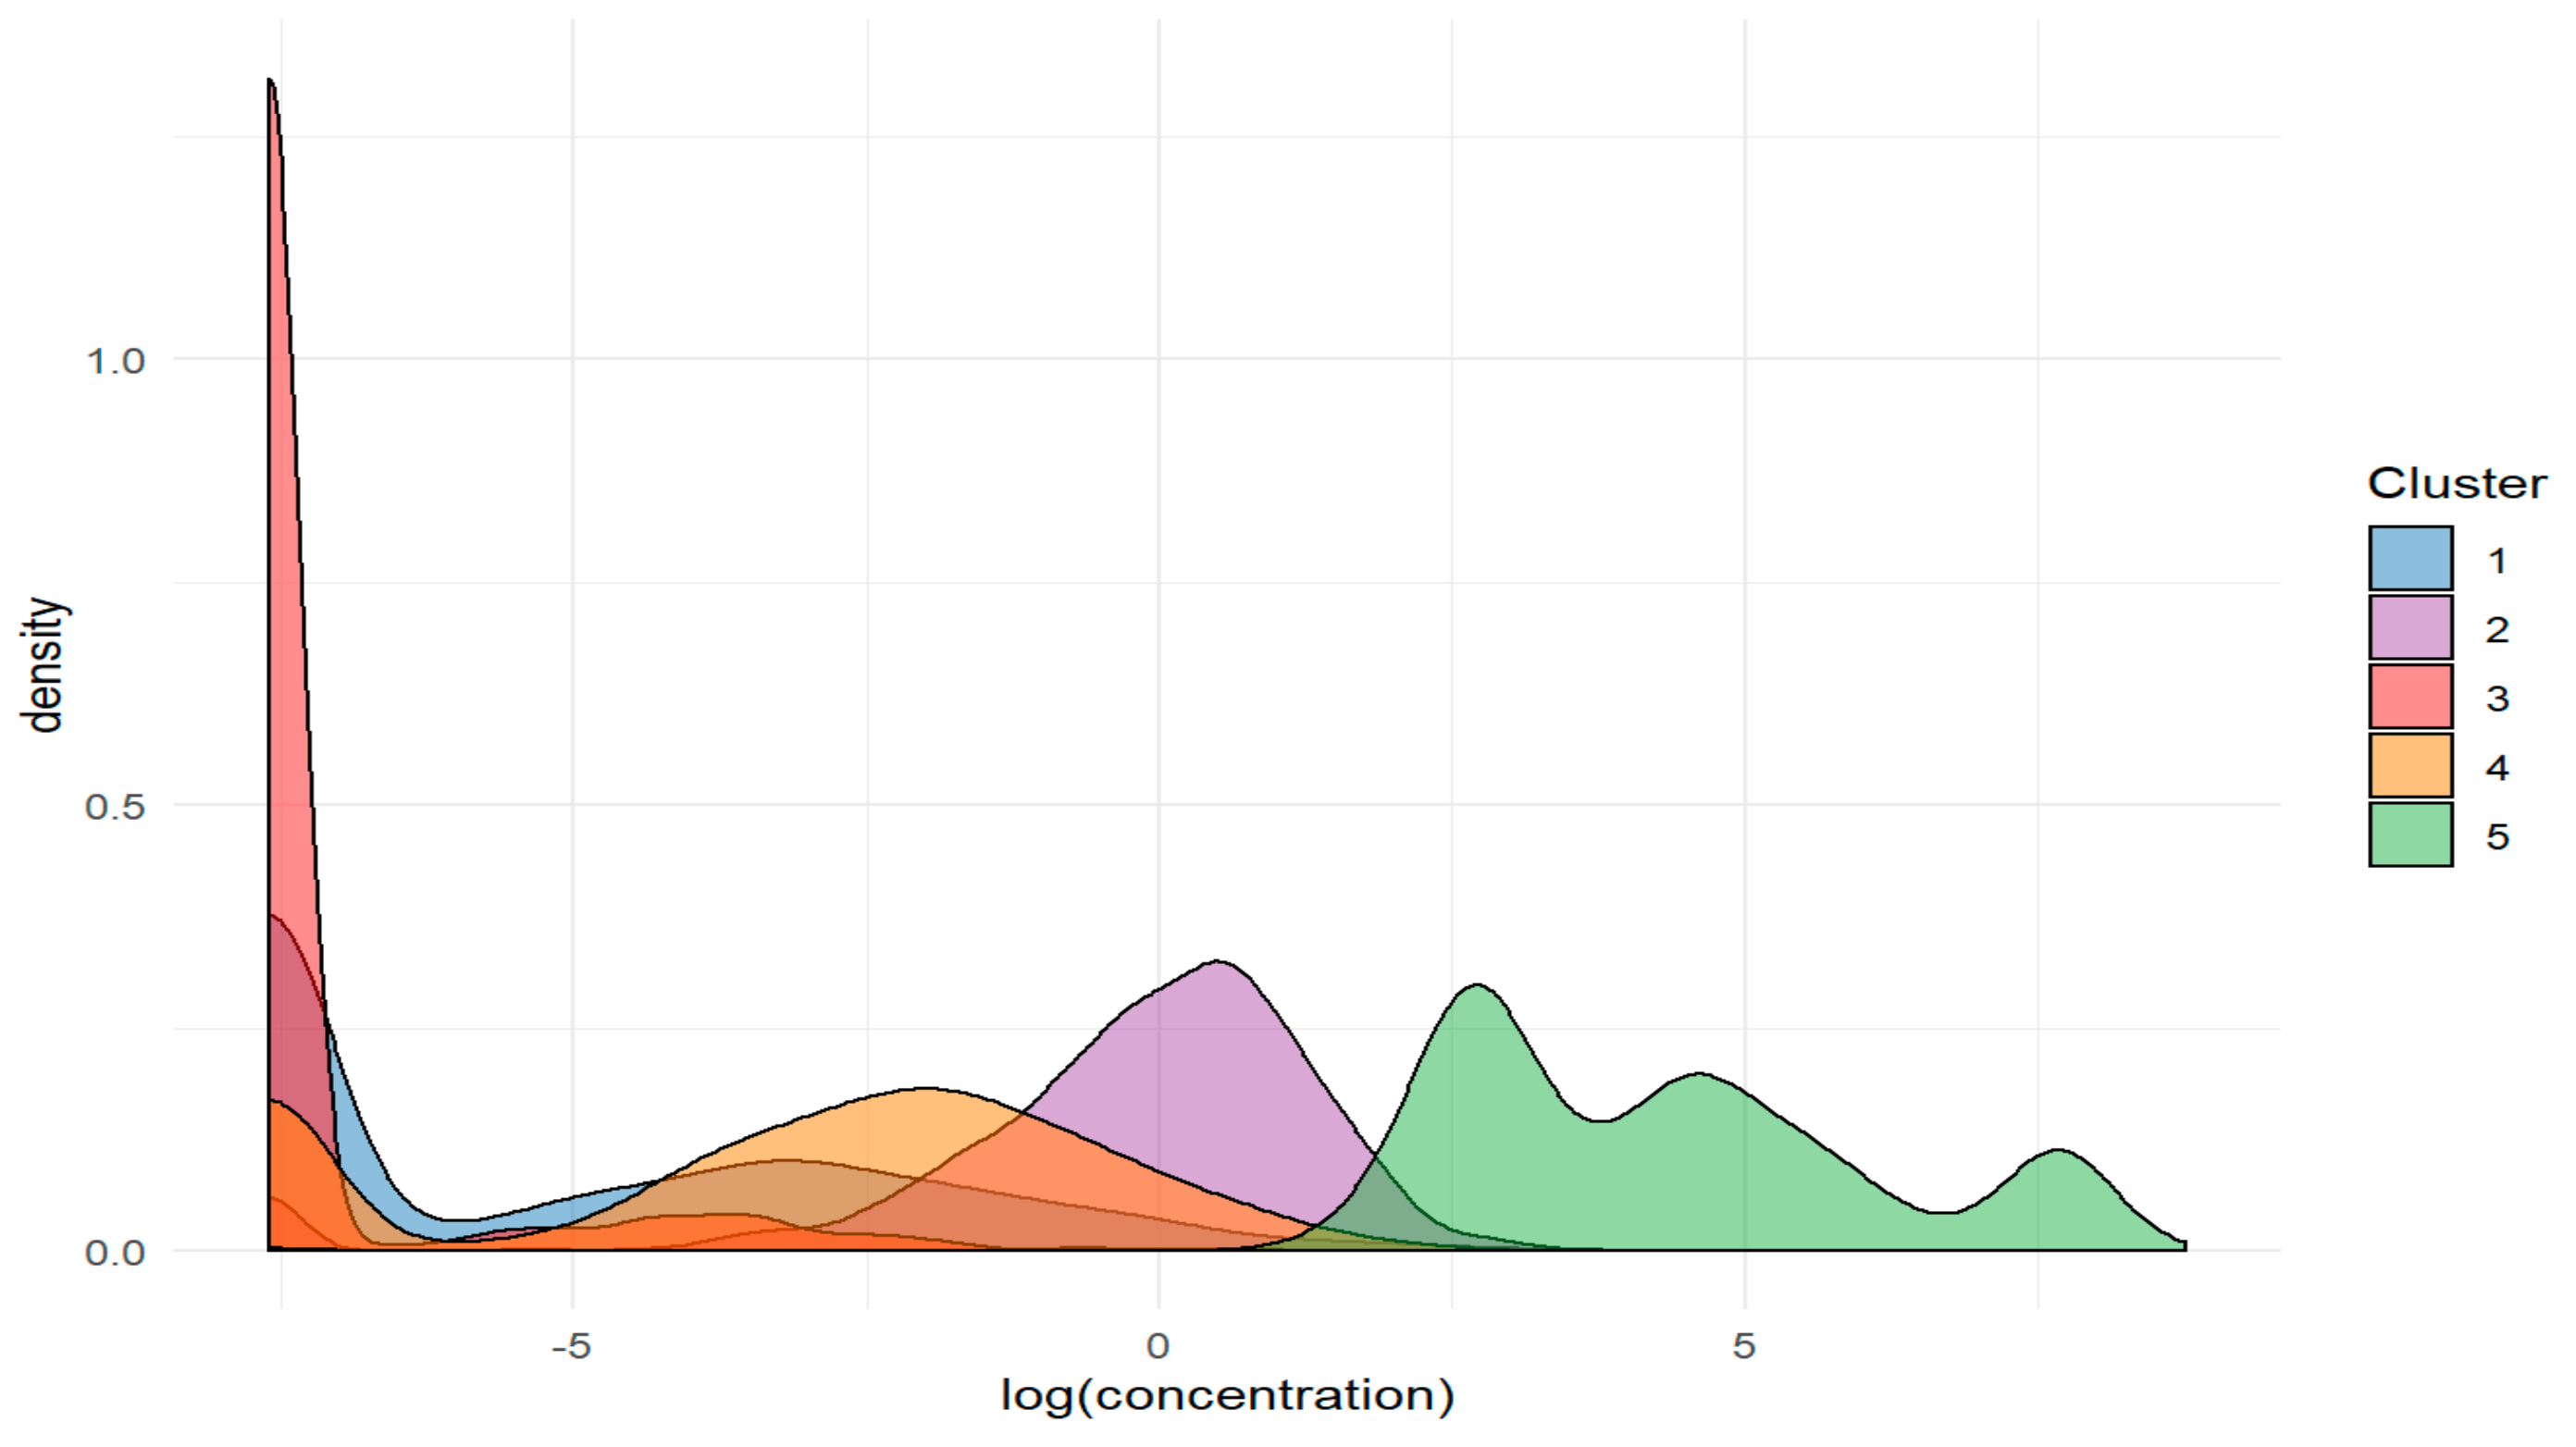
2.2.2. Division Based on Hierarchical Cluster Analysis

The second approach was based on a hierarchical cluster analysis. This method aims to divide the observations into k homogeneous groups, characterized by similar levels of characteristics describing them, while maximizing the dissimilarities between the groups. The similarity is measured by a Euclidean metric. In each step of the agglomerative hierarchical approach, an observation or a cluster of observations is merged into another cluster (the two closest clusters or observations are merged into a single new cluster). In this process, the number of clusters shrinks, and the clusters themselves grow larger. To measure the similarities between clusters, Ward’s method was used, which uses intra-group and inter-group variability [67].
Using this method for each observation separately, you can obtain a division in which the same element will be in two different groups because its concentration for one patient will be higher and lower for the other. Therefore, averaged logarithmized concentrations of individual elements were first used for all patients. As a result, a hard division of elements was obtained, which means that each element belongs to only one group.
The results of the hierarchical clustering are usually expressed by a dendrogram, on the basis of which it is estimated how many groups should be formed. There are also other methods for assessing the number of clusters, and for thus determining the distribution of observations into groups. One of them is the silhouette method (Figure 4) [68], which indicates that the division into 5 clusters will be good. However, both the silhouette criterion and dendrogram show that a division into 3 groups is also reasonable.
Based on hierarchical cluster analysis (Figure 5), the following division was obtained:
  • Cluster 1. - Ag, Ce, Co, Cr, Ga, Hg, Ho, Pb, Pr, Rh, Sb, Si, Sn, Ta, Yb, Zr,
  • Cluster 2. - Al, Ba, Fe, In, Pt, Sm, Te, Tl, W, Zn,
  • Cluster 3. - As, B, Cd, Dy, Er, Eu, Gd, Li, Lu, Mn, Nd, Os, Pd, Ru, Sc, Tb, Tm, U, V,
  • Cluster 4. - Au, Be, Bi, Cu, Ge, Hf, Ir, La, Mo, Ni, Re, Se, Sr, Th, Ti, Y,
  • Cluster 5. - Ca, Cs, K, Mg, Na, P, Rb.
It can be seen that the 5th cluster consists of elements of the highest concentration (see Table 2). Cluster 2 is made of elements with the second-highest concentration. The lowest element concentrations are in cluster 3 because both central tendency measures (median and mean) are minimal. The increasing order of the groups in view of the element concentrations is as follows: cluster 3, cluster 1, cluster 4, cluster 2, and cluster 5. The least homogenous group is cluster 5 because it has the largest variance. Moreover, as the level of concentration increases, its variance also increases.
The distribution of the averaged logarithm of the concentrations of elements can be described by the densities (Figure 6). Even after the aggregation of the logarithmized concentrations, the distributions are bimodal. Quite similar results are obtained if 3 clusters are chosen. In this case, clusters 1 and 3 are merged into one group, and clusters 2 and 4 are merged into another one.

3. Materials and Methods

3.1. Subjects

The research material consisted of the aqueous humor from the anterior chamber of the eye taken from patients undergoing cataract surgery in The Department of Retina and Vitreous Surgery at the Medical University of Lublin in Poland. The study was approved by the Local Bioethical Committee of the Medical University of Lublin (approval No. KE-0254/271/2019). The work has been carried out in accordance with The Code of Ethics of the World Medical Association (Declaration of Helsinki) for experiments involving humans. The samples were collected from 115 subjects (41 male, 74 female) at the beginning of the cataract extraction surgery.

3.2. Sample Preparation Procedure

The samples were stored in 1.5 mL polypropylene tubes at −80 °C until analysis. A wet mineralization of each sample was performed via the addition of 2 mL of 65% suprapur nitric acid HNO3 (Merck, Darmstadt, Germany), followed by heating to 180 °C in close Teflon containers in the microwave mineralization system Mars 6 (CEM, Matthews, NC, USA). Finally, the samples were diluted to 10 mL by ultrapure water obtained in the purification system Milli-Q (Millipore, Darmstadt, Germany).

3.3. Analytical Procedures

The inductively coupled plasma optical emission spectrometer Agilent 5110 ICP-OES (Agilent, Santa Clara, CA, USA) was employed for an elemental analysis. In doing so, the radio frequency (RF) power was 1.2 kW, the nebulizer gas flow was 0.7 L min−1, the auxiliary gas flow was 1.0 L min−1, the plasma gas flow was 12.0 L min−1, the charge coupled device (CCD) temperature was −40 °C, the viewing height for the radial plasma observation was 8 mm, while the accusation time was 5 s. The analysis was repeated three times. ICP commercial analytical standards (Romil, Cambridge, UK) were used for the calibration. The detection limits (LOD) were determined through 3-sigma criteria and were on the level of 0.001 (ppm) wet weight (w/w) for all elements determined. The uncertainty for the complete analytical process (including the sample preparation) was at the level of 20%. The traceability was assessed by a standard addition procedure. A recovery of 80–120% was considered acceptable for all the determined elements.

3.4. Statistical Analysis

All calculations and illustrations were done using statistical environment R Core Team 2019 [69] with necessary packages [70,71,72,73].

4. Conclusions

The role of metals in physiological and pathological processes has been of interest to scientists for years. According to recent works, metals also contribute to the pathogenesis and development of eye diseases. Until now, the morphological structures of the eyes were examined only for the content of selected metals, such as Co, Cd, Zn, Fe, Cu, Mn, and Se. This work is the first study that classifies all metals present in concentrations exceeding the detection limit of the ICP-OES determination method, i.e., 0.001 ppm, present in the fluid from the anterior chamber of the eye of patients undergoing cataract surgery. The analysis showed the existence of a statistically significant series of metals present at various concentration levels. The classification of elements was made by a hierarchical cluster analysis. The existence of 5 independent clusters was statistically justified. In the group of elements found at high concentration levels (cluster 5), the results obtained for phosphorus are noteworthy. While, the other elements belonging to this group are characterized by a fairly small coefficient of variation (29.572–72.705), phosphorus has a coefficient about twice as large, i.e., 158,792. There is, therefore, a significant variation in the levels of this element in the patient population being studied. In future research, therefore, particular attention should be paid to this element due to its effect on the calcium distribution and absorption of microelements in body fluids.
This study showed for the first time that patients with cataracts are characterized by elevated levels of very toxic elements in the anterior chamber fluid. Cluster number 2 contains, e.g., thallium and tellurium. The fifth cluster of elements with the highest concentration contains toxic cesium. Considering the fact that these metals, along with lead or aluminum (of known prevalence and toxicity) have a strong neurodegenerative potential, the observations made are clinically relevant. Among the toxic elements, the variability of the levels of Al (CV = 69.146), Cs (CV = 73.205), Te (CV = 68.316) and Tl (CV = 90.629) in the population is noteworthy, while the variability of Pb (CV = 220.678), Cd (507.174), and Bi (CV = 146.727) is definitely higher. This result illustrates the diversity of patients’ exposure to poisoning by these elements. Low levels of silicon with recognized protection properties against aluminum contamination and disturbed proportions of Cs–K, P–Ca, P–Mg, P–Fe, P–Cu, P–Zn were also found. The performed tests confirm the increased exposure of patients with cataracts to toxic elements.

Author Contributions

Conceptualization, J.D.-S.; A.Ś.; J.F.; M.T.-M., J.M.; Methodology, P.N.; J.P.; J.K.; Software, D.M.; Validation, P.N.; M.T.-M.; Investigation, P.N.; J.P.; J.K.; Writing—original draft preparation, J.F.; M.T.-M.

Funding

This research received no external funding.

Conflicts of Interest

The authors declare no conflict of interest.

References

  1. Pascolini, D.; Mariotti, S.P. Global estimates of visual impairment: 2010. Br. J. Ophthalmol. 2012, 96, 614–618. [Google Scholar]
  2. McCarty, C.A.; Keeffe, J.E.; Taylor, H.R. The need for cataract surgery: Projections based on lens opacity, visual acuity, and personal concern. Br. J. Ophthalmol. 1999, 83, 62–65. [Google Scholar]
  3. Chang, J.R.; Koo, E.; Agrón, E.; Hallak, J.; Clemons, T.; Azar, D.; Sperduto, R.D.; Ferris, F.L., 3rd; Chew, E.Y. Risk factors associated with incident cataract and cataract surgery in the Age-related Eye Disease Study (AREDS): AREDS report number 32. Ophthalmology 2011, 118, 2113–2119. [Google Scholar]
  4. Lydahl, E. Infrared radiation and cataract. Acta Ophthalmol. Suppl. 1984, 166, 1–63. [Google Scholar]
  5. Brian, G.; Taylor, H. Cataract blindness--challenges for the 21st century. Bull. World Health Organ. 2001, 79, 249–256. [Google Scholar]
  6. Ye, J.; He, J.; Wang, C.; Wu, H.; Shi, X.; Zhang, H.; Xie, J.; Lee, S.Y. Smoking and risk of age-related cataract: A meta-analysis. Invest. Ophthalmol. Vis. Sci. 2012, 53, 3885–3895. [Google Scholar]
  7. Langford-Smith, A.; Tilakaratna, V.; Lythgoe, P.R.; Clark, S.J.; Bishop, P.N.; Day, A.J. Age and Smoking Related Changes in Metal Ion Levels in Human Lens: Implications for Cataract Formation. PLoS ONE 2016, 11, e0147576. [Google Scholar] [CrossRef]
  8. Sigel, H. Metal Ions in Biological Systems: Inorganic Drugs in Deficiency and Disease; CRC Press: Boca Raton, FL, USA, 1982. [Google Scholar]
  9. Holm, R.H.; Kennepohl, P.; Solomon, E.I. Structural and Functional Aspects of Metal Sites in Biology. Chem. Rev. 1996, 96, 2239–2314. [Google Scholar]
  10. Lippard, S.J.; Berg, J.M. Principles of Bioinorganic Chemistry; University Science Books: Mill Valley, CA, USA, 1994. [Google Scholar]
  11. Cowan, J.A. Inorganic Biochemistry/An Introduction; Wiley-VCH Inc.: Hoboken, NJ, USA, 1994. [Google Scholar]
  12. Burtis, C.A.; Ashwood, R.E.; Bruns, D.E. Tietz Textbook of Clinical Chemistry, 2nd ed.; Saunders: Philadelphia, PA, USA, 1994. [Google Scholar]
  13. Gupta, S.P. Roles of metals in human health. MOJ Bioorg. Org. Chem. 2018, 2, 221–224. [Google Scholar]
  14. Sourkes, T.L. Influence of specific nutrients on catecholamine synthesis and metabolism. Pharmacol Rev. 1972, 24, 349–359. [Google Scholar]
  15. Paoletti, P.; Vergnano, A.M.; Barbour, B.; Casado, M. Zinc at glutamatergic synapses. Neuroscience 2009, 158, 126–136. [Google Scholar]
  16. Corona, C.; Pensalfini, A.; Frazzini, V.; Sensi, S.L. New therapeutic targets in Alzheimer’s disease: Brain deregulation of calcium and zinc. Cell Death Dis. 2011, 2, e176. [Google Scholar]
  17. Südhof, T.C. Calcium control of neurotransmitter release. Cold Spring Harb Perspect Biol. 2012, 4, a011353. [Google Scholar]
  18. Sigel, A.; Sigel, H.; Sigel, R.K.O. Neurodegenerative Diseases and Metal Ions: Metal Ions in the Life Sciences; Springer: West Sussex, UK, 2006; Volume 1. [Google Scholar]
  19. DeToma, A.S.; Salamekh, S.; Ramamoorthy, A.; Lim, M.H. Misfolded proteins in Alzheimer’s disease and type II diabetes. Chem Soc Rev. 2012, 41, 608–621. [Google Scholar]
  20. Pithadia, A.S.; Lim, M.H. Metal-associated amyloid-β species in Alzheimer’s disease. Curr. Opin. Chem. Biol. 2012, 16, 67–73. [Google Scholar]
  21. Kepp, K.P. Bioinorganic chemistry of Alzheimer’s disease. Chem. Rev. 2012, 112, 5193–5239. [Google Scholar]
  22. Savelieff, M.G.; Lee, S.; Liu, Y.; Lim, M.H. Untangling amyloid-β, tau, and metals in Alzheimer’s disease. ACS Chem. Biol. 2013, 8, 856–865. [Google Scholar]
  23. Bisaglia, M.; Tessari, I.; Mammi, S.; Bubacco, L. Interaction between alpha-synuclein and metal ions, still looking for a role in the pathogenesis of Parkinson’s disease. Neuromolecular Med. 2009, 11, 239–251. [Google Scholar]
  24. Dexter, D.T.; Jenner, P.; Schapira, A.H.; Marsden, C.D. Alterations in levels of iron, ferritin, and other trace metals in neurodegenerative diseases affecting the basal ganglia. The Royal Kings and Queens Parkinson’s Disease Research Group. Ann. Neurol. 1992, 32, S94–S100. [Google Scholar]
  25. Kass, D.K.; Heuer, E.J.; Higginbotham, C.A.; Johnson, J.L.; Keltner, J.P.; Parrish, R.K., 2nd; Wilson, M.R.; Gordon, M.O. The ocular hypertension treatment study: A randomized trial determines that topical ocular hypotensive medication delays or prevents the onset of primary open-angle glaucoma. Arch. Ophthalmol. 2002, 120, 829–830. [Google Scholar] [CrossRef]
  26. Junemann, A.G.M.; Stopa, P.; Michalke, B.; Chaudhri, A.; Reulbach, U.; Cord Huchzermeyer, C.; Schlotzer-Schrehardt, U.; Kruse, F.E.; Zrenner, E.; Rejdak, R. Levels of Aqueous Humor Trace Elements in Patients with Non-Exsudative Age-related Macular Degeneration: A Case-control Study. PLoS ONE 2013, 8, e56734. [Google Scholar] [CrossRef]
  27. DeToma, A.S.; Dengler-Crish, C.M.; Deb, A.; Braymer, J.J.; Penner-Hahn, J.E.; van der Schyf, C.J.; Lim, M.H.; Crish, S.D. Abnormal metal levels in the primary visual pathway of the DBA/2J mouse model of glaucoma. Biometals 2014, 27, 1291–1301. [Google Scholar]
  28. Hohberger, B.; Chaudhri, M.A.; Michalke, B.; Lucio, M.; Nowomiejska, K.; Schlötzer-Schrehardt, U.; Grieb, P.; Rejdak, R.; Jünemann, A.G.M. Levels of aqueous humor trace elements in patients with open-angle Glaucoma. J. Trace Elem. Med. Biol. 2018, 45, 150–155. [Google Scholar]
  29. Akyol, N.; Deger, O.; Keha, E.E.; Kilic, S. Aqueous-humorand serum zinc and copper concentrations of patients with glaucoma and cataract. Br. J. Ophthalmol. 1990, 4, 661–662. [Google Scholar]
  30. Erie, J.C.; Butz, J.A.; Good, J.A.; Erie, E.A.; Burritt, M.F.; Cameron, J.D. Heavy Metal Concentrations in Human Eyes. Am. J. Ophthalmol. 2005, 139, 888–893. [Google Scholar]
  31. Schmeling, M.; Gaynes, B.I.; Tidow-Kebritchi, S. Heavy metal analysis in lens and aqueous humor of cataract patients by total reflection X-ray fluorescence spectrometry. Powder Diffr. 2014, 29, 155–158. [Google Scholar]
  32. Bauer, G.; Neouze, M.A.; Limbeck, A. Dispersed particle extraction — A new procedure for trace element enrichment from natural aqueous samples with subsequent ICP-OES analysis. Talanta 2013, 103, 145–152. [Google Scholar]
  33. Janski, R.; Neouze, M.A.; Limbeck, A. Determination of rare earth elements in saline matrices using dispersed particle extraction and inductively coupled plasma mass spectrometry. Rapid Commun. Mass Spectrom. 2014, 28, 1329–1337. [Google Scholar]
  34. Nischkauer, W.; Neouze, M.A.; Vanhaecke, F.; Limbeck, A. Extraction and pre-concentration of platinum and palladium from microwave-digested road dust via ion exchanging mesoporous silica microparticles prior to their quantification by quadrupole ICP-MS. Microchim. Acta 2015, 182, 2369–2376. [Google Scholar]
  35. Hosseinzadegan, S.; Nischkauer, W.; Bica, K.; Limbeck, A. Bioparticles coated with an ionic liquid for the pre-concentration of rare earth elements from microwave-digested tea samples and the subsequent quantification by ETV-ICP-OES. Anal. Methods 2016, 8, 7808–7815. [Google Scholar]
  36. Hosseinzadegan, S.; Nischkauer, W.; Bica, K.; Limbeck, A. FI-ICP-OES determination of Pb in drinking water after pre-concentration using magnetic nanoparticles coated with ionic liquid. Microchem. J. 2019, 146, 339–344. [Google Scholar]
  37. Yu, X.; Liu, C.; Guo, Y.; Deng, T. Speciation Analysis of Trace Arsenic, Mercury, Selenium and Antimony in Environmental and Biological Samples Based on Hyphenated Techniques. Molecules 2019, 24, 926–940. [Google Scholar]
  38. Marcinkowska, M.; Barałkiewicz, D. Multielemental speciation analysis by advanced hyphenated technique – HPLC/ICP-MS: A review. Talanta 2016, 161, 177–204. [Google Scholar]
  39. Sperling, M.; Kars, U. Advances in speciation techniques and methodology. Trends Anal. Chem. 2018, 104, 1–3. [Google Scholar]
  40. Donati, G.L.; Amais, R.S.; Williams, C.B. Recent advances in inductively coupled plasma optical emission spectrometry. J. Anal. At. Spectrom. 2017, 32, 1283–1296. [Google Scholar]
  41. McSheehy, S.; Sperling, M. Hyphenated ICP-MS Techniques for Speciation Analysis. Spectroscopy 2009, 24, 1–2. [Google Scholar]
  42. Sessions, D.; Heard, K.; Kosnett, M. Fatal Cesium Chloride Toxicity After Alternative Cancer Treatment. J. Altern. Complement. Med. 2013, 19, 973–975. [Google Scholar]
  43. Jaworowski, Z. Jak to z Czarnobylem było. Wiedza i Życie 1996, 5, 24–31. [Google Scholar]
  44. Gómez-Ayala, A.E.; Lisbona, F.; López-Aliaga, I.; Pallarés, I.; Barrionuevo, M.; Hartiti, S.; Rodríguez-Matas, M.C.; Campos, M.S. The absorption of iron, calcium, phosphorus, magnesium, copper and zinc in the jejunum-ileum of control and iron-deficient rats. Lab Anim. 1998, 32, 72–79. [Google Scholar]
  45. Chaussidon, M.; Netter, P.; Kessler, M.; Membre, H.; Fener, P.; Delons, S.; Albarède, F. Dialysis-associated arthropathy: Secondary ion mass spectrometry evidence of aluminum silicate in β-microglobulin amyloid synovial tissue and articular cartilage. Nephron 1993, 65, 559–563. [Google Scholar]
  46. Muma, N.A.; Singer, S.M. Aluminum-induced neuropathology: Transient changes in microtubule-associated proteins. Neurotoxicol. Teratol. 1996, 18, 679–690. [Google Scholar]
  47. Murayama, H.; Shin, R.W.; Higuchi, J.; Shibuya, S.; Muramoto, T.; Kitamoto, T. Interaction of aluminum with PHFtau in Alzheimer’s disease neurofibrillary degeneration evidenced by desferrioxamine-assisted chelating autoclave method. Am. J. Pathol. 1999, 155, 877–885. [Google Scholar]
  48. Uversky, V.N.; Fink, A.L. Metal-triggered structural transformations, aggregation, and fibrillation of human α-synuclein: A possible molecular link between parkinson’s disease and heavy metal exposure. J. Biol. Chem. 2001, 276, 44284–44296. [Google Scholar]
  49. Khan, A.; Ashcroft, A.E.; Korchazhkina, O.V.; Exley, C. Metal-mediated formation of fibrillar ABri amyloid. J. Inorg. Biochem. 2004, 98, 2006–2010. [Google Scholar]
  50. Rodella, L.F.; Ricci, F.; Borsani, E.; Stacchiotti, A.; Foglio, E.; Favero, G.; Rezzani, R.; Mariani, C.; Bianchi1, R. Aluminium exposure induces Alzheimer’s disease-like histopathological alterations in mouse brain. Histol. Histopathol. 2008, 23, 433–439. [Google Scholar]
  51. Grochowski, C.; Blicharska, E.; Bogucki, J.; Proch, J.; Mierzwińska, A.; Baj, J.; Litak, J.; Podkowiński, A.; Flieger, J.; Teresiński, G.; et al. Increased Aluminum Content in Certain Brain Structures is Correlated with Higher Silicon Concentration in Alcoholic Use Disorder. Molecules 2019, 24, 1721–1732. [Google Scholar]
  52. Exley, C.; Chappell, J.S.; Birchall, J.D. A mechanism for acute aluminium toxicity in fish. J. Theor. Biol. 1991, 151, 417–428. [Google Scholar]
  53. Edwardson, J.A.; Moore, P.B.; Ferrier, I.N.; Lilley, J.S.; Newton, G.W.A.; Barker, J.; Templar, J.; Day, J.P. Effect of silicon on gastrointestinal absorption of aluminium. Lancet 1993, 342, 211–212. [Google Scholar]
  54. Vanek, A.; Chrastny, V.; Komarek, V.; Penizek, V.; Teper, L.; Cabala, J.; Drabek, O. Geochemical position of thallium in soils from a smelter-impacted area. J. Geochem. Explor. 2013, 124, 176–182. [Google Scholar]
  55. Lukaszewski, Z.; Jakubowska, M.; Zembrzuski, W.; Pasieczna, A.; Karbowska, B. Flow-Injection Differential-Pulse Anodic Stripping Voltammetry as a Tool for Thallium Monitoring in the Environment. Electroanalysis 2010, 22, 1963–1966. [Google Scholar]
  56. John Peter, A.L.; Viraraghavan, T. Thallium: A review of public health and environmental concerns. Environ. Int. 2005, 31, 493–501. [Google Scholar]
  57. Leung, K.M.; Ooi, V.E.C. Studies on thallium toxicity, its tissue distribution and histopathological effects in rats. Chemosphere 2000, 41, 155–159. [Google Scholar]
  58. Spano, N.; Panzanelli, A.; Piu, P.C.; Pilo, M.I.; Sanna, G.; Seeber, R.; Tapparo, A. Anodic stripping voltammetric determination of traces and ultratraces of thallium at a graphite microelectrode Method development and application to environmental waters. Anal. Chim. Acta 2005, 553, 201–207. [Google Scholar]
  59. Sabbioni, E.; Minoia, C.; Ronchi, A.; Hansen, B.G.; Pietra, R.; Balducci, C. Trace Element Reference Vlues in Tissues from Inhabitants of The European Union. VIII Thallium in the Italian Population. Sci. Total Environ. 1994, 58, 227–236. [Google Scholar]
  60. Emsley, J. Thallium. In The Elements of Murder: A History of Poison; Oxford University Press: Oxford, UK, 2006. [Google Scholar]
  61. Nordberg, G.F.; Fowler, B.A.; Nordberg, M.; Friberg, L. (Eds.) Handbook on the Toxicology of Metals, 3rd ed.; Elsevier: Oxford, UK, 2007. [Google Scholar]
  62. Gareth, J.; Witten, D.; Hastie, T.; Tibshirani, R. (Eds.) An Introduction to Statistical Learning: With Applications in R. Book; Springer: New York, NY, USA, 2015. [Google Scholar]
  63. Murray, L. Biostatistical Design and Analysis Using R: A Practical Guide; Wiley-Blackwell: Chichester, UK, 2010. [Google Scholar]
  64. Everitt, B.S. Cluster Analysis; Wiley Series in Probability and Statistics; John Wiley & Sons: Chichester, UK, 2011. [Google Scholar]
  65. Montgomery, D.C.; Runger, G.C. Applied Statistics and Probability for Engineers; John Wiley & Sons: Hoboken, NJ, USA, 2011. [Google Scholar]
  66. Scheffe, H. The Analysis of Variance; John Wiley & Sons: New York, NY, USA, 1999; Volume 72. [Google Scholar]
  67. Ward, J.H. Hierarchical Grouping to Optimize an Objective Function. J. Am. Stat. Assoc. 1963, 58, 236–244. [Google Scholar] [CrossRef]
  68. Rousseeuw, P.J. Silhouettes: A Graphical Aid to the Interpretation and Validation of Cluster Analysis. J. Comput. Appl. Math. 1987, 20, 53–65. [Google Scholar]
  69. R Core Team. R: A Language and Environment for Statistical Computing; R Foundation for Statistical Computing: Vienna, Austria, 2019. [Google Scholar]
  70. Kassambara, A.; Mundt, F. Factoextra: Extract and Visualize the Results of Multivariate Data Analyses (1.0.4 ed.) R Package. CRAN. Available online: http://www.sthda.com/english/rpkgs/factoextra (accessed on 1 September 2019).
  71. Hadley, W. Ggplot2: Elegant Graphics for Data Analysis; Springer: New York, NY, USA, 2016. [Google Scholar]
  72. Hadley, W. Tidyverse: Easily Install and Load the ‘Tidyverse’. 2017. Available online: https://CRAN.R-project.org/package=tidyverse (accessed on 1 September 2019).
  73. Xie, Y. Dynamic Documents with R and Knitr, 2nd ed.; Chapman; Hall/CRC: Boca Raton, FL, USA, 2015. [Google Scholar]
Sample Availability: Samples of the compounds are available from the authors.
Figure 1. Radar charts show the content of selected elements in the aqueous humor of patients with cataracts.
Molecules 24 04127 g001
Figure 2. Distribution of the (a) raw and (b) transformed concentration of Ca. The transformed version is more symmetric.
Molecules 24 04127 g002
Figure 3. The distributions of the transformed concentrations of elements.
Molecules 24 04127 g003
Figure 4. Silhouette criterion plot.
Molecules 24 04127 g004
Figure 5. Dendrogram of the averaged logarithm of the concentrations of elements.
Molecules 24 04127 g005
Figure 6. The densities of the element concentration in clusters.
Molecules 24 04127 g006
Table 1. Element concentrations’ descriptive statistics.
Element/Wavelength [nm]BDL
(n)
ADL
(n)
Mean
[ppm]
SDMedian
[ppm]
Min.
[ppm]
Max
[ppm]
Range
[ppm]
CV
Ag/328.06853620.0140.0270.0030.0000.1910.191193.898
Al/396.15201152.4271.6781.9480.02912.44912.42069.146
As/188.98010690.0970.4190.0000.0003.0713.071434.053
Au/197.74259561.6582.6400.0000.00011.28411.284159.214
B/249.77211500.0000.0000.0000.0000.0000.0000.000
Ba/455.40301153.5474.5512.8690.00525.46125.456128.288
Be/313.04271080.0380.0290.0330.0000.1760.17576.811
Bi/223.06149660.2760.4040.0900.0003.0033.002146.727
Ca/422.6730115294.508162.330259.18398.9811161.1751062.19455.119
Cd/214.43911050.0020.0110.0000.0000.0940.094507.174
Ce/446.02160550.0230.0520.0000.0000.3820.381224.203
Co/238.89282330.0390.0820.0000.0000.3970.397210.387
Cr/267.71638770.0410.1140.0150.0001.1711.170280.103
Cs/697.327211389.74265.69571.6840.000350.000350.00073.205
Cu/327.39501150.1540.1280.1170.0291.0210.99183.088
Dy/364.54075400.0060.0110.0000.0000.0570.057171.710
Er/349.91097180.0030.0080.0000.0000.0370.037256.549
Eu/420.504100140.0010.0020.0000.0000.0190.018199.784
Fe/238.20411141.6924.6490.5930.00042.72742.726274.763
Ga/294.36363520.0690.1330.0000.0000.8470.846193.997
Gd/342.24696190.0030.0080.0000.0000.0550.054274.318
Ge/209.42654610.4770.9570.0480.0006.5536.553200.517
Hf/264.141121030.2230.2040.1660.0001.2741.27491.585
Hg/194.16461540.1900.4560.0000.0004.3034.302239.589
Ho/348.48474410.0210.0510.0000.0000.3820.381238.256
In/230.60622931.1191.1380.7410.0005.1295.128101.660
Ir/205.11663510.7271.1000.0000.0005.0985.098151.379
K/769.8971114108.81079.11194.2190.000539.796539.79572.705
La/398.85251100.0180.0120.0160.0000.0700.06966.576
Li/670.78311230.0170.1710.0000.0001.8371.8361026.729
Lu/307.76090250.0030.0070.0000.0000.0440.044234.920
Mg/285.213011516.9595.11516.0414.52535.59431.06930.159
Mn/257.61011230.0010.0030.0000.0000.0340.034351.520
Mo/202.032131020.2830.3610.1880.0002.0422.042127.379
Na/588.99501152176.450643.6242199.520697.7106430.3285732.61829.572
Nd/406.10897180.0070.0200.0000.0000.1130.113278.466
Ni/231.60440750.2500.4060.1250.0002.5332.533162.504
Os/225.58598170.0170.0630.0000.0000.4720.472379.535
P/213.618011519.73431.33614.0252.742329.010326.269158.792
Pb/220.35371440.6151.3580.0000.0008.8338.832220.678
Pd/340.45893220.0170.0860.0000.0000.8930.892507.677
Pr/417.93965500.0180.0350.0000.0000.2070.207189.612
Pt/203.64641111.4181.2931.0830.0007.1857.18591.241
Rb/780.026011514.5519.16712.3843.52756.82653.29963.001
Re/197.24833820.5170.7100.2830.0005.1725.171137.156
Rh/343.48846690.0620.0830.0290.0000.4380.438134.481
Ru/240.27298170.0190.0810.0000.0000.7680.768420.936
Sb/206.83468470.3410.7190.0000.0005.4075.407211.004
Sc/361.38310870.0020.0110.0000.0000.1000.099506.182
Se/196.02638770.6090.6970.4180.0002.6872.687114.311
Si/288.15878371.9864.6900.0000.00026.10226.102236.114
Sm/442.43481070.8400.6850.7460.0004.2534.25281.588
Sn/283.99864510.2270.3680.0000.0001.3401.340161.961
Sr/460.73311140.1220.0760.1120.0000.4780.47862.245
Ta/268.51772430.0720.1500.0000.0001.0441.043208.023
Tb/350.91485300.0080.0170.0000.0000.1140.114225.447
Te/214.28201152.6721.8262.1590.2368.4048.16868.316
Th/283.73038770.1370.1980.0610.0001.2941.294144.333
Ti/336.12201150.1220.1400.0900.0251.3501.325114.598
Tl/190.79431123.1012.8102.0810.00016.94316.94390.629
Tm/336.26111140.0030.0170.0000.0000.1800.180652.877
U/385.95710780.0060.0240.0000.0000.1840.183399.184
V/292.40188270.0070.0230.0000.0000.1720.171316.212
W/207.912111041.1481.6020.7680.00011.29611.296139.611
Y/361.104151000.0240.0230.0180.0000.1090.10897.013
Yb/328.93720930.0060.0060.0050.0000.0290.02896.014
Zn/213.85701150.3570.5200.2340.0255.1635.138145.568
Zr/343.82335800.0200.0250.0120.0000.1620.162128.335
Abbreviations: BDL - Below detection level, ADL - Above detection level, n - Number of subjects, Range - (max - min), SD - standard deviation.
Table 2. Element concentrations [ppm] descriptive statistics.
GroupMin.MedianMeanMax.SD
1
2
3
4
5
0
0
0
0
0
0.000
1.071
0.000
0.072
62.918
0.234
1.832
0.012
0.352
388.679
26.102
42.727
3.071
11.284
6430.328
1.329
2.685
0.111
0.904
778.327

