Abstract
Tagetespatula L. is a widely cultivated herbal medicinal plant in China and other countries. In this study, two new 2, 3-dihydrobenzofuran glucosides (1, 2) and fourteen known metabolites (3–16) were isolated from the stems and leaves of T. patula (SLT). The chemical structures of the isolated compounds were characterized comprehensively based on one- and two-dimensional NMR spectroscopy and high resolution mass spectrometry. Absolute configurations of compounds 1 and 2 were determined by ECD calculations. Compounds 1 and 2 exhibited moderate in vitro inhibitory activities against human gastric cancer cell lines (AGS) with IC50 values of 41.20 μmol/L and 30.43 μmol/L, respectively. The fingerprint profiles of stems and leaves of T. patula with three color types of flowers (Janie Yellow Bright, Jinmen Orange, Shouyao Red and Yellow color) were established by high-performance liquid chromatography (HPLC). Ten different batches of stems and leaves were examined as follow: Shouyao Red and Yellow color (1, 2, 3), Janie Yellow Bright (4, 5, 6, 7) and Jinmen Orange (8, 9, 10). Twenty-two common peaks were identified with similarity values ranging from 0.910 to 0.977. Meanwhile, the average peak area of SLT in the three types of flowers was different and it was the highest in Janie Yellow Bright.
1. Introduction
Tagetes genus belongs to the family Compositae (Asteraceae) and comprises about 55 different species including Tagetespatula Linn. (French marigold) which is an annual well-known ornamental and medicinal plant distributed worldwide [1]. T. patula, which first originated in Mexico, exhibits cold and drought-resistant ability and, generally, grows on mountains at an altitude of 1350 m [2].
Currently, in China, T. patula is a common ornamental and medicinal plant and has been cultivated throughout the country. Traditionally, T. patula was used to treat various diseases, such as cough, colic, constipation, diarrhea, rheumatism, and eye problems. Today, the plant is specially used as an antimicrobial, antiseptic, blood purifying, and diuretic agent [3,4]. The flowers of T. patula are edible and used in refreshing drinks [5]. Previous phytochemical investigations of flowers of T. patula were mainly focused on the flavonoids [6,7], steroids [8], and thiophenes [9]. Its roots and rhizomes contained higher contents of thiophenes [10] and benzofurans [11]. In this study, we report the isolation and structural elucidation of two new euparin glycosides and 14 known compounds (Figure 1) using different chromatographic techniques. The chemical structures of the isolated compounds have been determined with different spectroscopic techniques including one-dimensional (1D) and two-dimensional (2D) NMR experiments, HR-ESI-MS analysis, as well as ECD. Furthermore, we established an effective fingerprint method for comparison and quality evaluation of SLT with three color types of flowers (Figure A1).
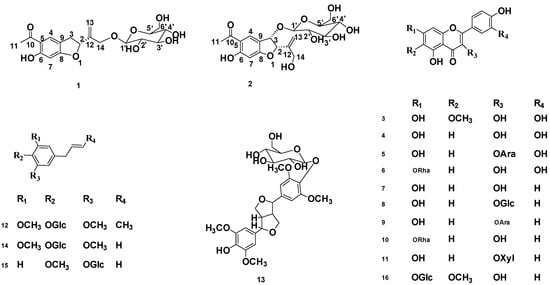
Figure 1.
Structure of the isolated compounds from T. patula.
2. Results and Discussion
2.1. Structural Elucidation of the Isolated Compounds
Compound 1 was obtained from the 95% EtOH extract of the T. patula L as a white amorphous powder. The molecular formula was determined as C19H24O9 byHR-ESI-MS showing a pseudomolecular ion peak at m/z 397.1399 [M+H]+ correspondent to of. The 1H-NMR spectrum of compound 1 showed resonances of two dd peaks at δH 3.38 (dd, J = 8.0 and 15.5 Hz, H-3) and 3.12 (dd, J = 8.0 and 15.5 Hz, H-3) coupled with a triplet signal at δH 5.48 (t, J = 8.5 Hz, H-2), which are the characteristic signals of 2, 3-dihydrobenzofuran derivatives [12]. In addition, one aromatic acetyl methyl group with chemical shift of δH 2.54 ppm (3H, s, H-11), two singlet aromatic protons at δH 7.68 (s, H-4) and 6.27 (s, H-7) were also observed. Two downfielded signals at δH 5.28 and 5.32 assignable to vinylic protons (2H, s, H-13) and two doublets at δH 4.22 and 4.49 (d, J = 10.0 and 12.8 Hz, H-14) were also observed. The 13C-NMR spectrum of compound 1 showed signals for nineteen carbons, of which eight were speculated to be from the benzofuran skeleton. The assignment of 13C-NMR signals of compound 1 was assisted by the analysis of the HSQC spectrum. The carbon signal at δC 204.2 (C-10) and δC 26.4 (C-11) indicated the presence of an acetyl moiety, while the signals at δC 145.8 and δC 113.9 could confirm the presence of a double bond. Analysis of the 13C-NMR data (Table 1) clearly indicated that compound 1 was closely related to the known compound 2, 3-dihydro-14-isobutyryloxyeuparin and the major difference was that C-14 in compound 1 (δC 70.0) was shifted downfield as compared with that known compound (δC 62.3) [13]. In addition, the HMBC correlation between the signals at δH 4.28 (1H, d, J = 4.3Hz, glu-1) and δC 70.0 (C-14) suggested that the attachment of a sugar moiety at C-14 of aglycone (Figure 2). To determine the absolute configuration of compound 1, the ECD method was used to determine the configuration of C-2 of compound 1. ECD was calculated by the time-dependent density functional theory (TD-DFT) method at the B3LYP/6-31G+(d, p) level utilizing the conductor polarizable continuum model (CPCM) in methanol. By comparing the calculated ECD spectral data with that of experimental data of compound 1, the absolute configuration at C-2 was assigned to be R (Figure 3). Thus, the structure of comppound 1 was characterized as 1-{(2R)-2-[1-(β-D-glucopyranoside) vinyl]-6-hydroxy-1-benzofuran-5-yl}-ethanone. It is a new compound and named as 2Hβ, 3-dihydro-euparin-14-O-β-D-glucoside.

Table 1.
13C-NMR spectroscopic data of compounds 1 and 2 (500 MHz for 1H and 125 MHz for 13C data, J in Hz, recorded in CD3OD).
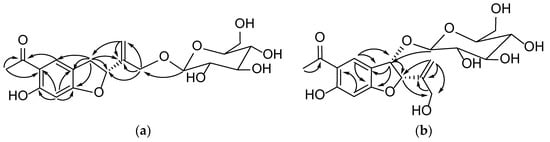
Figure 2.
HMBC correlations of compounds 1 (a) and 2 (b).
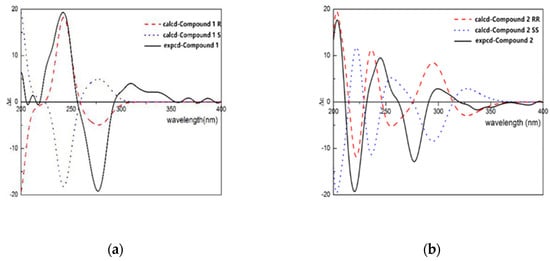
Figure 3.
Caculated and experimental ECD spectra of compound 1 (a) and 2 (b).
Compound 2 was isolated as a yellow crystalline amorphous powder and its molecular formula C19H24O10 was determined by HR-ESI-MS showing a pseudo molecular ion peak at m/z 435.1269 [M+Na]+. The 1H-NMR spectrum of compound 2 displayed the presence of the signals of two singlet aromatic protons at δH 8.18 (1H, s, H-4) and 6.30 (s, H-7), an AB type of methylenic signals at δH 4.23, 4.16 (2H, d, J = 10.0 Hz and J = 15.0 Hz, H-14), one singlet acetyl group at δH 2.61 (3H, s, H-11), two coupled heterocyclic protons at δH 5.33 (1H, d, J = 5.0 Hz, H-2) and 5.17 (1H, d, J = 5.0 Hz, H-3), two germinal olefinic protons at δH 5.41 and 5.36 (2H, each s, H-13), and one anomeric proton at δH 4.54 (1H, d, J = 5.0 Hz, H-1′). The 13C-NMR spectrum of compound 2 showed nineteen carbon signals, of which eight from benzofuran skeleton, and the determination was assisted by analysis of the HSQC spectrum. Signals at δC 205.0 (C-10) were assigned to a carbonyl carbon. Comparison of the 1H and 13C-NMR spectrum data of compound 2 (Table 1) with known compounds 1-{(2R*,3S*)-3-(β-D-glucopyranosyloxy)-2,3-dihydro-2-[1-(hydroxymethyl)vinyl]-1-benzofuran-5-yl}-ethanone showed their close structural relationship [14]. Differences were observed for the C-6 which resonated as an oxygenated carbon in the 13C-NMR spectrum. In addition to the two singlet signals of H-4 and H-7, the 1H-NMR spectrum were found. A β-glucopyranosyl was elucidated to be attached to C-14 based on HMBC correlations of H-1′ with C-13 (Table A1). The H-2 and H-3 were deduced to be in a cis conformation via NOESY correlations. The ECD data were calculated based on time-dependent density functional theory (TDDFT) (Figure 3). The absolute configurations of C-2 and C-3 were determined as (2R, 3R) by comparison of the calculated ECD spectra (Figure 3). Thus compound 2 was assigned as 1-{(2R,3R)-3-(β-D-glucopyranoside)-2,3-dihydro-2-[1-(hydroxymethyl)vinyl]-6-hydroxy-1-benzofuran-5-yl}-ethanone. It is also a new compound and named as 14-hydroxy-2,3-dihydro -euparin-3-O-β- D-glucoside.
Another fourteen known compounds were identified as patuletin (3) [15], quercetin (4) [16], quercetin-3-O-α-L-arabinopyranoside (5) [17], quercetin-7-O-α-L-rahmnoside (6) [18], kaempferol (7) [19], kaempferol-3-O-β-D-glucoside (8) [20], kaempferol-3-O-α-L-arabinopyranoside (9) [21], kaempferol-7-O-α-L-rahmnoside (10) [22], kaempferol-3-O-β-D-xylopyranoside (11) [23,24], 1-β-D-glucopyranosyl-2, 6-dimethoxy-4-propenylphenol (12) [25], syringaresinol-4′-O-β-D-glucoside (13) [26], 4-allyl-2, 6-dimethoxy phenyl glucoside (14) [27], 2-methoxy-4-(2-propenyl) phenyl-β-D-glucoside (15) [28], and 6-methoxy–kaempferol-7-β-D-glucoside (16) [29], based on the analysis of their 1D and 2D NMR, MS, as well as other spectroscopies.
2.2. HPLC Fingerprints and Similarity Analysis of the Various SLT Samples
The following ten different batches of stems and leaves of T. patula (SLT) were examined: Shouyao Red and Yellow color (1, 2, 3), Janie Yellow Bright (4, 5, 6, 7), and Jinmen Orange (8, 9, 10). The chromatographic fingerprint of (SLT) (Figure 4) exhibited 22 distinct peaks from the common patterns. These chromatograms were very similar apart from the differences in peak areas and lackingof common peak 26. Among these chromatograms, patuletin was chosen as the reference peak to calculate the RRT, because it has moderate retention time, a clear shape, and a high peak area. Eight common peaks (peak 12, 13, 14, 15, 16, 17, 18, and 19) were chosen as the “characteristic fingerprint peaks” to represent the characteristics of the SLT and identified as quercetin-3-O-α-L, arabinopyranoside; kaempferol-3-O-β-D, glucoside; kaempferol-3-O-α-L, arabinopyranoside; kaempferol-3-O-β-D, xylopyranoside; quercetin-7-O-α-L, rahmnoside; kaempferol-7-O-α-L, rahmnoside; patuletin; and kaempferol, respectively. The compounds were identified by comparing their retention time with the reference substances (Figure 5). The new compounds were not recognized due to low peak area. After analyzing, the result of similarity were evaluated for all the samples using to the Similarity Evaluation System for Chromatographic Fingerprint of Traditional Chinese Medicine (Version 2004A). The RPA of characteristic peaks relative to the reference peak were calculated and are shown in Table 2. The RPA data of the characteristic peaks were used to reflect the quantitative expression of the present HPLC fingerprint of the T. patula. The average peak area of patuletinin Janie Yellow Bright was 222.7, followed by the Jinmen Orange type (218.4) and ShouyaoRed and Yellow color (212.8). As shown in Table 3, the comparison between the original chromatograms and the average chromatograms of all samples presented similarity values ranging from 0.910 to 0.979, denoting that the quality of all samples was reliable and stable, however, there is a slight difference in various types of samples. Different types of T. patula should be distinguished by variant or ecological type. The results of the precision, stability, and repeatability rates are shown as supplementary data in (Table A2) and the picture of the three types of flower of SLT are shown in (Figure A1).
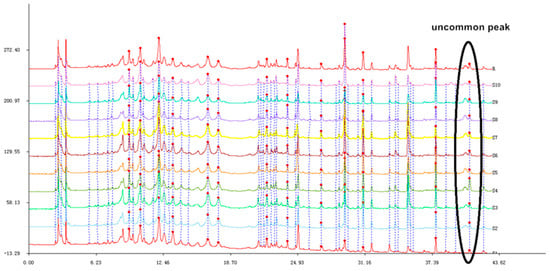
Figure 4.
The chromatographic fingerprint of 10 T. patula samples (S1–S10).
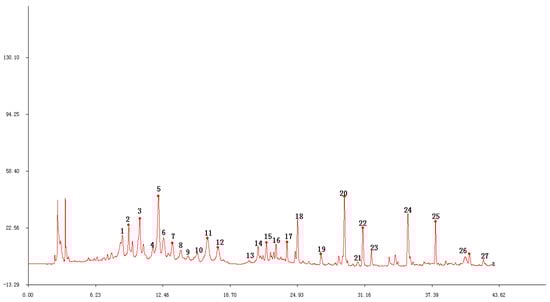
Figure 5.
Compound 12: Quercetin-3-O-α-L, arabinopyranoside; 13: kaempferol-3-O-β-D, glucoside; 14: kaempferol-3-O-α-L, arabinopyranoside; 15: kaempferol-3-O-β-D, xylopyranoside; 16: quercetin-7-O-α-L, rahmnoside; 17: kaempferol-7-O-α-L, rahmnoside; 18: patuletin; 19: kaempferol.
Table 2.
Relative peak area (RPA) of the common peaks of the T. patula.
Table 3.
Evaluation results of 10 batches of T. patula samples.
2.3. Cytotoxicity Assay
The isolated compounds from T. patulawere evaluated for their cytotoxicity against human gastric cancer cell (AGS). The cytotoxicity assay was performed using the MTT assay method. Human gastric cancer cell (AGS) were obtained from the Cell Bank of Type Culture Collection of the Chinese Academy of Sciences, Shanghai Institute of Cell biology. Compounds 1 and 2 displayed moderate cytotoxicity against human gastric cancer cell (AGS) with IC50 values of 41.20 μmol/L and 30.43 μmol/L, respectively, (Table 4). 5-Fluorouracil was used as a positive control and showed an IC50 value of 11.79 μmol/L.
Table 4.
The human gastric cancer cell inhibitory activities of isolates.
3. Materials and Methods
3.1. General Experimental Procedures
Optical rotations were measured with a Perkin-Elmer Model 241 polarmeter (Perkin Elmer, Inc. Waltham, MA, USA). The high-resolution electrospray ionization mass spectroscopy (HR-ESI-MS) as was acquired using a Waters Xevo Q-TOF (Waters Corporation, Milford, MA, USA). ECD spectra were recorded on a BioLogic MOS-450 spectrometer. Semipreparative HPLC was performed using a HITACHI 7100 (Hitachi Corporation, Tokyo, Japan) equipped with a YMC-Pack ODS-A, 10 × 250 mm column (YMC, Kyoto, Japan) and detections were performed with a VWD detector at 210 nm. Column chromatography was performed using silica gel (200−300 mesh, Marine Chemical Factory, Qingdao, China). Prepared silica gel G plates (Marine Chemical Factory, Qingdao, China) were used for TLC analysis. Acetonitrile (HPLC grade) was purchased from Duksan (Anshan, Kyonggi, Korea).
3.2. Plant Material
The aerial part of T. patula was collected in Dalian, Liaoning province, China, on March 2016 and authenticated by Professor Bing Wang, the Liaoning University of Traditional Chinese Medicine, China.
3.3. Extraction and Isolation
The air-dried stems and leaves (15.0 Kg) of T. patula was refluxed with 60% EtOH for three times (3 × 120 L, 2 h each) at low temperature (45 °C), then filtered and the solvent was evaporated in vacuum to furnish the crude extract. Then, it was partitioned with petroleum and ethyl acetate successively several times to give the ethyl acetate layer and H2O layer which was subjected to column chromatography (CC) over AB-8 macroporous adsorptive resins and eluted with EtOH/H2O (0:100, 60:40 and to 95:5). The 60% EtOH eluate and ethyl acetate layer (total 300 g) were combined to column chromatography on silica gel and eluted with CH2CL2/MeOH (100:0 to 0:100) to afford six fractions (Fr. A1-A6). Fr. A4 was passed over a silica gel column and eluted with CH2CL2/MeOH (100:0 to 0:100) to give six fractions (Fr. B1-B6). Compound 3 (27.9 mg) was further crystallized in MeOH from Fr. B3 (CH2CL2/MeOH, 20:1). Then, Fr. B4 (eluted with CH2CL2/MeOH, 10:1) was subjected to an ODS column and eluted with MeOH/H2O. The 30% fraction from ODS column was 927 mg and gave six fractions C1-6. Fraction C1 was further purified by HPLC (eluted with MeOH/H2O, 45:55) to give compound 2 (8 mg) and compound 16 (9 mg). Similarly, Fraction C3 was further subjected to an ODS column and gave three subfractions D1-D3. Fraction D1 was purified on an HPLC (eluted with MeOH/H2O, 37:63) to afford compound 12 (8 mg). In the same way, compound 13 (14.8 mg) was isolated from fraction D2 by HPLC (eluted with MeOH/H2O, 40:60), whereas compound 1 (8.2 mg), compound 14, and compound 15 (8 mg) were isolated from fraction D3 by an HPLC (eluted with MeOH/H2O, 42:58). Finally, compound 4 (9 mg) was obtained from Fraction B6. Fr. A6 was applied to a silica gel (CH2CL2/MeOH from 15:1 to 0:100) to give seven subfractions E1-E7. Fraction E2 was further passed through polyamide column (CH2CL2/MeOH from 1:0 to 0:1) to obtain eight fractions F1-F8. Fraction F4 was further purified by ODS column equipped with HPLC eluting with MeOH/H2O (45:55), resulting in optically pure compounds of 5 (16 mg), 6 (18 mg), 8 (34 mg), 11 (10 mg). In the same manner, 7 (12 mg), 9 (10 mg), 10 (20 mg) were isolated from fraction F5.
3.4. Acid Hydrolysis of Compounds 1 and 2
Compounds 1 and 2 (2 mg each) were hydrolyzed with 10% HCL-dioxane (1:1, 1 mL) for 4 h at 80 °C in a water bath. The mixture was neutralized with Ag2CO3 and extracted with CH2CL2. After the aqueous layer was condensed, both of them were examined by HPLC and compared with authentic samples. Analytical HPLC was performed on Agilent ZORBAX NH2 column (5 μm, 4.6 mm × 150 mm) with isocratic elution using MeCN-H2O (4:1) for 40 min at a flow rate 1 mL/min. The peaks were detected with evaporative light scattering detector and D-glucose (Sigma, St. Louis., MO, USA) showed the retention time at 9.277 min.
3.5. Chromatographic Conditions
The HPLC fingerprint analysis was conducted on an Agilent HPLC system with a diode array detector (DAD) and Thermo C18 column (4.6 × 250 mm, 5 μm) maintained at 30 °C. The mobile phases were acetonitrile (A) and 0.1% phosphoric acid in deionized water (B) (v/v) and a flowrate of 1.0 mL/min was utilized. The gradient elution program was as follows: 0–5 min, 10% to 17% A; 5–15 min, 17% to 17% A; 15–29 min, 17% to 57% A; 29–36 min, 57% to 80% A; 36–43 min, 80% to 80% A; An injection volume of 20 μL was used for each run. The absorption spectra of the samples were recorded in the range of 190–400 nm and the detection wavelength was set at 254 nm for the establishment of fingerprints.
3.6. MTT Assay
The cytotoxicity of compounds isolated from the T. patula, against human gastric cancer cell (AGS) was assessed by MTT colorimetric method. Cells in DMEM medium supplemented with 10% fetal bovine serum (FBS) were incubated in a 96-well plate in the presence of different concentrations of test compounds (2.5, 5, 10, 20, 40, 80 μmol/L) at 37 °C in a 5% CO2 incubator for 24 h. Formazan crystals resolved with DMSO and then the ODS value at 492 nm of each well was measured. 5-FU were included as a positive control.
4. Conclusions
In this work, two new compounds (1 and 2) and 14 known compounds were isolated and identified. Compounds 1 and 2 showed moderate cytotoxicity against human gastric cancer cell lines (AGS). Furthermore, chromatographic fingerprint analysis was performed for different types of leave and stem extracts to evaluate the quality and differentiate various types of SLT.
Author Contributions
Y.-M.W. and D.-Q.D. planned and designed the experiment; Y.-M.W., X.-K.R., M.R., M.Y., Q.C., D.-Q.D., A.M.M., T.-G.K., and D.-C.C. conducted the experiments; Y.W. analyze the data and prepared the figures; Y.-M.W. and D.-Q.D. wrote the paper; A.M.M. modified the paper; all authors agreed to the final version of this manuscript.
Funding
This research was funded by the Liaoning Province Distinguished Professor Support Program, China.
Acknowledgments
We gratefully appreciate XU Ying-Ting, Centre of Analysis and Test, Liaoning Normal University, Hu Xu and Shao-Zhao Xiang, Shenyang Pharmaceutical University, for their kind help in testing our samples.
Conflicts of Interest
The authors declared no conflict of interest.
Appendix A
HMBC spectral data of compound 1 and compound 2
Table A1.
HMBC spectroscopic data of compounds 1 and 2 (500 MHz for 1H and 125 MHz for 13C Data, J in Hz, recorded in CD3OD).
Table A1.
HMBC spectroscopic data of compounds 1 and 2 (500 MHz for 1H and 125 MHz for 13C Data, J in Hz, recorded in CD3OD).
| Position | 1 | 2 | |||
|---|---|---|---|---|---|
| δH | HMBC | δH | HMBC | NOESY | |
| 2 | 5.48 (1H, t, 8.5) | C-3,C-9,C-12,C-13,C-14, | 5.17 (1H, d, 5.0) | C-12,C-13,C-14 | H-3,H-14, H-1’ |
| 3 | 3.12 (1H, dd, 8.0, 15.5), 3.38 (1H, dd, 8.0, 15.5) | C-2,C-4,C-8,C-9,C-12 | 5.33 (1H, d, 5.0) | C-1’,C-8 | H-3, H-4, H-13, H-14 |
| 4 | 7.68 (1H, s) | C-3, C-5, C-6, C-7, C-8, C-9 | 8.18 (1H, s) | C-8,C-10 | H-11, H-1’ |
| 5 | |||||
| 6 | |||||
| 7 | 6.27 (1H, s) | C-5,C-6,C-8,C-9 | 6.32 (1H, s) | C-5,C-6,C-9 | |
| 8 | |||||
| 9 | |||||
| 10 | |||||
| 11 | 2.54 (3H, s) | C-5, C-10 | 2.61 (3H, s) | C-5,C10 | |
| 12 | |||||
| 13 | 5.32 (1H, s), 5.28 (1H, s) | C-2, C-12, C-14 | 5.36 (1H, s), 5.41 (1H, s) | C-2,C12,C-14 | H-14 |
| 14 | 4.49 (1H, d, 10.0), 4.22 (1H, d, 12.8) | C-1’, C-2, C-12, C-13 | 4.16 (1H, d, 15.0), 4.23 (1H, d, 10.0) | C2,C-12,C-13 | H-2, H-13, H-1’ |
| 1’ | 4.28 (1H, d, 4.3) | C-14, C-2’ | 4.54 (1H, d, 5.0) | C-3 | H-3, H-4, H-14 |
| 2’ | 3.35 (1H, m) | C-1’, C-3’ | 3.17 (1H, dd, 5.0, 10.0) | C-1’, C-3’ | |
| 3’ | 3.40 (1H, m) | C-2’, C-4’ | 3.36 (1H, s) | C-2’ | |
| 4’ | 3.21 (1H, m) | C-3’, C-5’ | 3.28 (1H, br s) | C-3’, C-6’ | |
| 5’ | 3.13 (1H, m) | C-4’, C-5’, C-6’ | 3.36 (1H, s) | C-4’ | |
| 6’ | 3.25 (2H, m) | C-5’ | 3.73(1H, dd, 5.0, 10.0) 4.00 (1H, dd, 2.0, 11.5) | C-4’, C-5’ | H-4’ |
Method Validation
The precision was measured by analyzing the five replicates of the sample solutions (Sample 1) continuously within one day. The relative standard deviation (RSD) values of relative retention time (RRT) and peak area (RPA) of the fourteen markers did not exceed 0.49% and 6.22%, respectively. The stability test was determined and the RSD values of RRT and RPA were below 0.52% and 6.25%. Moreover, five independently solutions of the same sample (Sample 1) were analyzed to verify the repeatability. The RSD values of RRT and RPA were less than 0.59% and 4.70%, respectively. The results of the precision, stability, and repeatability rates are shown in Table A2.
Table A2.
Analytical results of precision, stability, and repeatability rates of fourteen components in the T. patula.
Table A2.
Analytical results of precision, stability, and repeatability rates of fourteen components in the T. patula.
| Peak No. | RSD of RPA (%) | RSD of RRT (%) | ||||
|---|---|---|---|---|---|---|
| Precision | Stability | Repeatability | Precision | Stability | Repeatability | |
| 5 | 4.397 | 4.769 | 3.401 | 0.492 | 0.458 | 0.246 |
| 6 | 3.504 | 5.883 | 1.574 | 0.321 | 0.238 | 0.258 |
| 11 | 3.343 | 6.253 | 3.652 | 0.375 | 0.522 | 0.586 |
| 15 | 4.840 | 4.976 | 4.701 | 0.125 | 0.131 | 0.098 |
| 18(S) | 0.000 | 0.000 | 0.000 | 0.000 | 0.000 | 0.000 |
| 25 | 6.224 | 1.351 | 3.806 | 0.064 | 0.049 | 0.052 |
The pictures of three types of flowers from stems and leaves of T. patula
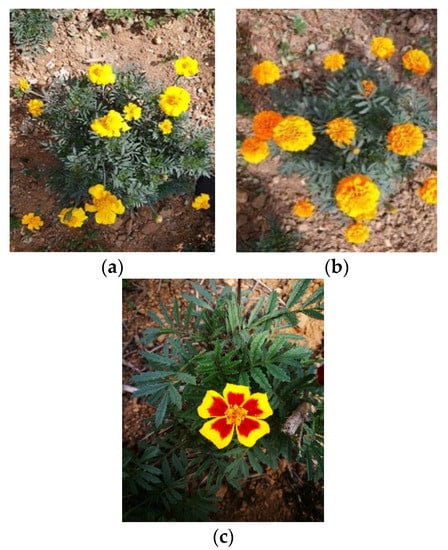
Figure A1.
(a) Janie Yellow Bright, (b) Jinmen Orange, (c) Shouyao Red and Yellow color.
References
- Vasudevan, P.; Kashyap, S.; Sharma, S. Tagetes: A multipurpose plant. Bioresource Technol. 1997, 62, 29–35. [Google Scholar] [CrossRef]
- Editorial Committee of Flora of China. Flora Reipublicae Popularis Sinicae; Beijing Science Press: Beijing, China, 1979; Volume 75, p. 387. [Google Scholar]
- Chadha, Y.R. The Wealth of India. Publications & Information Directorate: New Delhi, India, 1976; Volume 10, p. 203. [Google Scholar]
- Ken, Y.; Yoshimasa, K. Effects of Flavonoids from French Marigold (Florets of Tagetespatula L.) on Acute Inflammation Model. Int. J. Inflam. 2013, 1–5. [Google Scholar] [CrossRef]
- Kunkel, G. Plants for human consumption. Koeltz Scientific Books: Koenigstein, Germany, 1985; Volume 39, p. 176. [Google Scholar]
- Bhardwaj, D.K.; Bisht, M.S.; Uain, S.C.; Mehta, C.K.; Sharma, G.C. Quercetagetin 5-methyl ether from the petals of Tagetespatula. Phytochemistry 1980, 19, 713–714. [Google Scholar] [CrossRef]
- Heywood, V.H.; Turner, B.L. The Biology and Chemistry of the Compositae. Sys. Bot. 1978, 3, 435. [Google Scholar] [CrossRef]
- Shaheen, F.; Shahina, F.; Samina, B.; Erum, Y.I.; Humaira, S. Isolation of nematicidal compounds from Tagetespatula L. yellow flowers: Structure-activity relationship studies against cyst nematode Heteroderazeae infective stage larvae. J. Agric. Food Chem. 2011, 59, 9080–9093. [Google Scholar] [CrossRef]
- Bano, H.; Ahmed, S.W.; Azhar, I.; Ali, M.S.; Alam, N. Chemical constituents of Tagetespatula L. Pak. J. Pharm. Sci. 2002, 15, 1–12. [Google Scholar]
- Saleem, R.; Ahmad, M.; Naz, A.; Siddiqui, H.; Ahmad, S.L.; Faizi, S. Hypotensive and toxicological study of citric acid and other constituents from Tagetespatula roots. Arch. Pharm. Res. 2004, 27, 1037–1042. [Google Scholar] [CrossRef]
- Tang, C.S.; Wat, C.K.; Towers, G.H.N. Thiophenes and benzofurans in the undisturbed rhizosphere of Tagetespatula L. Plant Soil 1987, 98, 93–97. [Google Scholar] [CrossRef]
- Menelaou, M.; Fronczek, F.; Hjortso, M.; Morrison, A.; Foroozesh, M.; Thibodeaux, T.; Flores, H.; Fisher, N. NMR Spectral Data of Benzofurans and Bithiophenes from Hairy Root Cultures of TagetesPatula Andthe Molecular Structure of Isoeuparin. Spectroscopy Lett. 1991, 24, 1405–1413. [Google Scholar] [CrossRef]
- Ahmed, A.A.; Abou-Douh, A.M.; Mohamed, A.H.; Hassan, M.E.; Karchesy, J. A new chromene glucoside from Ageratum conyzoides. Planta Med. 1999, 65, 171–172. [Google Scholar] [CrossRef]
- Dobner, M.J.; Ellmerer, E.P.; Schwaiger, S.; Batsugkh, O.; Narantuya, S.; Stiitz, M.; Stuppner, H. New Lignan, Benzofuran, and Sesquiterpene Derivatives from the Roots of Leontopodiumalpinum and L.leontopodioides. Helv. Chim. Acta 2003, 86, 86–733. [Google Scholar] [CrossRef]
- Mosaad, A.W.; Said, A.; Huefner, A. NMR and Radical Scavenging Activities of Patuletinfrom Urticaurens Against Aflatoxin B1. Pharm. Biol. 2005, 43, 515–525. [Google Scholar]
- Ge, L.L.; Li, J.M.; Wan, H.Q.; Zhang, K.D.; Wu, W.G.; Zou, X.T.; Wu, S.P.; Zhou, B.P.; Tian, J.; Zeng, X.B. Novel flavonoids from Lonicera japonica flower buds and validation of their anti-hepatoma and hepatoprotective activity in vitro studies. Ind. Crops Prod. 2018, 125, 114–122. [Google Scholar] [CrossRef]
- Sanbongi, C.; Osakabe, N.; Natsume, M.; Takizawa, T.; Gomi, S.; Osawa, T. Antioxidative Polyphenols Isolated from Theobroma cacao. J. Agric. Food Chem. 1998, 46, 454–457. [Google Scholar] [CrossRef] [PubMed]
- Wang, X.W.; Mao, Y.; Wang, N.L.; Yao, X.S. A new phloroglucinol diglycoside derivative from Hypericum japonicum Thunb. Molecules 2008, 13, 2796–2803. [Google Scholar] [CrossRef]
- Rezende, F.M.; Ferreira, M.J.P.; Clausen, M.H.; Rossi, M.; Furlan, C.M. Acylated Flavonoid Glycosides are the Main Pigments that Determine the Flower Color of the Brazilian Native Tree Tibouchina pulchra (Cham.) Cogn. Molecules 2019, 24, 718. [Google Scholar] [CrossRef]
- Ibrahim, A.; Khalifa, S.I.; Khafagi, I.; Youssef, D.T.; Khan, S.; Mesbah, M.; Khan, I. Microbial metabolism of biologically active secondary metabolites from Nerium oleander L. Chem. Pharm. Bull. 2008, 56, 1253–1258. [Google Scholar] [CrossRef]
- Loizzo, M.R.; Said, A.; Tundis, R.; Rashed, K.; Statti, G.A.; Hufner, A.; Menichini, F. Inhibition of angiotensin converting enzyme (ACE) by flavonoids isolated from Ailanthus excelsa (Roxb) (Simaroubaceae). Phytother. Res. 2007, 21, 32–36. [Google Scholar] [CrossRef]
- Ouyang, X.L.; Wei, L.X.; Fang, X.M.; Wang, H.S.; Pan, Y.M. Flavonoid constituents of Euonymus fortune. Chem. Nat. Compd. 2013, 54, 195–197. [Google Scholar]
- Wu, T.S.; Zhang, F.C.; Wu, P.L.; Guo, C.S.; Chen, Y.S. Constituents of Leaves of TefradiumglabrifoJium. J. Chin. Chem. Soc. 1995, 42, 929–934. [Google Scholar] [CrossRef]
- Olszewska, M.; Wolbiś, M. Flavonoids from the flowers of Prunus spinosa L. Acta Pol. Pharm. 2001, 58, 367–372. [Google Scholar] [PubMed]
- Kiem, P.V.; Minh, C.V.; Dat, N.T.; Cai, X.F.; Lee, J.J.; Kim, Y.H. Two new phenylpropanoid glycosides from the stem bark of Acanthopanaxtrifoliatus. Arch. Pharm. Res. 2003, 26, 1014–1017. [Google Scholar] [CrossRef] [PubMed]
- Jiao, Q.S.; Xu, L.L.; Zhang, J.Y.; Wang, Z.J.; Jiang, Y.Y.; Liu, B. Rapid Characterization and Identification of Non-Diterpenoid Constituents in Tinosporasinensis by HPLC-LTQ-Orbitrap MSn. Molecules 2018, 23, 274. [Google Scholar] [CrossRef] [PubMed]
- Zhou, J.; Zhou, X.L.; Liang, C.Q.; Su, X.J.; Li, B.L.; Qing, Y.Y.; Wu, Y.E. Chemical constituents of Dendrobium officinale. Chin. Trad. Herb. Drugs 2015, 46, 1292–1295. [Google Scholar]
- Wilfried, S.; Gerhard, S.; Peter, S. Glycosidically bound aroma components from sour cherry. Phytochemistry 1990, 29, 607–612. [Google Scholar]
- Zhang, M.; Liu, W.L.; Gao, X.; Tan, J.W.; Wan, F.H. Study on Chemical Constituents from Eupatorium adenophorumSpreng. J. Trop. Subtrop. Botany 2015, 23, 697–702. [Google Scholar]
Sample availability: The samples of the compounds are not available from the authors. |
© 2019 by the authors. Licensee MDPI, Basel, Switzerland. This article is an open access article distributed under the terms and conditions of the Creative Commons Attribution (CC BY) license (http://creativecommons.org/licenses/by/4.0/).