
Soft Microwave Pretreatment to Extract P-Hydroxycinnamic Acids from Grass Stalks

 , , ,
, , ,
Abstract
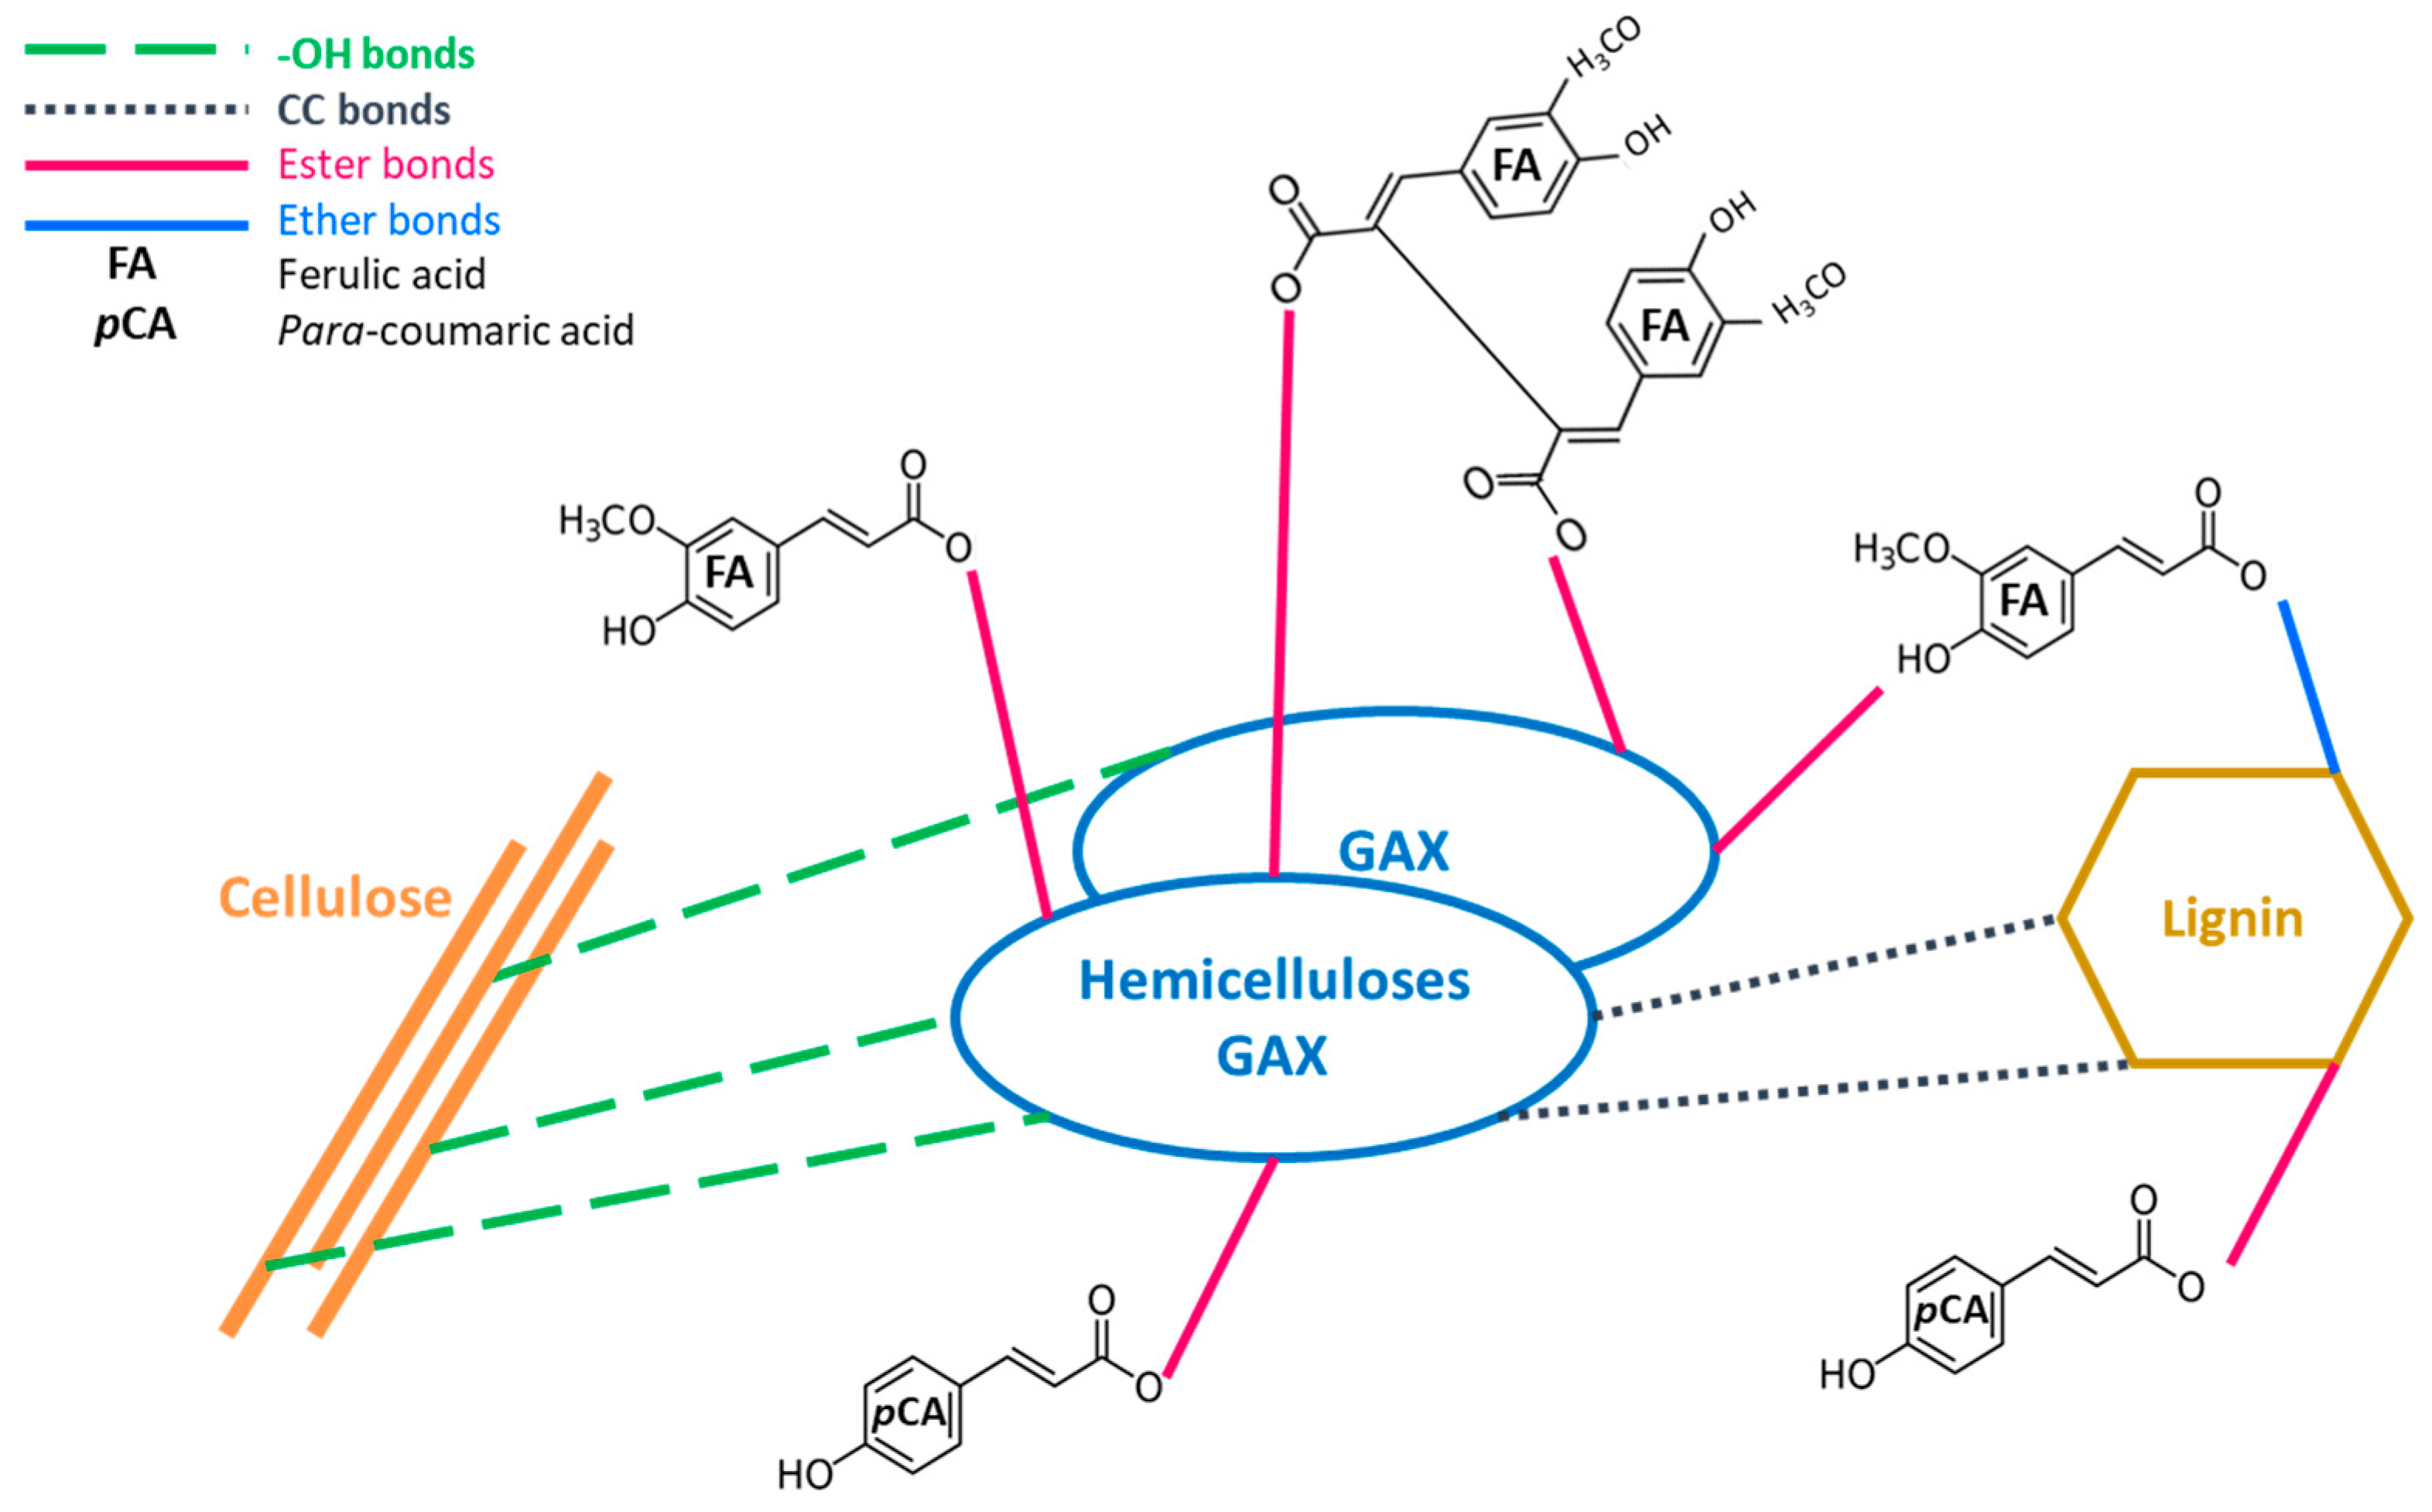
1. Introduction
2. Results and Discussion
2.1. Raw Matter Composition
2.2. Effect of Solvent and Treatment on p-Hydroxycinnamic Acids Release
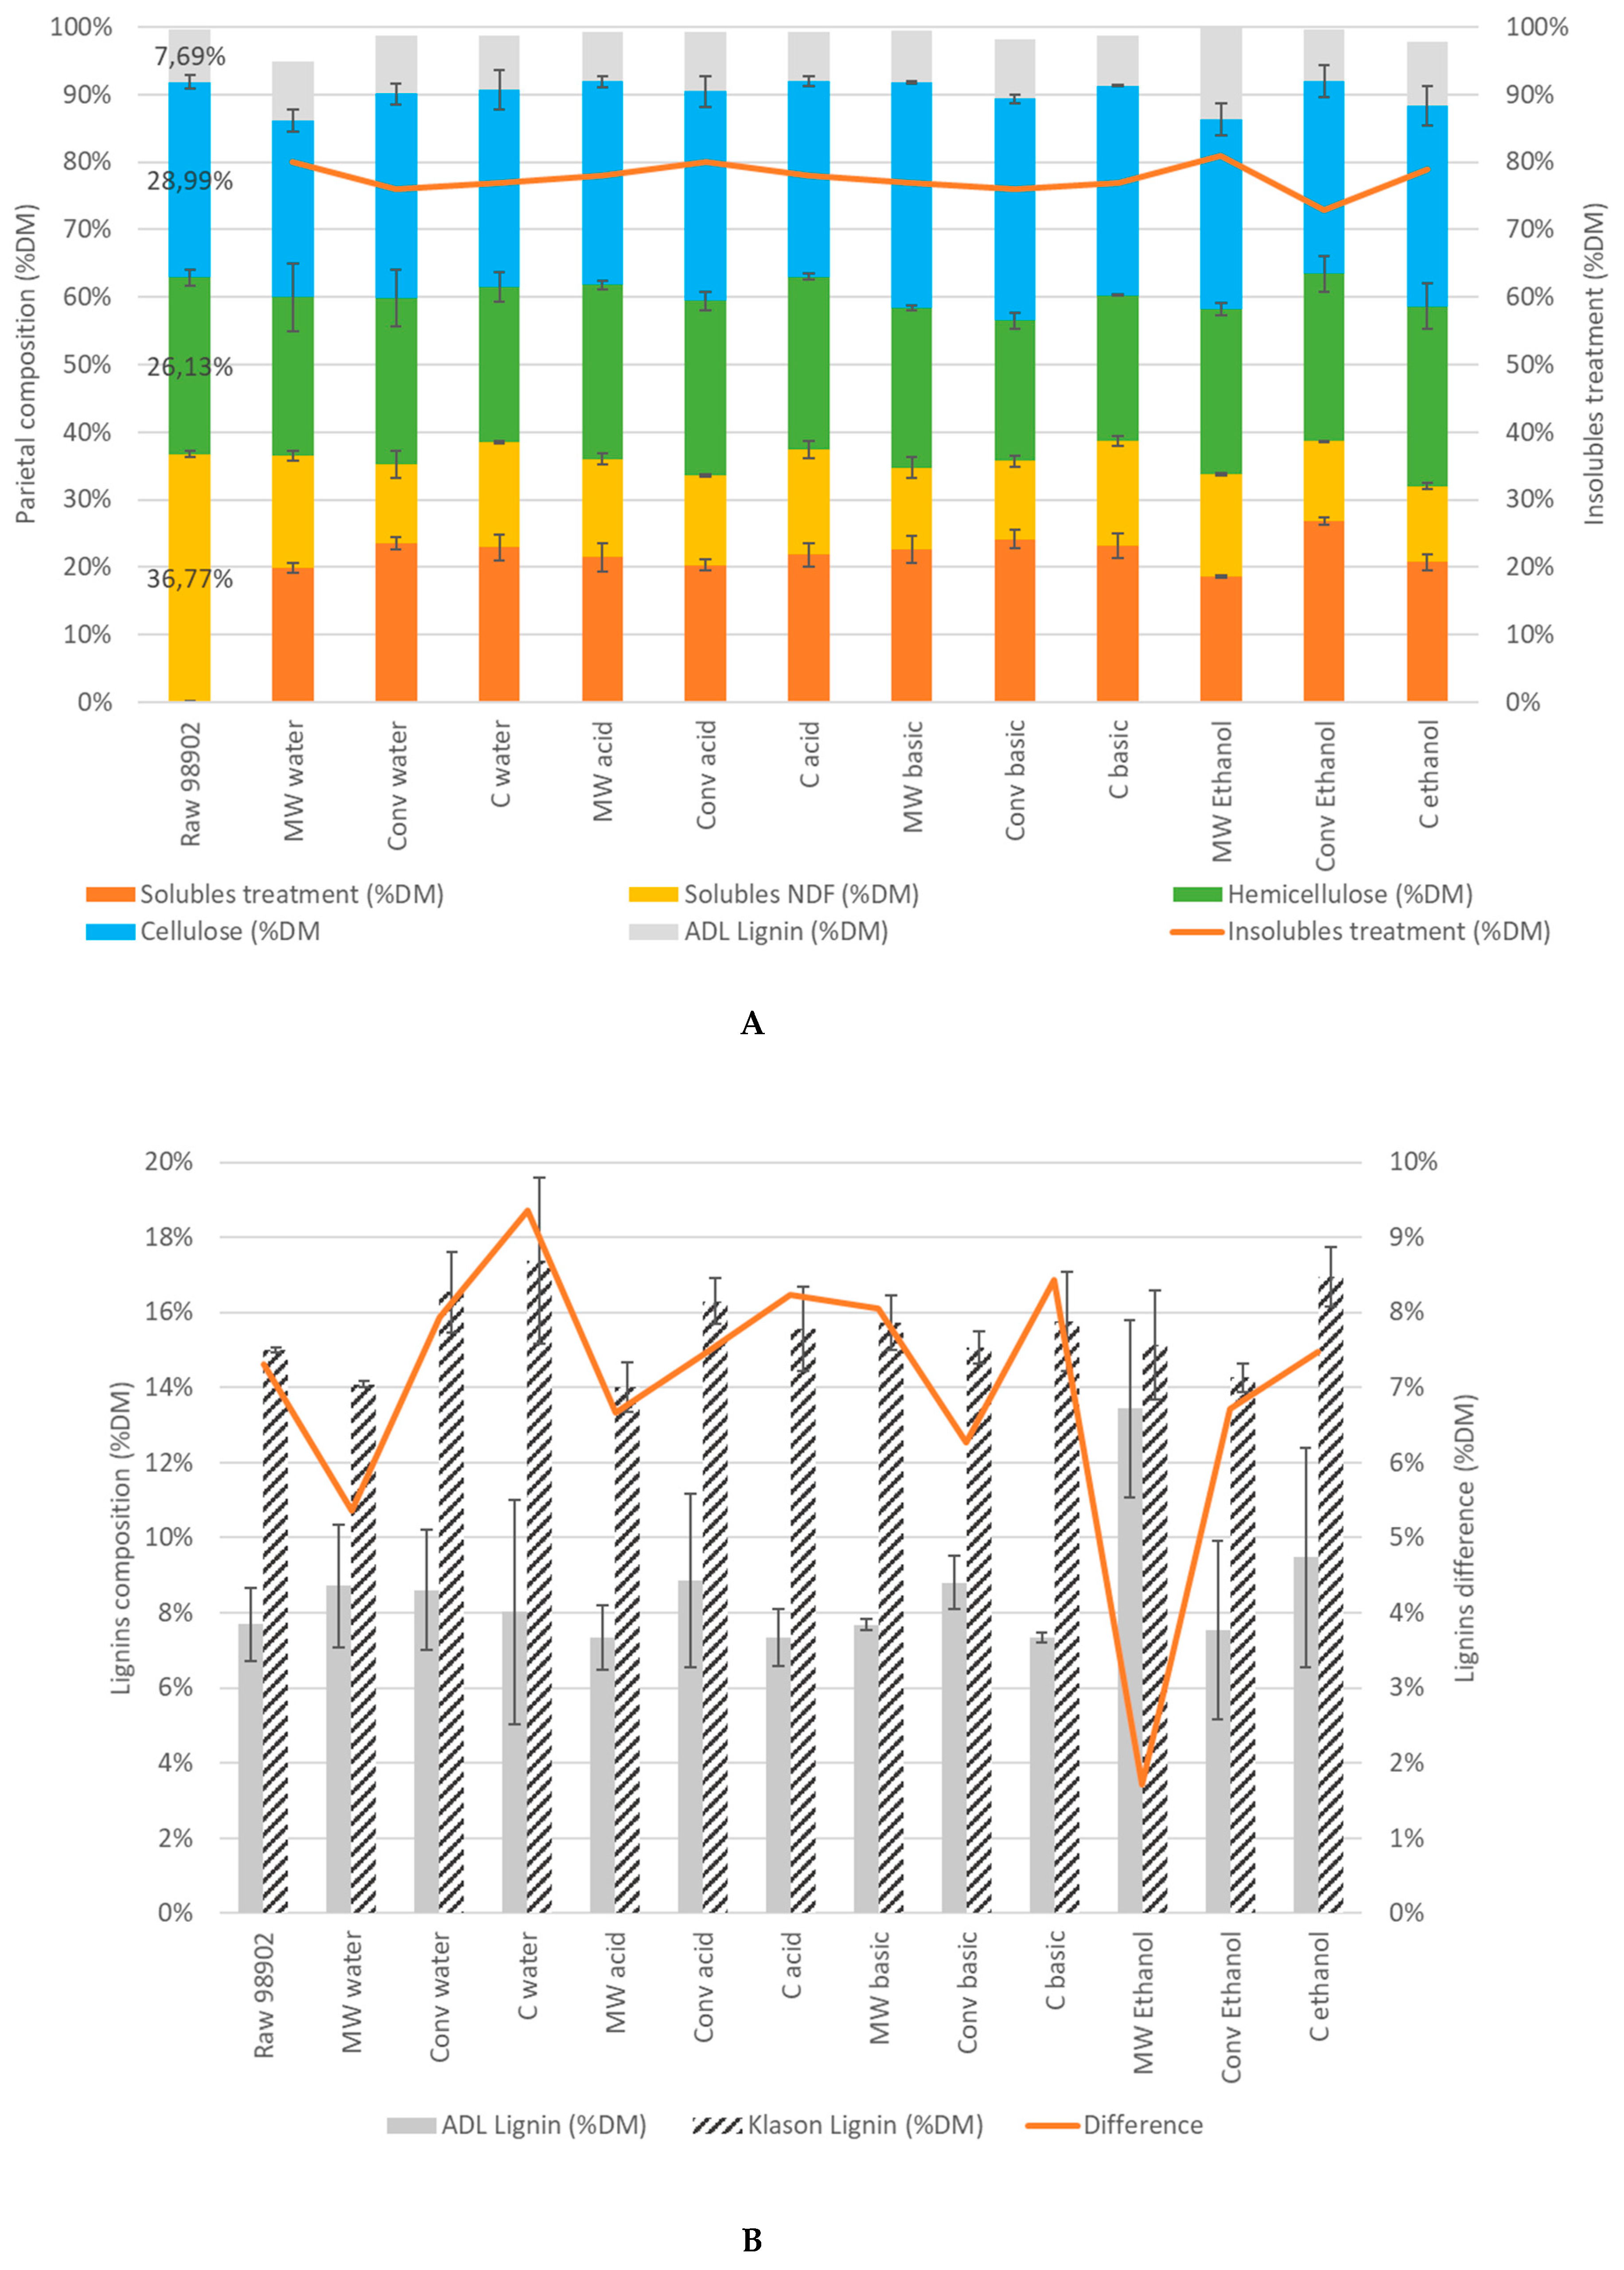
2.2.1. Composition Analysis of Pretreated Biomass
2.2.2. p-Hydroxycinnamic Acids Release
2.3. Response Surface Methodology (RSM) Analysis to Determine Better Microwave Parameters
2.3.1. Experimental Design
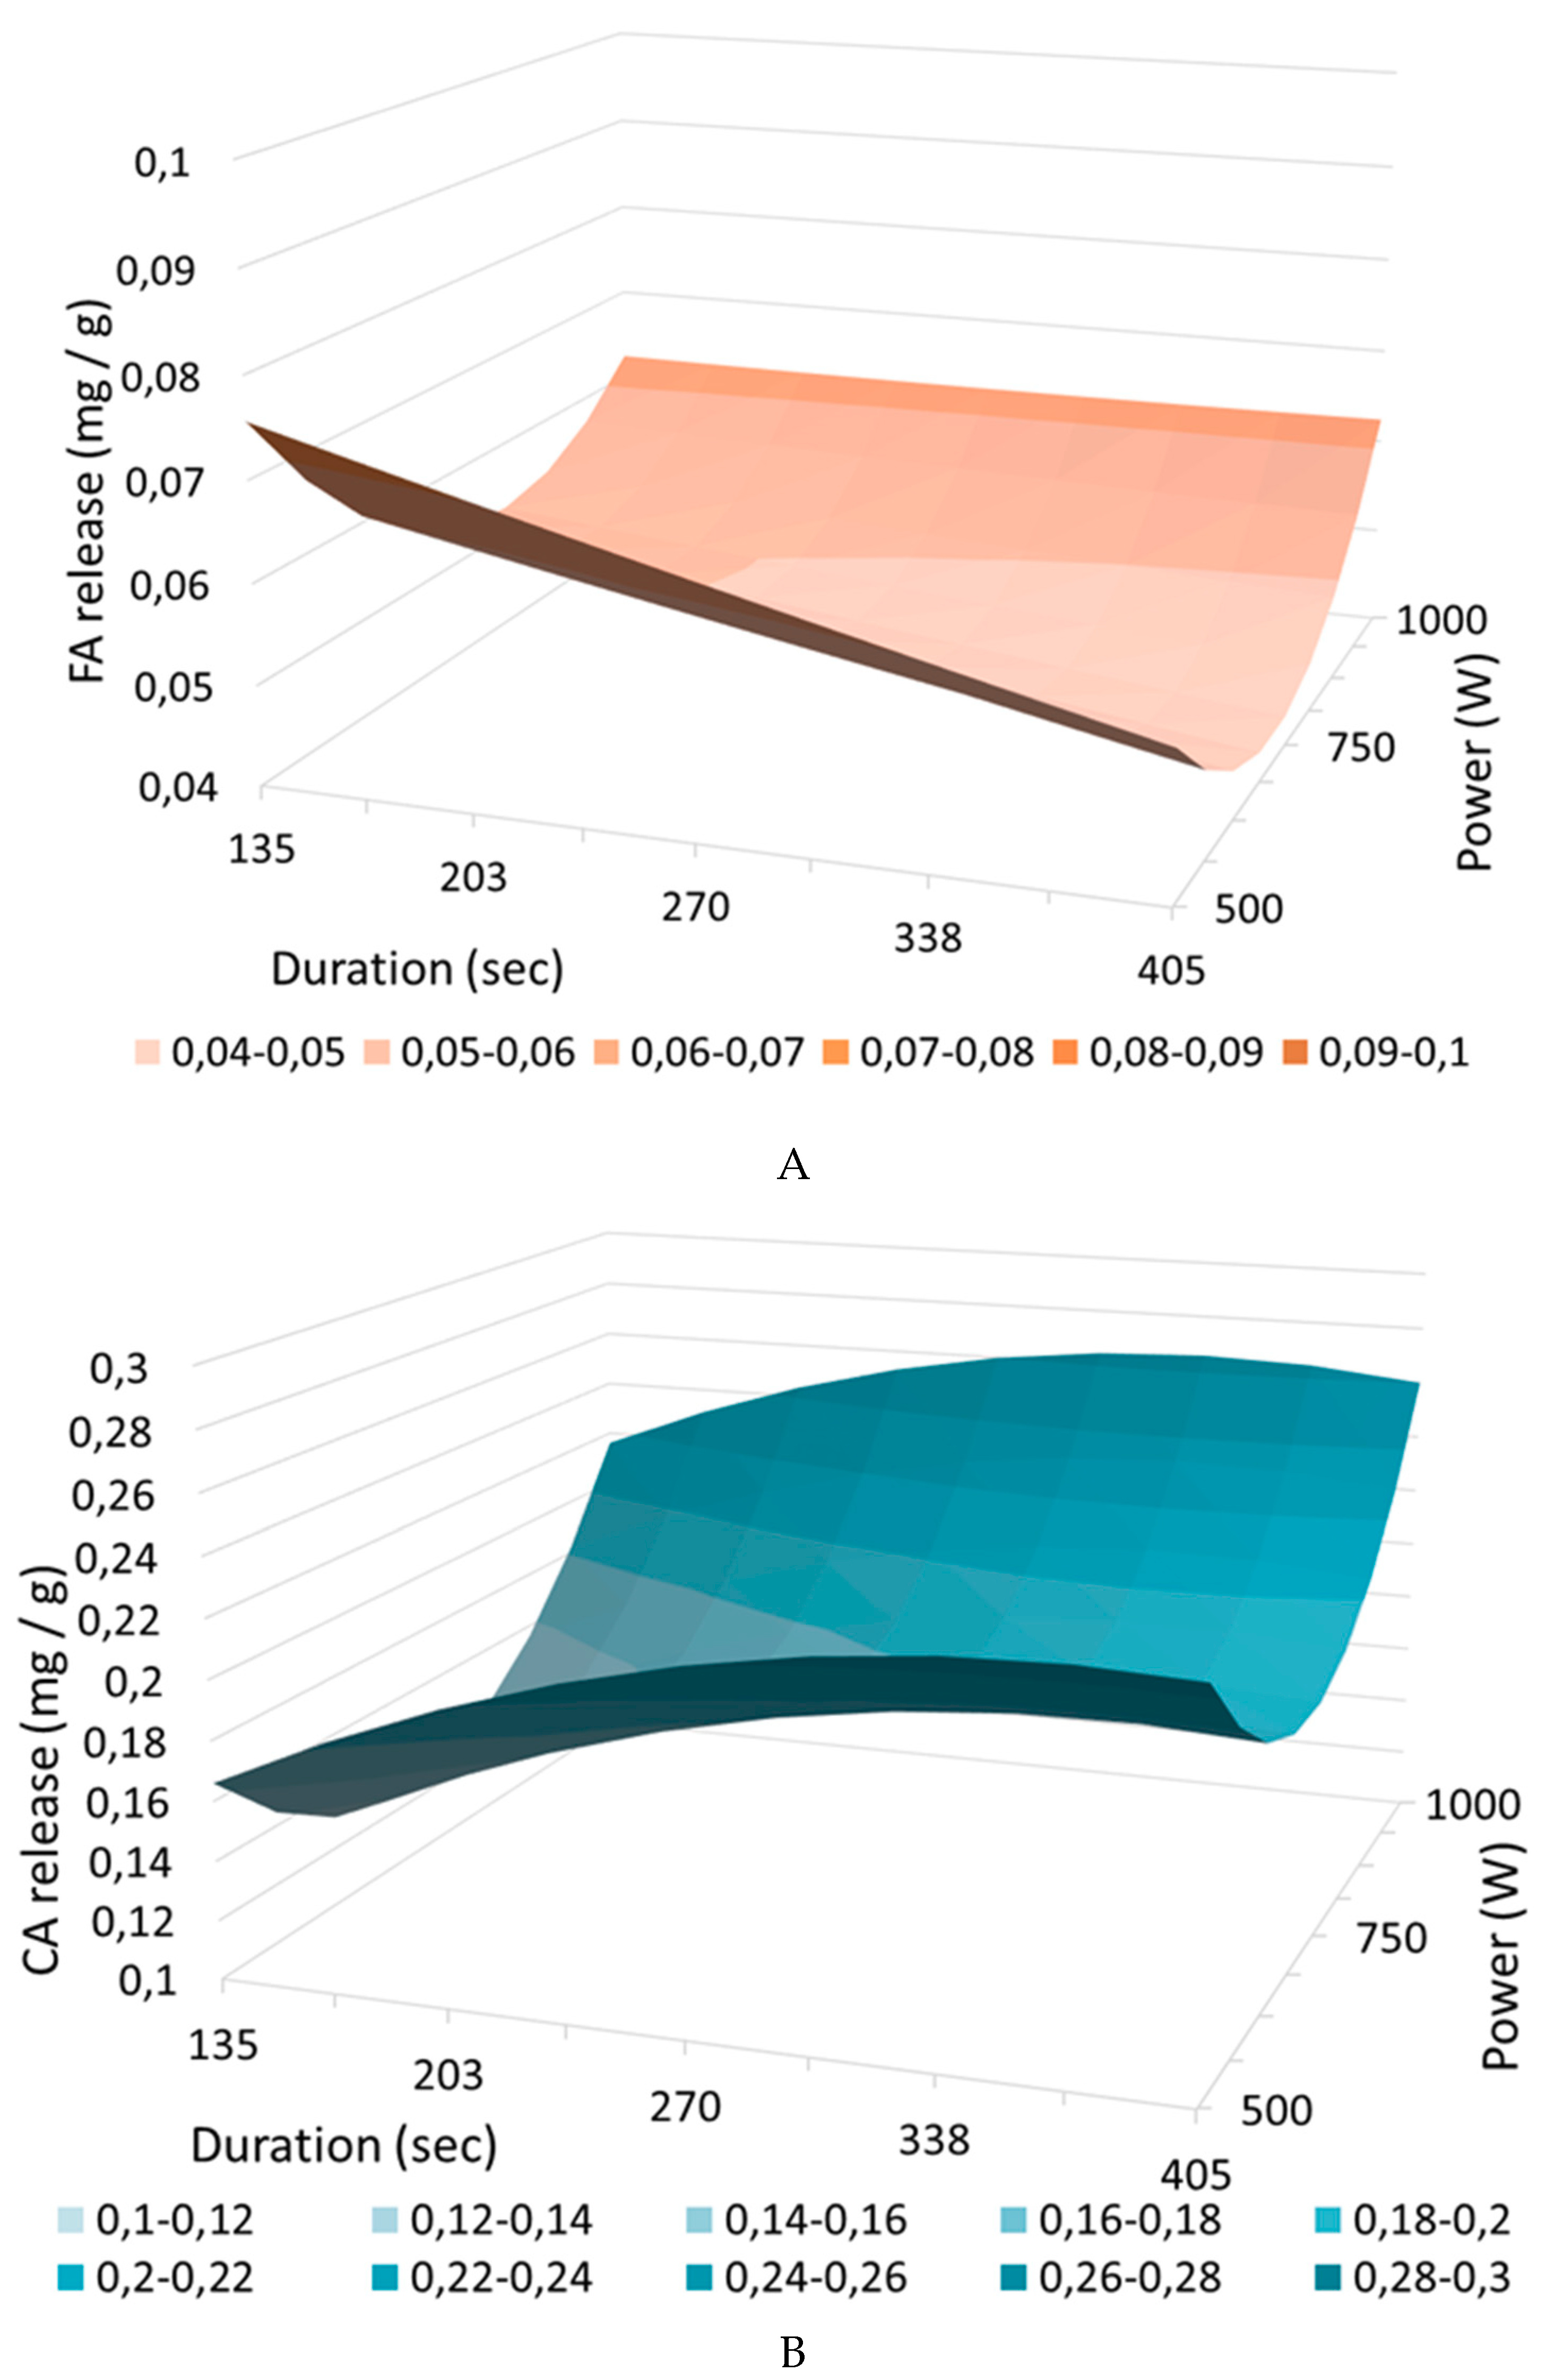
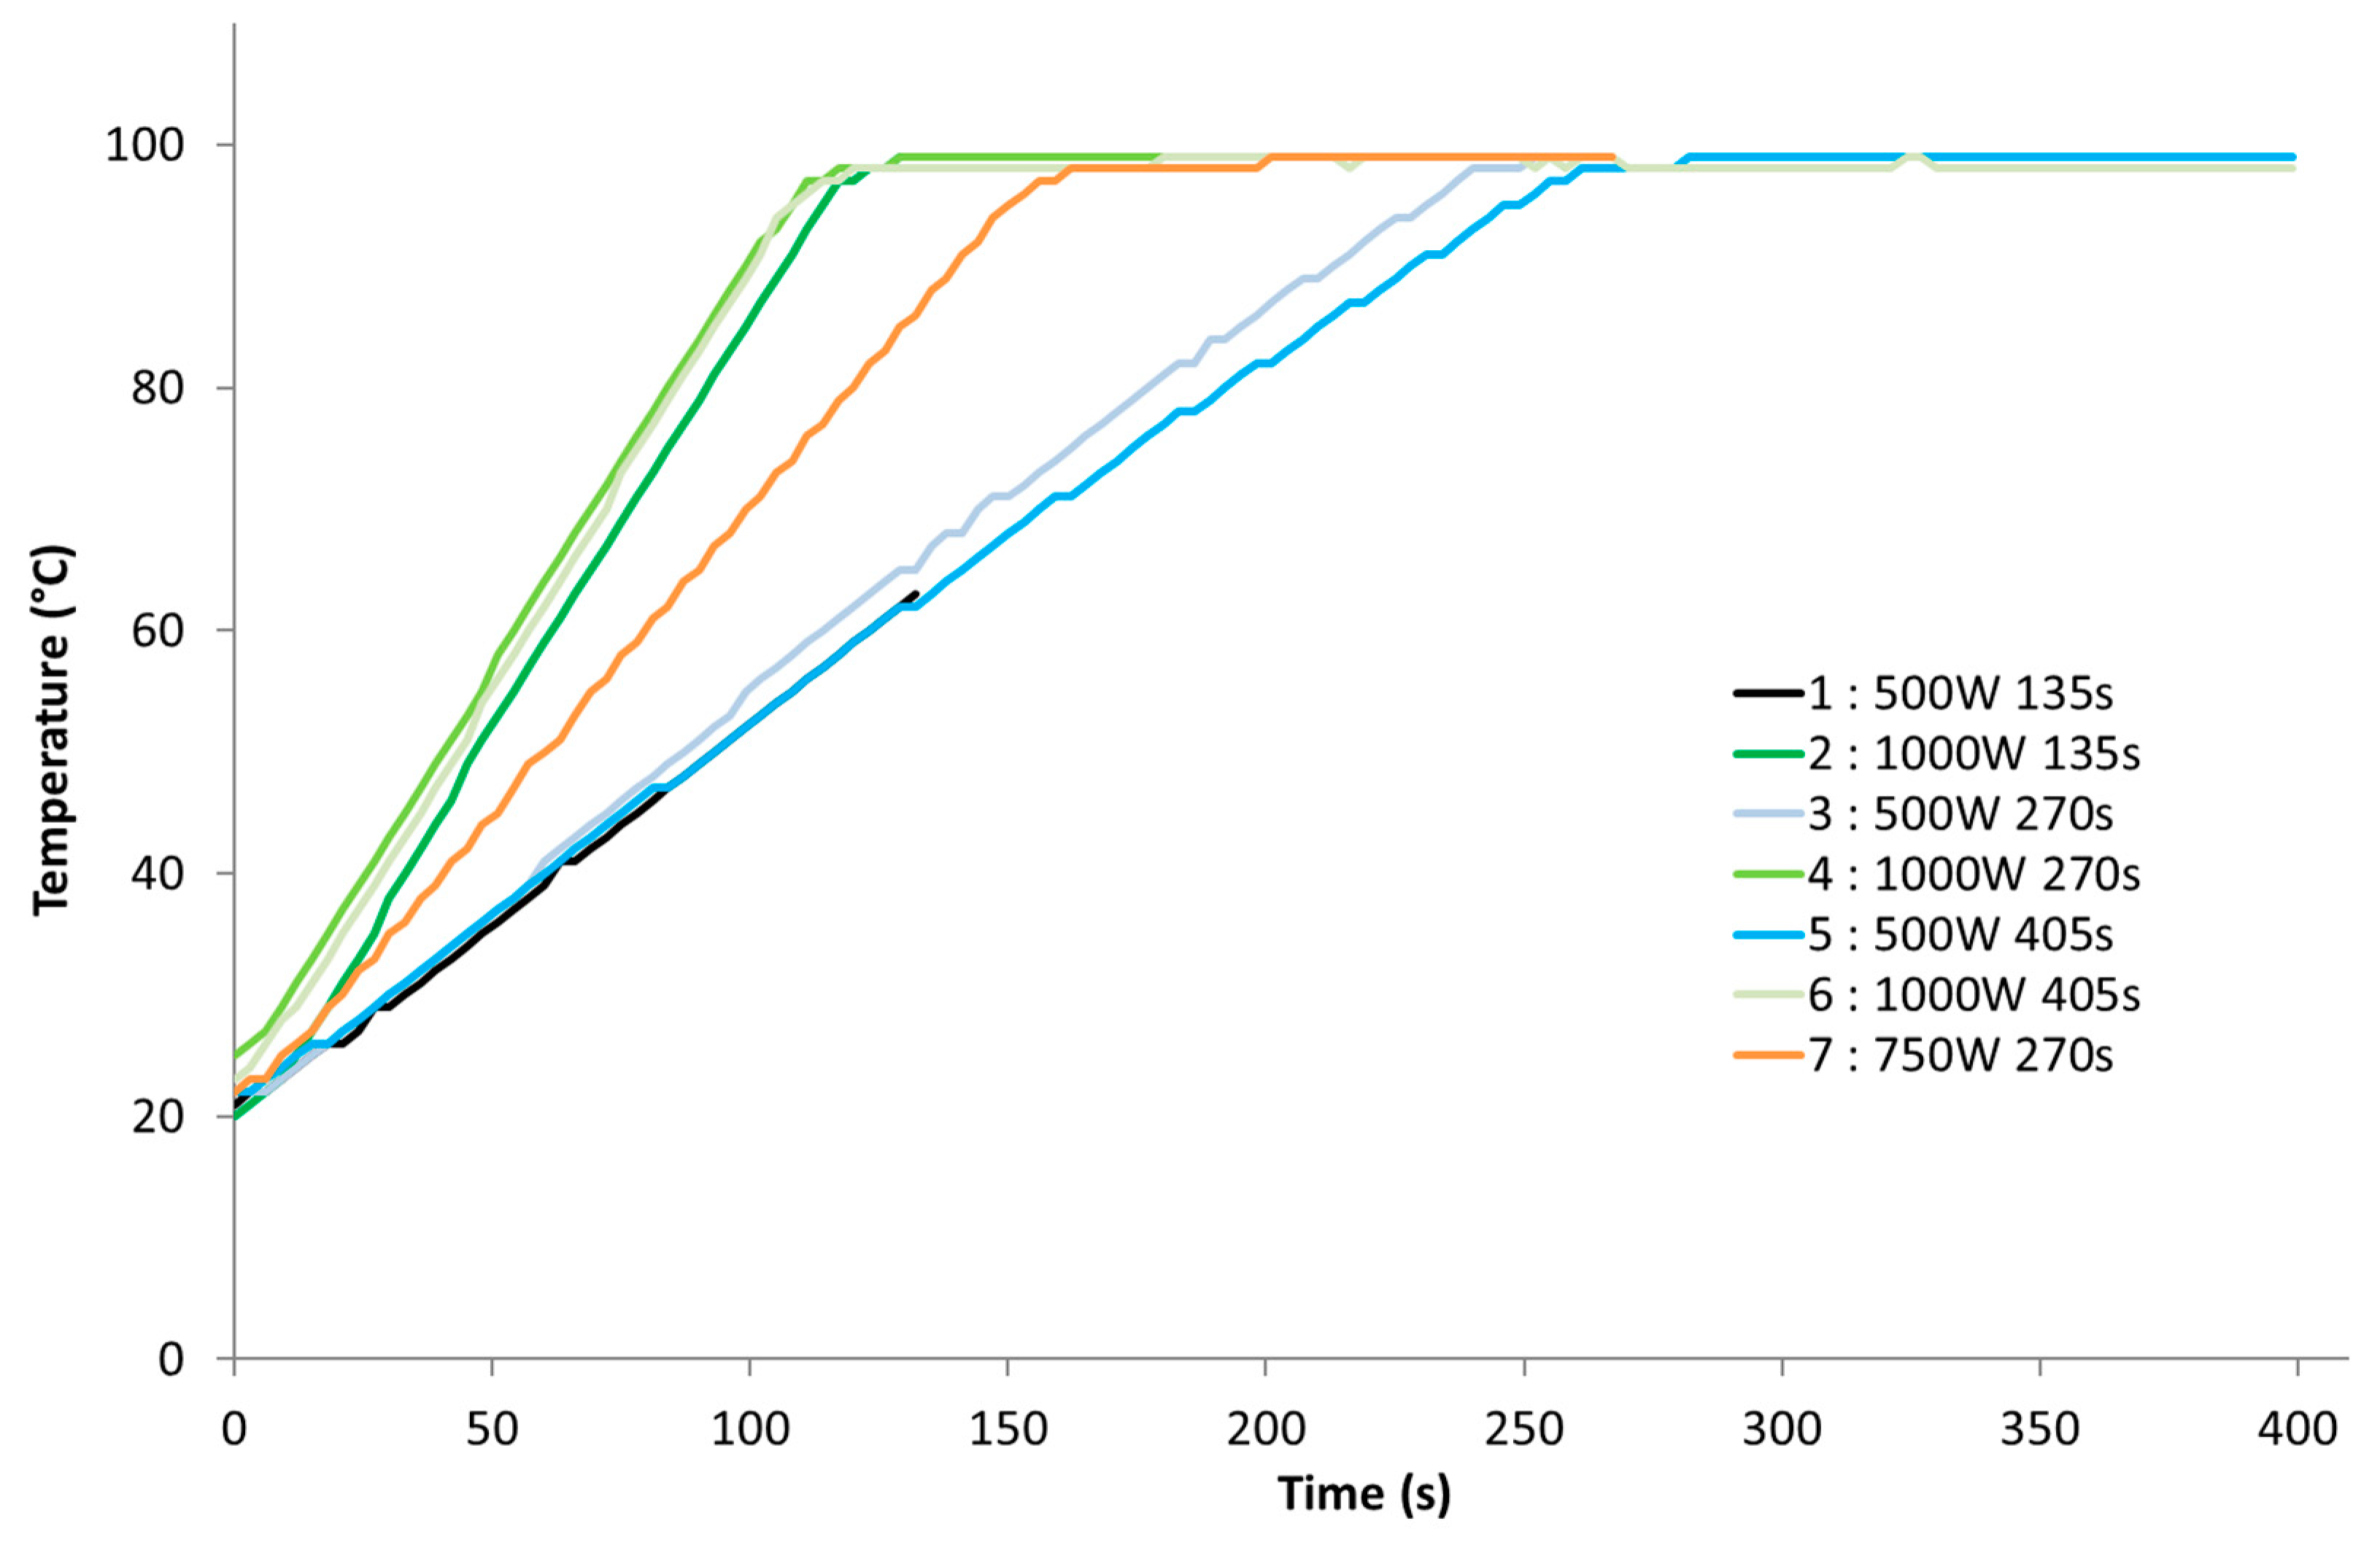
2.3.2. p-Hydroxycinnamic Acids Release Depending on Incident Power and Treatment Duration
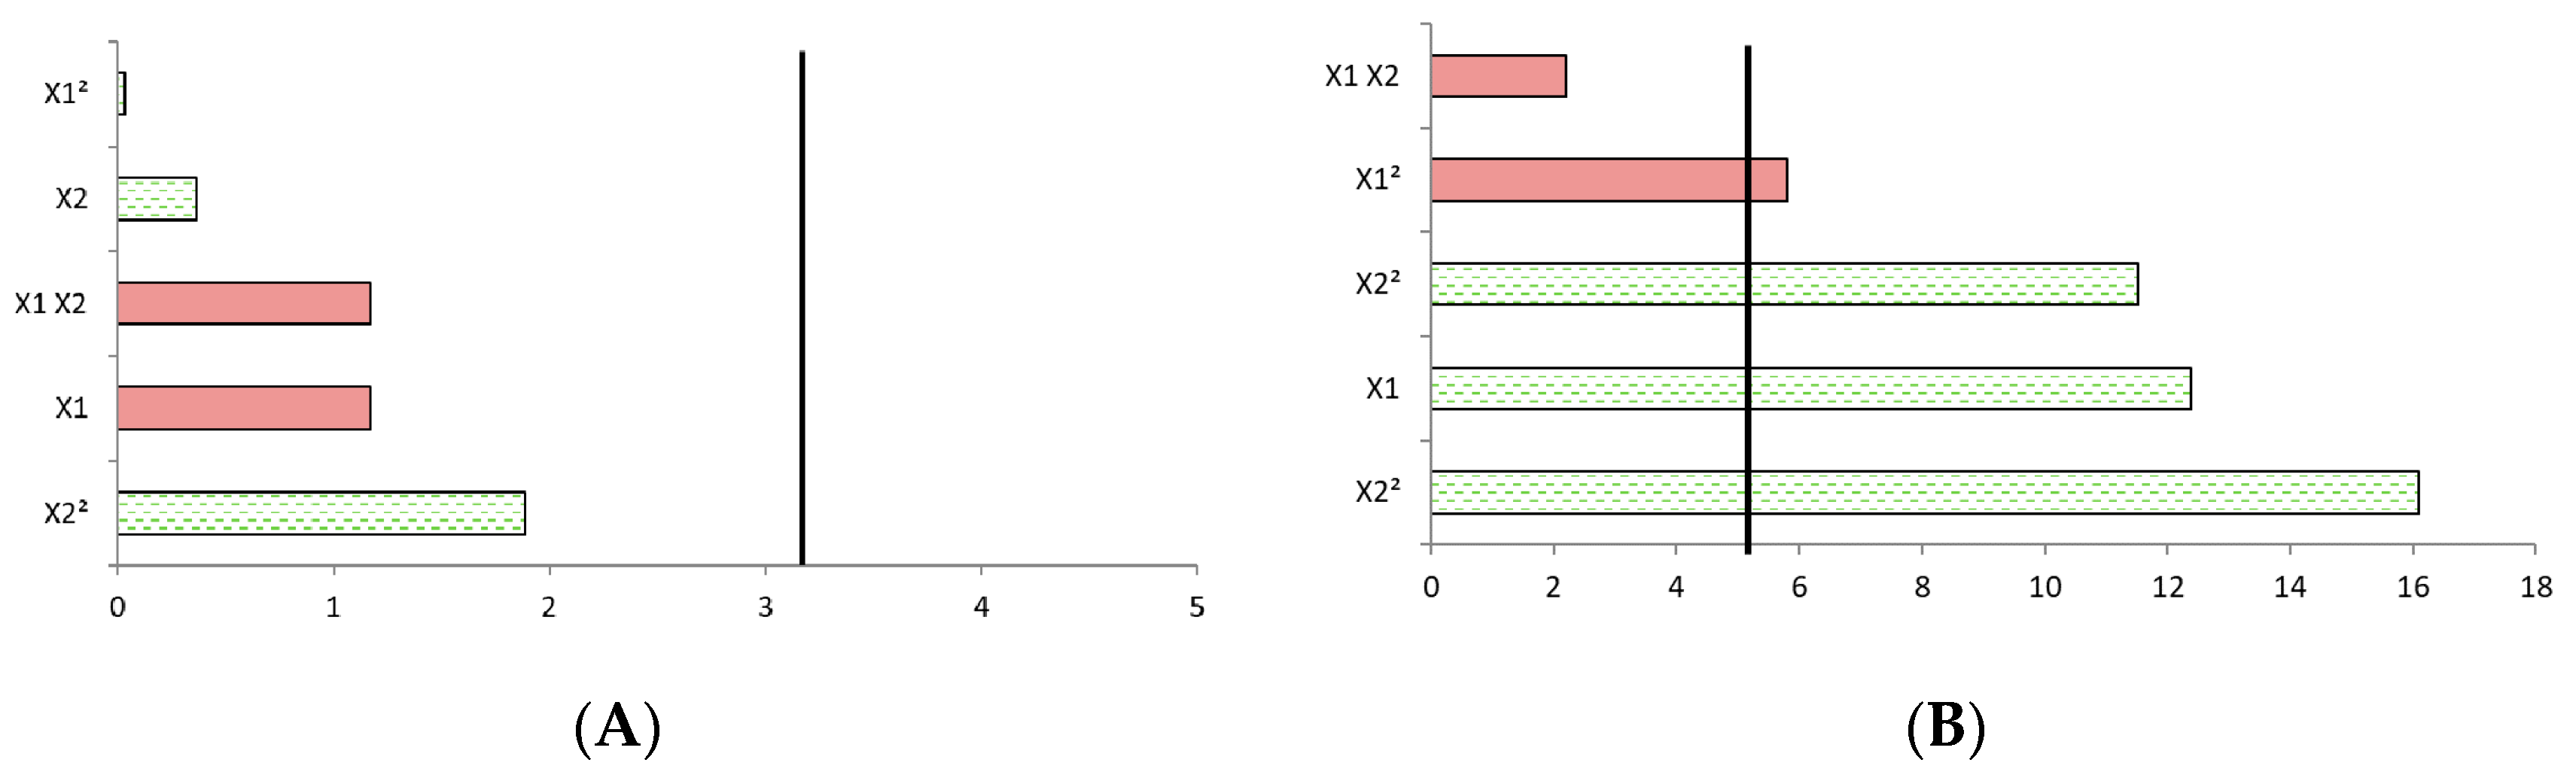
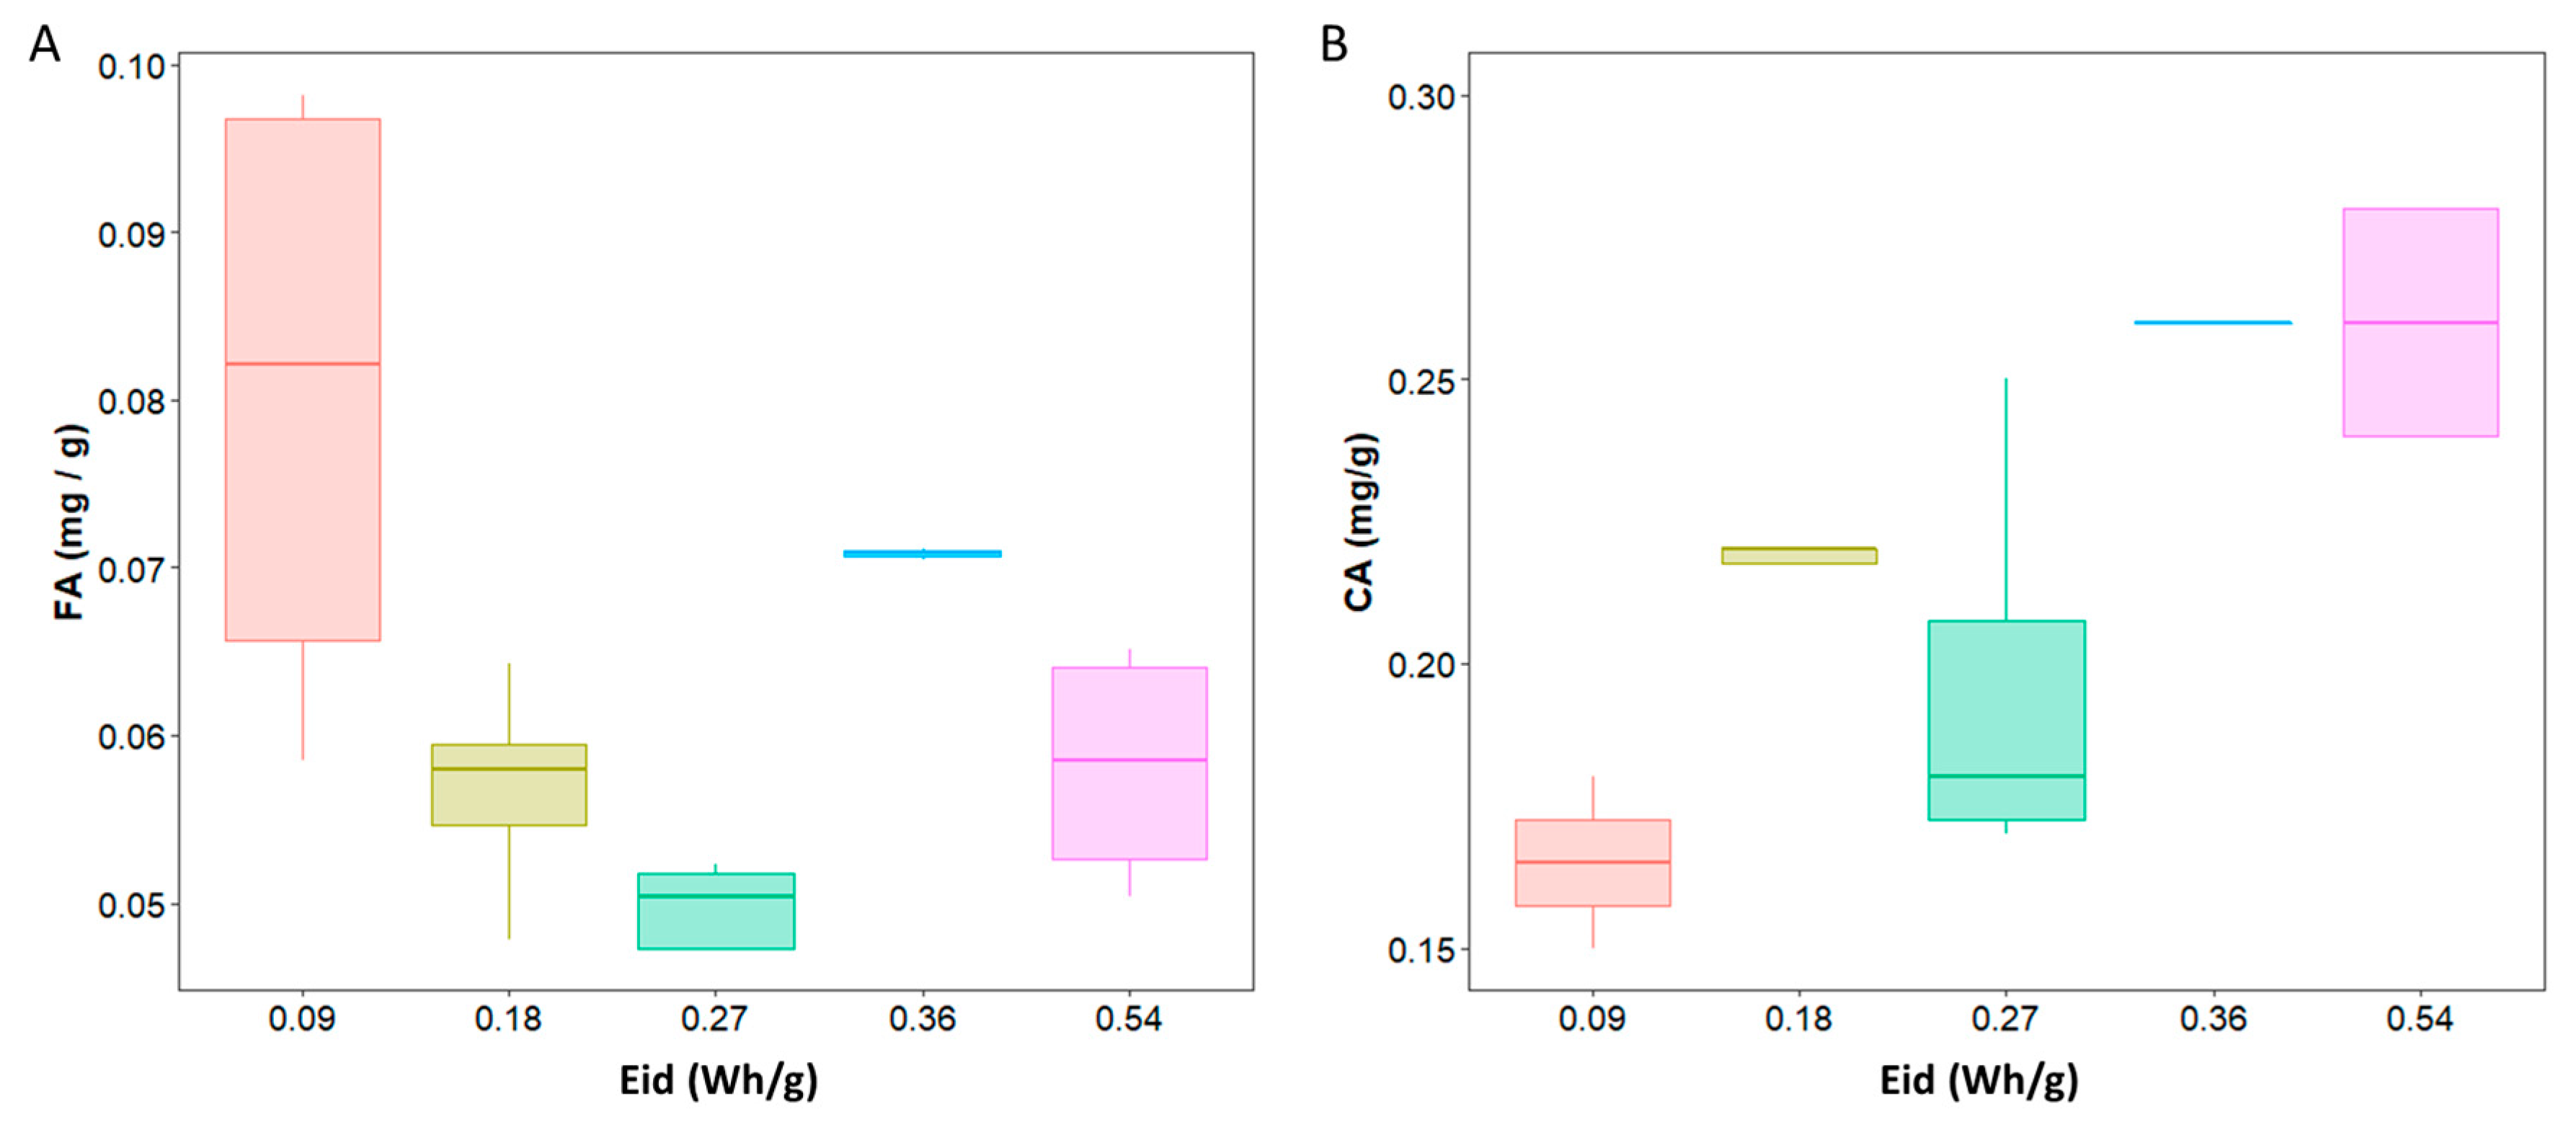
2.3.3. p-Hydroxycinnamic Acids Release Depending on Power Density
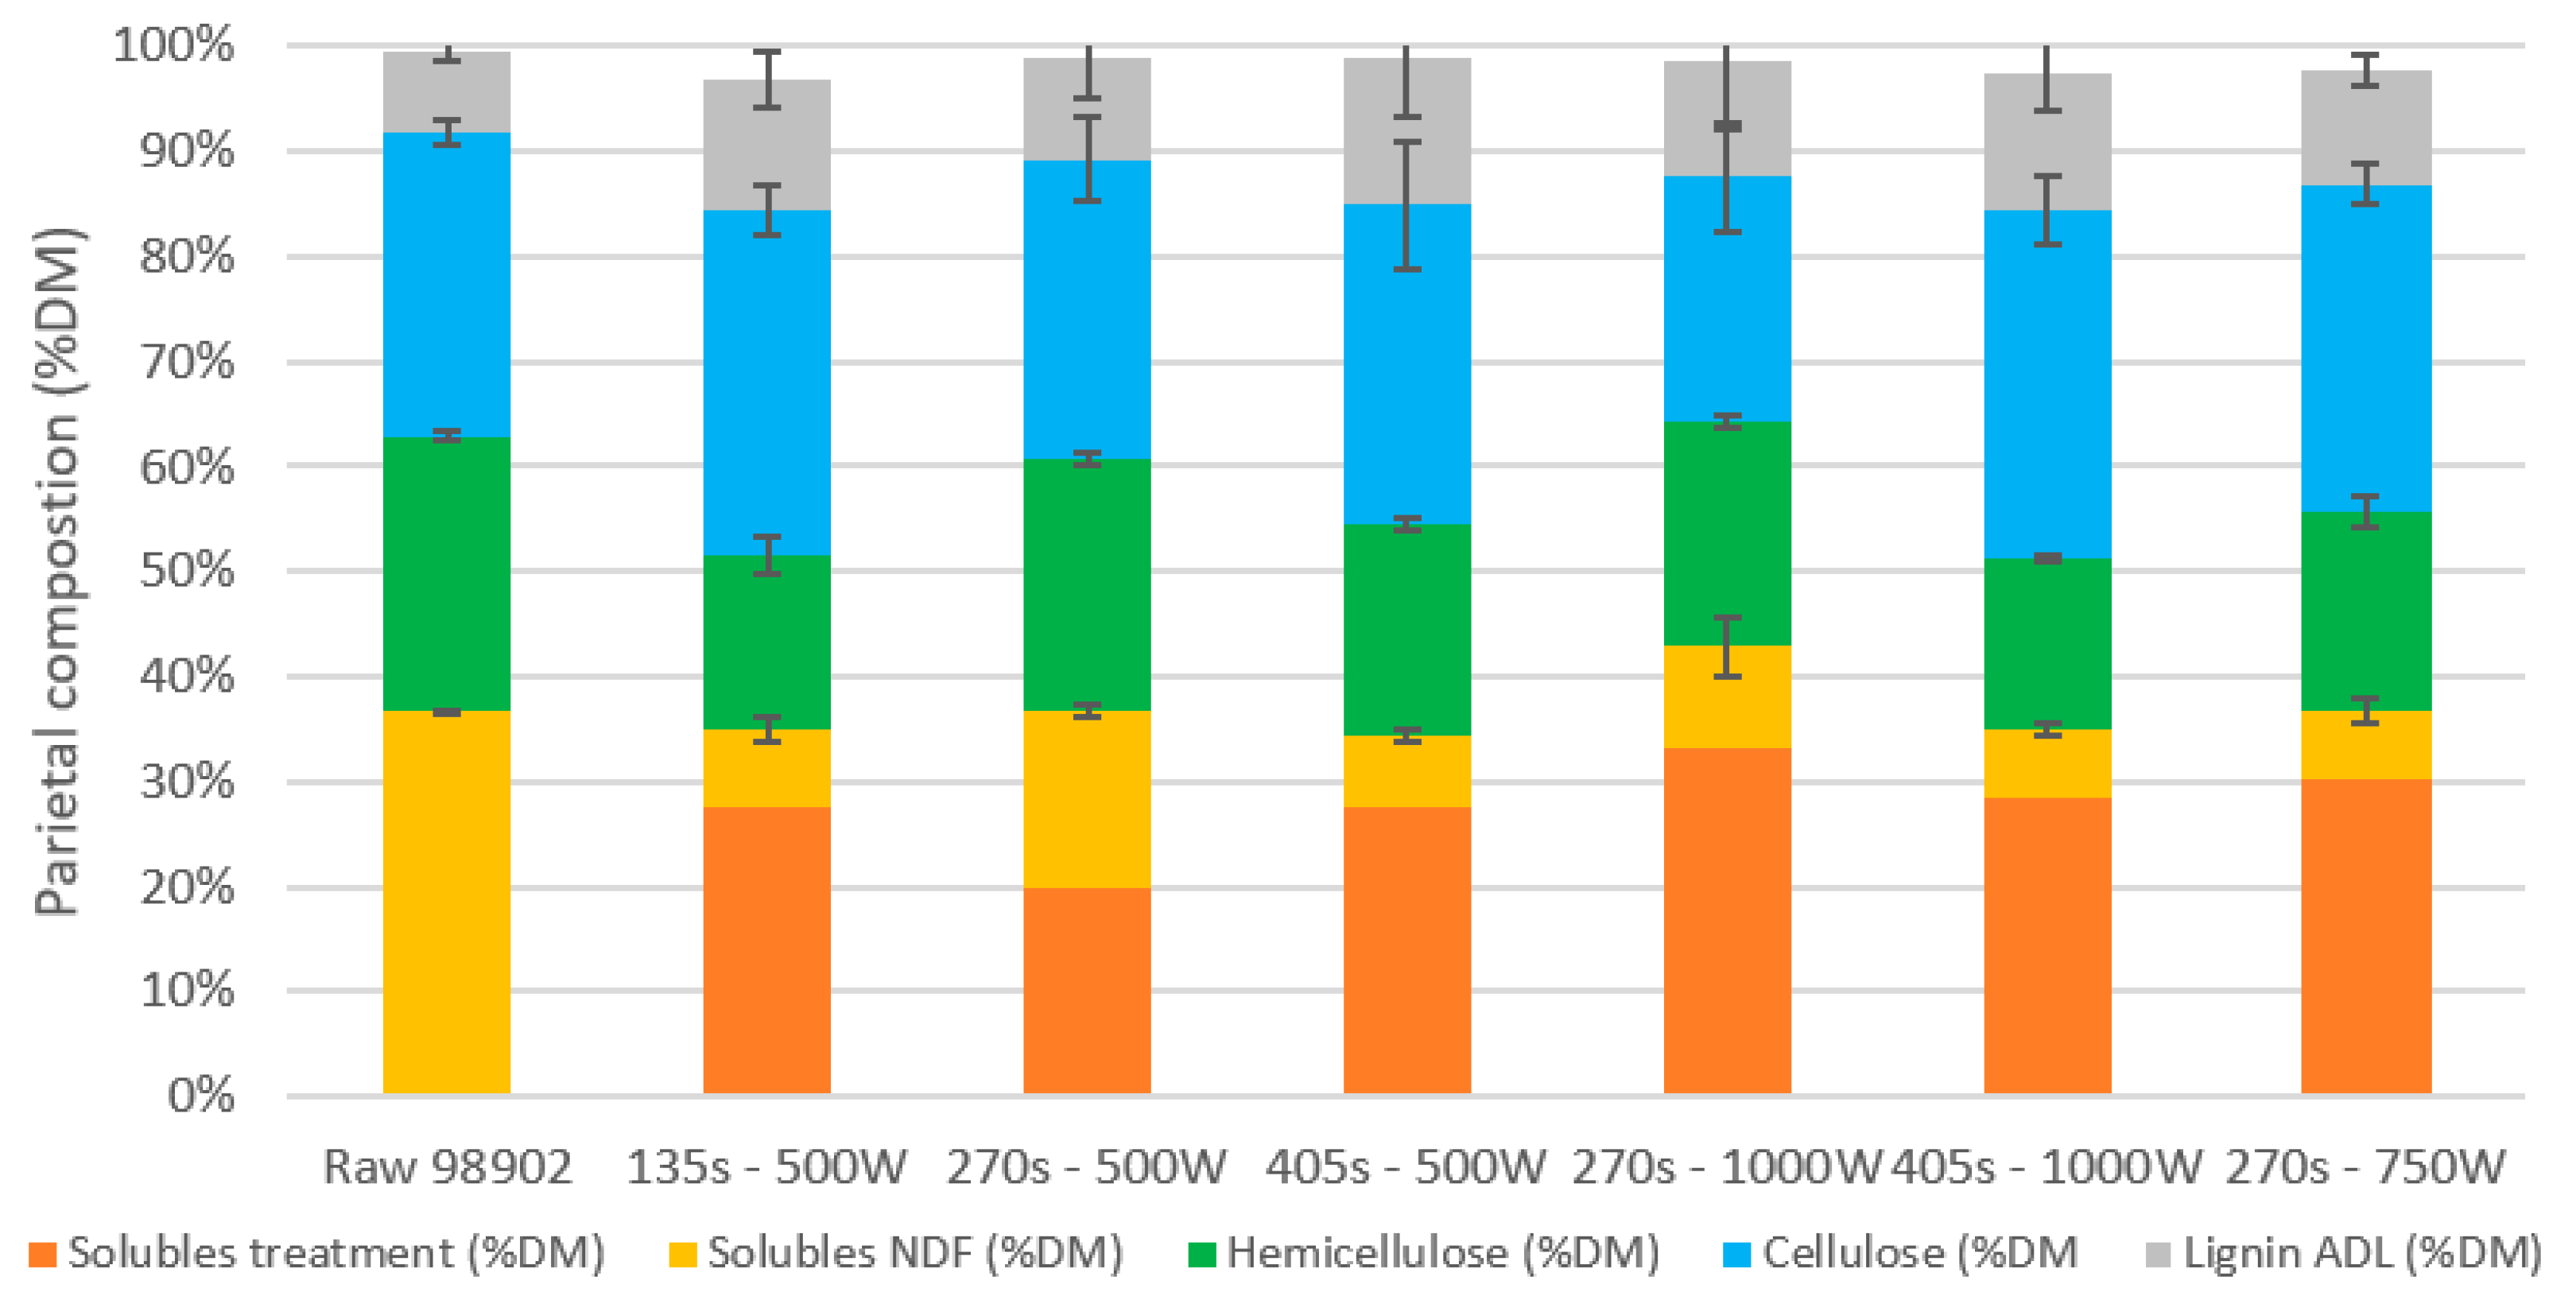
2.3.4. Effect of Operational Conditions on the Pretreated Biomass Composition
2.4. Microwave Optimum Conditions Applied to Miscanthus
3. Materials and Methods
3.1. Raw Biomass
3.2. Chemicals
3.3. Microwave Pretreatment (MW)
3.4. Energy Calculations
3.5. Conventional Heating Treatment (Conv)
3.6. Control treatment (C)
3.7. Ferulic and Coumaric Acids Analysis
3.8. Biomass Composition Analysis
3.9. Statistical Analysis and Response Surface Methodology Method
4. Conclusions
Author Contributions
Funding
Acknowledgments
Conflicts of Interest
References
- Fatma, S.; Hameed, A.; Noman, M.; Ahmed, T.; Shahid, M.; Tariq, M.; Sohail, I.; Tabassum, R. Lignocellulosic Biomass: A Sustainable Bioenergy Source for the Future. Protein Pept. Lett. 2018, 25, 148–163. [Google Scholar] [CrossRef]
- Apprich, S.; Tirpanalan, Ö.; Hell, J.; Reisinger, M.; Böhmdorfer, S.; Siebenhandl-Ehn, S.; Novalin, S.; Kneifel, W. Wheat bran-based biorefinery 2: Valorization of products. LWT 2014, 56, 222–231. [Google Scholar] [CrossRef]
- Naczk, M.; Shahidi, F. Extraction and analysis of phenolics in food. J. Chromatogr. A 2004, 1054, 95–111. [Google Scholar] [CrossRef]
- Xing, Y.M.; White, P.J. Identification and function of antioxidants from oat greats and hulls. J. Am. Oil Chem. Soc. 1997, 74, 303–307. [Google Scholar] [CrossRef]
- Grabber, J.H.; Quideau, S.; Ralph, J. p-coumaroylated syringyl units in maize lignin: Implications for beta-ether cleavage by thioacidolysis. Phytochemistry 1996, 43, 1189–1194. [Google Scholar] [CrossRef]
- Kondo, T.; Mizuno, K.; Kato, T. Cell wall-bound para-coumaric and ferulic acids in italian ryegrass. Can. J. Plant. Sci. 1990, 70, 495–499. [Google Scholar] [CrossRef]
- Helm, R.F.; Ralph, J. Lignin hydroxycinnamyl model compounds related to forage cell-wall structure. 2. Ester-linked structures. J. Agric. Food Chem. 1993, 41, 570–576. [Google Scholar] [CrossRef]
- Bichot, A.; Delgenès, J.-P.; Méchin, V.; Carrère, H.; Bernet, N.; García-Bernet, D. Understanding biomass recalcitrance in grasses for their efficient utilization as biorefinery feedstock. Rev. Environ. Sci. 2018, 17, 707–748. [Google Scholar] [CrossRef]
- Ragauskas, A.; Williams, C.K.; Davison, B.H.; Britovsek, G.; Cairney, J.; Eckert, C.A.; Frederick, W.J.; Hallett, J.; Leak, D.J.; Liotta, C.L.; et al. The Path Forward for Biofuels and Biomaterials. Science 2006, 311, 484–489. [Google Scholar] [CrossRef] [PubMed]
- Chang, V.S.; Holtzapple, M.T. Fundamental Factors Affecting Biomass Enzymatic Reactivity. Twenty-First Symposium on Biotechnology for Fuels and Chemicals 2000, 6, 5–37. [Google Scholar]
- Weijde, T.V.D.; Alvim Kamei, C.L.; Torres, A.F.; Vermerris, W.; Dolstra, O.; Visser, R.G.F.; Trindade, L.M. The potential of C4 grasses for cellulosic biofuel production. Frontiers in Plant Science 2013, 4, 107. [Google Scholar] [PubMed]
- Dupoiron, S.; Lameloise, M.-L.; Bedu, M.; Lewandowski, R.; Fargues, C.; Allais, F.; Teixeira, A.R.S.; Rakotoarivonina, H.; Rémond, C. Recovering ferulic acid from wheat bran enzymatic hydrolysate by a novel and non-thermal process associating weak anion-exchange and electrodialysis. Sep. Purif. Technol. 2018, 200, 75–83. [Google Scholar] [CrossRef]
- Buranov, A.U.; Mazza, G. Extraction and purification of ferulic acid from flax shives, wheat and corn bran by alkaline hydrolysis and pressurized solvents. Food Chem. 2009, 115, 1542–1548. [Google Scholar] [CrossRef]
- Bundhoo, Z.M. Microwave-assisted conversion of biomass and waste materials to biofuels. Renew. Sustain. Energy Rev. 2018, 82, 1149–1177. [Google Scholar] [CrossRef]
- Zhang, H.-F.; Yang, X.-H.; Wang, Y. Microwave assisted extraction of secondary metabolites from plants: Current status and future directions. Trends Food Sci. Technol. 2011, 22, 672–688. [Google Scholar] [CrossRef]
- Alqaralleh, R.M.; Kennedy, K.; Delatolla, R. Microwave vs. alkaline-microwave pretreatment for enhancing Thickened Waste Activated Sludge and fat, oil, and grease solubilization, degradation and biogas production. J. Environ. Manag. 2019, 233, 378–392. [Google Scholar] [CrossRef] [PubMed]
- Provan, G.J.; Scobbie, L.; Chesson, A. Determination of phenolic acids in plant cell walls by microwave digestion. J. Sci. Food Agric. 1994, 64, 63–65. [Google Scholar] [CrossRef]
- Carniel, N.; Dallago, R.M.; Dariva, C.; Bender, J.P.; Nunes, A.L.; Zanella, O.; Bilibio, D.; Luiz Priamo, W. Microwave-Assisted Extraction of Phenolic Acids and Flavonoids from Physalis angulata. J. Food Process Eng. 2017, 40, e12433. [Google Scholar] [CrossRef]
- Favretto, L. Basic Guidelines for Microwave Organic Chemistry Applications; Milestone: Bergamo, Italy, 2014. [Google Scholar]
- Eskilsson, C.S.; Björklund, E. Analytical-scale microwave-assisted extraction. J. Chromatogr. A 2000, 902, 227–250. [Google Scholar] [CrossRef]
- Oufnac, D.S.; Xu, Z.; Sun, T.; Sabliov, C.; Prinyawiwatkul, W.; Godber, J.S. Extraction of Antioxidants from Wheat Bran Using Conventional Solvent and Microwave-Assisted Methods. Cereal Chem. J. 2007, 84, 125–129. [Google Scholar] [CrossRef]
- Del Rio, A.V.; Palmeiro-Sanchez, T.; Figueroa, M.; Mosquera-Corral, A.; Campos, J.L.; Mendez, R. Anaerobic digestion of aerobic granular biomass: effects of thermal pre-treatment and addition of primary sludge. J. Chem. Technol. Biotechnol. 2014, 89, 690–697. [Google Scholar] [CrossRef]
- Jung, H.-J.G.; Varel, V.H.; Weimer, P.J.; Ralph, J. Accuracy of Klason Lignin and Acid Detergent Lignin Methods As Assessed by Bomb Calorimetry. J. Agric. Food Chem. 1999, 47, 2005–2008. [Google Scholar] [CrossRef] [PubMed]
- Choudhary, R.; Umagiliyage, A.L.; Liang, Y.; Siddaramu, T.; Haddock, J.; Markevicius, G. Microwave pretreatment for enzymatic saccharification of sweet sorghum bagasse. Biomass-Bioenergy 2012, 39, 218–226. [Google Scholar] [CrossRef]
- Lam, T.B.T.; Iiyama, K.; Stone, B.A. Distribution of free and combined phenolic acids in wheat internodes. Phytochemistry 1990, 29, 429–433. [Google Scholar]
- Mathew, S.; Abraham, T.E. Ferulic Acid: An Antioxidant Found Naturally in Plant Cell Walls and Feruloyl Esterases Involved in its Release and Their Applications. Crit. Rev. Biotechnol. 2004, 24, 59–83. [Google Scholar] [CrossRef]
- Mussatto, S.I.; Dragone, G.; Roberto, I.C. Ferulic and p-coumaric acids extraction by alkaline hydrolysis of brewer’s spent grain. Ind. Crop. Prod. 2007, 25, 231–237. [Google Scholar] [CrossRef]
- Moreira, M.M.; Morais, S.; Barros, A.A.; Delerue-Matos, C.; Guido, L.F. A novel application of microwave-assisted extraction of polyphenols from brewer’s spent grain with HPLC-DAD-MS analysis. Anal. Bioanal. Chem. 2012, 403, 1019–1029. [Google Scholar] [CrossRef]
- Díaz, A.B.; Moretti, M.M.D.S.; Bezerra-Bussoli, C.; Nunes, C.D.C.C.; Blandino, A.; Da Silva, R.; Gomes, E. Evaluation of microwave-assisted pretreatment of lignocellulosic biomass immersed in alkaline glycerol for fermentable sugars production. Bioresour. Technol. 2015, 185, 316–323. [Google Scholar] [CrossRef]
- Moodley, P.; Kana, E.G. Development of a steam or microwave-assisted sequential salt-alkali pretreatment for lignocellulosic waste: Effect on delignification and enzymatic hydrolysis. Energy Convers. Manag. 2017, 148, 801–808. [Google Scholar] [CrossRef]
- Joglekar, A.M.; May, A.T. Product excellence through design of experiments. Cereal Foods World 1987, 32, 857. [Google Scholar]
- Carrión-Prieto, P.; Martín-Ramos, P.; Hernández-Navarro, S.; Sánchez-Sastre, L.F.; Marcos-Robles, J.L.; Martín-Gil, J. Furfural, 5-HMF, acid-soluble lignin and sugar contents in C. ladanifer and E. arborea lignocellulosic biomass hydrolysates obtained from microwave-assisted treatments in different solvents. Biomass-Bioenergy 2018, 119, 135–143. [Google Scholar] [CrossRef]
- Pinela, J.; Prieto, M.A.; Carvalho, A.M.; Barreiro, M.F.; Oliveira, M.B.P.; Barros, L.; Ferreira, I.C.; Barreiro, F. Microwave-assisted extraction of phenolic acids and flavonoids and production of antioxidant ingredients from tomato: A nutraceutical-oriented optimization study. Sep. Purif. Technol. 2016, 164, 114–124. [Google Scholar] [CrossRef]
- Liazid, A.; Palma, M.; Brigui, J.; Barroso, C.G.; Lovillo, M.P. Investigation on phenolic compounds stability during microwave-assisted extraction. J. Chromatogr. A 2007, 1140, 29–34. [Google Scholar] [CrossRef] [PubMed]
- de Oliveira, D.M.; Finger-Teixeira, A.; Mota, T.R.; Salvador, V.H.; Moreira-Vilar, F.C.; Molinari, H.B.C.; Craig Mitchell, R.A.; Marchiosi, R.; Ferrarese-Filho, O.; Dantas dos Santos, W. Ferulic acid: A key component in grass lignocellulose recalcitrance to hydrolysis. Plant Biotechnol. J. 2015, 13, 1224–1232. [Google Scholar] [CrossRef] [PubMed]
- Boonmanumsin, P.; Treeboobpha, S.; Jeamjumnunja, K.; Luengnaruemitchai, A.; Chaisuwan, T.; Wongkasemjit, S. Release of monomeric sugars from Miscanthus sinensis by microwave-assisted ammonia and phosphoric acid treatments. Bioresour. Technol. 2012, 103, 425–431. [Google Scholar] [CrossRef]
- Oussaid, S.; Madani, K.; Houali, K.; Rendueles, M.; Díaz, M. Optimized microwave-assisted extraction of phenolic compounds from Scirpus holoschoenus and its antipseudomonal efficacy, alone or in combination with Thymus fontanesii essential oil and lactic acid. Food Bioprod. Process. 2018, 110, 85–95. [Google Scholar] [CrossRef]
- Galan, A.-M.; Calinescu, I.; Trifan, A.; Winkworth-Smith, C.; Calvo-Carrascal, M.; Dodds, C.; Binner, E. New insights into the role of selective and volumetric heating during microwave extraction: Investigation of the extraction of polyphenolic compounds from sea buckthorn leaves using microwave-assisted extraction and conventional solvent extraction. Chem. Eng. Process. 2017, 116, 29–39. [Google Scholar] [CrossRef]
- Thomas, H.L.; Pot, D.; Latrille, E.; Trouche, G.; Bonnal, L.; Bastianelli, D.; Carrère, H. Sorghum Biomethane Potential Varies with the Genotype and the Cultivation Site. Waste Biomass Valorization 2019, 10, 783–788. [Google Scholar] [CrossRef]
- Goering, H.U.; Van Soest, P.J. Forage fiber analyses (apparatus, reagents, procedures, and some applications). In No. 379. US Agricultural Research Service; US government printing office: Washington, DC, USA, 1970. [Google Scholar]
- Dence, C.W. The Determination of Lignin. In Methods in Lignin Chemistry; Springer: Berlin, Germany, 1992; pp. 33–61. [Google Scholar]
- Hatfield, R.; Fukushima, R.S. Can lignin be accurately measured? Crop Sci. 2005, 45, 832–839. [Google Scholar] [CrossRef]
- Zhang, Y.; Culhaoglu, T.; Pollet, B.; Melin, C.; Denoue, D.; Barrière, Y.; Baumberger, S.; Méchin, V. Impact of Lignin Structure and Cell Wall Reticulation on Maize Cell Wall Degradability. J. Agric. Food Chem. 2011, 59, 10129–10135. [Google Scholar] [CrossRef]
- Oliveira, J.; Alves, M.; Costa, J.; Alves, M. Optimization of biogas production from Sargassum sp. using a design of experiments to assess the co-digestion with glycerol and waste frying oil. Bioresour. Technol. 2015, 175, 480–485. [Google Scholar] [CrossRef] [PubMed]
- Thomas, H.L.; Seira, J.; Escudie, R.; Carrere, H. Lime Pretreatment of Miscanthus: Impact on BMP and Batch Dry Co-Digestion with Cattle Manure. Molecules 2018, 23, 13. [Google Scholar] [CrossRef] [PubMed]
- Witek-Krowiak, A.; Chojnacka, K.; Podstawczyk, D.; Dawiec, A.; Pokomeda, K. Application of response surface methodology and artificial neural network methods in modelling and optimization of biosorption process. Bioresour. Technol. 2014, 160, 150–160. [Google Scholar] [CrossRef] [PubMed]
Sample Availability: Samples of the compounds are not available from the authors. |


| Corn Stalks F98902 | Miscanthus Stalks GIB Genotype | ||
|---|---|---|---|
| Soluble Content (%) | 35.67 ± 1 | 4.81 ± 1 | |
| Parietal Composition using Van Soest Method (%DM) | Cell wall | 64.33 ± 1 | 95.19 ± 1 |
| Cellulose | 28.87 ± 0.5 | 55.75 ± 1.6 | |
| Hemicellulose | 26.06 ± 1 | 21.75 ± 1.1 | |
| ADL | 8.18 ± 1.7 | 16.86 ± 1.6 | |
| Ash | 1.22 ± 0.3 | 0.83 ± 0.5 | |
| Klason Lignin (% DM) | 15.00 ± 0.5 | 24.34 ±0.2 | |
| p- Hydroxycinnamic Acids (mg/g DM) | Ferulic acid | 4.2 ± 0.9 | 2.1 ± 0.5 |
| Coumaric acid | 13.1 ± 2.6 | 6.5 ± 2.3 | |
| Solvent | Reactant Concentration (mg/g liquid) | Reactant Mass (mg/g DM) | Initial pH | Final pH | Microwave Heating (mg/g DM) | Final Microwave Temperature (°C) | Conventional Heating (mg/g DM) | Final Conventional Temperature (°C) | Control (mg/g DM) | |||
|---|---|---|---|---|---|---|---|---|---|---|---|---|
| CA | FA | CA | FA | CA | FA | |||||||
| Water | / | / | 5.3 | 5.1 | 0.201 ± 0.4% | 0.047 ± 0.1% | 99 | 0.125 ± 0.1% | 0.051 ± 0.2% | 69 | 0.085 ± 0.3% | 0.057 ± 0.2% |
| Acid | 0.34 | 7.3 | 3.95 | 3.7 | 0.113 ± 1.2% | 0.030 ± 0.3% | 99 | 0.071 ± 0.6% | 0.027 ± 0.3% | 66 | 0.060 ± 0.2% | 0.025 ± 0.4% |
| Base | 0.12 | 27 | 8.5 | 8.3 | 0.247 ± 0.1% | 0.056 ± 0.1% | 99 | 0.230 ± 0.5% | 0.081 ± 0.3% | 71 | 0.173 ± 1.4% | 0.093 ± 1.6% |
| Ethanol | 500 | / | 5.5 | 5.5 | 0.298 ± 0.6% | 0.037 ± 0.4% | 81 | 0.174 ± 0.1% | 0.035 ± 0.3% | 75 | 0.159 ± 0.5% | 0.038 ± 0.5% |
| Factor | CA | FA | ||||||||
|---|---|---|---|---|---|---|---|---|---|---|
| d.f. | SS | MS | F | p | d.f. | SS | MS | F | p | |
| Treatment | 2 | 0.0380 | 0.0190 | 39.23 | 2.7 × 10⁻⁷ * | 2 | 0.0005 | 0.0002 | 3.086 | 0.0704 |
| Solvent | 3 | 0.0747 | 0.0249 | 51.31 | 5.07 × 10⁻⁹ * | 3 | 0.0082 | 0.0027 | 34.506 | 1.13 × 10⁻⁷ * |
| Residuals | 18 | 0.0087 | 0.0004 | 18 | 0.0014 | 0.0001 | ||||
| Assay | T Final (°C) | FA (mg/g) | FA Yield (%) | CA (mg/g) | CA Yield (%) |
|---|---|---|---|---|---|
| 1 | 63 | 0.080 ± 2% | 1.90 | 0.166 ± 1.1% | 1.3 |
| 2 | 98 | 0.058 ± 0.1% | 1.38 | 0.216 ± 0.1% | 1.6 |
| 3 | 99 | 0.056 ± 0.8% | 1.33 | 0.219 ± 1.1% | 1.7 |
| 4 | 99 | 0.071 ± 0.1% | 1.69 | 0.260 ± 0.1% | 2.0 |
| 5 | 98 | 0.059 ± 0.9% | 1.40 | 0.229 ± 2.8% | 1.7 |
| 6 | 98 | 0.058 ± 0.7% | 1.38 | 0.260 ± 1.9% | 2.0 |
| 7/8/9 | 98 | 0.048 ± 0.2% | 1.14 | 0.176 ± 0.3% | 1.3 |
| Factor | CA | FA | ||||||||
|---|---|---|---|---|---|---|---|---|---|---|
| d.f. | SS | MS | F | p | d.f. | SS | MS | F | p | |
| Duration (sec) | 1 | 0.011 | 0.01 | 16.59 | 3.6 × 10⁻⁴ * | 1 | 4.2 × 10⁻⁴ | 0 | 2.65 | 0.115 |
| Power (W) | 1 | 0.009 | 0.009 | 14.15 | 8.3 × 10⁻⁴ * | 1 | 4.6 × 10⁻⁵ | 0 | 0.28 | 0.597 |
| Residuals | 27 | 0 | 6.9 × 10⁻⁴ | 27 | 0 | 0 | ||||
| Total Mass (g) | Pi (W) | Pid (W/g) | Duration (s) | Eid (Wh/g) |
|---|---|---|---|---|
| 210 | 500 | 2.38 | 135 | 0.089 |
| 210 | 1000 | 4.76 | 135 | 0.179 |
| 210 | 500 | 2.38 | 270 | 0.179 |
| 210 | 1000 | 4.76 | 270 | 0.357 |
| 210 | 500 | 2.38 | 405 | 0.268 |
| 210 | 1000 | 4.76 | 405 | 0.536 |
| 210 | 750 | 3.57 | 270 | 0.268 |
| FA Recovery Yield (%) | CA Recovery Yield (%) | ||
|---|---|---|---|
| MW 1000 W–405 s | Corn stalks | 1.38 ± 0.1 | 1.97 ± 0.0 |
| Miscanthus stalks | 0.58 ± 0.2 | 3.89 ± 0.2 | |
| Conventional heating | Miscanthus stalks | 0.53 ± 0.0 | 1.94 ± 0.4 |
| Control (no heating) | Miscanthus stalks | 0.47 ± 0.0 | 1.46 ± 0.0 |
| Assay | Parameter X1: Duration (sec) | Parameter X2: Power (W) | ||
|---|---|---|---|---|
| Code | Value | Code | Value | |
| 1 | −1 | 135 | −1 | 500 |
| 2 | −1 | 135 | 1 | 1000 |
| 3 | 0 | 270 | −1 | 500 |
| 4 | 0 | 270 | 1 | 1000 |
| 5 | 1 | 405 | −1 | 500 |
| 6 | 1 | 405 | 1 | 1000 |
| 7/8/9 | 0 | 270 | 0 | 750 |
© 2019 by the authors. Licensee MDPI, Basel, Switzerland. This article is an open access article distributed under the terms and conditions of the Creative Commons Attribution (CC BY) license (http://creativecommons.org/licenses/by/4.0/).
Share and Cite
Bichot, A.; Lerosty, M.; Geirnaert, L.; Méchin, V.; Carrère, H.; Bernet, N.; Delgenès, J.-P.; García-Bernet, D. Soft Microwave Pretreatment to Extract P-Hydroxycinnamic Acids from Grass Stalks. Molecules 2019, 24, 3885. https://doi.org/10.3390/molecules24213885
Bichot A, Lerosty M, Geirnaert L, Méchin V, Carrère H, Bernet N, Delgenès J-P, García-Bernet D. Soft Microwave Pretreatment to Extract P-Hydroxycinnamic Acids from Grass Stalks. Molecules. 2019; 24(21):3885. https://doi.org/10.3390/molecules24213885
Chicago/Turabian StyleBichot, Aurélie, Mickaël Lerosty, Laureline Geirnaert, Valérie Méchin, Hélène Carrère, Nicolas Bernet, Jean-Philippe Delgenès, and Diana García-Bernet. 2019. "Soft Microwave Pretreatment to Extract P-Hydroxycinnamic Acids from Grass Stalks" Molecules 24, no. 21: 3885. https://doi.org/10.3390/molecules24213885
APA StyleBichot, A., Lerosty, M., Geirnaert, L., Méchin, V., Carrère, H., Bernet, N., Delgenès, J.-P., & García-Bernet, D. (2019). Soft Microwave Pretreatment to Extract P-Hydroxycinnamic Acids from Grass Stalks. Molecules, 24(21), 3885. https://doi.org/10.3390/molecules24213885