Article

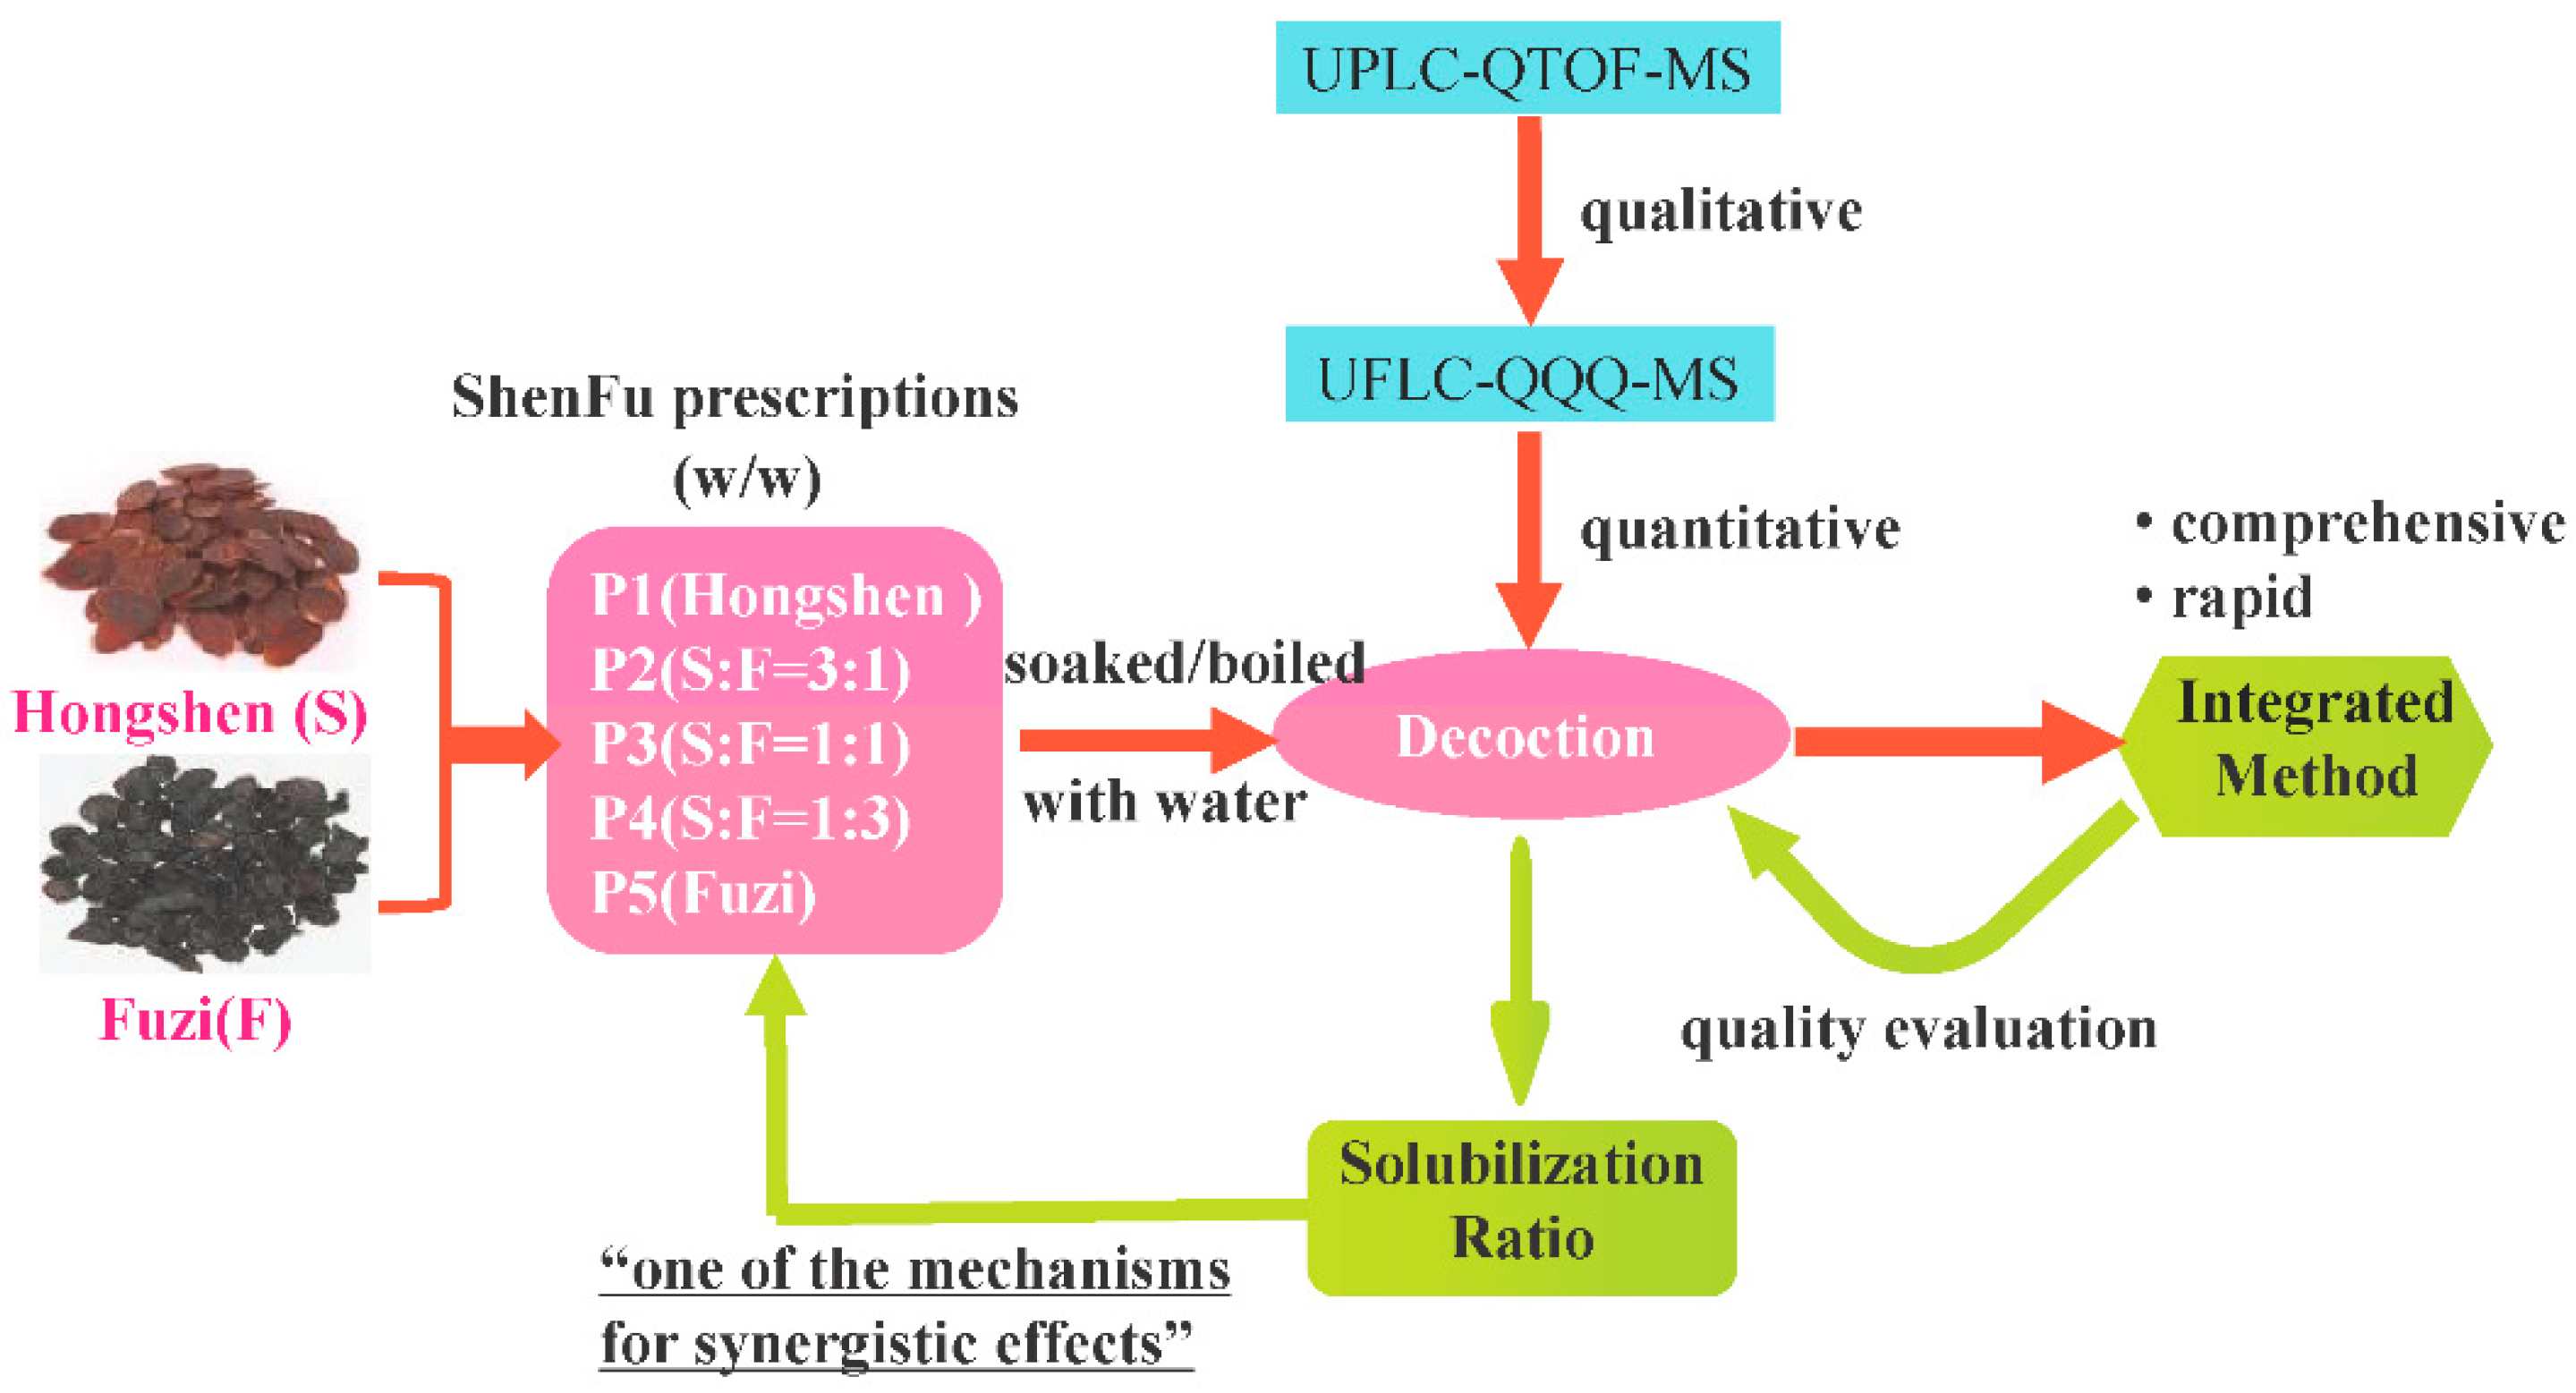
A Comprehensive and Rapid Quality Evaluation Method of Traditional Chinese Medicine Decoction by Integrating UPLC-QTOF-MS and UFLC-QQQ-MS and Its Application

1
College of Pharmacy, Hunan University of Chinese Medicine, Changsha 410208, China
2
College of Pharmacy, Jiangxi University of Traditional Chinese Medicine, Nanchang 330004, China
3
Key Laboratory of Pharmacology of Traditional Chinese Medicine in Jiangxi, Jiangxi University of Traditional Chinese Medicine, Nanchang 330004, China
4
Research Center for Differention and Development of TCM Basic Theory, Jiangxi University of Traditional Chinese Medicine, Nanchang 330004, China
5
Jiangxi Province Key Laboratory of TCM Etiopathogenisis, Jiangxi University of Traditional Chinese Medicine, Nanchang 330004, China
*
Authors to whom correspondence should be addressed.
Molecules 2019, 24(2), 374; https://doi.org/10.3390/molecules24020374
Submission received: 26 December 2018 / Revised: 18 January 2019 / Accepted: 19 January 2019 / Published: 21 January 2019

Abstract

:
Decoction is one of the oldest forms of traditional Chinese medicine and it is widely used in clinical practice. However, the quality evaluation and control of traditional decoction is a challenge due to the characteristics of complicated constituents, water as solvent, and temporary preparation. ShenFu Prescription Decoction (SFPD) is a classical prescription for preventing and treating many types of cardiovascular disease. In this article, a comprehensive and rapid method for quality evaluation and control of SFPD was developed, via qualitative and quantitative analysis of the major components by integrating ultra-high-performance liquid chromatography equipped with quadrupole time-of-flight mass spectrometry and ultra-fast-performance liquid chromatography equipped with triple quadrupole mass spectrometry. Consequently, a total of 39 constituents were tentatively identified in qualitative analysis, of which 21 compounds were unambiguously confirmed by comparing with reference substances. We determined 13 important constituents within 7 min by multiple reaction monitoring. The validated method was applied for determining five different proportion SFPDs. It was found that different proportions generated great influence on the dissolution of constituents. This may be one of the mechanisms for which different proportions play different synergistic effects. Therefore, the developed method is a fast and useful approach for quality evaluation of SFPD.

1. Introduction

Decoction of traditional Chinese medicine (TCM) is a liquid dosage form, which is prepared by soaking and decocting the slices or coarse granules of medicinal materials with water and removing the dregs to extract a solution [1,2,3]. It is one of the earliest and most widely used dosage forms in Chinese medical practice and has existed for thousands of years [4]. Not only is decoction a relatively fast and cheap process that is readily available to patients, but also the flexible prescription can satisfy the needs of TCM treatment according to syndrome differentiation [5], Nevertheless, how effective the drug prescription is, depends on the quality of decoction [6]. Furthermore, decoction of TCM is a complex system consisting of many components. Therefore, it is a challenge for quality evaluation and control of traditional decoction.
ShenFu Prescription Decoction (SFPD), comprised of Hongshen (steamed roots of Ginseng Radix et Rhizoma) and Fuzi(Heishunpian, processed lateral roots of Aconitum carmichaeli Debx) [7], is a rather important classical prescription of replenishing Qi and warming Yang, and is recorded in dozens of ancient medical books. Up to now, it is still widely used in clinical practice for preventing and treating many types of cardiovascular disease [8,9,10,11]. However, there are several different dosages ratios of Hongshen and Fuzi for different symptoms, such as 5:1, 3:2, 2:1, 1:2, and so on. Therefore, it is essential to clarify the chemical compositions and develop a fast and powerful approach for quality evaluation and control to ensure the efficacy of SFPD. Previous research has confirmed that the curative effect of SFPD is an integrative effect of ginsenosides and alkaloids [12,13,14]. Several methods for component analysis and determination of major constituents in ShenFu injection and their serum pharmacochemistry have been reported by using HPLC-PAD [15], UPLC-Q-TOF-MS [16,17], and HILIC-RPLC-MS/MS technologies [14]. Few papers have focused specifically on the decoction of ShenFu, either investigating pharmacochemistry [12] or just quantitative analysis for several constituents [18]. Therefore, it is still necessary to develop a set of comprehensive and rapid quality evaluation methods for qualitative analysis and quantitative analysis of the major components in SFPD simultaneously.
However, the conventional column chromatography combined with diode array detector (DAD) [19] or evaporative light scattering detector (ELSD) [20] detector do not satisfy the needs required for accurate and rapid analysis of complex components due to low peak capacity, time-consumption, and low sensitivity. Currently, the high-throughput and high-resolution UPLC-Q-TOF-MS, and ultra-fast and high-sensitivity UFLC-MS/MS systems easily achieve this goal, and are thus are employed as powerful tools for investigating the chemical constituents in complex Chinese medicine [21,22].
In this article, a sensitive and high-throughput UPLC-Q-TOF-MS method was established to analyze and identify the overall constituents of SFPD comprehensively. According to the global constituent profiles, the biological activities of the major constituents [23,24], and their abundance in pre-test samples, seven aconitum alkaloids (benzoylmesaconine (BMA), benzoylhypaconine (BHA), benzoylaconine (BAC), mesaconitine (MA), hypaconitine (HA), aconitine (AC), Fuziline (FZL)), and six ginsenosides(Rb1, Rb3, Rd, Re, Rg1, Ro) were selected as the quality markers for developing a quantitative analysis method by UFLC-QQQ-MS. Following this, the validated method was applied so as to determine the contents of different proportions of SFPD and further investigate the influence on dissolution of constituents generated by different ratios of Hongshen and Fuzi. During this process, a concept of solubilization ratio was introduced to present the effect and to strive to illuminate the potential mechanism of different proportion prescriptions that produce different synergistic effects from a material basis. The flow chart illustrating the strategy is shown in Figure 1.

2. Results and Discussion

2.1. Optimization of UPLC-QTOF-MS and UFLC-QQQ-MS Conditions

It is necessary to optimize the analysis conditions for identifying as many constituents as possible in qualitative analysis of SFPD. Firstly, several columns, such as Agilent Eclipse Plus C18 column (100 mm × 2.1 mm, 3.5 μm), Thermo Scientific Hypersil GOLD C18 column (150 mm × 2.1 mm, 3.5 μm), Waters ACQUITY UPLC BEH C18 column (50 mm × 2.1 mm, 1.7 μm), and Thermo Scientific Hypersil GOLD C18 column (100 mm × 2.1 mm, 1.9 μm) were investigated. The result showed that Thermo Scientific Hypersil GOLD C18 column (100 mm × 2.1 mm, 1.9 μm) provided a better separation for most of the constituents in 30 min. Methanol and acetonitrile were compared as an organic phase and acetonitrile showed a better separation capability. Moreover, when formic acid was added in aqueous phase, the responses and shapes of most chromatographic peaks improved significantly. The 0.1% formic acid was tested to be proper. Several column temperatures (25 °C, 30 °C, 35 °C, and 40 °C), flow rates, and different elution programs were also examined in advance. Finally, mobile phase was composed of 0.1% formic acid in water (A) and acetonitrile (B) with a gradient program as follows: 5% (B) in 0 to 2 min, 5% to 100% (B) in 2 to 30 min and delivered at a flow rate of 0.2 mL/min. The column temperature was operated at 35 °C.
While in quantitative analysis, the column, mobile phase, and other chromatographic conditions were also tested beforehand to achieve a good separation and fast detection for all the analytes. Consequently, the mobile phase was composed of 0.1% formic acid in water (A) and acetonitrile (B) with a very fast gradient program as follows: 5% to 40% (B) in 0 to 3 min, 40% (B) in 3 to 5 min, 40% to 80% (B) in 5 to 5.5 min, 80% (B) in 5.5 to 7 min, 80% to 5% (B) in 7 to 7.1 min, 5% (B) in 7.1 to 9 min. The flow rate was set at 0.3 mL/min and column temperature was operated at 40 °C.

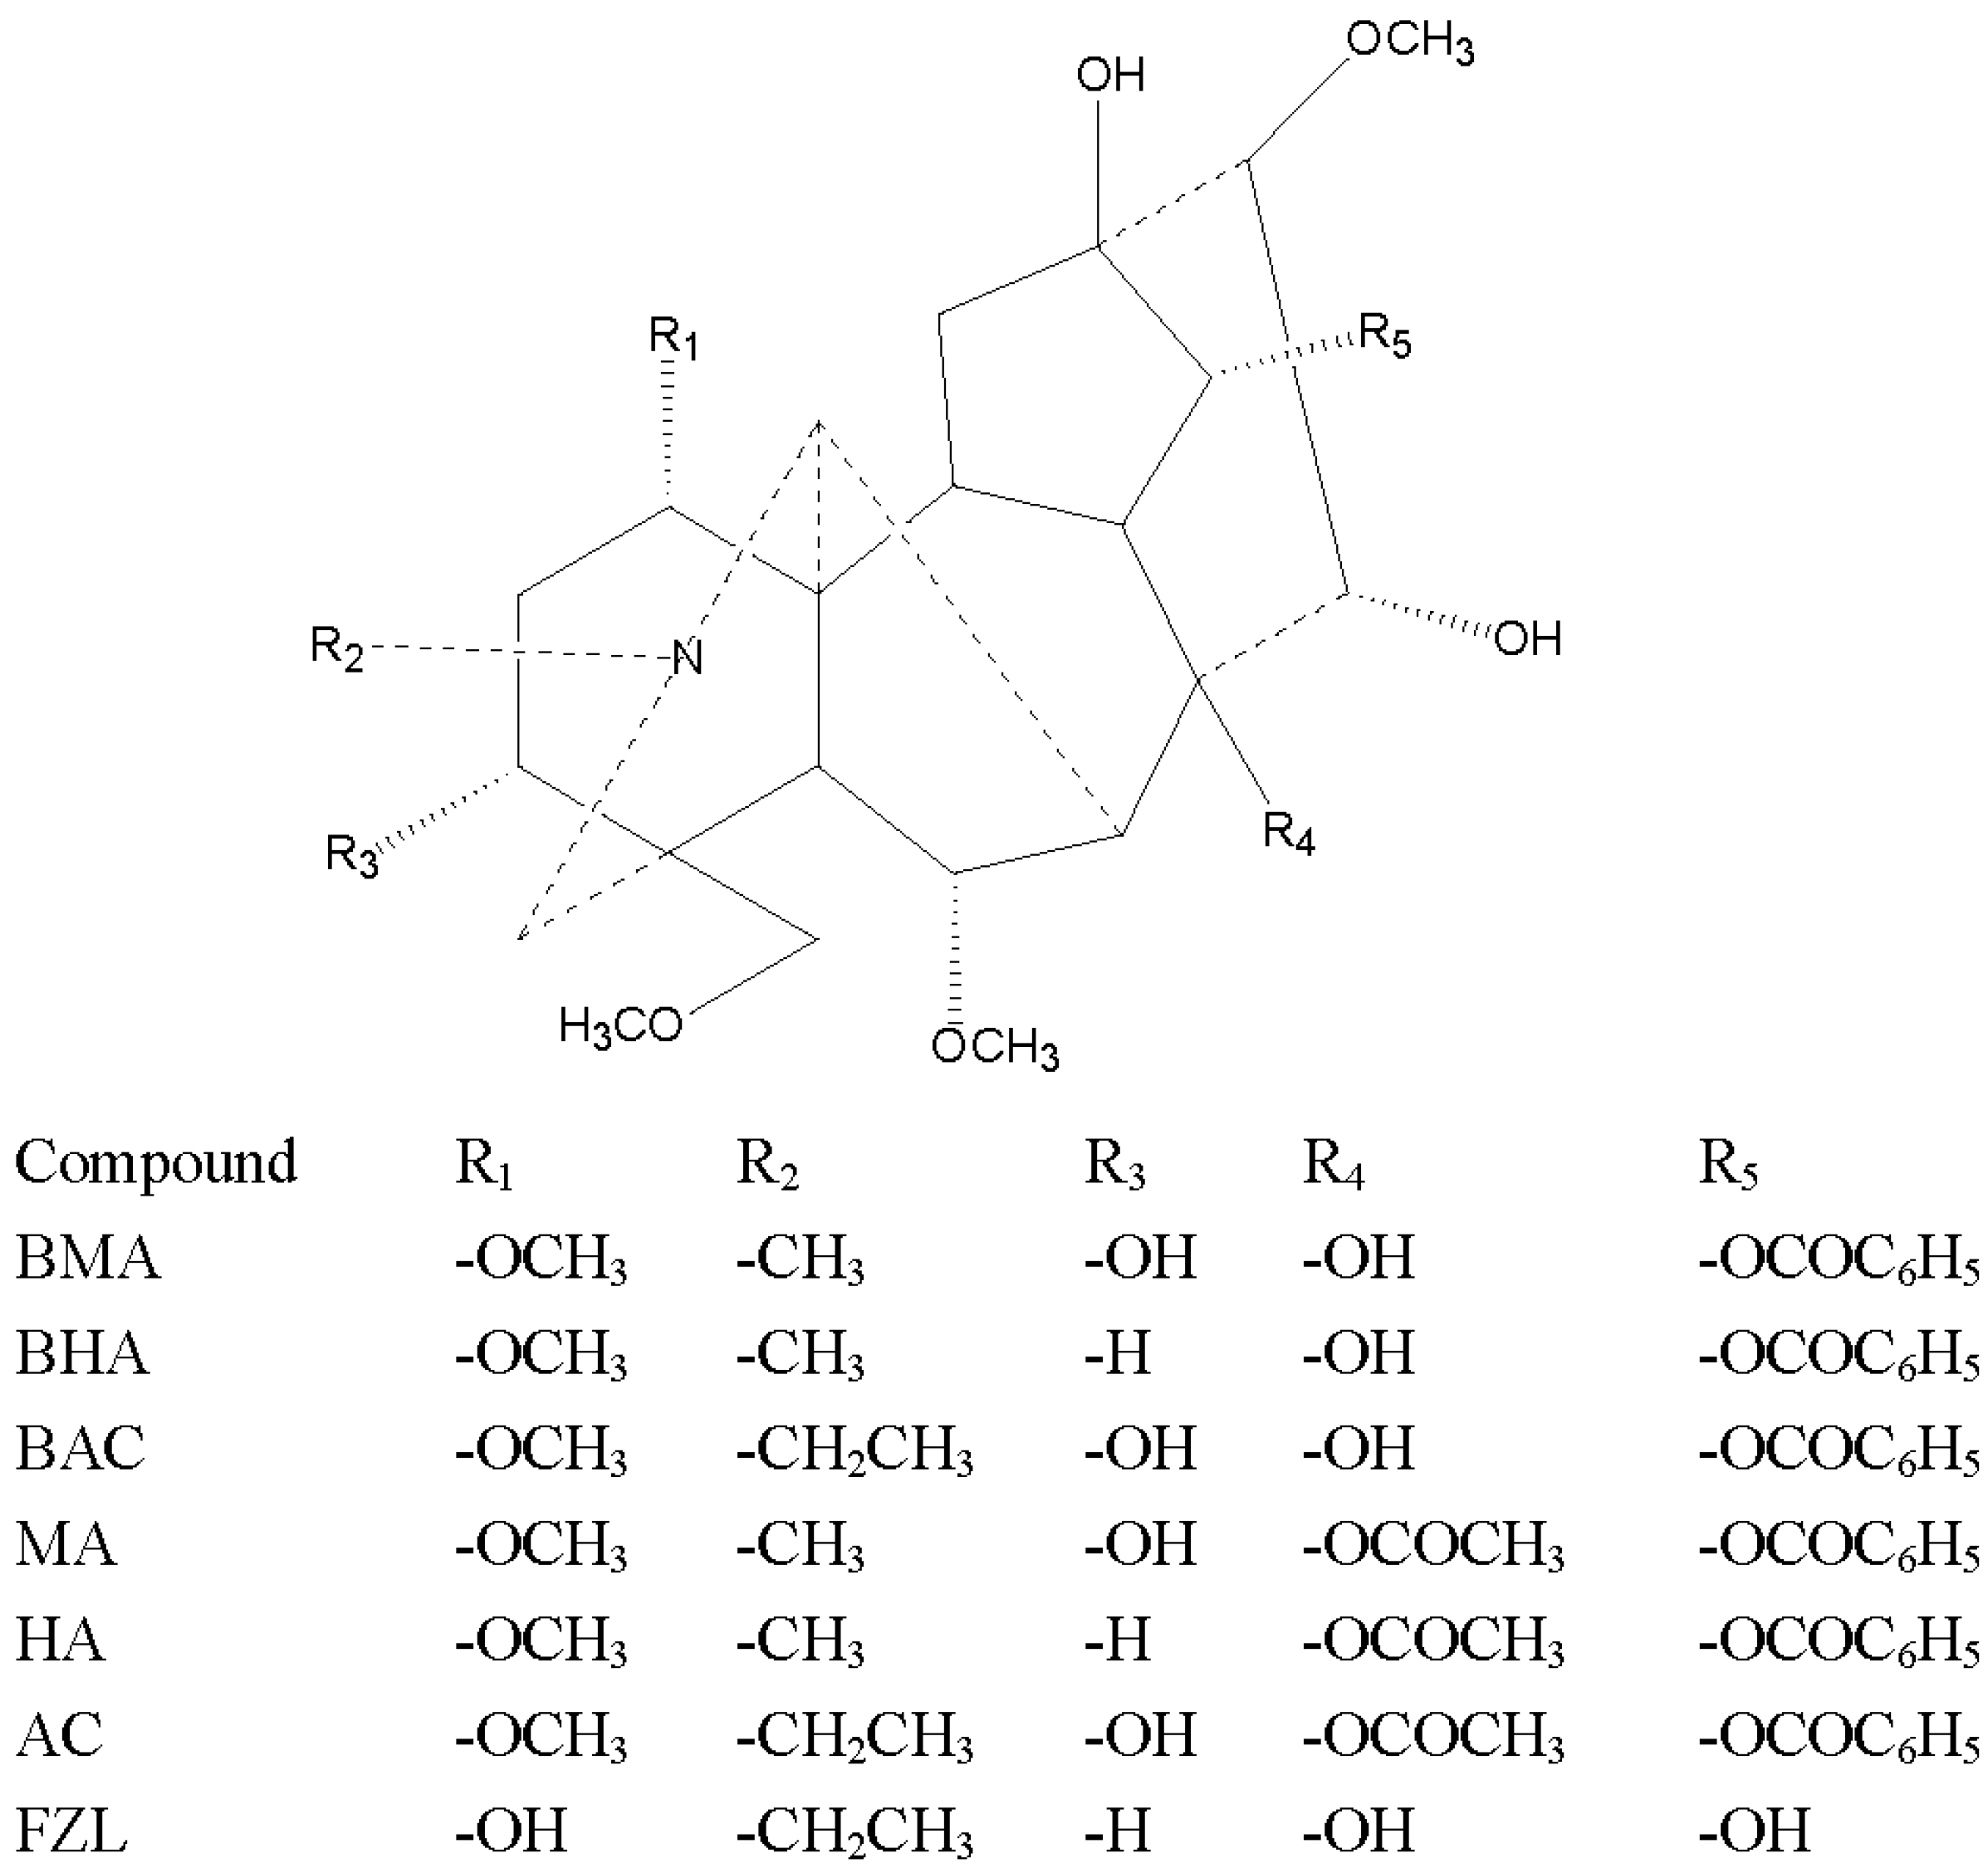
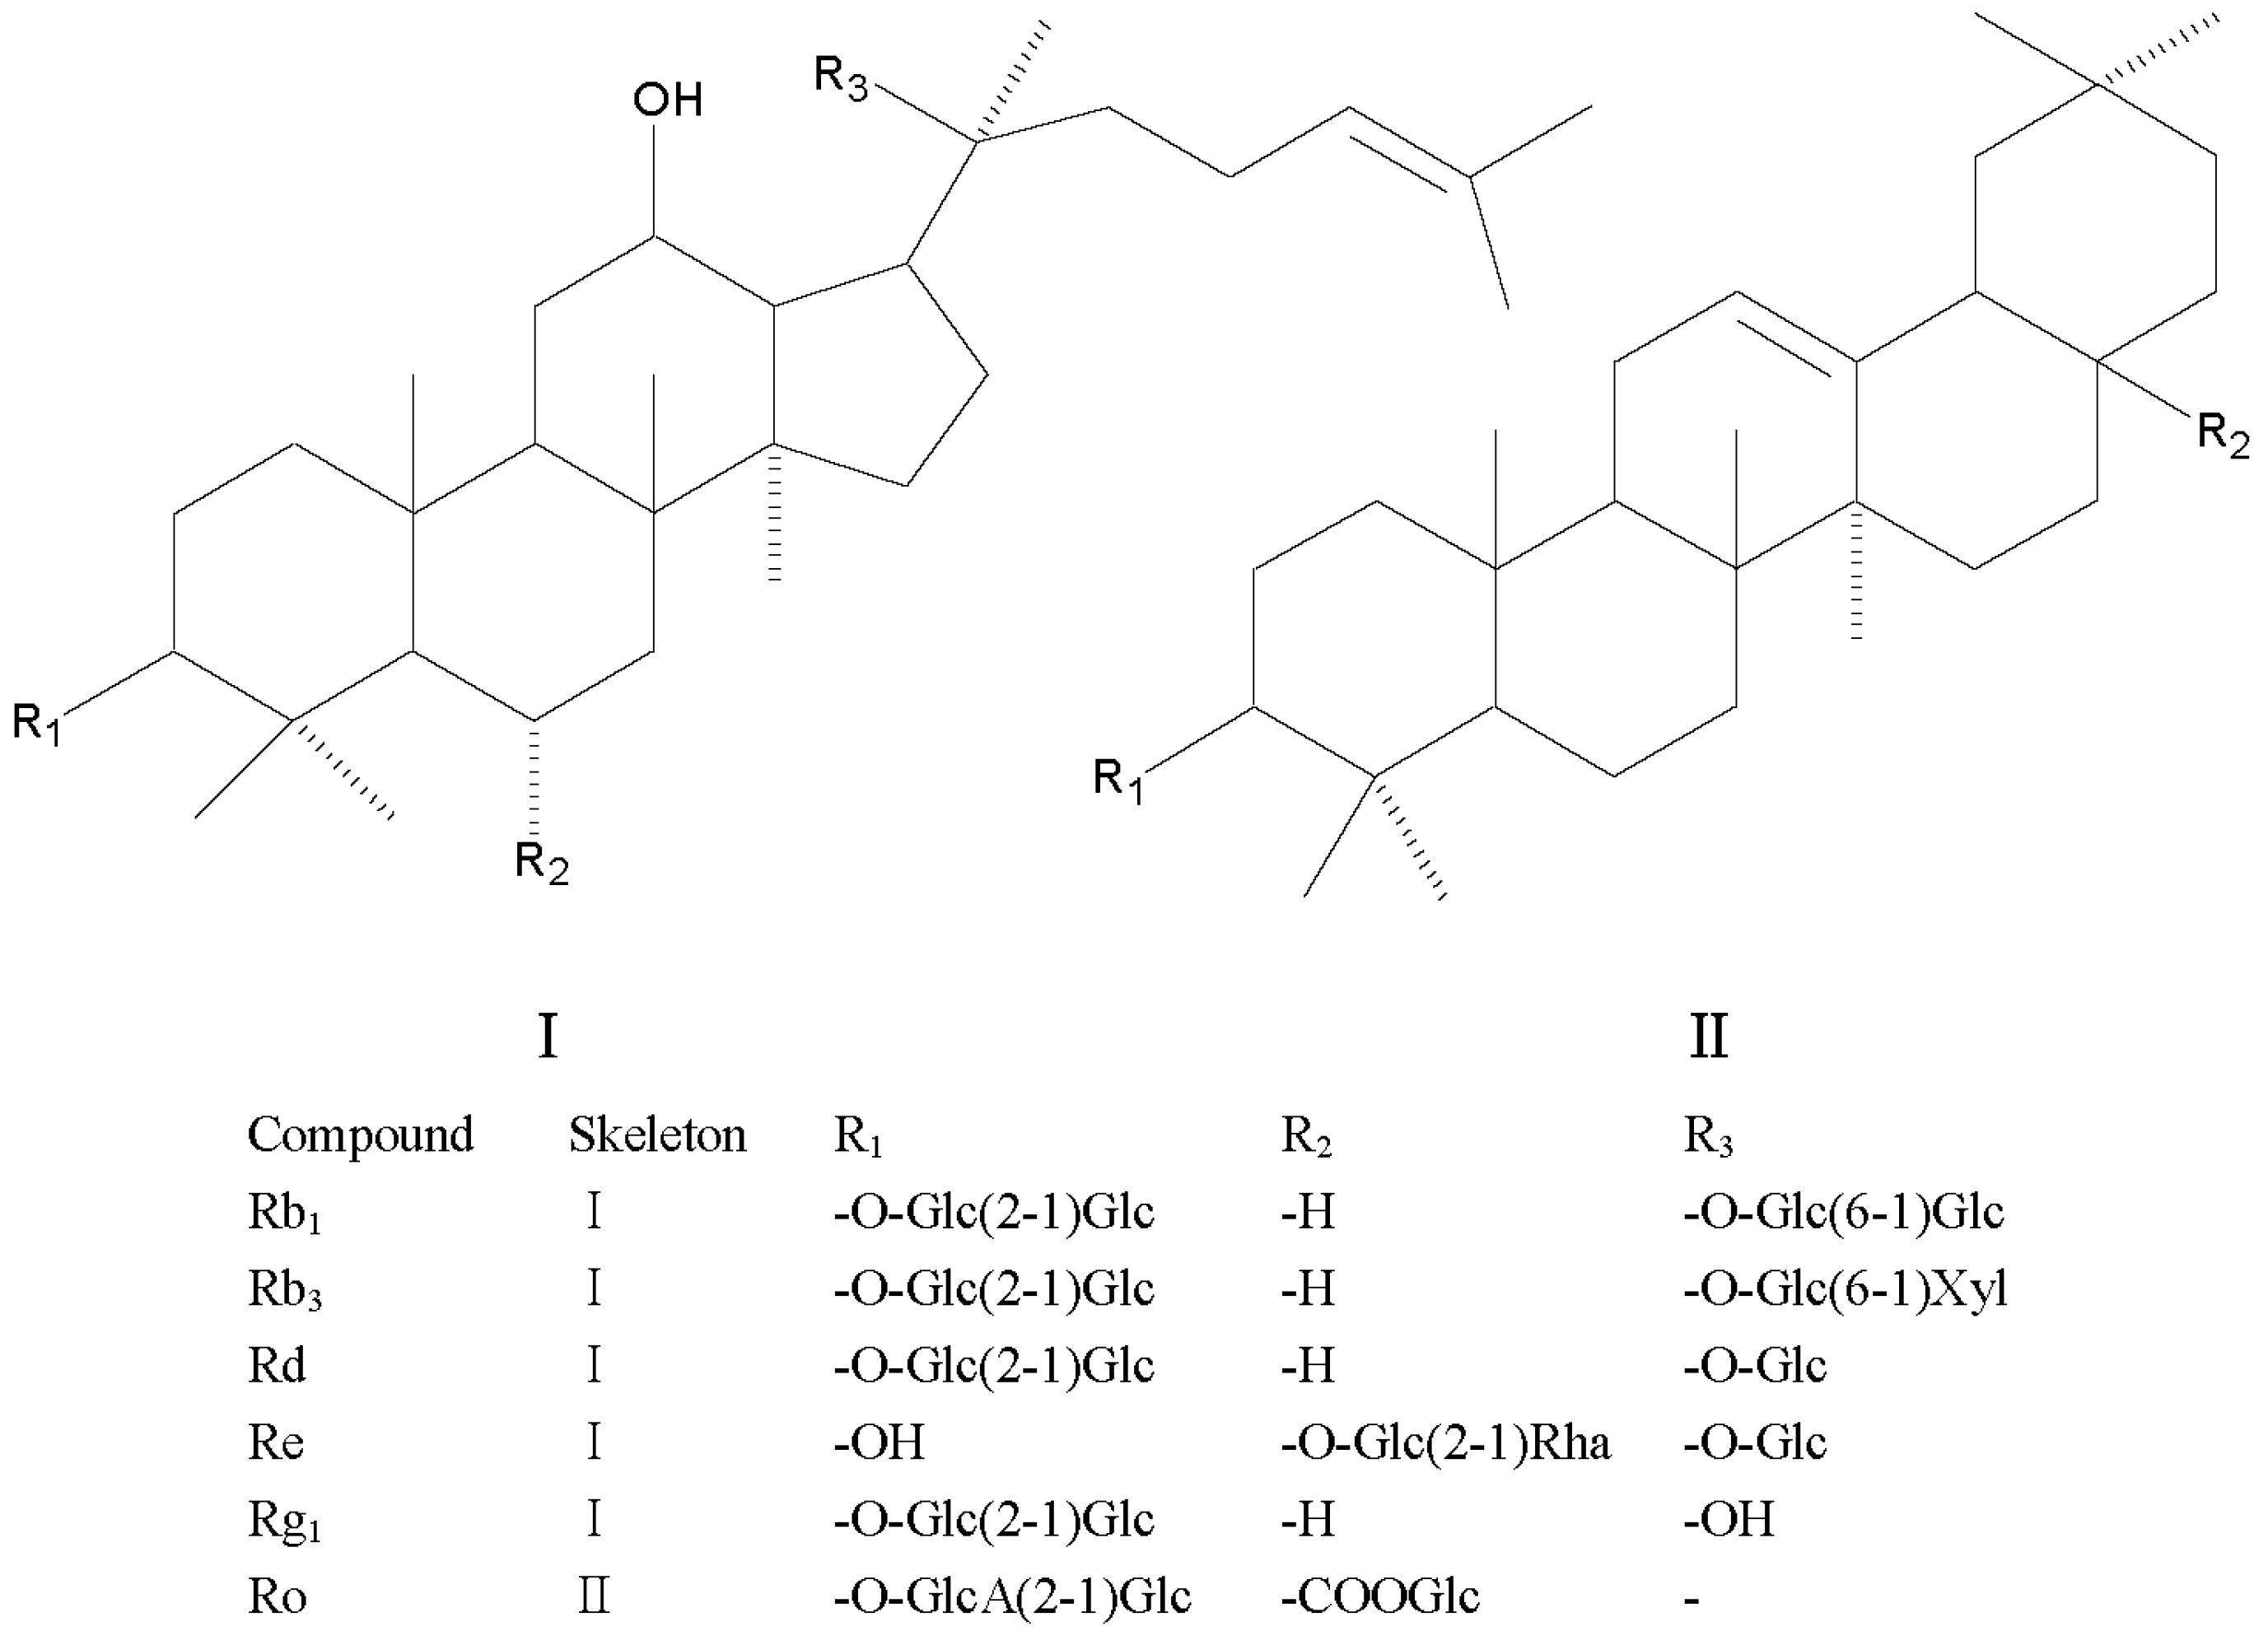
2.2. Identification of Chemical Constituents of SFPD by UPLC-QTOF-MS

In order to obtain more comprehensive information, total ion chromatograms (TIC) of five SFPDs were collected in both positive and negative mode. There are obvious quantitative differences of chemical composition in different proportions of SFPD from the TICs (Figure S1). The representative TICs of P3 (S:F = 1:1) in positive and negative ion modes were acquired for identification the chemical constituents of SFPD as shown in Figure 2.
An in-house constituent library including the major known constituents of Hongshen and Fuzi was imported into the Peak View Software TM V.1.2 to accomplish constituent identification from the representative TICs. The preliminary identification results were further verified by accurate masses and fragment ions reported in the literature. Ultimately, a total of 39 constituents were identified or tentatively characterized, of which 17 were from Hongshen and 22 compounds were from Fuzi. The detailed results are shown in Table 1. Moreover, 21 compounds were unambiguously identified and confirmed by comparing the retention time, mass spectrum (MS) information, and MS/MS fragmental ions with their reference standards. The other compounds were tentatively defined by comparing their exact masses, MS/MS fragmental ions, and retention behaviors with previous studies.

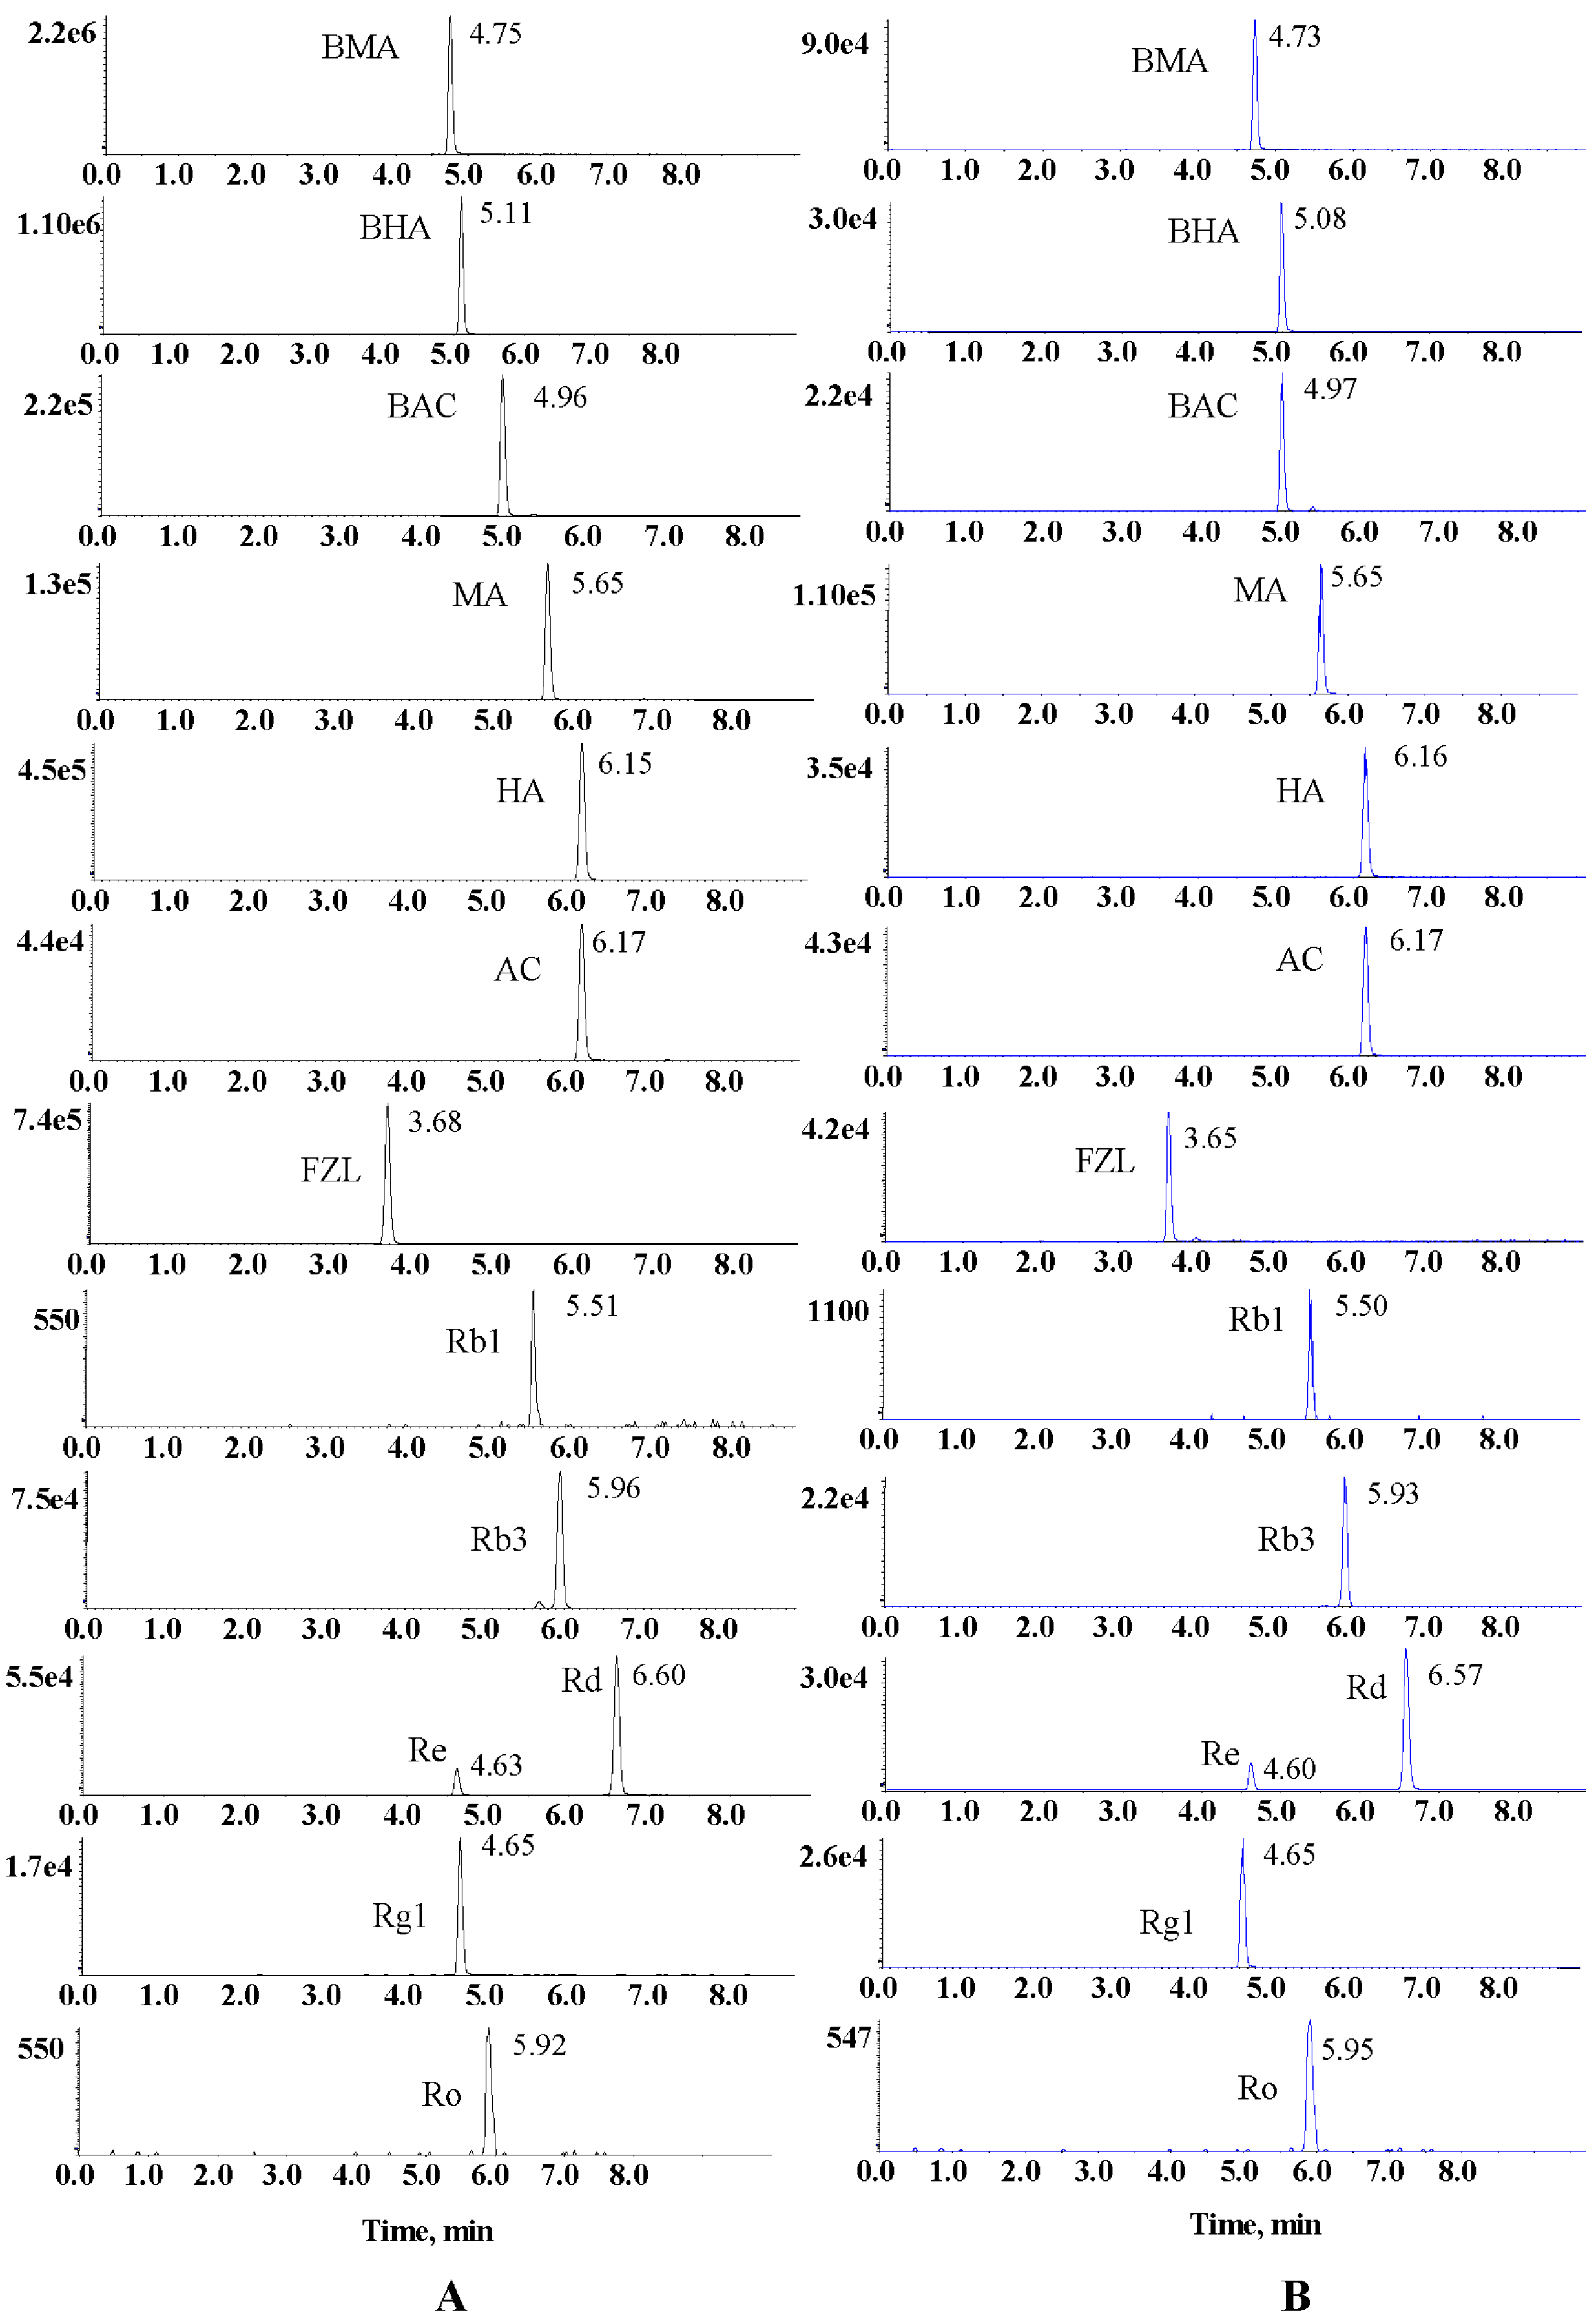
2.3. Quantitative Determination of the Major Constituents in SFPD by UFLC-QQQ-MS/MS

Alkaloids and ginsenosides are the main active components in SFPD. In order to achieve rapid quality control, seven alkaloids and six ginsenosides were analyzed simultaneously in this study. The responses of all the analytes were evaluated both in positive and negative ion mode beforehand. Finally, all the analytes were detected with stable and strong MS signal in positive mode. Multiple reaction monitoring (MRM) was employed to increase specificity and sensitivity of quantification analysis. The MRM pairs comprising of precursor and product ions for each analyte were investigated by infusing the single standard solution into the mass spectrometer directly in advance. The selected MRM pairs and optimum collision energy are presented in Table 2. For better ionization, 0.1% formic acid was added to mobile phase. The 13 analytes were detected simultaneously within 7 min. The MRM chromatograms of 13 analystes are shown in Figure 3. The retention time for BMA, BHA, BAC, MA, HA, AC, FZL, Rb1, Rb3, Rd, Re, Rg1, and Ro were 4.75, 5.11, 4.96, 5.65, 6.15, 6.17, 3.68, 5.51, 11.37, 5.96, 6.60, 4.63, 4.65, and 5.92 min, respectively.

2.4. Linearity and Sensitivity

The calibration curves of seven alkaloids and six ginsenosides were fitted with coefficients of determination greater than 0.99. The linear ranges were set as 0.01–50 ng/mL for BHA, BAC, HA, and AC, 0.05 to 50 ng/mL for BMA, 0.01 to 25 ng/mL for MA, and FZL, 2.5 to 312.5 ng/mL for Rb1, Rb3, and Rg1, 25 to 6250 ng/mL for Rd, 2.5 to 156.2 ng/mL for Re, and 5.0 to 312.5 ng/mL for Ro, respectively, according to the approximate concentrations of the sample. The limit of detections (LODs) of seven alkaloids and six ginsenosides were 0.003 ng/mL and 1.0 ng/mL, respectively. The limit of quantifications (LOQs) of seven alkaloids and six ginsenosides were 0.01 ng/mL and 2.5 ng/mL, respectively. The concrete values are listed in Table 3. The excellent linearity with wide ranges and low LOQs demonstrates that this method can be employed for determining many kinds of samples effectively, even serum samples.

2.5. Precision, Stability, Repeatability, and Recovery

The intraday and interday precisions were validated by mixing standard solutions with three concentration levels. The RSDs of intra- and interday precisions were less than 6.87% and 10.93%, respectively. The stability and reproducibility were evaluated by sample solutions and the RSDs were less than 7.35% and 10.13%, respectively. The detailed data are listed in Table 4. The accuracy of the developed method was verified by a recovery test. The recoveries of 13 reference substances varied from 95.14% to 106.43% (RSDs ≤ 7.00%), as shown in Table 5. These results indicate the established method is accurate, stable, and reproducible.

2.6. Results of Sample Analysis

The validated method was subsequently applied to investigate the contents of the 13 constituents in five SFPD samples (P1(only Hongshen), P2 (S:F = 3:1, w/w), P3 (S:F = 1:1, w/w), P4 (S:F = 1:3, w/w), and P5 (only Fuzi)) based on their respective calibration curves summarized in Table 3. Thus, P1 only included ginsenosides, while P5 consisted solely of alkaloids. Theoretically, the contents of ginsenosides and alkaloids in P2, P3, and P4 were in a certain proportion to P1 and P5. However, it is not the case. Therefore, a concept of solubilization ratio was introduced to present the effect. The solubilization ratio of 13 analytes in P2, P3, and P4 were calculated via comparing the contents in P1 or P5. The calculated formula was as follows: Solubilization ratio (%) = (detected amount − theoretical amount)/ theoretical amount × 100. Theoretical amounts for alkaloids in P2, P3, and P4 were calculated according to detected amounts in P5 (F) and theoretical amounts for ginsenosides in P2, P3, and P4 were calculated according to the detected amount in P1 (S). The detailed data and results are listed in Table 6. For most constituents, the contents did not increase or decrease proportionately in different ratio prescriptions, but generated solubilization effect or dissolution-inhibited effect, which was believed to be one of the main mechanisms of the synergistic effect of Hongshen and Fuzi. The mechanism of interaction effect of component dissolution has been regarded as an important basis for the prescriptions of TCM [28,29].

3. Materials and Methods

3.1. Materials and Reagents

The reference substances of seven aconitum alkaloids and six ginsenosides, namely BMA, BHA, BAC, MA, HA, AC, FZL, Rb1, Rb3, Rd, Re, Rg1, and Ro were purchased from Nanchang beta biotechnology Co., Ltd (Nanchang, China). Their chemical structures are shown in Figure 4 and Figure 5. respectively. The purities of these standard compounds were confirmed to be higher than 98% by HPLC analysis. Hongshen were purchased from Kangmei pharmaceutical Co.,Ltd (Guangzhou, China, 170904731) and Fuzi(Heishunpian) were purchased from Sichuan jiangyou zhongba Fuzi technology development Co., Ltd (Chengdu, China, 170502) and authenticated by professor Xiao-mei Fu (Jiangxi University of Traditional Chinese Medicine). Acetonitrile and methanol for analysis were MS grade and purchased from Merck (Darmstadt, Germany). Formic acid was HPLC grade and purchased from Dikma (Dikma, USA). Ultrapure water was obtained by a Milli-Q ultrapure water system (Millipore, Burlington, MA, USA).

3.2. Analytical System and Method for Qualitative Analysis

The qualitative analysis was performed on a Shimadzu UHPLC instrument coupled with a Triple-TOF 5600+ MS/MS system (AB SCIEX, Redwood, CA, USA) equipped with a DuoSpray™ Ion Source (shanghai, china). The separation was carried out on a Thermo Scientific (Waltham, MA, USA) Hypersil GOLD C18 column (100 mm × 2.1 mm, 1.9 μm) with 35 °C. Mobile phase was composed of 0.1% formic acid in water (A) and acetonitrile (B) with a gradient program as follows: 5% (B) in 0 to 2 min, 5% to 100% (B) in 2 to 30 min, 100% (B) in 30 to 32 min, 100% to 5% (B) in 32 to 35 min. The gradient elution was delivered at a flow rate of 0.2 mL/min. The injected volume was 2 µL.
The mass spectra were acquired in positive and negative electron spray ionization (ESI) mode to provide comprehensive information for compound identification. Optimized parameters for positive and negative mode were as follows: The ion spray voltage, 5500 V (positive mode) and −4500 V (negative mode); declustering potential, 100 V (positive mode) and−100 V (negative mode); the turbo spray temperature, 600 °C (positive) and 500 °C (negative); the collision energy, 45 V (positive) and −45 V (negative). The collision energy spread was 15 V for both positive and negative mode. Nebulizer gas was N2 with Gas 1 (45 psi for positive and 40 psi for negative) and Gas 2 (heater gas, 45 psi for positive and 40 psi for negative). The curtain gas was kept at 30 psi. The mass range was scanned from 100 to 1500 m/z for parent ions and from 50 to 1500 m/z for daughter ions.
Data acquisition and procession were carried out on Analyst 1.6 software and Peakview 2.2 software (AB SCIEX, Framingham, MA, USA).

3.3. Analytical System and Method for Quantitative Analysis

Quantitative analysis was performed on Shimadzu RRLC instrument coupled with a QTRAP 4500 system (AB SCIEX, Redwood, CA, USA); which was equipped with a binary high-pressure solvent delivery system (LC-30AD pump, Shimadzu Corporation, Kyoto, Japan). The separation was carried out on a Thermo Scientific Hypersil GOLD C18 column (100 mm × 2.1 mm, 1.9 μm) with 40 °C. Mobile phase was composed of 0.1% formic acid in water (A) and acetonitrile (B) with a fast gradient program as follows: 5% to 40% (B) in 0 to 3 min, 40% (B) in 3 to 5 min, 40% to 80% (B) in 5 to 5.5 min, 80% (B) in 5.5 to 7 min, 80% to 5% (B) in 7 to 7.1 min, 5% (B) in 7.1 to 9 min. The flow rate was set at 0.3 mL/min and the injection volume was 10 uL.
All analytes were confirmed and quantified by tandem mass spectrometry operating in electrospray positive ionization mode (ESI+) with MRM mode. The MS parameters were optimized and set as follows: Ion spray voltage at 5500 V, the turbo spray temperature at 500 °C, curtain gas (CUR) at 35 psi, nebulizer gas (GS1) at 50 psi, heater gas (GS2) at 50 psi, collision gas at 6 psi, and dwell time at 20 ms. The optimized declustering potential (DP) and proper collision energy (CE) are listed in Table 2.
Data acquisition and procession were performed on Analyst 1.6 software (AB SCIEX, Redwood, CA, USA).

3.4. Preparation of Standard Solutions and Quality Control Solutions

The stock solutions of BMA, BHA, BAC, MA, HA, AC, FZL, Rb1, Rb3, Rd, Re, Rg1, and Ro were prepared in methanol at an accurate concentration of 1 mg/mL, respectively. A mixed stock solution was prepared by mixing appropriate aliquots of each stock solution together. Following this, a series of working solutions to the desired concentrations were achieved by doubling dilution with 50% methanol. Among of them, the high, medium, and low concentration solutions were selected as the quality control (QC) solutions for monitoring the status of system. All standard solutions were stored at 4 °C and were taken to room temperature before analysis.

3.5. Preparation of Sample Solutions

Qualified Hongshen (S) and Fuzi (F) were mixed well for the preparation of five ShenFu prescriptions according to proper ratios. They were P1 (only Hongshen), P2 (S:F = 3:1, w/w), P3 (S:F = 1:1, w/w), P4 (S:F = 1:3, w/w), and P5 (only Fuzi), respectively. Decoctions were prepared by traditional decoction method. All the medicinal materials were soaked for 30 min beforehand. Fuzi were boiled for 1 hour firstly and then continually boiled or simmered together with Hongshen for three times [30]. The first time, 8 times the amount of water was added and decocted for 1 h. The second time, 6 times the amount of water was added and decocted for 45 min. The final time, water was added 2 to 3 cm above the residues and decocted for 30 min again. The decoctions were mixed together and concentrated to 1g/mL by rotary evaporation three times. All the samples were kept at 4 °C, diluted to a proper concentration and filtered through a 0.22 μm nylon membrane filter before analysis.

3.6. Validation of Method for Quantitative Analysis

The developed quantitative method was validated for linearity, LOD, LOQ, precision, repeatability, stability, and accuracy. A mixed working solution was diluted to seven appropriate concentrations and the linear curves for all analytes were constructed by plotting peak area (y) against concentration (x, ng/mL). The LODs and LOQs were obtained by diluting the mixed working solution to a very low concentration with signal-to-noise (S/N) ratios of 3 and 10, respectively.
Quality control (QC) (high, medium, and low concentrations) were analyzed six times in one day for intraday variations and examined in triplicate over three consecutive days for interday precision. To investigate the repeatability, six replicates of the same sample were prepared in parallel and analyzed. For stability testing, a sample solution was placed in an automatic sampler at 25 °C and analyzed at 0, 2, 4, 8, 12, and 24 h. All of the results were evaluated by relative standard deviations (RSDs) of the peak areas.
The recovery test for evaluating the accuracy of method was examined by adding three levels (80%, 100%, and 120% of the known amount) of the standard solutions to samples in triplicate. Recovery were calculated by the following formula: Recovery (%) = (detected amount − original amount)/spiked amount × 100.

3.7. Sample Analysis

The chemical components of SFPD were investigated as a preliminary quality study by the qualitative analysis method. The contents of 13 analytes in five Shenfu prescriptions were determined as a further quality study by developed quantitative method. Moreover, the concept of solubilization ratio was employed to assess the compatibility effect of Hongshen and Fuzi.

3.8. Establishment of an in-House Components Library of SFPD

Detailed and clear chemical constituents of SFPD are essential for holistic quality control. To ensure rapid and accurate identification of constituents in SFPD, an in-house constituent library that included the major known constituents of Hongshen and Fuzi was constructed by searching the databases of TCM Database @ Taiwan (http://tcm.cmu.edu.tw), TCMSP (Traditional Chinese Medicine Systems Pharmacology) Database (http://lsp.nwu.edu.cn/tcmsp.php), PubChem Database (http://www.ncbi.nlm.nih.gov/pccompound), MassBank (http://www.massbank.jp) Database, and so on.

4. Conclusions

In this study, taking SFPD as an example, a comprehensive and rapid strategy for quality evaluation and control of traditional Chinese medicine decoction was developed by integrating UPLC-QTOF-MS and UFLC-QQQ-MS technologies for qualitative and quantitative analysis, respectively. Consequently, a total of 39 compounds were tentatively identified, of which 21 compounds were unambiguously confirmed by comparing with reference substances. We determined 13 important constituents in SFPD within 7 min by MRM in positive ion mode. The developed quantitative method was employed for investigating the contents of different proportions of SFPD. The results indicated that the contents of 13 constituents did not increase or decrease proportionately in different ratio prescriptions, but generated solubilization effect or dissolution-inhibited effect, which was believed to be one of the main mechanisms of the synergistic effect of Hongshen and Fuzi. The mechanism of interaction effect of constituent dissolution is an important basis for the prescriptions of TCM. Nevertheless, more research should be designed to illustrate this further in the future.

Supplementary Materials

The following are available online. Figure S1. Representative total ion chromatograms of the SFPD by UPLC-QTOF-MS. (A): TIC of P3 (S:F = 1:1) in positive ion mode; (B): TIC of P3 (S:F = 1:1) in negative ion mode; (C): TIC of P1 (S) in positive ion mode; (D): TIC of P1 (S) in negative ion mode; (E): TIC of P2 (S:F = 3:1) in positive ion mode; (F): TIC of P2 (S:F = 3:1) in negative ion mode; G: TIC of P4 (S:F = 1:3) in positive ion mode; H: TIC of P4 (S:F = 1:3) in negative ion mode; I: TIC of P5 (F) in positive ion mode; J: TIC of P5 (F) in negative ion mode.

Author Contributions

H.L. and G.X. conceived and designed the experiments; Y.C. and R.Y. performed the experiments; B.L. analyzed the data; L.J. and Q.Z. contributed reagents/materials/analysis tools; Y.C. wrote the paper.

Funding

This research was funded by National Natural Science Foundation of China (No. 81360663&81703823); Natural Science Foundation of Jiangxi Province (20181BAB215039); Science and technology research project Technology Research Project of Jiangxi Education Department (GJJ170751& & GJJ170753); Jiangxi science and technology program of TCM(2018A332); Jiangxi national traditional medicine modern technology National Traditional Medicine Modern Technology and Industry Development Cooperation Center Project (jxxt2017006).

Conflicts of Interest

The authors declare no conflict of interest.

References

  1. Chan, P.H.; Zhang, W.L.; Cheung, C.Y.; Tsim, K.W.; Lam, H. Quality Control of Danggui Buxue Tang, a Traditional Chinese Medicine Decoction, by (1)H-NMR Metabolic Profiling. Evid. Based Complement. Altern. Med. eCAM 2014, 2014, 567893. [Google Scholar] [CrossRef] [PubMed]
  2. Li, Z.; Wen, R.; Du, Y.; Zhao, S.; Zhao, P.; Jiang, H.; Rong, R.; Lv, Q. Simultaneous quantification of fifteen compounds in rat plasma by LC-MS/MS and its application to a pharmacokinetic study of Chaihu-Guizhi decoction. J. Chromatogr. B Anal. Technol. Biomed. Life Sci. 2018, 1105, 15–25. [Google Scholar] [CrossRef] [PubMed]
  3. Wu, Y.; Wang, D.; Yang, X.; Fu, C.; Zou, L.; Zhang, J. Traditional Chinese medicine Gegen Qinlian decoction ameliorates irinotecan chemotherapy-induced gut toxicity in mice. Biomed. Pharmacother. 2019, 109, 2252–2261. [Google Scholar] [CrossRef] [PubMed]
  4. Qiu, R.; Zhang, X.; Zhao, C.; Li, M.; Shang, H. Comparison of the efficacy of dispensing granules with traditional decoction: A systematic review and meta-analysis. Ann. Transl. Med. 2018, 6, 38. [Google Scholar] [CrossRef] [PubMed]
  5. Xin, M.; He, J. Chinese herbal decoction of Wenshen Yangxue formula improved fertility and pregnancy rate in mice through PI3K/Akt signaling. J. Cell. Biochem. 2018, 120, 3082–3090. [Google Scholar] [CrossRef] [PubMed]
  6. Xie, R.F.; Shi, Z.N.; Li, Z.C.; Chen, P.P.; Li, Y.M.; Zhou, X. Optimization of high pressure machine decocting process for Dachengqi Tang using HPLC fingerprints combined with the Box-Behnken experimental design. J. Pharm. Anal. 2015, 5, 110–119. [Google Scholar] [CrossRef] [PubMed]
  7. Yan, X.; Wu, H.; Ren, J.; Liu, Y.; Wang, S.; Yang, J.; Qin, S.; Wu, D. Shenfu Formula reduces cardiomyocyte apoptosis in heart failure rats by regulating microRNAs. J. Ethnopharmacol. 2018, 227, 105–112. [Google Scholar] [CrossRef]
  8. Mao, Z.-J.; Zhang, Q.-L.; Shang, J.; Gao, T.; Yuan, W.-J.; Qin, L.-P. Shenfu Injection attenuates rat myocardial hypertrophy by up-regulating miR-19a-3p expression. Sci. Rep. 2018, 8. [Google Scholar] [CrossRef]
  9. Tan, G.; Zhou, Q.; Liu, K.; Dong, X.; Li, L.; Liao, W.; Wu, H. Cross-platform metabolic profiling deciphering the potential targets of Shenfu injection against acute viral myocarditis in mice. J. Pharm. Biomed. Anal. 2018, 160, 1–11. [Google Scholar] [CrossRef]
  10. Wang, Y.-Y.; Li, Y.-Y.; Li, L.; Yang, D.-L.; Zhou, K.; Li, Y.-H. Protective Effects of Shenfu Injection against Myocardial Ischemia-Reperfusion Injury via Activation of eNOS in Rats. Biol. Pharm. Bull. 2018, 41, 1406–1413. [Google Scholar] [CrossRef]
  11. Ye, J.; Zhu, Z.; Liang, Q.; Yan, X.; Xi, X.; Zhang, Z. Efficacy and safety of Shenfu injection for patients with return of spontaneous circulation after sudden cardiac arrest Protocol for a systematic review and meta-analysis. Medicine 2018, 97. [Google Scholar] [CrossRef]
  12. He, J.L.; Zhao, J.W.; Ma, Z.C.; Wang, Y.G.; Liang, Q.D.; Tan, H.L.; Xiao, C.R.; Tang, X.L.; Gao, Y. Serum Pharmacochemistry Analysis Using UPLC-Q-TOF/MS after Oral Administration to Rats of Shenfu Decoction. Evid. Based Complement. Altern. Med. eCAM 2015, 2015, 973930. [Google Scholar] [CrossRef] [PubMed]
  13. Li, P.; Lv, B.; Jiang, X.; Wang, T.; Ma, X.; Chang, N.; Wang, X.; Gao, X. Identification of NF-kappaB inhibitors following Shenfu injection and bioactivity-integrated UPLC/Q-TOF-MS and screening for related anti-inflammatory targets in vitro and in silico. J. Ethnopharmacol. 2016, 194, 658–667. [Google Scholar] [CrossRef] [PubMed]
  14. Song, Y.; Zhang, N.; Shi, S.; Li, J.; Zhang, Q.; Zhao, Y.; Jiang, Y.; Tu, P. Large-scale qualitative and quantitative characterization of components in Shenfu injection by integrating hydrophilic interaction chromatography, reversed phase liquid chromatography, and tandem mass spectrometry. J. Chromatogr. A 2015, 1407, 106–118. [Google Scholar] [CrossRef] [PubMed]
  15. Ge, A.-H.; Li, J.; Donnapee, S.; Bai, Y.; Liu, J.; He, J.; Liu, E.-W.; Kang, L.-Y.; Gao, X.-M.; Chang, Y.-X. Simultaneous determination of 2 aconitum alkaloids and 12 ginsenosides in Shenfu injection by ultraperformance liquid chromatography coupled with a photodiode array detector with few markers to determine multicomponents. J. Food Drug Anal. 2015, 23, 267–278. [Google Scholar] [CrossRef] [PubMed] [Green Version]
  16. Gao, W.; Qi, L.-W.; Liu, C.C.; Wang, R.; Li, P.; Yang, H. An improved method for the determination of 5-hydroxymethylfurfural in Shenfu injection by direct analysis in real time-quadrupole time-of-flight mass spectrometry. Drug Test. Anal. 2016, 8, 738–743. [Google Scholar] [CrossRef] [PubMed]
  17. Li, Z.; Zhang, R.; Wang, X.; Hu, X.; Chen, Y.; Liu, Q. Simultaneous determination of seven ginsenosides in rat plasma by high-performance liquid chromatography coupled to time-of-flight mass spectrometry: Application to pharmacokinetics of Shenfu injection. Biomed. Chromatogr. 2015, 29, 167–175. [Google Scholar] [CrossRef] [PubMed]
  18. Guo, N.; Liu, M.; Yang, D.; Huang, Y.; Niu, X.; Wu, R.; Liu, Y.; Ma, G.; Dou, D. Quantitative LC-MS/MS analysis of seven ginsenosides and three aconitum alkaloids in Shen-Fu decoction. Chem. Cent. J. 2013, 7, 165. [Google Scholar] [CrossRef] [PubMed] [Green Version]
  19. Liu, A.; Shen, Z.; Yuan, L.; Xu, M.; Zhao, Z. High-performance thin-layer chromatography coupled with HPLC-DAD/HPLC-MS/MS for simultaneous determination of bisphenol A and nine brominated analogs in biological samples. Anal. Bioanal. Chem. 2018, 411, 725–734. [Google Scholar] [CrossRef] [PubMed]
  20. Zheng, X.; Chen, S.; Zheng, M.; Peng, J.; He, X.; Han, Y.; Zhu, J.; Xiao, Q.; Lv, R.; Lin, R. Development of the HPLC-ELSD method for the determination of phytochelatins and glutathione in Perilla frutescens under cadmium stress conditions. R. Soc. Open Sci. 2018, 5, 171659. [Google Scholar] [CrossRef] [PubMed]
  21. Du, Y.; Zheng, Z.G.; Yu, Y.; Wu, Z.T.; Liang, D.; Li, P.; Jiang, Y.; Li, H.J. Rapid discovery of cyclopamine analogs from Fritillaria and Veratrum plants using LC-Q-TOF-MS and LC-QqQ-MS. J. Pharm. Biomed. Anal. 2017, 142, 201–209. [Google Scholar] [CrossRef]
  22. Yin, W.; Wang, P.; Yang, H.; Sui, F. UPLC-Q-TOF-MS and UPLC-MS/MS methods for Metabolism profiles and Pharmacokinetics of major compounds in Xuanmai Ganjie Granules. Biomed. Chromatogr. BMC 2018, e4449. [Google Scholar] [CrossRef]
  23. Zhou, G.; Tang, L.; Zhou, X.; Wang, T.; Kou, Z.; Wang, Z. A review on phytochemistry and pharmacological activities of the processed lateral root of Aconitum carmichaelii Debeaux. J. Ethnopharmacol. 2015, 160, 173–193. [Google Scholar] [CrossRef] [PubMed]
  24. So, S.H.; Lee, J.W.; Kim, Y.S.; Hyun, S.H.; Han, C.K. Red ginseng monograph. J. Ginseng Res. 2018, 42, 549–561. [Google Scholar] [CrossRef] [PubMed]
  25. Gao, W.; Liu, X.G.; Liu, L.; Li, P. Targeted profiling and relative quantification of benzoyl diterpene alkaloids in Aconitum roots by using LC-MS/MS with precursor ion scan. J. Sep. Sci. 2018, 41, 3515–3526. [Google Scholar] [CrossRef] [PubMed]
  26. Sun, H.; Ni, B.; Zhang, A.; Wang, M.; Dong, H.; Wang, X. Metabolomics study on Fuzi and its processed products using ultra-performance liquid-chromatography/electrospray-ionization synapt high-definition mass spectrometry coupled with pattern recognition analysis. Analyst 2012, 137, 170–185. [Google Scholar] [CrossRef] [PubMed]
  27. Yu, H.-S.; Zhang, L.-J.; Song, X.-B.; Liu, Y.-X.; Zhang, J.; Cao, M.; Kang, L.-P.; Kang, T.-G.; Ma, B.-P. Chemical constituents from processed rhizomes of Panax notoginseng. China J. Chin. Mater. Med. 2013, 38, 3910–3917. [Google Scholar]
  28. Sun, D.; Yan, Q.; Xu, X.; Shen, W.; Xu, C.; Tan, J.; Zhang, H.; Li, L.; Cheng, H. LC-MS/MS analysis and evaluation of the anti-inflammatory activity of components from BushenHuoxue decoction. Pharm. Biol. 2017, 55, 937–945. [Google Scholar] [CrossRef] [PubMed] [Green Version]
  29. Ding, H.; Yin, Q.; Wan, G.; Dai, X.; Shi, X.; Qiao, Y. Solubilization of menthol by platycodin D in aqueous solution: An integrated study of classical experiments and dissipative particle dynamics simulation. Int. J. Pharm. 2015, 480, 143–151. [Google Scholar] [CrossRef] [PubMed]
  30. Guo, N.; Yang, D.; Wang, X.; Dai, J.; Wang, M.; Lei, Y. Metabonomic study of chronic heart failure and effects of Chinese herbal decoction in rats. J. Chromatogr. A 2014, 1362, 89–101. [Google Scholar] [CrossRef]
Sample Availability: Samples of the compounds during the current study are available from the authors on reasonable request.
Figure 1. The flow chart illustrates the overall strategy for research.
Molecules 24 00374 g001
Figure 2. Representative total ion chromatograms of the ShenFu Prescription Decoction (SFPD) by UPLC-QTOF-MS. (A) Total ion chromatograms (TIC) of P3 in positive ion mode; (B) TIC of P3 in negative ion mode.
Molecules 24 00374 g002
Figure 3. The multiple reaction monitoring (MRM) chromatograms of 13 analytes by UFLC-QQQ-MS/MS. (A) 13 analytes in sample solution; (B) 13 analytes in reference solution.
Molecules 24 00374 g003
Figure 4. Chemical structures of alkaloids.
Molecules 24 00374 g004
Figure 5. Chemical structures of ginsenosides.
Molecules 24 00374 g005
Table 1. Identification of major compounds in SFPD by UPLC-QTOF-MS.
NoTR (min)FormulaPredicted (m/z)Measured (m/z)ModeError (ppm)MS/MS(m/z)Identification
11.32C10H13NO2180.1019180.1016[M + H]+−1.6180.1016, 115.0547, 145.0653F/Salsolinol [23]
25.01C24H39NO9486.2698486.2690[M + H]+−1.5486.2690, 436.2320, 404.2064F/Mesaconine [25]
35.38C22H35NO4378.2639378.2639[M + H]+0.1378.2639, 360.2524, 320.226F/Aconosine [23]
45.41C22H35NO4378.2639378.2639[M + H]+0.1378.2639, 360.2524, 320.226F/Karakoline [26]
55.46C23H37NO5408.2744408.2744[M + H]+0408.2744, 390.2635, 358.2383F/Isotalatizidine [26]
65.72C22H31NO3358.2377358.2379[M + H]+0.6358.2380, 340.2271, 143.0866F/Songorine [25]
75.81C25H41NO9500.2854500.2852[M + H]+−0.4500.2852, 450.2483, 468.2582F/Aconine a [25]
86.48C24H39NO7454.2799454.2796[M + H]+−0.8454.2796, 436.2667, 404.2414F/Fuziline a [25]
96.78C24H39NO6438.2850438.285[M + H]+0438.2850, 420.2737, 388.2480F/Neoline [25]
107.43C24H39NO5422.2901422.2902[M + H]+0.3422.2902, 390.2633, 358.2365F/Talatisamine [25]
118.11C25H41NO6452.3007452.3007[M + H]+0452.3007, 420.2743, 388.2477F/Chasmanine [26]
129.44C31H41NO11604.2752604.2746[M + H]+−1604.2747, 605.2779, 554.2438F/Flavaconitine [23]
139.95C31H43NO10590.2959590.2954[M + H]+−0.9590.2954, 540.2555, 558.2661F/Benzoylmesaconine a [25]
1410.08C48H82O18945.5428945.5428[M − H]0945.5452, 637.4329, 475.3798, 161.0468S/Ginsenoside Re a
1510.11C42H72O14799.4849799.4813[M − H]−4.5799.4813, 637.4277, 475.3768S/Ginsenoside Rg1 a
1610.18C36H60O8621.4361621.4344[M + H]+−2.7621.4344, 423.3623, 187.1478S/Ginsenoside Rh4 [26]
1710.18C15H24O221.1890221.1899[M + H]+−0.5221.1891S/Spathulenol [23]
1810.6C32H45NO10604.3116604.3102[M + H]+−2.3604.3100, 572.2832, 554.2722F/Benzoylaconine a [25]
1910.97C31H43NO9574.3011574.3005[M + H]+−1574.3005, 542.2727, 510.2492F/Benzoylhypaconine a [26]
2011.65C32H45NO9588.3167588.3163[M + H]+−0.7588.3163, 556.2896F/Ludaconitine [23]
2111.67C33H45NO12648.3014648.3009[M + H]+−0.9648.3007, 588.2791, 538.2441F/Beiwutine [26]
2212.41C42H72O14799.4849799.4813[M − H]−4.5799.4815, 637.4277, 475.3768S/Ginsenoside Rf a
2312.45C33H45NO11632.3065632.3056[M + H]+−1.5632.3056, 572.2839, 540.2585F/Mesaconitine a [25]
2412.69C54H92O231107.59571107.5957[M − H]01107.5980, 945.5447, 783.4916, 179.0565S/Ginsenoside Rb1 a
2512.77C42H70O12767.4940767.4929[M + H]+−1.5767.4928, 605.4283, 163.0463S/Ginsenoside Rg6 [26]
2612.95C42H72O13783.4900783.49[M − H]0783.4912, 637.4321, 475.3793, 161.0465S/Ginsenoside Rg2a
2713.02C36H62O9637.4321637.4321[M − H]0637.4354, 475.3789, 391.2826, 101.0263, 71.0176S/Ginsenoside Rh1 a
2813.09C42H72O13783.4900783.4901[M − H]0.1783.4958, 637.4354, 475.3823, 161.0427S/20(R)-Ginsenoside Rg2 a
2913.18C48H76O19955.4908955.4908[M − H]0955.4846, 793.4326, 731.4332, 523.3753S/Ginsenoside Ro a
3013.24C36H62O9637.4321637.4321[M − H]0637.4397, 475.3806, 391.2703, 101.0252, 71.0195S/20(R)-Ginsenoside Rh1 a
3113.3C33H45NO10616.3116616.3110[M + H]+−1.1616.3107, 556.2875, 524.2621, 338.1746F/Hypaconitine a [25]
3213.36C53H90O221077.58511077.5852[M − H]-01077.5838, 945.5423, 621.4360, 149.0467S/Ginsenoside Rb3 a
3313.37C34H47NO11646.3222646.3214[M + H]+−1.3646.3214, 586.3002, 526.2798F/Aconitine a [25]
3413.89C48H82O18945.5428945.5428[M − H]0945.5498, 783.4960, 621.4398, 459.3865, 161.0473S/Ginsenoside Rd a
3514.18C34H47NO10630.3273630.3263[M + H]+−1.5630.3259, 570.3069, 538.2808F/Indaconitine [23]
3614.27C34H47NO10630.3273630.3263[M + H]+−1.5630.3259, 570.3069, 538.2808F/Deoxyaconitine [26]
3716.94C42H72O13783.4900783.4869[M − H]−4783.4865, 621.4342, 161.0478S/20(R)-Ginsenoside Rg3 a
3817.03C42H72O13783.4900783.4869[M − H]−4783.4865, 621.4342, 161.0478S/Ginsenoside Rg3 a
3919.45C42H70O12765.4785765.4795[M − H]0.1765.4769, 603.4240, 161.0462S/Ginsenoside Rg5 [27]
a: The identity was confirmed by comparing the TR, MS/MS data with those of the reference substances. “F/” indicates that the components come from Fuzi, while “S/” indicates that the components come from Hongshen.
Table 2. Mass spectra properties of 13 analytes.
AnalytesPrecursor Ion (m/z)Product Ion (m/z)DP. (V)C.E. (V)
BMA590.3540.312050
BHA574.4542.412048
BAC604.4554.412050
MA632.2572.410047
HA616.1556.411046
AC646.2586.212047
FZL454.3436.513043
Rb11131.7365.113544
Rb31101.5789.425070
Rd969.6789.620966
Re969.6789.424059
Rg1823.5643.516254
Ro979.6845.626370
Table 3. Regression equations, R2, linear ranges, (limit of detections) LODs and, limit of quantifications (LOQs) of 13 analytes.
AnalytesRegression EquationR2Linear Range (ng/mL)LODs (ng/mL)LOQs (ng/mL)
BMAY = 93571x + 511320.99850.05–500.0030.01
BHAY = 147340x − 3680.90.99960.01–500.0030.01
BACY = 86804x + 456950.99410.01–500.0030.01
MAY = 540315x + 1161520.99690.01–250.0030.01
HAY = 167089x + 752020.99620.01–500.0030.01
ACY = 197019x + 708990.99880.01–500.0030.01
FZLY = 165582x + 390500.99560.01–250.0030.01
Rb1Y = 17.256x + 1430.99142.5–312.51.02.5
Rb3Y = 537.803x − 11440.99542.5–312.51.02.5
RdY = 9.8441x − 860.250.995125–62501.02.5
ReY = 945.03x + 4576.50.99272.5–156.21.02.5
Rg1Y = 554.14x + 6673.90.99112.5–312.51.02.5
RoY = 6.7504x + 5.30860.99565.0–312.51.02.5
Table 4. Precision, stability, and reproducibility of 13 analytes.
AnalytesPrecision RSD%Stability RSD% (n = 6)Reproducibility RSD% (n = 6)
Intra-Day (n = 6)Inter-Day (n = 3)
LowMediumHighLowMediumHigh
BMA3.492.612.163.642.222.742.687.06
BHA2.302.533.641.010.480.643.357.50
BAC5.482.413.141.951.240.715.647.92
MA3.393.162.492.112.973.652.438.59
HA2.492.240.962.982.894.021.848.69
AC2.152.001.233.861.442.954.339.14
FZL6.455.913.823.221.361.722.129.18
Rb15.985.836.876.602.6110.937.359.15
Rb33.891.322.999.907.535.095.289.75
Rd7.552.591.668.204.067.242.547.88
Re6.672.201.144.659.215.651.546.60
Rg16.475.473.567.406.455.603.897.55
Ro6.416.256.496.679.338.586.7510.13
Table 5. Recovery of 13 analytes.
AnalytesInitial Amount (ng)Added Amount (ng)Detected Amount (ng) (±SD, n = 3)Recovery (%) (±SD, n = 9)RSD (%) (n = 9)
BMA2526.8920004454.17 ± 21.9998.19 ± 2.852.90
25005003.63 ± 81.03
30005500.65 ± 109.08
BHA185.84150333.6 ± 11.3499.82 ± 4.434.44
185373.27 ± 4.76
230414.97 ± 6.76
BAC341.11270602.84 ± 5.7398.95 ± 5.025.08
340679.52 ± 10.23
400742.68 ± 35.26
MA27.882046.81 ± 0.5695.9 ± 3.623.77
2754.27 ± 1.48
3561.26 ± 0.9
HA420.34340752.58 ± 19.999.2 ± 5.225.26
420831.73 ± 9.64
500930.05 ± 36.2
AC22.761840.75 ± 1.2399.68 ± 6.066.08
2243.99 ± 1.46
2851.47 ± 1.5
FZL686.255501238.5 ± 39.4899.57 ± 6.977.00
6801329.98 ± 37.27
8201536.12 ± 58.53
Rb13480.7627006232.11 ± 238.45103.89 ± 5.485.28
35007097.51 ± 175.27
42007950.55 ± 42.83
Rb3 a22.501839.37 ± 0.2597.37 ± 4.454.57
22.544.52 ± 1.15
2749.64 ± 1.07
Rd a1283.5610202231.22 ± 22.8397.18 ± 6.536.72
12802510.78 ± 62.47
15402866.19 ± 124.04
Re1084.368501999.41 ± 6.77105.73 ± 5.685.37
11002189.04 ± 86.46
13002502.82 ± 17.04
Rg14165.0833007236.81 ± 73.3595.14 ± 3.473.64
42008314.75 ± 26.67
50008842.18 ± 176.42
Ro261.16210482.18 ± 7.72106.43 ± 3.93.66
260532.11 ± 11.07
310601.64 ± 4.77
a: The unit of weight was µg.
Table 6. The contents and solubilization ratios of 13 analytes by UPLC-QQQ-MS (mg/L).
AnalyteP1 (S) Detected AmountP2 (S:F = 3:1)P3 (S:F = 1:1)P4 (S:F = 1:3)P5 (F) DetectedAmount
DetectedAmountTheoretical AmountSolubilization Ratio (%)DetectedAmountTheoretical AmountSolubilization Ratio (%)DetectedAmountTheoretical AmountSolubilization Ratio (%)
BMA-56.4143.9128.47107.7687.8222.71180.45131.7236.99175.63
BHA-3.832.8136.547.015.6124.9611.748.4239.5111.22
BAC-1.703.61−52.849.357.2129.6816.3510.8251.1814.42
MA--0.72-2.481.4571.633.712.1771.162.89
HA-3.494.56−23.3812.409.1136.1121.1013.6754.4118.22
AC----0.82--0.75---
FZL-9.248.0315.0720.4816.0627.5235.4224.0947.0332.12
Rb1 a4.143.653.1117.381.501.82−17.951.010.9110.32-
Rb3 a0.731.120.55103.940.530.56−5.140.360.2829.57-
Rd a71.4070.7153.5532.0527.3035.36−22.7824.7317.6839.9-
Re a2.712.482.0322.160.881.24−29.061.000.6260.69-
Rg1 a0.930.800.7015.710.310.40−21.760.360.2076.94-
Ro a0.420.250.32−21.610.250.12100.570.150.06139.25-
a: The unit of content is g/L.

