Article

The Design and Synthesis of Fluorescent Coumarin Derivatives and Their Study for Cu2+ Sensing with an Application for Aqueous Soil Extracts

1
School of Engineering, RMIT University, GPO Box 2476, Melbourne, Victoria 3001, Australia
2
CSIRO Manufacturing, Bayview Avenue, Clayton, VIC 3169, Australia
3
Shanghai Key Laboratory of Functional Materials Chemistry, School of Chemistry and Molecular Engineering, East China University of Science and Technology, 130 Meilong Road, Shanghai 200237, China
4
CSIRO Mineral Resources, PO Box 218, Lindfield, NSW 2070, Australia
*
Author to whom correspondence should be addressed.
Molecules 2019, 24(19), 3569; https://doi.org/10.3390/molecules24193569
Submission received: 13 September 2019 / Revised: 26 September 2019 / Accepted: 1 October 2019 / Published: 2 October 2019
(This article belongs to the Special Issue Selective and Sensitive Detection of Biological and Chemical Species)

Abstract

:
A series of fluorescent coumarin derivatives 2ae were systematically designed, synthesized and studied for their Cu2+ sensing performance in aqueous media. The sensitivities and selectivities of the on-to-off fluorescent Cu2+ sensing signal were in direct correlation with the relative arrangements of the heteroatoms within the coordinating moieties of these coumarins. Probes 2b and 2d exhibited Cu2+ concentration dependent and selective fluorescence quenching, with linear ranges of 0–80 μM and 0–10 μM, and limits of detection of 0.14 μM and 0.38 μM, respectively. Structural changes of 2b upon Cu2+ coordination were followed by fluorescence titration, attenuated total reflection Fourier transform infrared spectroscopy (ATR-FTIR), mass spectrometry, and single crystal X-ray diffraction on the isolated Cu2+-coumarin complex. The results revealed a 1:1 stoichiometry between 2b and Cu2+, and that the essential structural features for Cu2+-selective coordination are the coumarin C=O and a three-bond distance between the amide NH and heterocyclic N. Probe 2b was also used to determine copper (II) levels in aqueous soil extracts, with recovery rates over 80% when compared to the standard soil analysis method: inductively coupled plasma-mass spectrometry (ICP-MS).

1. Introduction

Heavy metal contamination [1] in soil and water is a major concern due to its direct effect on the quality of drinking water, safe food production [2,3], and the detrimental impact on human health when present in the body in excessive amounts [4,5]. However, heavy metals are also important micronutrients for living organisms, thus are desired ingredients in soil and water [6]. Copper is known as one of the most abundant essential trace elements in human body [7,8], and is also required by many living organisms to maintain healthy physiological processes due to its redox-active nature [9]. The World Health Organization (WHO) sets the maximum allowable level of Cu2+ in drinking water at 30 μM and recommends that the population mean intake should not exceed 10–12 mg per day for adults [10]. Thus, the development of methods allowing for sensitive, selective, and real-time detection of bioavailable heavy metals, including Cu2+, in environmental samples is ever relevant.
Some of the most readily utilized sensing methods are based on molecular probes that display concentration dependent changes in their optical properties arising from the structural changes upon interaction with the analytes of interest [11]. Coumarins are attractive for use as fluorescent optical probes, due to their easy-to-tailor structure that allows for metal ion-selective coordination sites, as well as their exhibiting significant changes in their optical signals upon interaction with such target analytes [12]. When interacting with Cu2+, coumarins can undergo ligand to metal charge transfer, forming a Cu2+–coumarin complex. This can inhibit the intramolecular charge transfer (ICT) – the mechanism responsible for its fluorescence – within the coumarin. Thus, complex formation can result in the quenching of the coumarin’s fluorescence [13,14,15,16]. A broad range of coumarin-based fluorescent Cu2+-sensors have been reported [17]. For example, a ratiometric coumarin-hydrazone sensor exhibited Cu2+ selectivity in the presence of other transition metal ions, and its fluorescence emission at 574 nm was quenched by increasing amounts of Cu2+ present [18]. A reversible ratiometric Cu2+-sensor incorporating two covalently linked fluorophores (coumarin and 4-amino-7-sulfamoyl benzoxadiazole) displayed Cu2+-induced blue shift of its emission (from 555 to 460 nm) upon coordination of Cu2+ due to decreased intramolecular fluorescence resonance energy transfer (FRET) [19]. Despite the ever-increasing number of optical molecular probes reported for Cu2+ detection, improvements in selectivity and sensitivity, and a better understanding of the structural requirements when designing these Cu2+-coordinating molecular probes, remain of interest.
This work was aimed at the design, synthesis, and simultaneous evaluation of a series of structurally related coumarin derivatives to further understand the structural requirements towards optical Cu2+-sensors that have enhanced selectivity and sensitivity, especially when employed in mixed aqueous media. Previously reported work on picolyl-substituted coumarin-3-carboxylic acid derivatives 1ac (Scheme 1a) [20] indicated that the distance and relative orientation of the pyridine nitrogen relative to the other coordinating moieties (the coumarin C=O and the amide NH) were essential features affecting the ability to coordinate Cu2+. Coumarin 1a displayed Cu2+-selective fluorescence quenching, as opposed to 1bc which failed to do so. Herein, we designed a series of coumarin derivatives 2ae (Scheme 1b) incorporating various spacers between the amide NH and a pyridine N (two-bond in 2a, three-bond in 2b, and four-bond in 2c), or benzoimidazole N in 2d, or ethylenediamine -NH2 in 2e. Thus, information on the effect of (i) the different spacers between the Cu2+-coordinating heteroatoms in 2ac, and (ii) the distribution and availability of the electrons on the nitrogen oriented three-bonds away from the amide NH (2b, 2d, and 2e) on the coordination of Cu2+ can be gained. The coumarin derivatives which showed Cu2+-dependent fluorescence quenching were further studied by attenuated total reflection Fourier transform infrared spectroscopy (ATR-FTIR), mass spectrometry, and single crystal X-ray diffraction to indicate changes in their structure before and after Cu2+-coordination. From the results obtained, candidate 2b was evaluated on aqueous extracts of real soil samples collected from the roadside in the western parts of Melbourne, Victoria, Australia; the results were compared to the standard, inductively coupled plasma mass spectrometry (ICP-MS) method.

2. Results and Discussion

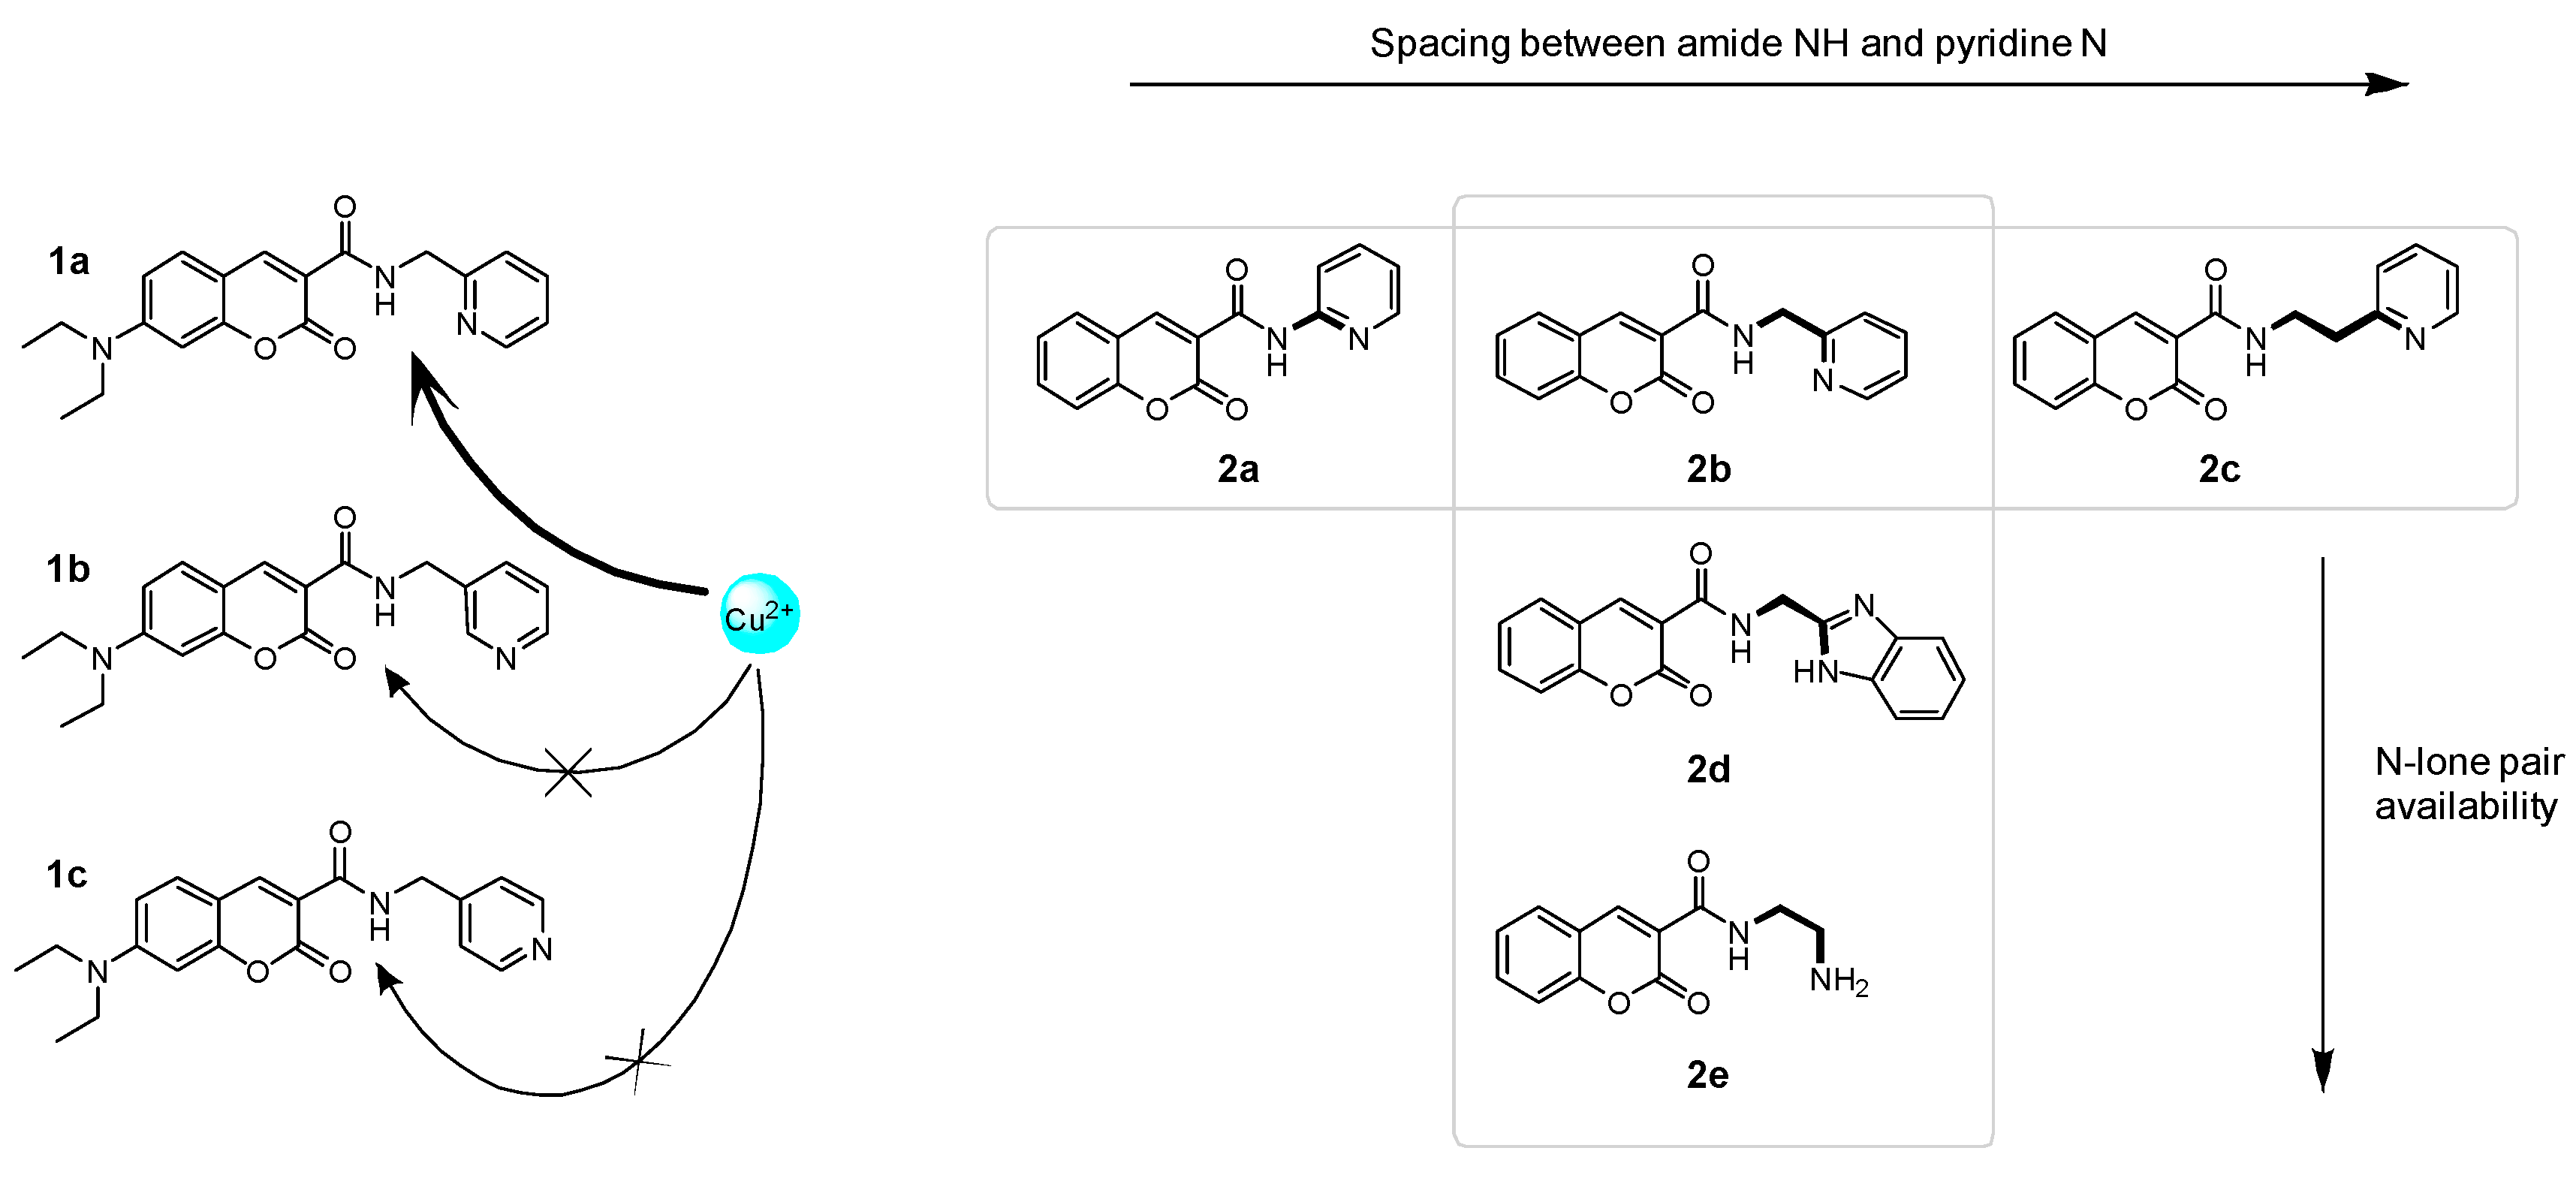
2.1. Design and Synthesis of Coumarin Derivatives 2ae

In order to gain further information on the ideal relative atomic arrangement of the Cu2+-selective coordinating moiety within substituted carboxylic coumarins; a series of alkylamino-pyridines 3ac, a benzimidazole 3d, and a linear chain mono-protected diaminoethylene 3e were selected and subjected to amide bond formation with coumarin-3-carboxylic acid using PyBOP as a coupling agent and triethylamine as a non-nucleophilic base (Scheme 2) [21]. Although the yields of 2ae were moderate (Table 1) (presumably due to the potential side reactions resulting in undesired by-products) [22], the choice of this coupling agent allowed for a facile, one-step purification process upon completion of the reaction. Due to the formation of water-soluble by-products, the desired products 2ad and Boc-2e were isolated after a simple extraction to a purity suitable for characterisation and analytical studies. Boc-2e was then subjected to deprotection using TFA, and then the TFA salt of 2e was neutralised with NaOH to obtain 2e. The resulting coumarins 2ae were characterised by 1H and 13C-NMR, IR, and high-resolution mass spectrometry (Figures S1–S20). Absorption, and fluorescence excitation and emission spectra for 2ae were recorded and the corresponding maxima are listed in Table 1. The Stokes shifts (∆ = λem − λex) were greater than 100 nm for each of these coumarin derivatives 2ae. This is a desired property for optical molecular probes, facilitating enhanced sensitivity due to the lesser overlap between the selected wavelengths of the exciting light-source and the emission filter in the detector recording the sensing signal [23].

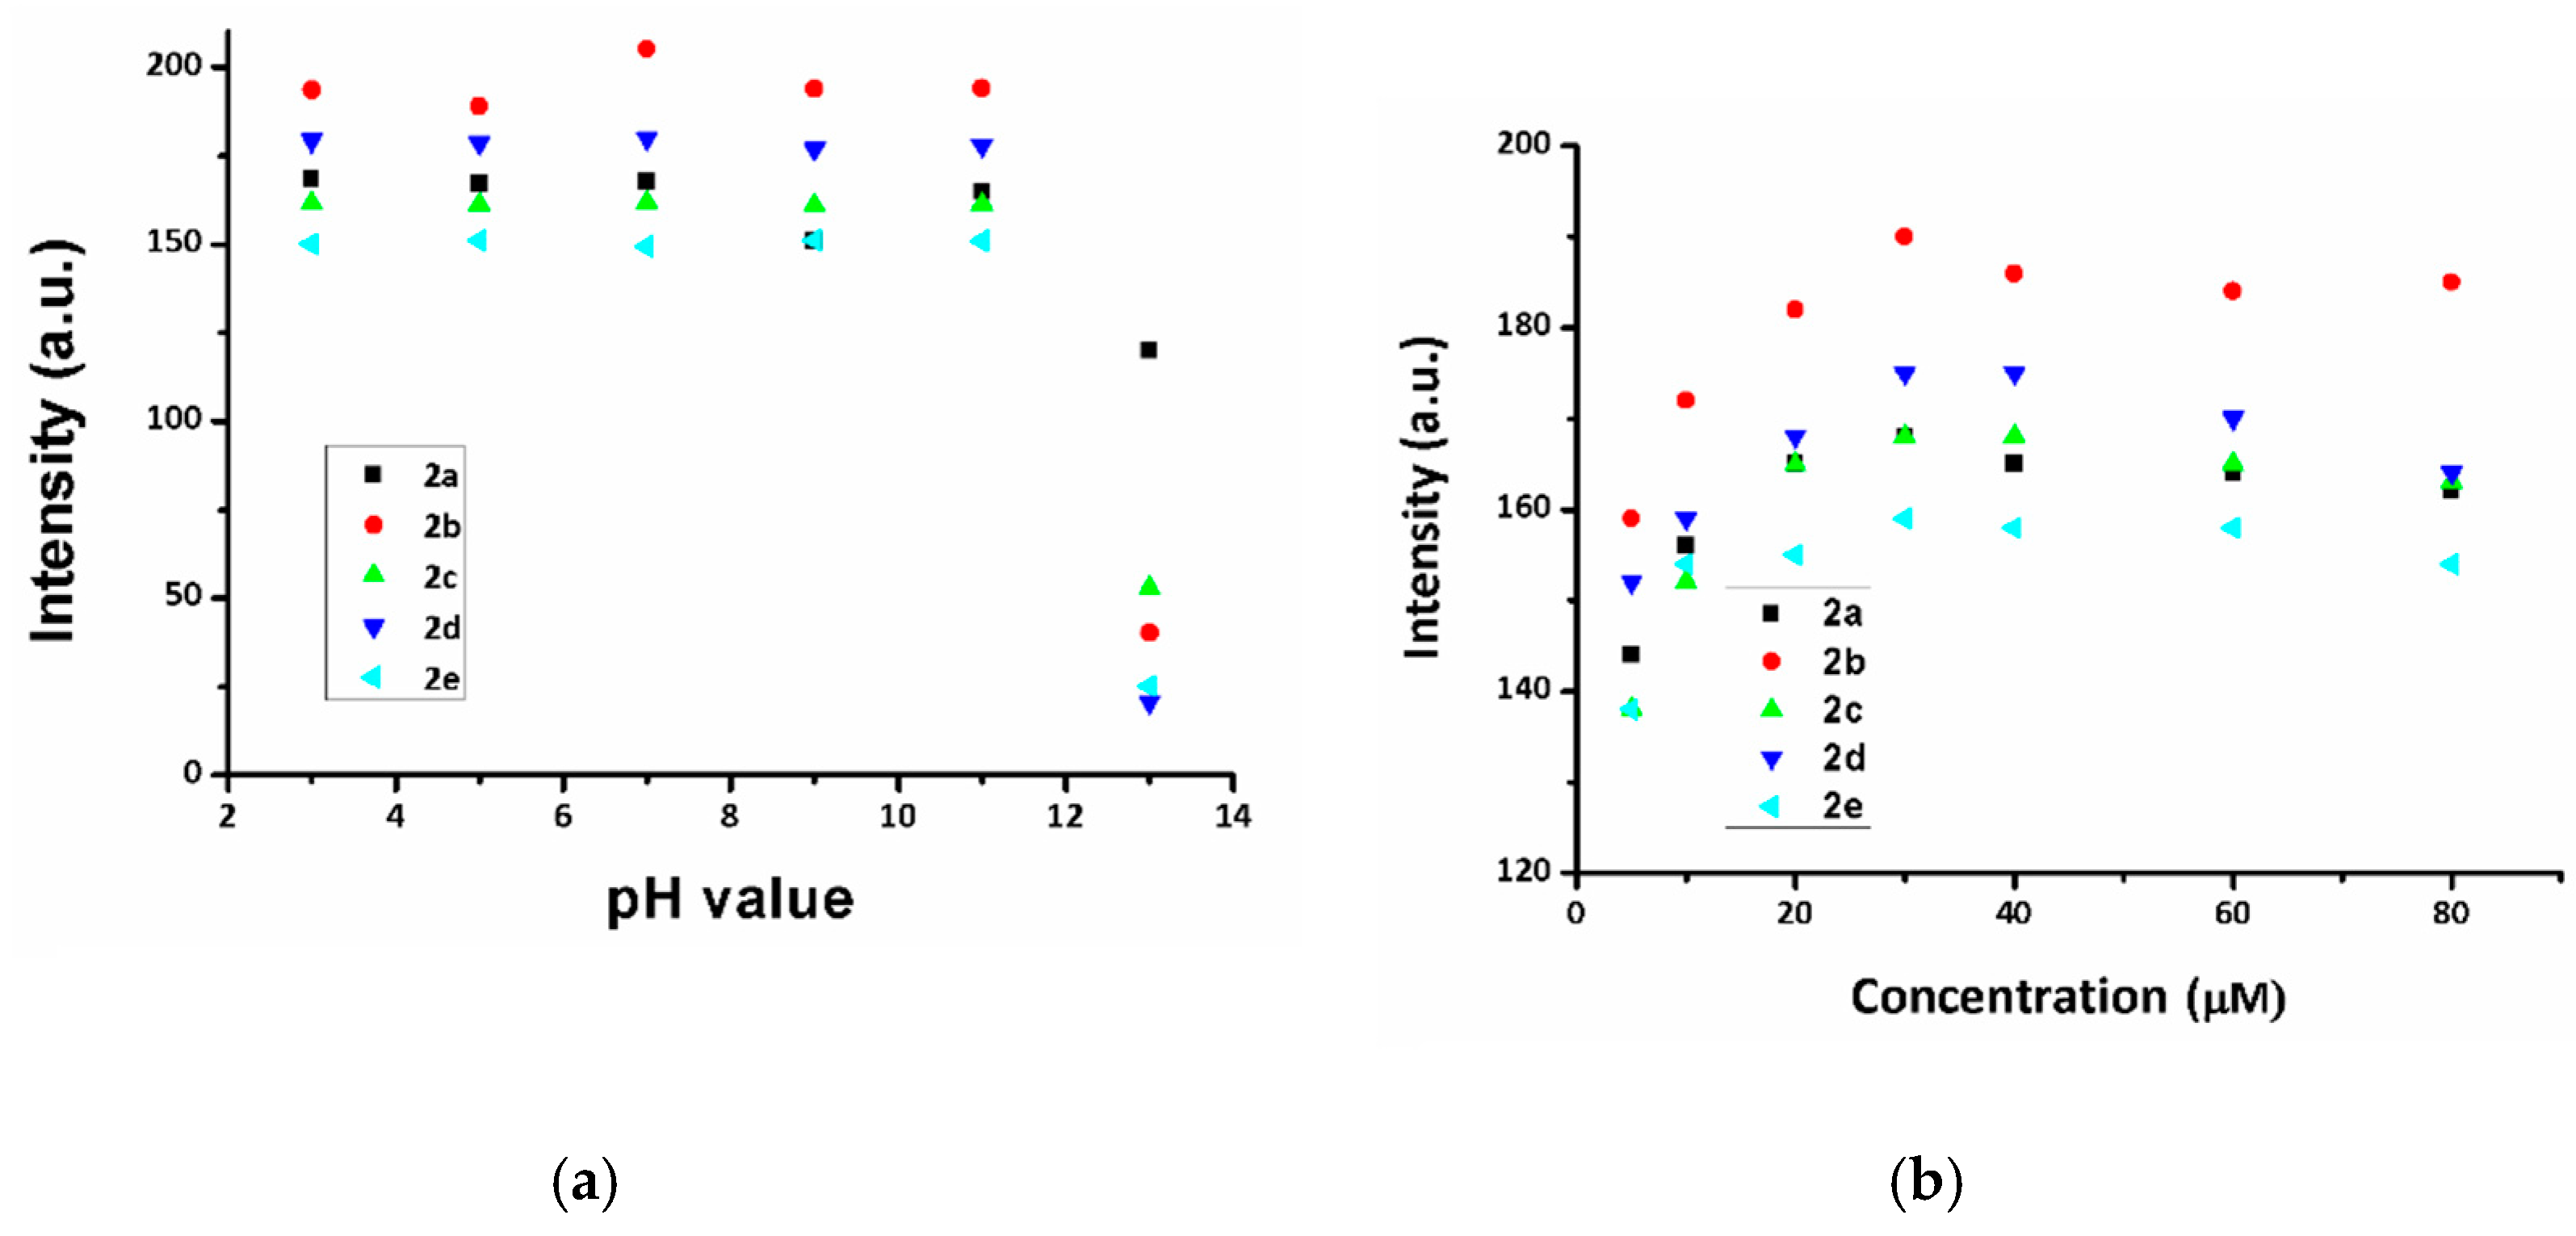
2.2. The Effects of pH and Concentration On The Fluorescence of 2ae

In order to find the optimum conditions to evaluate the Cu2+-sensing performance, fluorescence intensities of 2ae were recorded across the pH range of 3–13 (Figure 1a). The fluorescence of 2ae between pH 3–11 showed no significant changes; however, above pH 11, sharp quenching was observed. Fluorescence intensities at various concentrations of dissolved coumarin 2ae were also recorded within the range of 5–80 µM (Figure 1b). For the subsequent studies, 30 µM of dissolved 2ae at pH 7 was chosen, as beyond that concentration, no further concentration dependent fluorescence was observed.

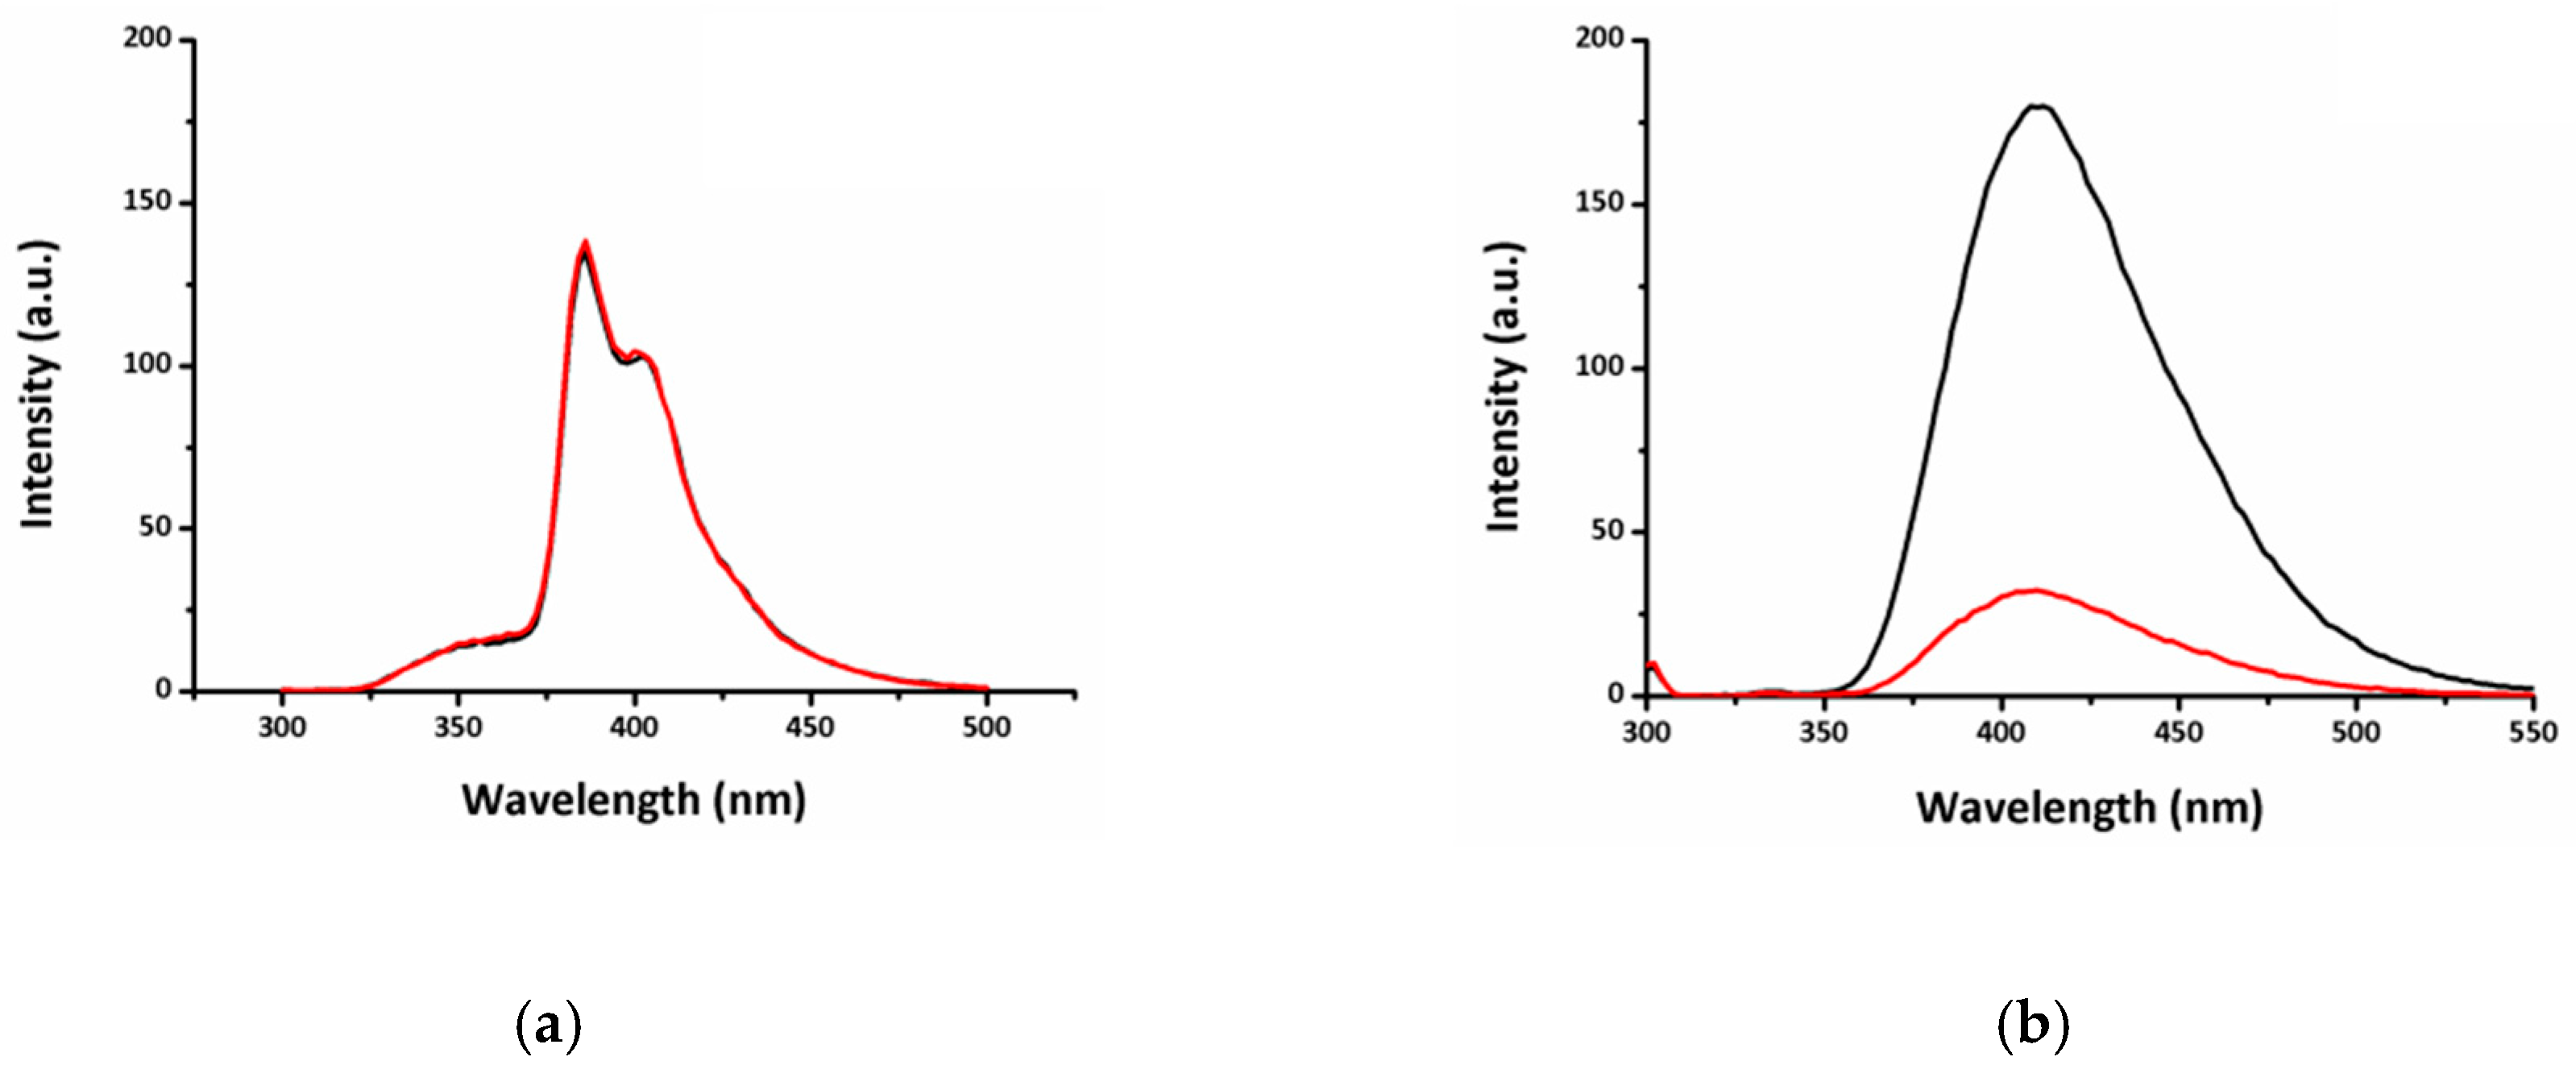
2.3. UV-Vis and Fluorescence Properties of 2ae in the Presence of Cu2+

UV-Vis spectra of 2ae in DMSO/HEPES buffer (v/v, 1/9) were recorded upon the addition of one equivalent of CuCl2 (Figure S21). Coumarins 2a and 2ce showed no changes in their absorbances, with only 2b showing a broadening of the absorption peak upon addition of CuCl2. Recording of the fluorescence emission intensities of 2ae in DMSO/HEPES buffer (v/v, 1/9) in the absence and presence of one equivalent of CuCl2ex according to Table 1) revealed that 2a, 2c, and 2e exhibited no optical response to Cu2+ (Figure 2). However, fluorescence quenching was observed for both 2bem = 412 nm) and 2dem = 436 nm), suggesting the coordination of Cu2+. In 2b, 2d, and 2e, the relative arrangement of the moieties that can donate electrons towards the copper are similar, yet despite this, only 2b and 2d exhibited optical responses upon interaction with the Cu2+. The lack of fluorescence quenching in 2e is proposedly due to the greater flexibility of the linear chain amino group that does not facilitate the formation of a metal-coumarin complex. Based on these results, a three-bond spacing and restricted flexibility between the heterocyclic nitrogen and the amide NH are deemed to be essential for the Cu2+-based fluorescence quenching, and consequently, 2b and 2d were further studied for their Cu2+-sensing performance is aqueous media.
Firstly, fluorescence titrations of 2b and 2d (30 µM) with CuCl2 (0–80 µM) in DMSO/HEPES buffer were carried out (Figure 3) to identify the linear range and the limit of detection (LOD). Both 2b and 2d responded with gradually quenched fluorescence intensities at their emission maxima, 412 nm and 436 nm, respectively, during the addition of increasing amounts of CuCl2. The fluorescence quenching of 2b by Cu2+ was linear (R2 = 0.995) within the Cu2+ concentration range of 0–80 µM, which is a significant improvement from the previously reported probe 1a, whose response was linear only within the range of 0–25 μM [20]. The calculated limit of detection (LOD) was 0.14 µM (LOD = 3σ/slope, where σ is standard deviation of the blank measurements) [24]. Both the linear range and the LOD were satisfactory to fulfil the sensing requirements for monitoring copper levels in drinking water, as the maximum allowed level is specified at 30 µM by the Australian Drinking Water Guidelines [25]. Meanwhile, 2d (Figure 3c–d) exhibited a rather narrow linear range of 0–10 µM, and a calculated association constant of 7.83 × 10⁵ M−1 (versus that of 2b at 6.85 × 10⁴ M−1) [26], and a LOD of 0.38 µM. Furthermore, a shift of the emission maxima from 436 nm towards 405 nm was observed in the presence of Cu2+ at concentrations >10 µM. Thus, 2d may only be applicable for Cu2+-sensing within the range of 0.4–10 µM. Also, the greater association constant shows higher affinity of 2d to coordinate Cu2+, which is suggested to be indicative to the greater availability of the heterocyclic N lone pair in 2d [27], hence the faster coordination of Cu2+.
For both 2b and 2d, the fluorescence quenching mechanism can be explained by the previously reported ligand to metal charge transfer [28]. The fluorescence quenching results herein showed that a decrease of the emission intensity occurs beyond the addition of one equivalent (30 μM) of Cu2+ to both 2b and 2d (Figure 3a,c). This phenomenon was previously studied via femtosecond time-resolved fluorescence, showing evidence that the charge transfer only contributes to 29% of the overall fluorescence quenching [20].
To further assess the time-frame of developing coordination and charge transfer between Cu2+ and the probes, the changes in the fluorescence intensity as functions of time were recorded for 2b and 2d. After the addition of two equivalents of Cu2+ (ensuring the full quenching of fluorescence), and a subsequent mixing step taking 3.5 sec, the fluorescence intensity values were recorded at 25 ℃ (Figure 4) and fitted with modified first order kinetics according to (Equation (1)) [29] to identify the time points where the fluorescence was quenched by the Cu2+:
ln ( I ) =   k   ×   t   +   b
where I (a.u.) was fluorescence intensity of the coumarins, t (s) was time, and k (s−1) was the rate constant of the first-order model. The linear range of ln(I) versus time (s) function for 2b and 2d is shown in Figure 4, with R2 values of 0.99 and 0.98, respectively. To determine the time frame within which the fluorescent intensities of 2b and 2d were quenched by the copper, firstly, the average quenched fluorescence intensity was identified, as shown in Figure S22. Then, based on the linear fitted equations (Figure 4), the quenching time points were calculated to be 7.5 sec and 6.9 sec for 2b and 2d, respectively. Those results show the faster quenching of 2d compared to 2b, suggesting greater availability of the heterocyclic N lone pair in 2d [27] resulting in faster coordination.
One of the most indispensable qualities of a fluorescent probe is its selectivity towards a target analyte over other commonly encountered species. To evaluate the selectivity of 2b and 2d (30 μM) towards Cu2+ (30 μM), a variety of metal ions (30 μM) including Al3+, Ca2+, Cd2+, Co2+, Fe3+, Mn2+, Pb2+, Hg2+, Ni2+, Cu+, Mg2+, Li+, and Zn2+ were pre-mixed with the probes and fluorescence emissions were examined with and without the addition of Cu2+. In the presence of one equivalent of the potentially interfering cations, both 2b and 2d exhibited selectivity towards Cu2+ (Figure S23). When considering real life assays, the copper may be present at a significantly lower concentration compared to other metal ions; therefore, fluorescence quenching in the presence of excess amounts (20 equivalents) of interfering metal ions was also investigated for 2b and 2d (Figure 5). Fluorescence intensity prior the addition of the target analyte Cu2+ was quenched by more than 10% by only Fe3+ and Cd2+ for 2b (Table S1), and Co2+, Fe3+, Ni2+, and Hg2+ for 2d (Table S2). The inferior selectivity observed in the case of 2d suggests that the heterocyclic N and the availability of its lone pair have an essential role in the coordination of the metal ion species.
Another desirable property of a sensing system is the potential for repeated recovery of the sensor, which results in an extended life-cycle and applicability. Cu2+ is known for its high affinity towards chelating agents, such as L-cysteine [30], EDTA [31], and dopamine [32]. In this work, EDTA was used to record fluorescence recovery of both 2b and 2d. Upon the alternating addition of 1 eq. of Cu2+, then EDTA, the fluorescence levels of 2b was recovered up to approximately 80% of its original intensity through four recovery cycles (Figure 6). These results indicated that 2b could be employed in reusable optical sensing devices for Cu2+ detection.
A summary of the sensing properties for 2b, 2d, and the previously published probe 1a, can be found in Table 2. It is apparent that 2b shows improvements both in its LOD and linear range for Cu2+-sensing in DMSO/HEPES buffer.

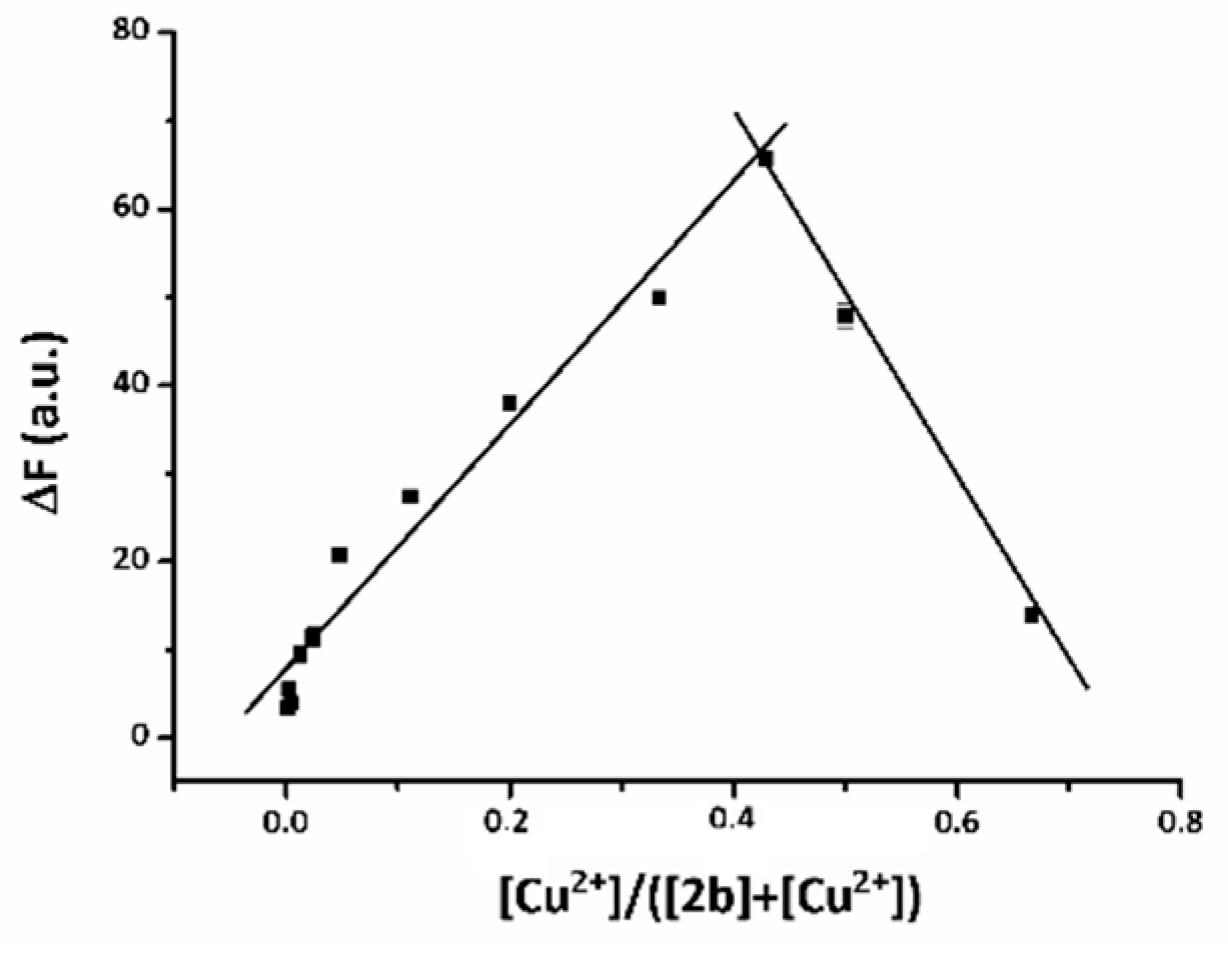
2.4. The Coordination of Cu2+ by Coumarin 2b

The fluorescence titration of coumarins 2ae showed that 2b and 2d had affinities to coordinate Cu2+, with 2b having a suitable linear range and selectivity for practical application. Hence, the interaction between 2b and Cu2+ was further studied. Job plot, solid state ATR-FTIR, single crystal X-ray diffraction, and mass spectra were recorded on 2b and the isolated 2b–Cu2+ complex. The Job plot analysis, based on the fluorescence recorded by titrating 2b with Cu2+ (Figure 7), revealed a 1:1 stoichiometry between 2b and Cu2+. This corresponds with the mass spectra depicting a peak for 2b-Cu2+ complex at m/z 383.03 (Figure S24). (Note that the corresponding peak is due to the association of the complex with the solvent used, acetonitrile.) However, tridentate chelation [33] of Cu2+ by 2b in a 1:2 stoichiometry is apparent by a m/z 622.09 peak in the mass spectra (Figure S24); upon increasing Cu2+ concentration this form transitions into a 1:1 complex.
Infrared spectra were also recorded on the solids isolated from an acetonitrile solution of 2b in the absence and presence of added Cu2+ (Figure 8 and Figure S25). Notably, the solid samples isolated from acetonitrile were a mixture of 2b, and 2b–Cu2+. By overlapping the normalised IR spectra, the characteristic changes in the intensities of particular peaks have confirmed the previously reported observation, that the key Cu2+-coordinating moieties are the coumarin C=O, the amide NH, and the pyridine N (Table 3).
Firstly, the defined peak at 3301 cm−1 corresponding to the NH stretch in 2b became broader and less intense upon the coordination of Cu2+ (Figure S25). The most apparent changes occurred within the region of 1680–1750 cm−1 originating from alterations of the coumarin C=O bond within 2b. Upon coordinating the Cu2+, the coumarin C=O peak at 1706 cm−1 became significantly less intense, suggesting the involvement of the oxygen lone pair electrons in the coordinative bond. Additionally, the amide C=O stretch shifted from 1648 in 2b to 1653 cm−1 in 2b-Cu2+ along with increased peak intensity. That suggests a lesser role of the carbonyl moiety in the potential amide resonance structures, hence the restoration of the amide C=O double bond, resulting in a stronger dipole, thus absorption at higher wavenumbers. Further changes were observed in the peaks presenting at about 1608 cm−1, depicted as C=N stretches of the pyridine ring. Both the amide NH and C–N peaks at 1564 cm−1 decreasing in intensity, and the transition of the 1514 cm−1 peak of free ligand 2b into 1550 cm−1 was observed (see shoulder of 2b-Cu2+) upon coordination with the Cu2+. Comprehensive loss of those peaks was not expected for two reasons: firstly, the studied solids were a mixture (as discussed above); secondly, the peak at 1564 cm−1 originates from both the vibration of amide NH and the stretch of amide C–N bonds. Furthermore, upon addition of Cu2+, the peak at 1451 cm−1 was reduced in intensity which suggested changes of the possible resonance structures in the pyridine ring.
Ultimately, single crystal X-ray diffraction was recorded on the crystal grown from an aqueous acetonitrile solution containing 2b and CuCl2 in a 1:1 molar ratio (Figure 9, Figure S26, Tables S1 and S2), as well as single crystal of 2b itself. The as-observed structure of 2b-Cu2+ complex is depicting a 1:1 stoichiometric ratio, and that the coumarin O(3), the amide N(2), the pyridine N(1), and a residual chlorine Cl(1) are the coordinating moieties [20]. This four-bond coordination was previously explained by the sp3 hybridization of Cu2+ when dissolved in acetonitrile water mixture [34]. According to the structure exhibited in the X-ray diffraction, the hydrogen of amide N(1) is displaced during the coordination process. Moreover, the bond length of coumarin C=O increased from 1.21 Å to 1.35 Å upon Cu2+ coordination, which falls between the conjugated and single bond length [35,36] (Table 4). This correlates with the IR results, translating into the diminishing C=O IR peak at 1707 cm−1 upon increasing Cu2+ concentration (Table 3).

2.5. The Evaluation of 2b on Soil Samples

The evaluation of 2b for Cu2+-sensing in soil was conducted using a water extraction [37] of roadside soil samples collected in the western parts of Melbourne, Victoria, Australia. Fluorescence titrations generated using 2b were compared against the industry standard of ICP-MS quantification [38]. ICP-MS quantifies elemental total copper content, while use of 2b measures dissolved Cu2+; comparison is still feasible, as it is accepted within the field that following sample preparation, most copper species will be present as Cu2+ [37,39,40]. The standard curve of 2b was recorded (Figure S27) and background fluorescence of soil extracts was also tested (Figure S28), allowing for correction when calculating the Cu2+ concentration by 2b. Recovery of Cu2+, directly from the water extraction without further sample manipulation was >80% for all three soil samples tested (Table 5).

3. Materials and Methods

3.1. Materials and Instruments

Benzotriazol-1-yloxy tripyrrolidinophosphonium hexafluoro-phosphate (PyBOP) was purchased from Oakwood Chemical (West Columbia, South Carolina, SC, USA). Coumarin-3-carboxylic acid (99%), 2-amino pyridine (99%), 2-(2ʹ-pyridyl)ethylamine (95%), and trifluoroacetic acid (99%) were purchased from Sigma-Aldrich (St. Louis, MO, USA). 2-(Aminomethyl)pyridine (99%) was obtained from Acros Organic (Belgium, WI, USA). 2-(Aminomethyl)benzimidazole dihydrochloride (98%) was purchased from Alfa Aesar (Ward Hill, USA). N-Boc-ethylenediamine (98%) was purchased from Combi-blocks (SanDiego, CA, USA). All chemicals were used as received without further purification. IR spectra were recorded on Nicolet 6700 FT-IR (Thermo Scientific, Waltham, MA, USA). UV-Vis and fluorescence spectra were measured on Varian Cary Eclipse 5G UV-Vis-NIR spectrometer and Varian Cary Eclipse fluorescence spectrophotometer (CMUSA), respectively. NMR were recorded on Bruker Ascend (Billerica, MA, USA) at 400 MHz for 13C and 100 MHz for 1H, respectively. Mass spectra were obtained on Thermo Scientific Q Exactive spectrometer in high resolution electrospray mode. Single crystal X-ray diffraction was recorded on Bruker Axs Apex Duo Single crystal XRD instrument. ICP-MS was conducted on Agilent Technologies 7700x ICP-MS Analyser (Santa Clara, CA, USA). CLARIOstar plate reader was used for kinetics study.

3.2. General Synthetic Method for the Preparation of 2ae

Coumarin derivatives 2ae were synthesised by the adaptation of a previously reported procedure with an additional step of deprotection for Boc-2e [20]. Coumarin-3-carboxylic acid (1 eq.), a selected amine (1.1 eq.), and PyBOP (1 eq.) were stirred at room temperature in acetonitrile. Upon completion, the reaction was quenched with brine (30 mL/5 mmol of coumarin-3-carboxylic acid) and extraction was conducted with dichloromethane (30 mL/5 mmol of coumarin-3-carboxylic acid). The organic layer was then washed with 10% citric acid, then 10% NaHCO3, following water and brine. The organic residues were dried over Na2SO4. Finally, the solvent was removed under vacuum. The residues were triturated with ethyl acetate to give the desired product as a solid.

3.2.1. Synthesis of 2-oxo-N-(pyridin-2-yl)-2H-chromene-3-carboxamide (2a)

Yield of 2a: 26%; white solid; FTIR (neat, cm−1) C=O 1701, N–H 3261 and 1565, C=N 1670, C–N 1534; 1H-NMR (400 MHz, DMSO-d6, ppm): δ 7.20 (1H, t, J = 6.1 Hz, CH-4ʹ), 7.49 (1H, t, J = 7.6 Hz, CH-7), 7.57 (1H, d, J = 8.4 Hz, CH-8), 7.81 (1H, t, J = 7.8 Hz, CH-6), 7.89 (1H, t, J = 7.8 Hz, CH-5ʹ), 8.07 (1H, d, J = 7.8 Hz, CH-5), 8.27 (1H, d, J = 8.3 Hz, CH-3ʹ), 8.39 (1H, d, J = 4.9 Hz, CH-6ʹ), 9.05 (1H, s, CH-4), 11.17 (1H, s, NH). 13C-NMR (100 MHz, CDCl3, ppm): δ 115.0, 116.9, 118.5, 118.7, 120.4, 125.5, 130.1, 134.7, 138.3, 148.5, 149.4, 151.3, 154.8, 159.9, 161.3; LRMS ASAP [2a + H+] 267.07; HRMS ASAP, [2a + H+] calculated m/z C15H11N2O3 267.0725, found = 267.0764.

3.2.2. Synthesis of 2-oxo-N-(pyridin-2-ylmethyl)-2H-chromene-3 carboxamide (2b)

Yield of 2b 23%; white solid; FTIR (neat, cm−1) C=O 1706, N–H 3301 and 1564, C=N 1648, C–N 1514; 1H-NMR (400 MHz, DMSO-d6, ppm): δ 4.65 (2H, d, J = 5.6 Hz, CH2), 7.28 (1H, t, J = 6.2 Hz, CH-4ʹ), 7.39 (1H, d, J = 7.8 Hz, CH-3ʹ), 7.46 (1H, t, J = 7.5 Hz, CH-7), 7.53 (1H, d, J = 8.4 Hz, CH-8), 7.77 (2H, m, CH-5ʹ and 6), 8.01 (1H, d, J = 7.2 Hz, CH-5), 8.55 (1H, d, J=4.9 Hz, CH-6ʹ), 8.91 (1H, s, CH-4), 9.44 (1H, t, J = 5.5 Hz, NH); 13C-NMR (100 MHz, CDCl3, ppm): δ 45.5, 116.7, 118.5, 118.7, 121.8, 122.4, 125.3, 129.9, 134.1, 136.8, 148.5, 149.5, 154.6, 156.8, 161.3, 161.8. LRMS ASAP [2b + H+] 281.09; HRMS ASAP [2b] calculated m/z C16H12N2O3 280.0881, found = 280.0847.

3.2.3. Synthesis of 2-oxo-N-(2-(pyridin-2-yl) ethyl)-2H-chromene-3-carboxamide (2c)

Yield of 2c: 25%; white solid; FTIR (neat, cm−1): C=O 1706, N–H 3299 and 1566, C=N 1654, C–N 1516; 1H-NMR (500 MHz, DMSO-d6, ppm): δ 3.00 (2H, t, J = 7.0 Hz, CH2-7ʹ), 3.74 (2H, q, J = 6.6 Hz, CH2-8ʹ), 7.24 (1H, t, J = 4.8 Hz, CH-4ʹ), 7.31 (1H, d, J = 7.8 Hz, CH-3′), 7.43 (1H, t, J = 6.0 Hz, CH-7),7.51 (1H, d, J = 8.4 Hz, CH-8), 7.70–7.76 (2H, m, 5ʹ and 6), 7.98 (1H, d, J = 6.2 Hz, CH-5), 8.52 (1H, d, J = 3.8 Hz, CH-6ʹ), 8.87 (1H, s, CH-4), 8.92 (1H, t, J = 5.6 Hz, NH); 13C-NMR (100 MHz, DMSO-d6, ppm): δ 36.9, 38.8, 116.2, 118.5, 118.9, 121.7, 123.3, 125.2, 130.3, 134.1, 136.6, 147.6, 149.2, 153.9, 159.0, 160.4, 161.0. LRMS ASAP [2c + H+] 295.10; HRMS ASAP [2c + H+] calculated m/z C17H15N2O3 295.1038, found = 295.1079.

3.2.4. Synthesis of N-((1H-benzo[d]imidazol-2-yl) methyl)-2-oxo-2H-chromene-3-carboxamide (2d)

Yield of 2d: 26%; orange solid; FT-IR (neat, cm−1): C=O 1691, N–H 3395 and 1566, C=N 1653, C–N 1544; 1H-NMR (400 MHz, DMSO-d6, ppm): δ 4.94 (2H, s, CH2), 6.63 (1H, t, J = 7.6 Hz, CHbenzoimidazol) 6.80 (1H, d, J = 8.0 Hz, CHbenzoimidazol), 6.96 (1H, t, J = 7.4 Hz, CHbenzoimidazol), 7.46–7.57 (3H, m, CH-8, 7 and benzoimidazol), 7.78 (1H, t, J = 7.9 Hz, CH-6), 8.03 (1H, d, J = 7.7 Hz, CH-5), 8.95 (1H, s, CH-4), 10.10 (s, 1H, NHamide); 13C (100 MHz, DMSO-d6, ppm): δ 52.6, 116.3, 116.3, 116.5, 117.0, 118.6, 119.9, 123.4, 124.5, 125.4, 126.3, 130.5, 134.4, 141.5, 147.4, 154.7, 159.9, 163.3; LRMS ASAP [2d + H2O + H+] 338.34; HRMS ASAP [2d] calculated m/z C18H13N3O3 319.0990, found = 319.0955.

3.2.5. Synthesis of N-(2-aminoethyl)-2-oxo-2H-chromene-3-carboxamide (2e)

The crude product received by the reaction of coumarin-3-carboxylic acid and 3e following the general procedure was purified by column chromatography on silica gel using 50% ethyl acetate in hexane to give desired product Boc-2e (yield 46%). Boc-2e (0.50 g, 1.5 mmol) was treated with trifluoroacetic acid (TFA, 5 mL) over an ice bath for 2 h. The volatiles were removed under vacuum, and the residues were taken up in water (10 mL). The mixture was neutralized with 1 M aqueous NaOH and extracted with DCM (50 mL), twice. The organic residues were washed with a saturated solution of Na2CO3 (aq) (50 mL), then brine (50 mL), and afterwards, dried over Na2SO4, filtered, and concentrated under reduced pressure to give 2e (0.23 g, 1.0 mmol, 66%) as a white solid. Overall yield of 2e: 30%; white solid; FT-IR (neat, cm−1): C=O 1678, N–H 3318 and 1566, C–N 1512; 1H-NMR (400 MHz, DMSO-d6, ppm): δ 2.98 (2H, t, J = 6.1 Hz, CH2-2ʹ), 3.55 (2H, t, J = 6.1 Hz, CH2-1ʹ) 7.46 (1H, t, J = 7.6 Hz, CH-6), 7.54 (1H, d, J = 8.4 Hz, CH-8), 7.74-7.89 (3H, m, CH-7 and NH2), 8.01 (1H, d, J = 7.8 Hz, CH-5), 8.89 (1H, s, CH-4), 8.93 (1H, t, J = 6.0 Hz, NH). 13C-NMR (100 MHz, DMSO-d6, ppm): δ 37.2, 38.5, 116.3, 118.5, 118.9, 125.4, 130.5, 134.4, 147.8, 154.0, 160.2, 162.1; LRMS ASAP [2e + H+] 233.09; HRMS ASAP [2e] calculated m/z C12H12N2O3 232.0880, found = 232.0846.

3.2.6. Synthesis of 2b-Cu2+ Complex for IR Study

Coumarin 2b was dissolved in acetonitrile, and then an aqueous solution of 0.5 or 1 equivalent of CuCl2 was added and left to stir until fully dissolved. The volatiles were reduced under vacuum to give the desired Cu2+ complexes used without further purification to record IR and mass spectra.

3.2.7. The preparation of a Single Crystal of 2b and 2b–Cu2+ Complex

2b was dissolved in acetonitrile first and the crystal was grown under vapour diffusion into EtOH. One equivalent of 2b and CuCl2 were dissolved in a solution of acetonitrile and water. The single crystal was grown under vapour diffusion into EtOH.

3.3. Optical Properties of 2ae

CuCl2 stock solution (1.00 mM) was prepared in aqueous solution of DMSO/HEPES buffer (20 mM, pH = 7) (v/v, 1/9), and stock solutions of 2ae (0.9 mM) were prepared in DMSO/HEPES buffer (20 mM, pH = 7) (v/v, 1/9).

3.3.1. Fluorescence Intensity of 2ae

Fluorescence intensity of 2ae was recorded at pH 7 at concentrations in the range of 5–80 μM, diluted from the stock solution using DMSO/HEPES buffer on Varian Cary Eclipse spectrophotometer, with excitation and emission slit widths of 5 nm at their corresponding excitation maxima.

3.3.2. pH Dependence of Fluorescence Intensity

Fluorescence intensities of 2ae (30 μM) with slit widths of 5 nm were recorded across the pH range of 3–13 at their corresponding excitation maxima.

3.3.3. The Optical Properties of 2ae in the Presence of 1 eq. of Cu2+

UV-Vis and fluorescence spectra were recorded for 2ae (30 μM) and 2ae (30 μM) in the presence of CuCl2 (30 μM) in DMSO/HEPES buffer (20 mM, pH = 7) in the 250–600 nm region for the UV-Vis and with slit widths of 5 nm for fluorescence studies.

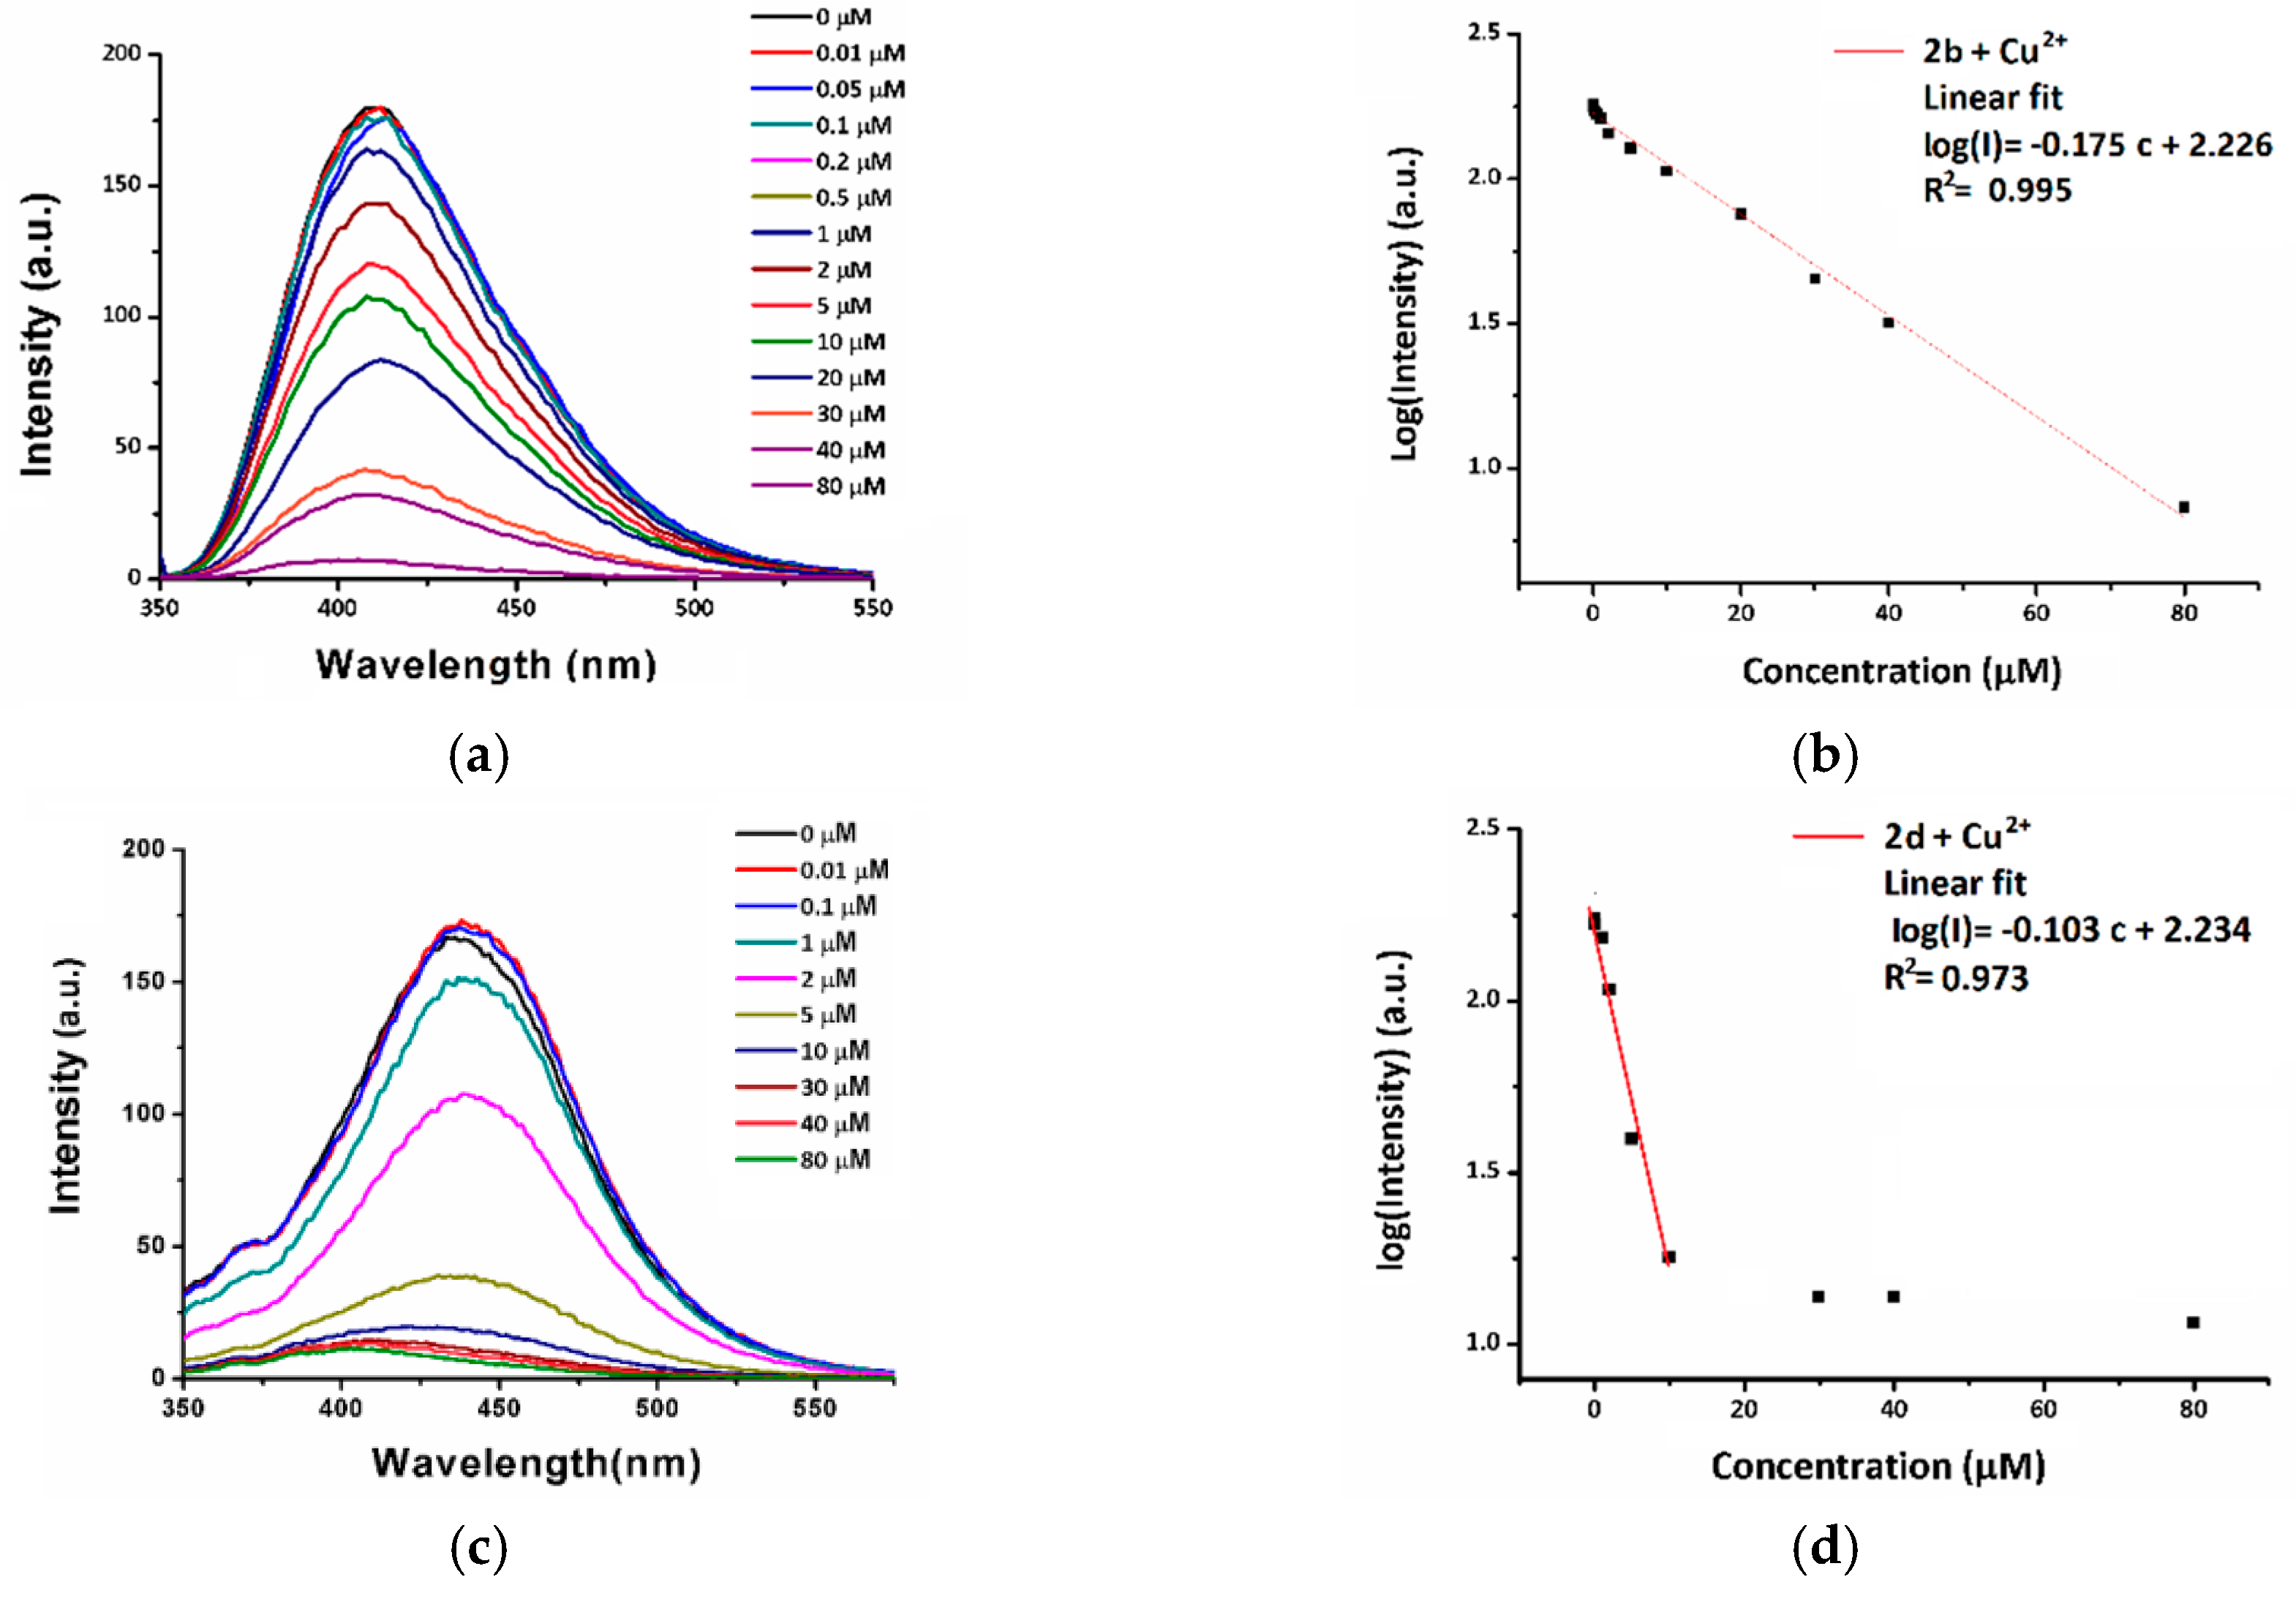
3.3.4. Fluorescence Spectra of 2b and 2d in the Presence of Cu2+ at Various Concentrations

Fluorescence spectra of 2b and 2d (30 μM) were recorded in the presence of CuCl2 (0–80 μM) in DMSO/HEPES buffer (20 mM, pH = 7) with slit widths of 5 nm at their corresponding excitation maxima, respectively. The kinetics study was conducted using 100 μL of 60 μM solutions of compound 2b and 2d in DMSO/HEPES buffer (20 mM, pH = 7, v/v, 1/9) with the automatic pipetting of 100 μL of 120 μM Cu2+ solution to form the complexes of 2b–Cu2+ and 2d–Cu2+ at 25 °C. After 3.5 s shaking time, the changes in time of the fluorescence for 2b–Cu2+ and 2d–Cu2+ complexes were recorded on CLARIOstar plate reader.

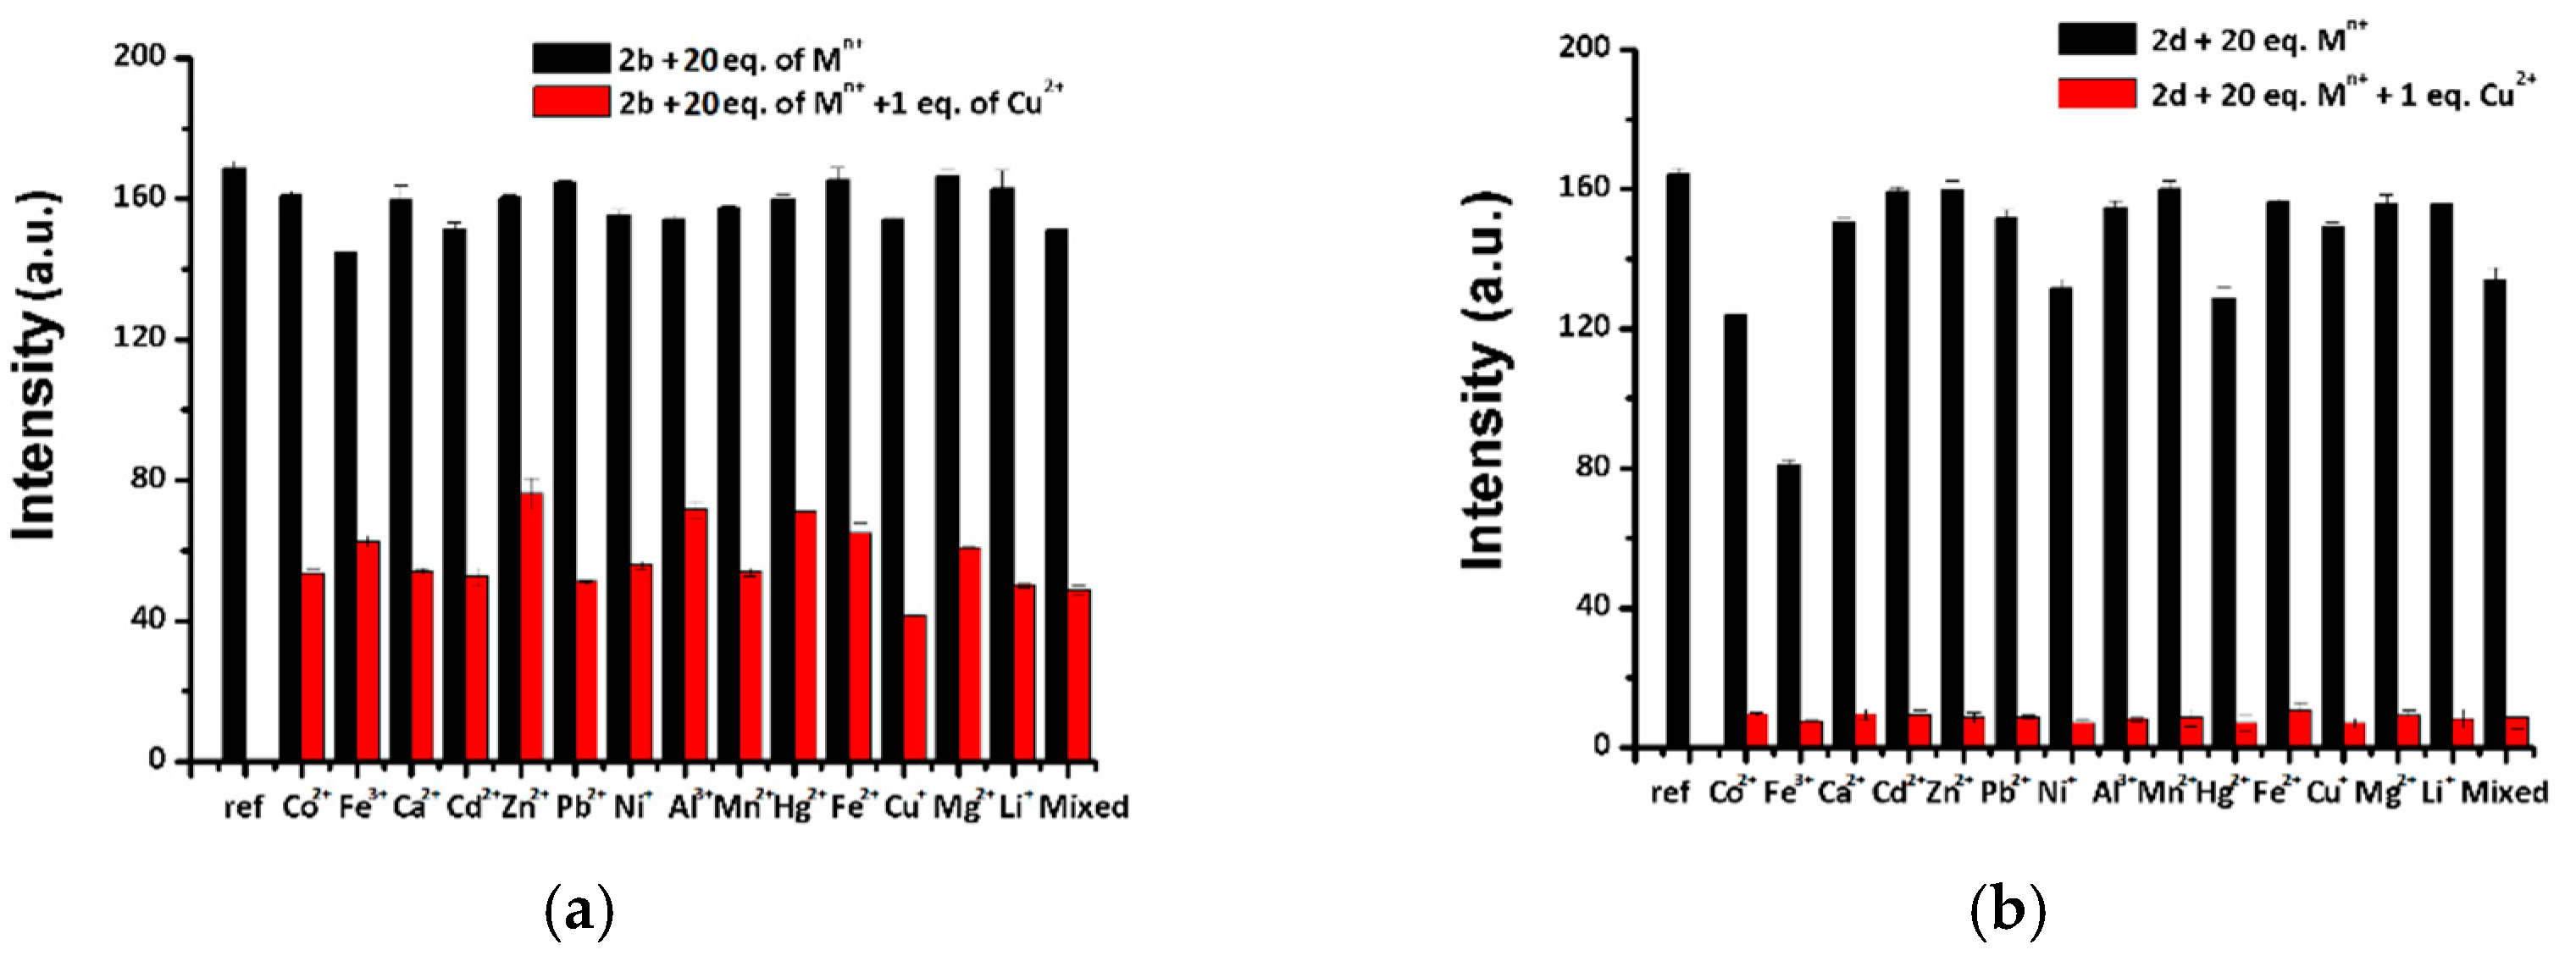
3.3.5. Interference Studies

The fluorescence intensities of 2b and 2d (30 μM) were recorded in the presence of following metal chlorides: Al3+, Ca2+, Cd2+, Co2+, Fe3+, Mn2+, Pb2+, Hg2+, Ni2+, Fe2+, Cu+, Mg2+, and Zn2+ (20 eq., 600 μM) in DMSO/HEPES buffer (20 mM, pH = 7), both in the absence and presence of CuCl2 (30 μM). Firstly, an aliquot of selected potentially interfering metal ions (60 μM, 1 mL) and 2b or 2d (60 μM, 1 mL) was mixed together to reach a final concentration of 30 μM. The fluorescence of this solution was recorded. Then, a stock solution of CuCl2 (60 μL) was added to those, and optical properties were again measured. Fluorescence spectra were recorded with slit widths of 5 nm at their corresponding excitation maxima.

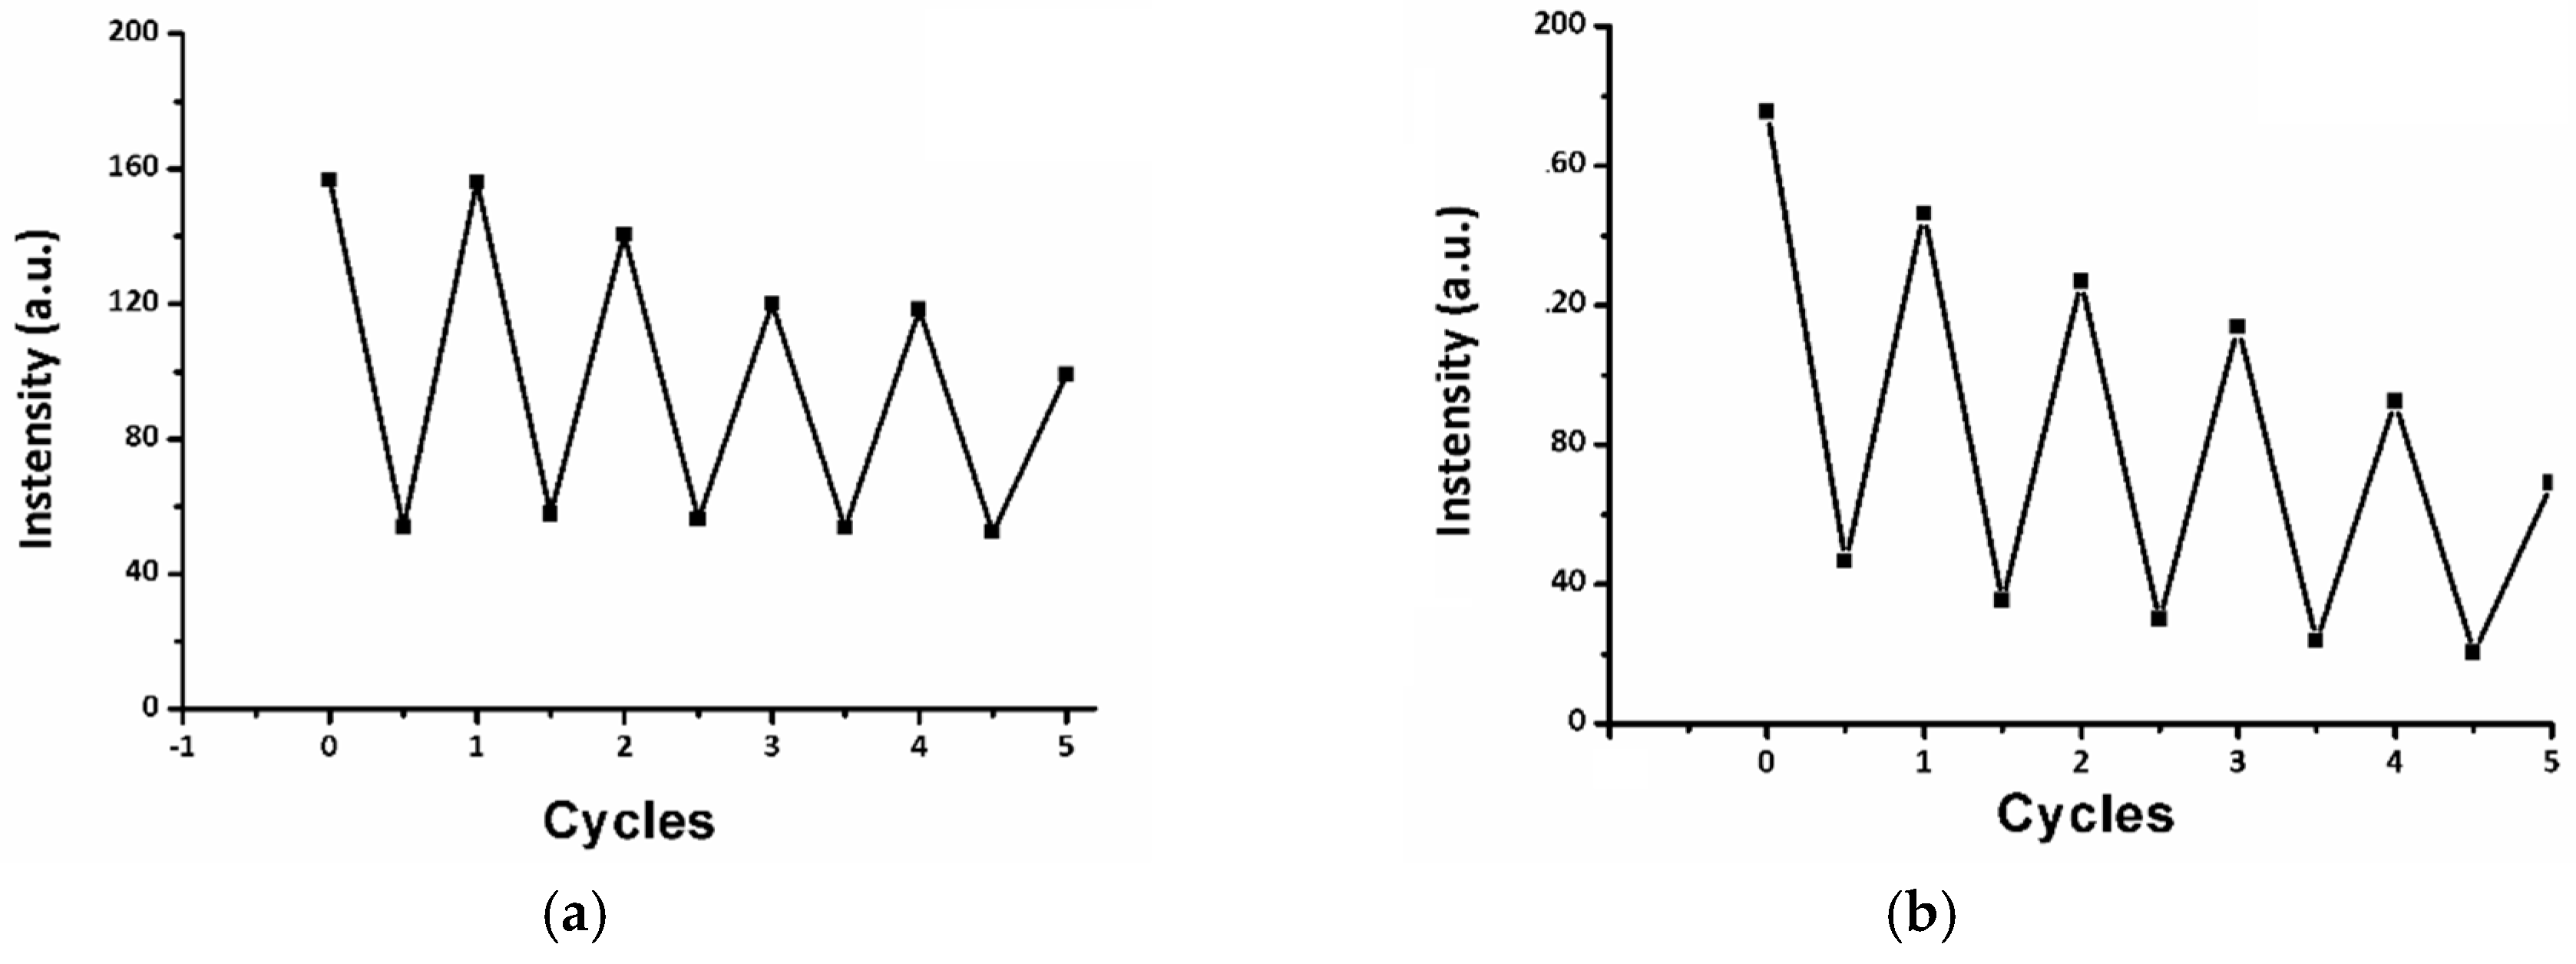
3.3.6. Fluorescence Signal Recovery Study

The fluorescence intensity of 2b (30 μM) was recorded in DMSO/HEPES buffer (20 mM, pH = 7) upon the alternating addition of 1 equivalent of CuCl2, followed by 1 equivalent of ethylene diamine tetraacetic acid (EDTA) in repeat cycles.

3.3.7. Cu2+ Sensing in Aqueous Soil Extracts

Soil samples were collected from the roadside in the western parts of Melbourne, Victoria, Australia. Soil samples (2.5 g) were dispersed in water (25 mL) and shaken for one week to extract water-soluble copper. The extracts were filtered through a 0.45 mm pore-size nylon filter membrane. Each extract was analysed for their copper content via ICP-MS [37] and by recording the fluorescence quenching using 60 µM solution of 2b (1 mL in DMSO/HEPES, v/v, 2:8) mixed with the soil extract (and 1 mL of water) for the quantitation of Cu2+ in soil using a pre-recorded standard curve.

4. Conclusions

A series of five coumarin derivatives were systematically designed, synthesized, and evaluated for their potential use for Cu2+-sensing in aqueous media. Coumarins 2b and 2d exhibited selectivity towards Cu2+ in the presence of other multivalent metal ions. The linear ranges of the sensing signal versus Cu2+ concentration were 0–80 μM for 2b, and 0–10 μM for 2d, falling into the relevant and desired concentration range for environmental sensing techniques. Limits of detection in aqueous media were 0.14 μM and 0.38 μM for 2b and 2d, respectively, satisfactory for the potential application of these molecular optical probes. Probe 2b exhibited superior applicable sensing performance towards Cu2+ when compared to the other coumarins presented in this work, hence it was further studied to gain understanding on its interaction with Cu2+. Solid state ATR-FTIR, single crystal X-ray diffraction, and mass spectrometry, revealed a 1:1 stoichiometric complex as the responsible species for the displayed quenching of the fluorescence of 2b. The formation of this coordination complex resulted in a Cu2+-concentration dependent sensing signal, while offered good recovery of the probe signal based on the fluorescence recovery study using EDTA. As a proof-of-concept for its applicability, 2b provided results in the Cu2+ quantitation of soil extracts which were comparable with the standard ICP-MS method. Furthermore, by assessing structurally related coumarins 2ae (owning slightly different Cu2+-coordinating moieties), we gained valuable information on the required size of the coordination-site, relative spatial and atomic arrangement, and electron distribution of the coordinating heteroatoms. The fluorescence responses of 2ac suggested that the size of the coordination site has a significant impact on the Cu2+ coordination. Finally, the fluorescence titration of 2b and 2d suggested that the lone pair’s availability of the heteroatoms at the same relative position also affects the sensing properties, both in coordination speed and selectivity. These results will be used in our future work for the systematic design and development of metal-ion coordinating optical sensing probes, owning enhanced selectivity and sensitivity.

Supplementary Materials

The following are available online at https://www.mdpi.com/1420-3049/24/19/3569/s1, Figure S1: Figure S1 1H NMR spectrum of 2a, Figure S2 13C NMR spectrum of 2a, Figure S3 IR spectrum of 2a, Figure S4 High resolution mass spectra of 2a, Figure S5 1H NMR spectrum of 2b, Figure S6 13C NMR spectrum of 2b, Figure S7 IR spectrum of 2b, Figure S8 High resolution mass spectra of 2b, Figure S9 1H NMR spectrum of 2c, Figure S10 13C NMR spectrum of 2c, Figure S11 spectrum of 2c, Figure S12 High resolution mass spectra of 2c, Figure S13 1H NMR spectrum of 2d, Figure S14 13C NMR spectrum of 2d, Figure S15 IR spectrum of 2d, Figure S16 High resolution mass spectra of 2d, Figure S17 1H NMR spectrum of 2e, Figure S18 13C NMR spectrum of 2e, Figure S19 IR spectrum of 2e, Figure S20 High resolution mass spectra of 2e, Figure S21 Uv-Vis absorbance 2a-e (30 µM) in DMSO/HEPES buffer (v/v, 1/9) in the absence (black lines) and presence (red lines) of 1 equivalent of CuCl2: (a) 2a; (b) 2b; (c) 2c; (d) 2d; (e) 2e, Figure S22 Kinetics study of (a) 2bex=303 nm) and (b) 2dex=325 nm) (30 µM) with the addition of 2 eq. of CuCl2 in HEPES/DMSO buffer, Figure S23 Fluorescence emission intensities of (a) 2bex=303 nm) and (b) 2dex=325 nm) both 30 μM in the presence (red lines) and absence (black lines) of Cu2+ with 20 equivalents of various cations in DMSO/HEPES buffer, Table S1 Fluorescence intensity variations of 2b with adding 20 eq. metal ions, Table S2 Fluorescence intensity variations of 2d with adding 20 eq. metal ions, Figure S24 LRMS of 2b-Cu2+, Figure S25 Normalized IR spectra of 2b with different ratios of Cu2+, Figure S26 Single crystal structure of 2b, Figure S27 Standard curve for Cu2+ sensing by 2b in DMSO/HEPES buffer (v/v, 1/9, 20 mM, pH=7), Figure S28 Fluorescence background for soil extracts in DMSO/HEPES buffer (v/v, 1/9, 20 mM, pH=7), Table S3 Crystal data and structure refinement for 2b, Table S4 Crystal data and structure refinement for 2b-Cu2+.

Author Contributions

conceptualization, B.Q., L.V., L.B., S.M.R., M.L., G.W., and I.S.C.; methodology, B.Q., L.V., I.S.C., and S.M.R.; formal analysis, B.Q.; data curation, B.Q.; writing—original draft preparation, B.Q. and L.V.; writing—review and editing, L.V., A.T., I.S.C., and M.L.; supervision, I.S.C., G.W., S.M.R., L.V., and L.B.; funding acquisition, I.S.C.

Funding

This research received no external funding.

Acknowledgments

Bin Qian would like to show his appreciation to Frank Antolasic for conducting the single crystal X-ray analysis at RMIT University, to Jo Cosgriff (CSIRO) for her assistance with the NMR and MS analysis, to Shamali de Silva (RMIT) for collecting the soil samples, developing the soil testing protocol, and obtaining the soil extracts, to Paul Morrison for providing the ICP-MS results.

Conflicts of Interest

The authors declare no conflict of interest.

References

  1. Wu, P.; Zhao, T.; Wang, S.; Hou, X. Semiconductor quantum dots-based metal ion probes. Nanoscale 2014, 6, 43–64. [Google Scholar] [CrossRef] [PubMed]
  2. Jin, J.; Sun, K.; Wu, F.; Gao, B.; Wang, Z.; Kang, M.; Bai, Y.; Zhao, Y.; Liu, X.; Xing, B. Single-solute and bi-solute sorption of phenanthrene and dibutyl phthalate by plant- and manure-derived biochars. Sci. Total. Environ. 2014, 473, 308–316. [Google Scholar] [CrossRef] [PubMed]
  3. Ma, J.W.; Wang, F.Y.; Huang, Z.H.; Wang, H. Simultaneous removal of 2,4-dichlorophenol and Cd from soils by electrokinetic remediation combined with activated bamboo charcoal. J. Hazard. Mater. 2010, 176, 715–720. [Google Scholar] [CrossRef] [PubMed]
  4. Clemens, S.; Ma, J.F. Toxic Heavy Metal and Metalloid Accumulation in Crop Plants and Foods. Annu. Rev. Plant Boil. 2016, 67, 489–512. [Google Scholar] [CrossRef] [PubMed] [Green Version]
  5. Mohmand, J.; Eqani, S.A.; Fasola, M.; Alamdar, A.; Mustafa, I.; Ali, N.; Liu, L.; Peng, S.; Shen, H. Human exposure to toxic metals via contaminated dust: Bio-accumulation trends and their potential risk estimation. Chemosphere 2015, 132, 142–151. [Google Scholar] [CrossRef]
  6. Giripunje, M.D.; Fulke, A.B.; Meshram, P.U. Remediation Techniques for Heavy-Metals Contamination in Lakes A Mini-Review. Clean-Soil, Air, Water 2015, 43, 1350–1354. [Google Scholar] [CrossRef]
  7. Kumar, J.; Bhattacharyya, P.K.; Das, D.K. New duel fluorescent “on-off” and colorimetric sensor for Copper(II): Copper(II) binds through N coordination and pi cation interaction to sensor. Spectrochim. Acta A Mol. Biomol. Spectrosc. 2015, 138, 99–104. [Google Scholar] [CrossRef]
  8. Lee, H.Y.; Swamy, K.M.K.; Jung, J.Y.; Kim, G.; Yoon, J. Rhodamine hydrazone derivatives based selective fluorescent and colorimetric chemodosimeters for Hg2+ and selective colorimetric chemosensor for Cu2+. Sens. Actuat. B: Chem. 2013, 182, 530–537. [Google Scholar] [CrossRef]
  9. Robinson, N.J.; Winge, D.R. Copper metallochaperones. Annu. Rev. Biochem. 2010, 79, 537–562. [Google Scholar] [CrossRef]
  10. World Health Organization: Copper in Drinking Water. Available online: https://www.who.int/water_ sanitation_health/publications/copper/en/ (accessed on 2 October 2019).
  11. Quang, D.T.; Kim, J.S. Fluoro- and Chromogenic Chemodosimeters for Heavy Metal Ion Detection in Solution and Biospecimens. Chem. Rev. 2010, 110, 6280–6301. [Google Scholar] [CrossRef]
  12. Váradi, L.; Wang, M.; Mamidi, R.R.; Luo, J.L.; Perry, J.D.; Hibbs, D.E.; Groundwater, P.W. A latent green fluorescent styrylcoumarin probe for the selective growth and detection of Gram negative bacteria. Bioorganic Med. Chem. 2018, 26, 4745–4750. [Google Scholar] [CrossRef] [PubMed] [Green Version]
  13. Qu, Q.; Zhu, A.; Shao, X.; Shi, G.; Tian, Y. Development of a carbon quantum dots-based fluorescent Cu2+ probe suitable for living cell imaging. Chem. Comm. 2012, 48, 5473–5475. [Google Scholar] [CrossRef] [PubMed]
  14. Uglov, A.N.; Bessmertnykh-Lemeune, A.; Guilard, R.; Averin, A.D.; Beletskaya, I.P. Optical methods for the detection of heavy metal ions. Russ. Chem. Rev. 2014, 83, 196–224. [Google Scholar] [CrossRef] [Green Version]
  15. Panchenko, P.A.; Fedorova, O.A.; Fedorov, Y.V. Fluorescent and colorimetric chemosensors for cations based on 1,8-naphthalimide derivatives: design principles and optical signalling mechanisms. Russ. Chem. Rev. 2014, 83, 155–182. [Google Scholar] [CrossRef]
  16. A Bren, V. Fluorescent and photochromic chemosensors. Russ. Chem. Rev. 2001, 70, 1017–1036. [Google Scholar] [CrossRef]
  17. Papadopoulos, J.; Merkens, K.; Muller, T.J.J. Three-Component Synthesis and Photophysical Properties of Novel Coumarin-Based Merocyanines. Chemistry 2018, 24, 974–983. [Google Scholar] [CrossRef]
  18. Xu, H.X.; Wang, X.Q.; Zhang, C.L.; Wu, Y.P.; Liu, Z.P. Coumarin-hydrazone based high selective fluorescence sensor for copper(II) detection in aqueous solution. Inorg. Chem. Commun. 2013, 34, 8–11. [Google Scholar] [CrossRef]
  19. Chen, Y.; Zhu, C.; Cen, J.; Li, J.; He, W.; Jiao, Y.; Guo, Z. A reversible ratiometric sensor for intracellular Cu2+ imaging: Metal coordination-altered FRET in a dual fluorophore hybrid. Chem. Comm. 2013, 49, 7632–7634. [Google Scholar] [CrossRef]
  20. Jung, H.S.; Kwon, P.S.; Lee, J.W.; Kim, J.I.; Hong, C.S.; Kim, J.W.; Yan, S.; Lee, J.Y.; Lee, J.H.; Joo, T. Coumarin-derived Cu2+-selective fluorescence sensor: Synthesis, mechanisms, and applications in living cells. J. Am. Chem. Soc. 2009, 131, 2008–2012. [Google Scholar] [CrossRef]
  21. Fors, B.P.; Poelma, J.E.; Menyo, M.S.; Robb, M.J.; Spokoyny, D.M.; Kramer, J.W.; Waite, J.H.; Hawker, C.J. Fabrication of Unique Chemical Patterns and Concentration Gradients with Visible Light. J. Am. Chem. Soc. 2013, 135, 14106–14109. [Google Scholar] [CrossRef] [Green Version]
  22. Montalbetti, C.A.; Falque, V. Amide bond formation and peptide coupling. Tetrahedron 2005, 61, 10827–10852. [Google Scholar] [CrossRef]
  23. Coskun, A.; Akkaya, E.U. Signal Ratio Amplification via Modulation of Resonance Energy Transfer: Proof of Principle in an Emission Ratiometric Hg(II) Sensor. J. Am. Chem. Soc. 2006, 128, 14474–14475. [Google Scholar] [CrossRef] [PubMed]
  24. Long, G.L.; Winefordner, J.D. Limit of detection. A closer look at the IUPAC definition. Anal. Chem. 1983, 55, 712–724. [Google Scholar]
  25. National Health and Medical Research Council: Australian Drinking Water Guidelines 2011. Available online: https://www.nhmrc.gov.au/about-us/publications/australian-drinking-water-guidelines#block-views-block-file-attachments-content-block-1 (accessed on 2 October 2019).
  26. Yeh, J.-T.; Chen, W.-C.; Liu, S.-R.; Wu, S.-P. A coumarin-based sensitive and selective fluorescent sensor for copper (II) ions. New J. Chem. 2014, 38, 4434–4439. [Google Scholar] [CrossRef]
  27. Bailey, P.J.; Lorono-Gonzales, D.; McCormack, C.; Millican, F.; Parsons, S.; Pfeifer, R.; Pinho, P.P.; Rudolphi, F.; Sanchez Perucha, A. Reaction of Azole Heterocycles with Tris (dimethylamino) borane, a New Method for the Construction of Tripodal Borate-Centred Ligands. Chem.–Euro. J. 2006, 12, 5293–5300. [Google Scholar] [CrossRef]
  28. Ressalan, S.; Iyer, C. Absorption and fluorescence spectroscopy of 3-hydroxy-3-phenyl-1-o-carboxyphenyltriazene and its copper (II), nickel (II) and zinc (II) complexes: A novel fluorescence sensor. J. Lumin. 2005, 111, 121–129. [Google Scholar] [CrossRef]
  29. Kampalanonwat, P.; Supaphol, P. Preparation and Adsorption Behavior of Aminated Electrospun Polyacrylonitrile Nanofiber Mats for Heavy Metal Ion Removal. ACS Appl. Mater. Interfaces 2010, 2, 3619–3627. [Google Scholar] [CrossRef]
  30. Zong, J.; Yang, X.; Trinchi, A.; Hardin, S.; Cole, I.; Zhu, Y.; Li, C.; Muster, T.; Wei, G. Carbon dots as fluorescent probes for “off–on” detection of Cu2+ and l-cysteine in aqueous solution. Biosens. Bioelectron. 2014, 51, 330–335. [Google Scholar] [CrossRef]
  31. Su, L.; Shu, T.; Wang, Z.; Cheng, J.; Xue, F.; Li, C.; Zhang, X. Immobilization of bovine serum albumin-protected gold nanoclusters by using polyelectrolytes of opposite charges for the development of the reusable fluorescent Cu2+-sensor. Biosens. Bioelectron. 2013, 44, 16–20. [Google Scholar] [CrossRef]
  32. Aswathy, B.; Sony, G. Cu2+ modulated BSA–Au nanoclusters: A versatile fluorescence turn-on sensor for dopamine. Microchem. J. 2014, 116, 151–156. [Google Scholar] [CrossRef]
  33. Khatua, S.; Choi, S.H.; Lee, J.; Huh, J.O.; Do, Y.; Churchill, D.G. Highly selective fluorescence detection of Cu2+ in water by chiral dimeric Zn2+ complexes through direct displacement. Inorg. Chem. 2009, 48, 1799–1801. [Google Scholar] [CrossRef] [PubMed]
  34. Weser, U. Copper Coordination Chemistry: Biochemical and Inorganic Perspectives; Karlin, K.D., Zubieta, J., Eds.; Adenine Press: Guilderland, NY, USA, 1983. [Google Scholar]
  35. Mihaylov, T.; Trendafilova, N.; Kostova, I.; Georgieva, I.; Bauer, G. DFT modeling and spectroscopic study of metal–ligand bonding in La(III) complex of coumarin-3-carboxylic acid. Chem. Phys. 2006, 327, 209–219. [Google Scholar] [CrossRef]
  36. Allen, F.H.; Kennard, O.; Watson, D.G.; Brammer, L.; Orpen, A.G.; Taylor, R. Tables of bond lengths determined by X-ray and neutron diffraction. Part 1. Bond lengths in organic compounds. J. Chem. Soc. Perkin Trans. 2 1987, S1–S19. [Google Scholar] [CrossRef]
  37. Li, P.; Lang, M.; Wang, X.; Zhang, T. Sorption and desorption of copper and cadmium in a contaminated soil affected by soil amendments. Clean - Soil, Air, Water 2016, 44, 1547–1556. [Google Scholar] [CrossRef]
  38. Schwertfeger, D.; Hendershot, W. Ion exchange technique (IET) for measuring Cu2+, Ni2+ and Zn2+ activities in soils contaminated with metal mixtures. Environ. Chem. 2017, 14, 55. [Google Scholar] [CrossRef]
  39. Rashad, M.; Elnaggar, E.; Assaad, F.F. Readily dispersible clay and its role in the mobility of transition metals Cd2+, Cu2+ and Zn2+ in an alkaline alluvial soil. Environ. Earth Sci. 2014, 71, 3855–3864. [Google Scholar] [CrossRef]
  40. Minkina, T.M.; Nevidomskaya, D.G.; Shuvaeva, V.A.; Soldatov, A.V.; Tsitsuashvili, V.S.; Zubavichus, Y.V.; Rajput, V.D.; Burachevskaya, M.V. Studying the transformation of Cu2+ ions in soils and mineral phases by the XRD, XANES, and sequential fractionation methods. J. Geochem. Explor. 2018, 184, 365–371. [Google Scholar] [CrossRef]
Scheme 1. Schematic representation of (a) the Cu2+-coordinating capability of picolyl-substituted diethylamino-coumarins 1ac, and (b) the newly designed coumarins 2ae.
Molecules 24 03569 sch001
Figure 1. Fluorescence emission intensities of 2aeex according to Table 1) (a) at various pH values and (b) at various dissolved coumarin concentrations in DMSO/HEPES buffer (v/v, 1/9).
Molecules 24 03569 g001
Figure 2. Fluorescence intensities of 2ae (30 µM) in DMSO/HEPES buffer (v/v, 1/9) in the absence (black lines) and presence (red lines) of one equivalent of CuCl2 at their corresponding excitation maxima (see Table 1) (a) 2a; (b) 2b; (c) 2c; (d) 2d; (e) 2e.
Molecules 24 03569 g002aMolecules 24 03569 g002b
Figure 3. Fluorescence spectra of (a) 2bex = 303 nm) and (c) 2dex = 325 nm) (30 µM) with the addition of various concentrations of CuCl2 in HEPES/DMSO buffer and the corresponding titration curves and linear ranges of (b) 2b and (d) 2d.
Molecules 24 03569 g003
Figure 4. First-order plots for the coordination of Cu2+ with (a) 2b and (b) 2d.
Molecules 24 03569 g004
Figure 5. Fluorescence emission intensities of solutions containing 20 eq. of various cations and (a) 2b and (b) 2d (both 30 μM) in the presence (red bars) and absence (black bars) of 1 eq. of Cu2+ in DMSO/HEPES buffer.
Molecules 24 03569 g005
Figure 6. Fluorescence intensity of (a) 2b and (b) 2d upon the consecutive addition of Cu2+ followed by EDTA for five cycles in DMSO/HEPES buffer.
Molecules 24 03569 g006
Figure 7. Job plot based on the fluorescence titration of 2b (30 µM) with Cu2+.
Molecules 24 03569 g007
Figure 8. Normalized ATR-FTIR spectra of 2b (black line) and 2b-Cu2+ complex formed upon the addition of 0.5 eq. (red line) and 1 eq. (blue line) of CuCl2 to 2b (30 μM) in DMSO/HEPES buffer.
Molecules 24 03569 g008
Figure 9. Single crystal structure of 2b-Cu2+.
Molecules 24 03569 g009
Table 1. Selected amines 3ae, synthesized coumarin derivatives 2ae, and their corresponding yields (%), absorption maxima, excitation and emission maxima, and Stokes shifts.
Molecules 24 03569 i001 Molecules 24 03569 i002 Molecules 24 03569 i003 Molecules 24 03569 i004 Molecules 24 03569 i005
Probe2a2b2c2d2e*
Yield %2623252630^
λabs (nm)298300300306300
λex (nm)280303303325303
λem (nm)406412412436412
Δν (nm)126109109111109
*2e was obtained after removal of the protecting group of Boc-2e using TFA in DCM to give 2e (see Section 3.2.5); ^ overall yield.
Table 2. A comparison of sensing properties among 2b, 2d, and 1a.
2b2d1a*
Limit of detection (μM)0.140.380.5
Linear range (μM)0–800–100–50
Interference Fe3+, Cd2+Co2+, Fe3+, Ni+, Hg2+No data included
Association constant (M−1)6.85 × 1047.83 × 1051.17 × 105
* Values taken from literature [20].
Table 3. Characteristic ATR-FTIR peaks and their intensities (in brackets) for 2b before and after coordination of Cu2+.
ν(C=O)
Coumarin
ν(C=O)
Amide
ν(C=N)
Pyridine
ν(C=N)
Pyridine
ν(N-H)
Amide
ν(C-N)
Amide
ν(C=C)
Pyridine
ν(C=C)
Pyridine
2b1706
(0.74)
1648
(0.47)
1608
(0.47)
1601
(0.47)
1564
(0.62)
1514
(0.85)
1480
(0.44)
1451
(0.52)
+0.5 eq. Cu2+1707
(0.30)
1653
(0.75)
1609
(0.59)
1595
(0.54)
1566
(0.49)
1535
(0.36)
1483
(0.34)
1451
(0.40)
+1eq. Cu2+1707
(0.15)
1653
(0.71)
1610
(0.69)
1595
(0.51)
1567
(0.46)
1535
(0.57)
1483
(0.36)
1451
(0.39)
Table 4. Experimental and literature references of bond lengths (Å).
In 2bIn 2b-Cu2+Single bond length
Coumarin C=O1.211.351.43
Table 5. Determination and recovery values of Cu2+ in soil samples using both ICP-MS (μM) and 2b (μM).
SampleCu2+ Concentration by ICP-MS (μM)Fluorescence of Solution of 2b at λex = 412 nm (a.u.)Cu2+ Concentration by Using 2b (μM)Recovery
11.23 ± 0.13173.54 ± 0.691.03 ± 0.1383.7%
21.36 ± 0.21175.11 ± 0.361.27 ± 0.0593.4%
31.71 ± 0.27178.48 ± 0.691.75 ± 0.09102.3%

