Structural Basis for the Regulation of PPARγ Activity by Imatinib


Abstract
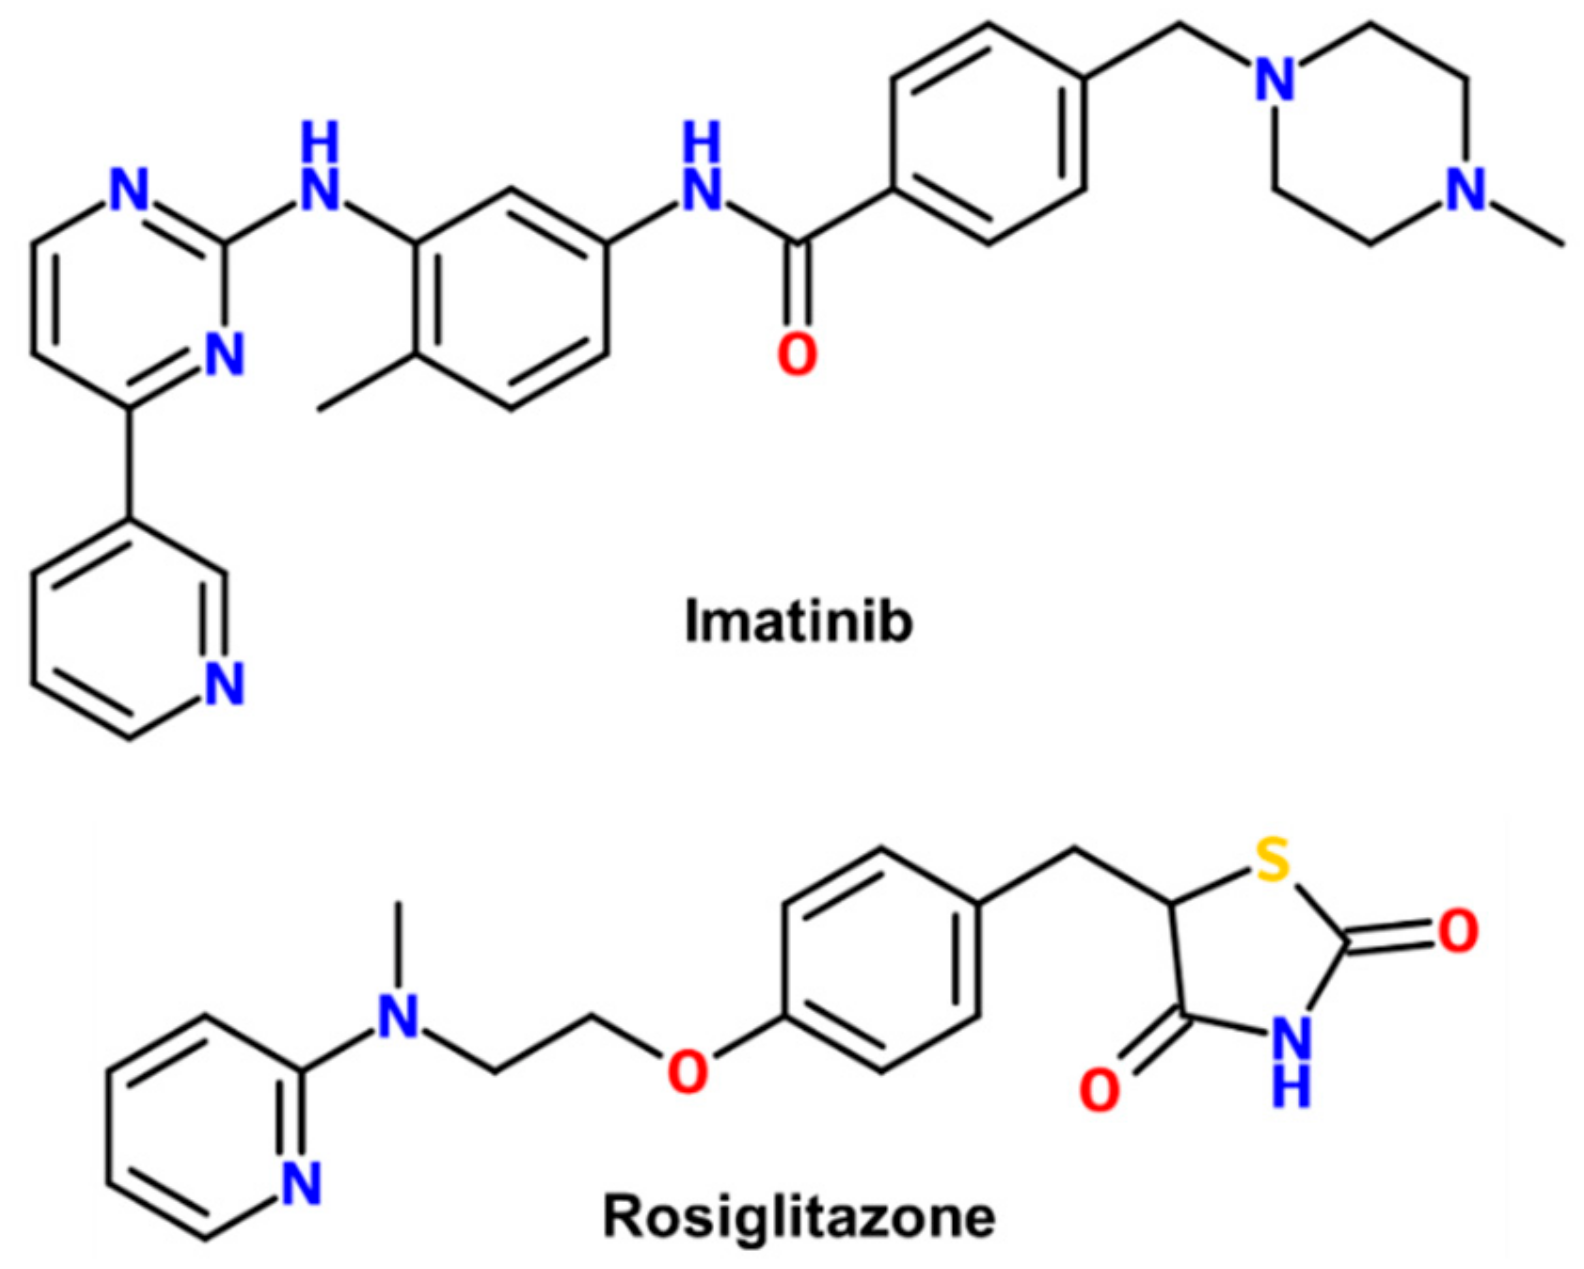
1. Introduction
2. Results
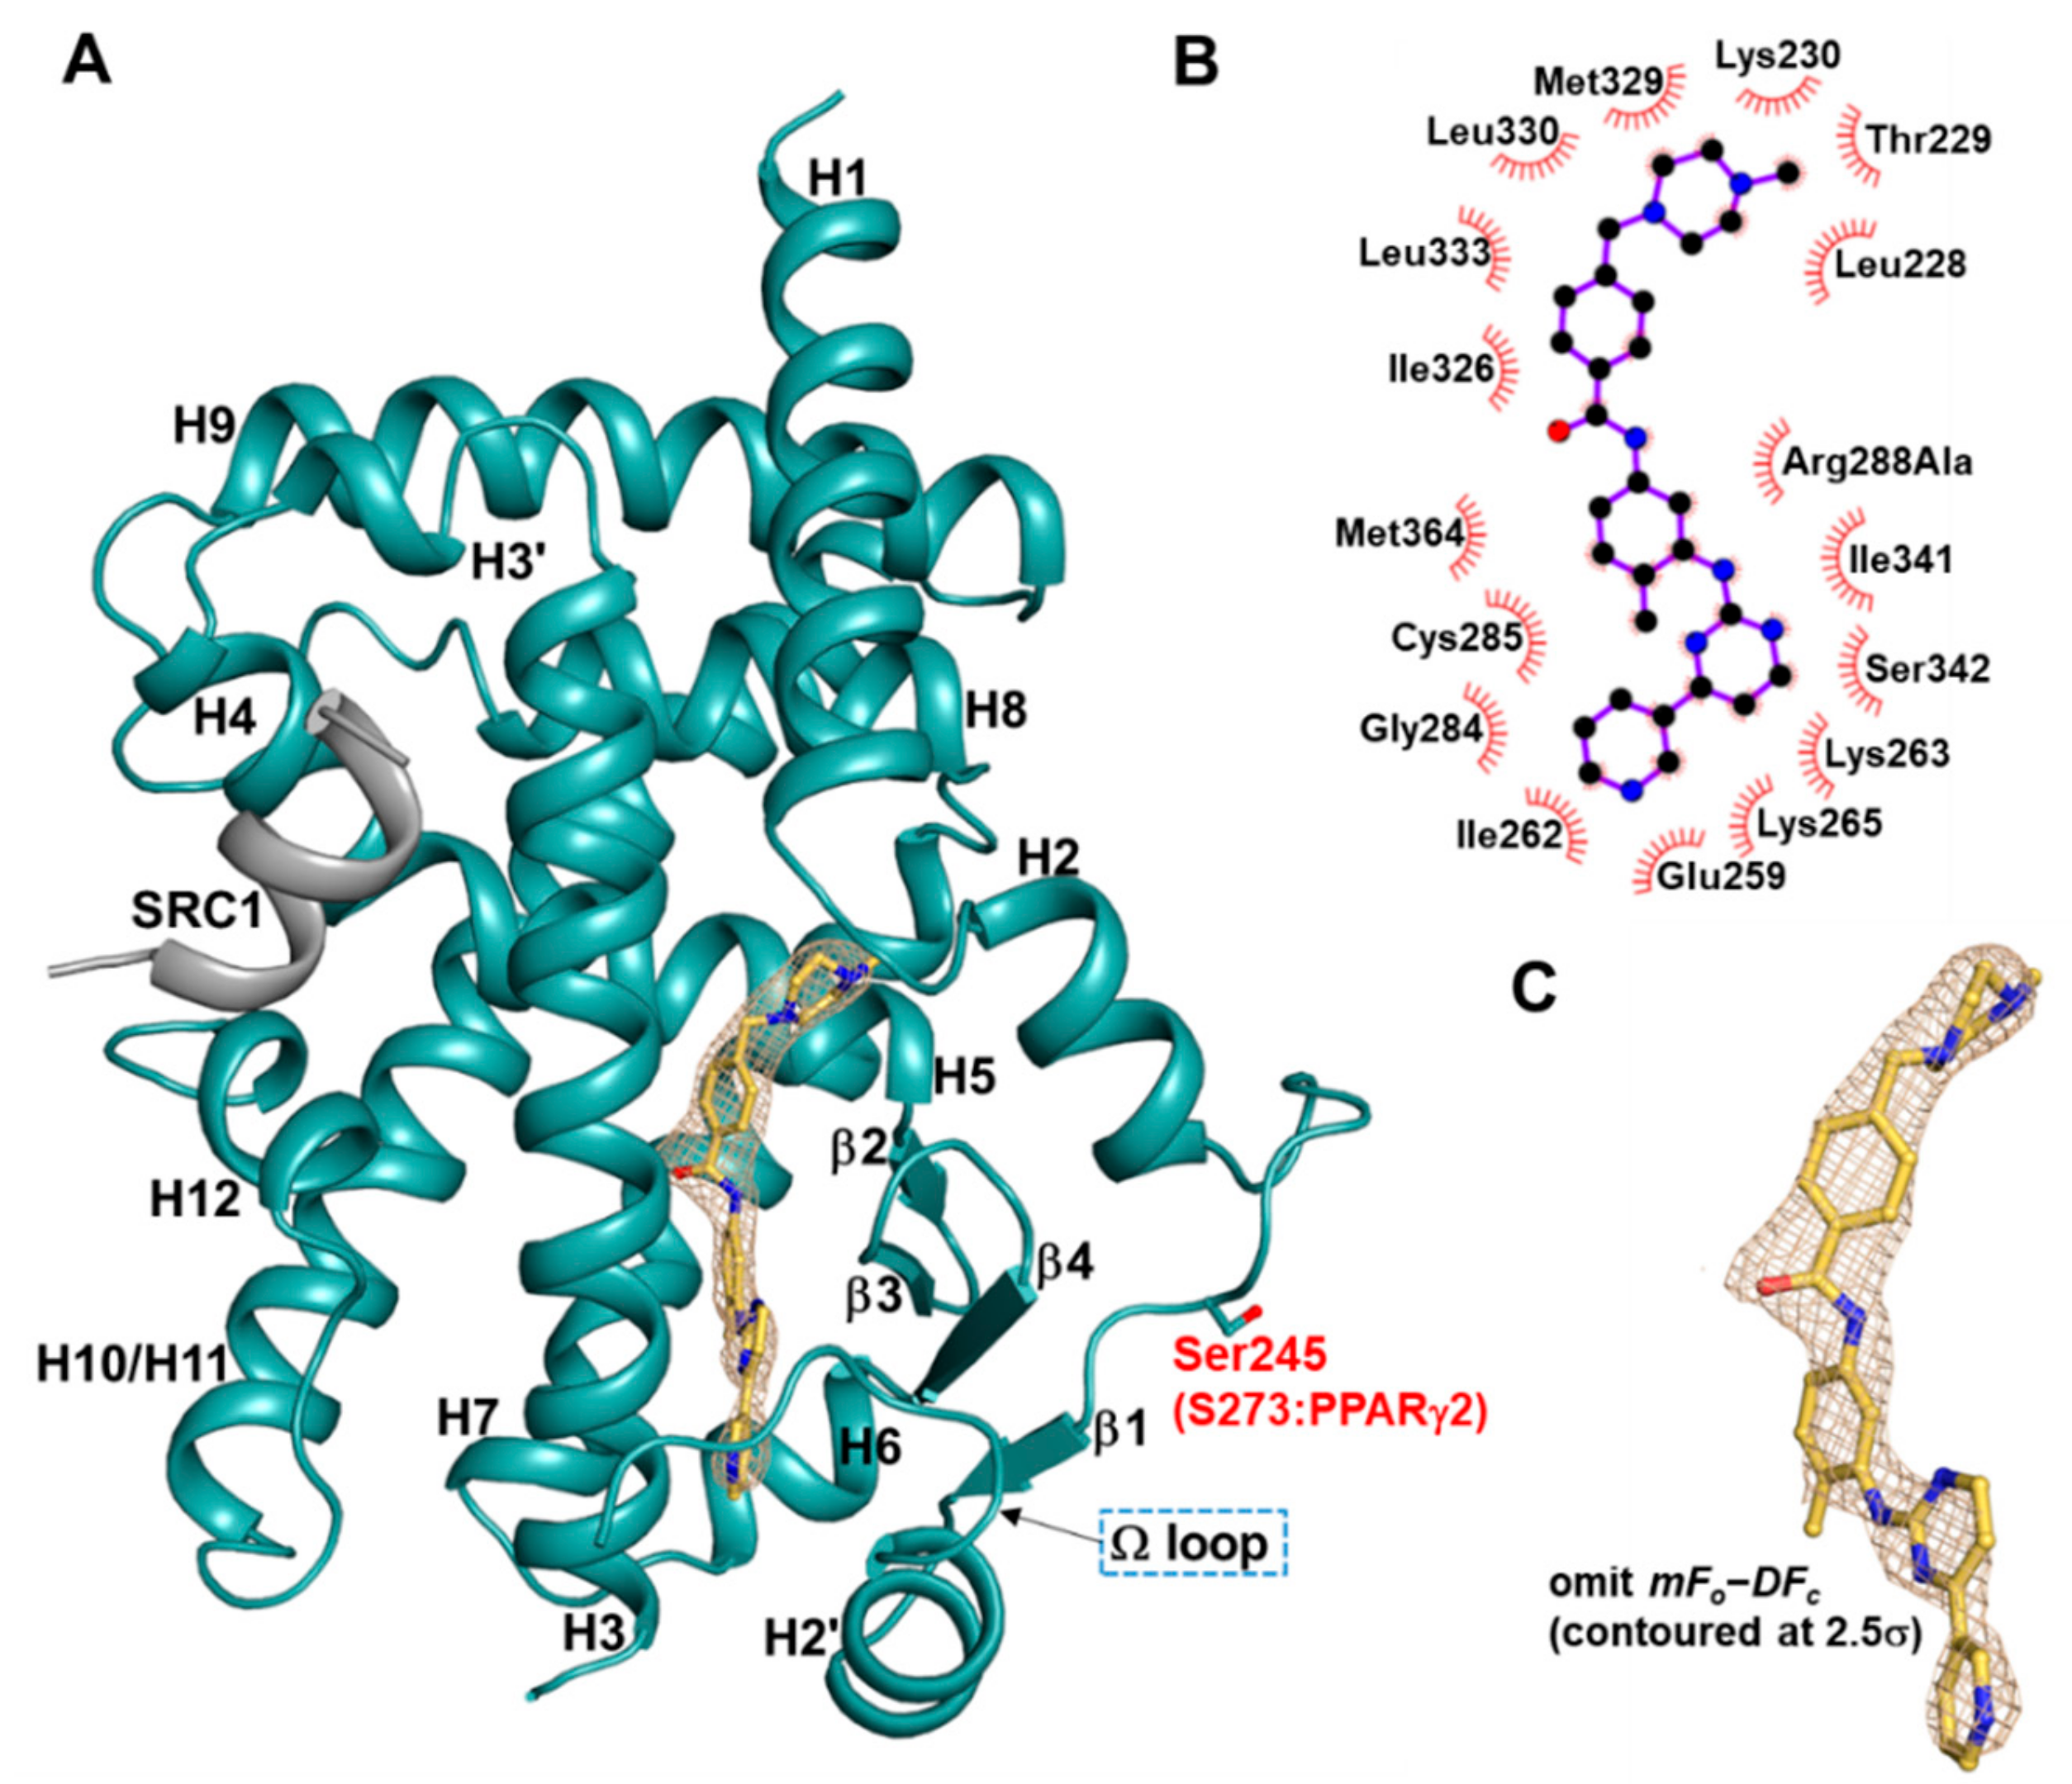
2.1. Overall Structure of Imatinib-Bound PPARγ R288A Mutant LBD
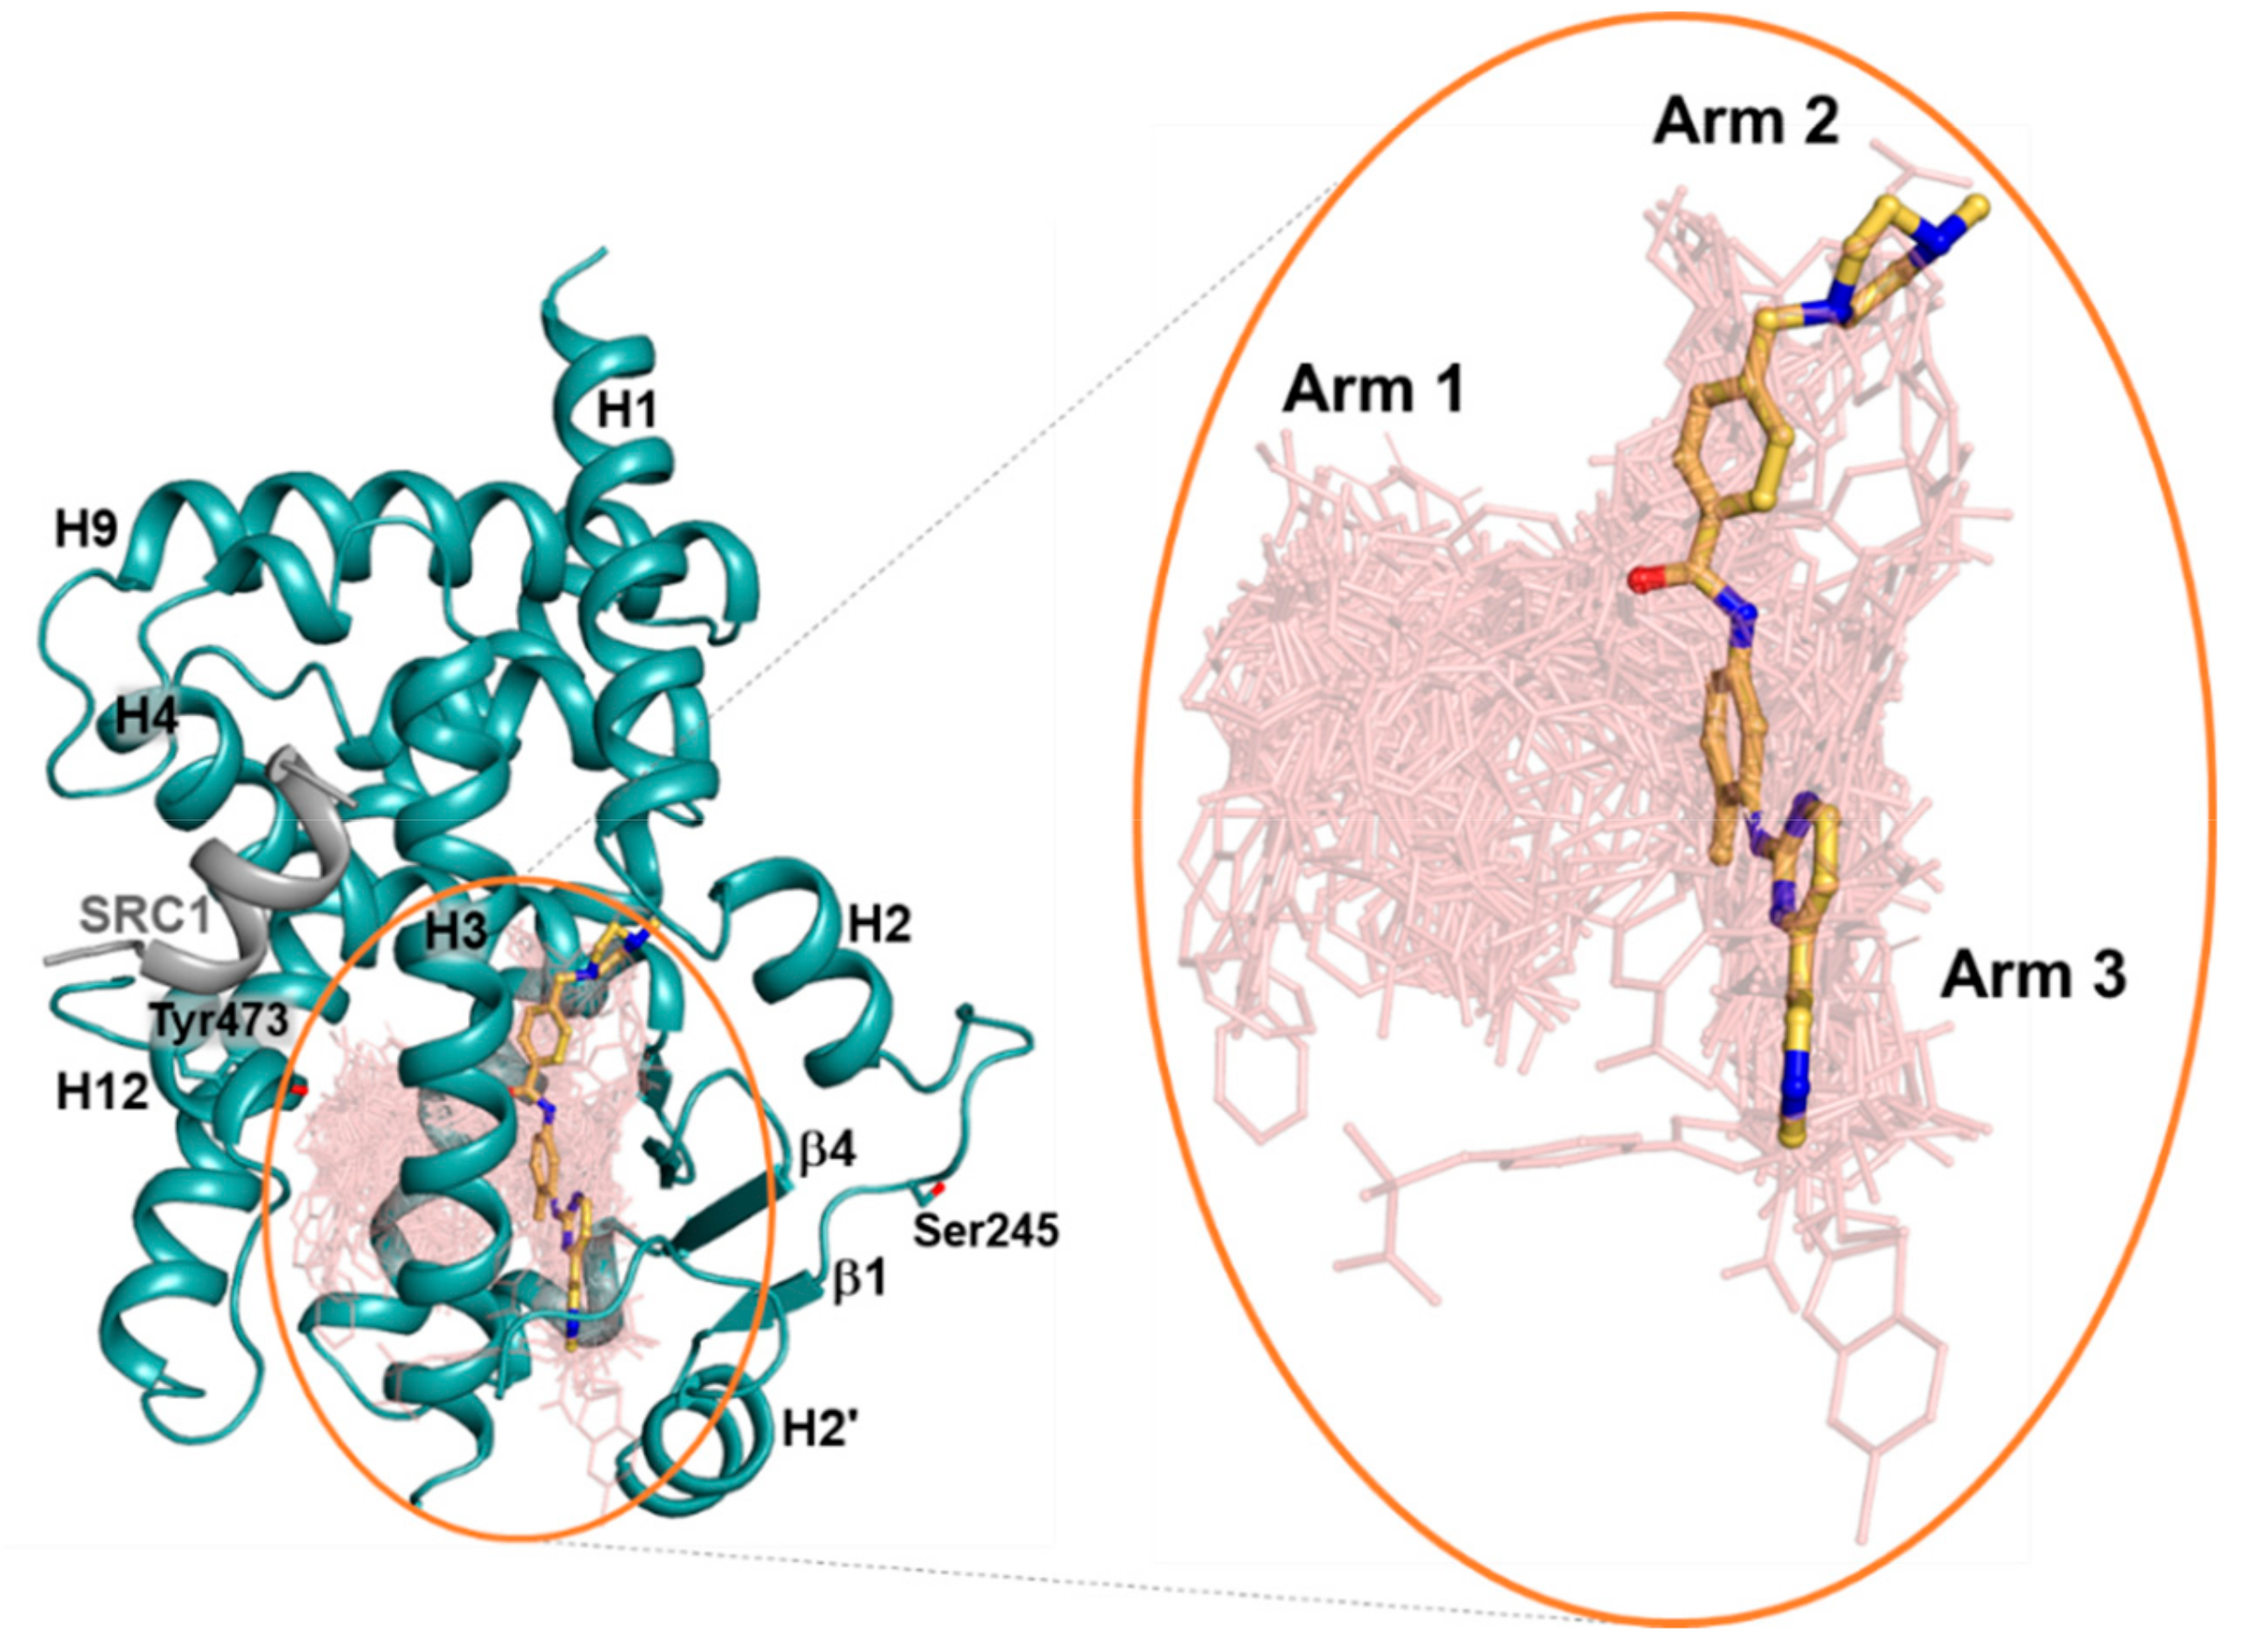
2.2. Imatinib Occupies Arm2 and Arm3 Regions in PPARγ R288A Mutant LBD
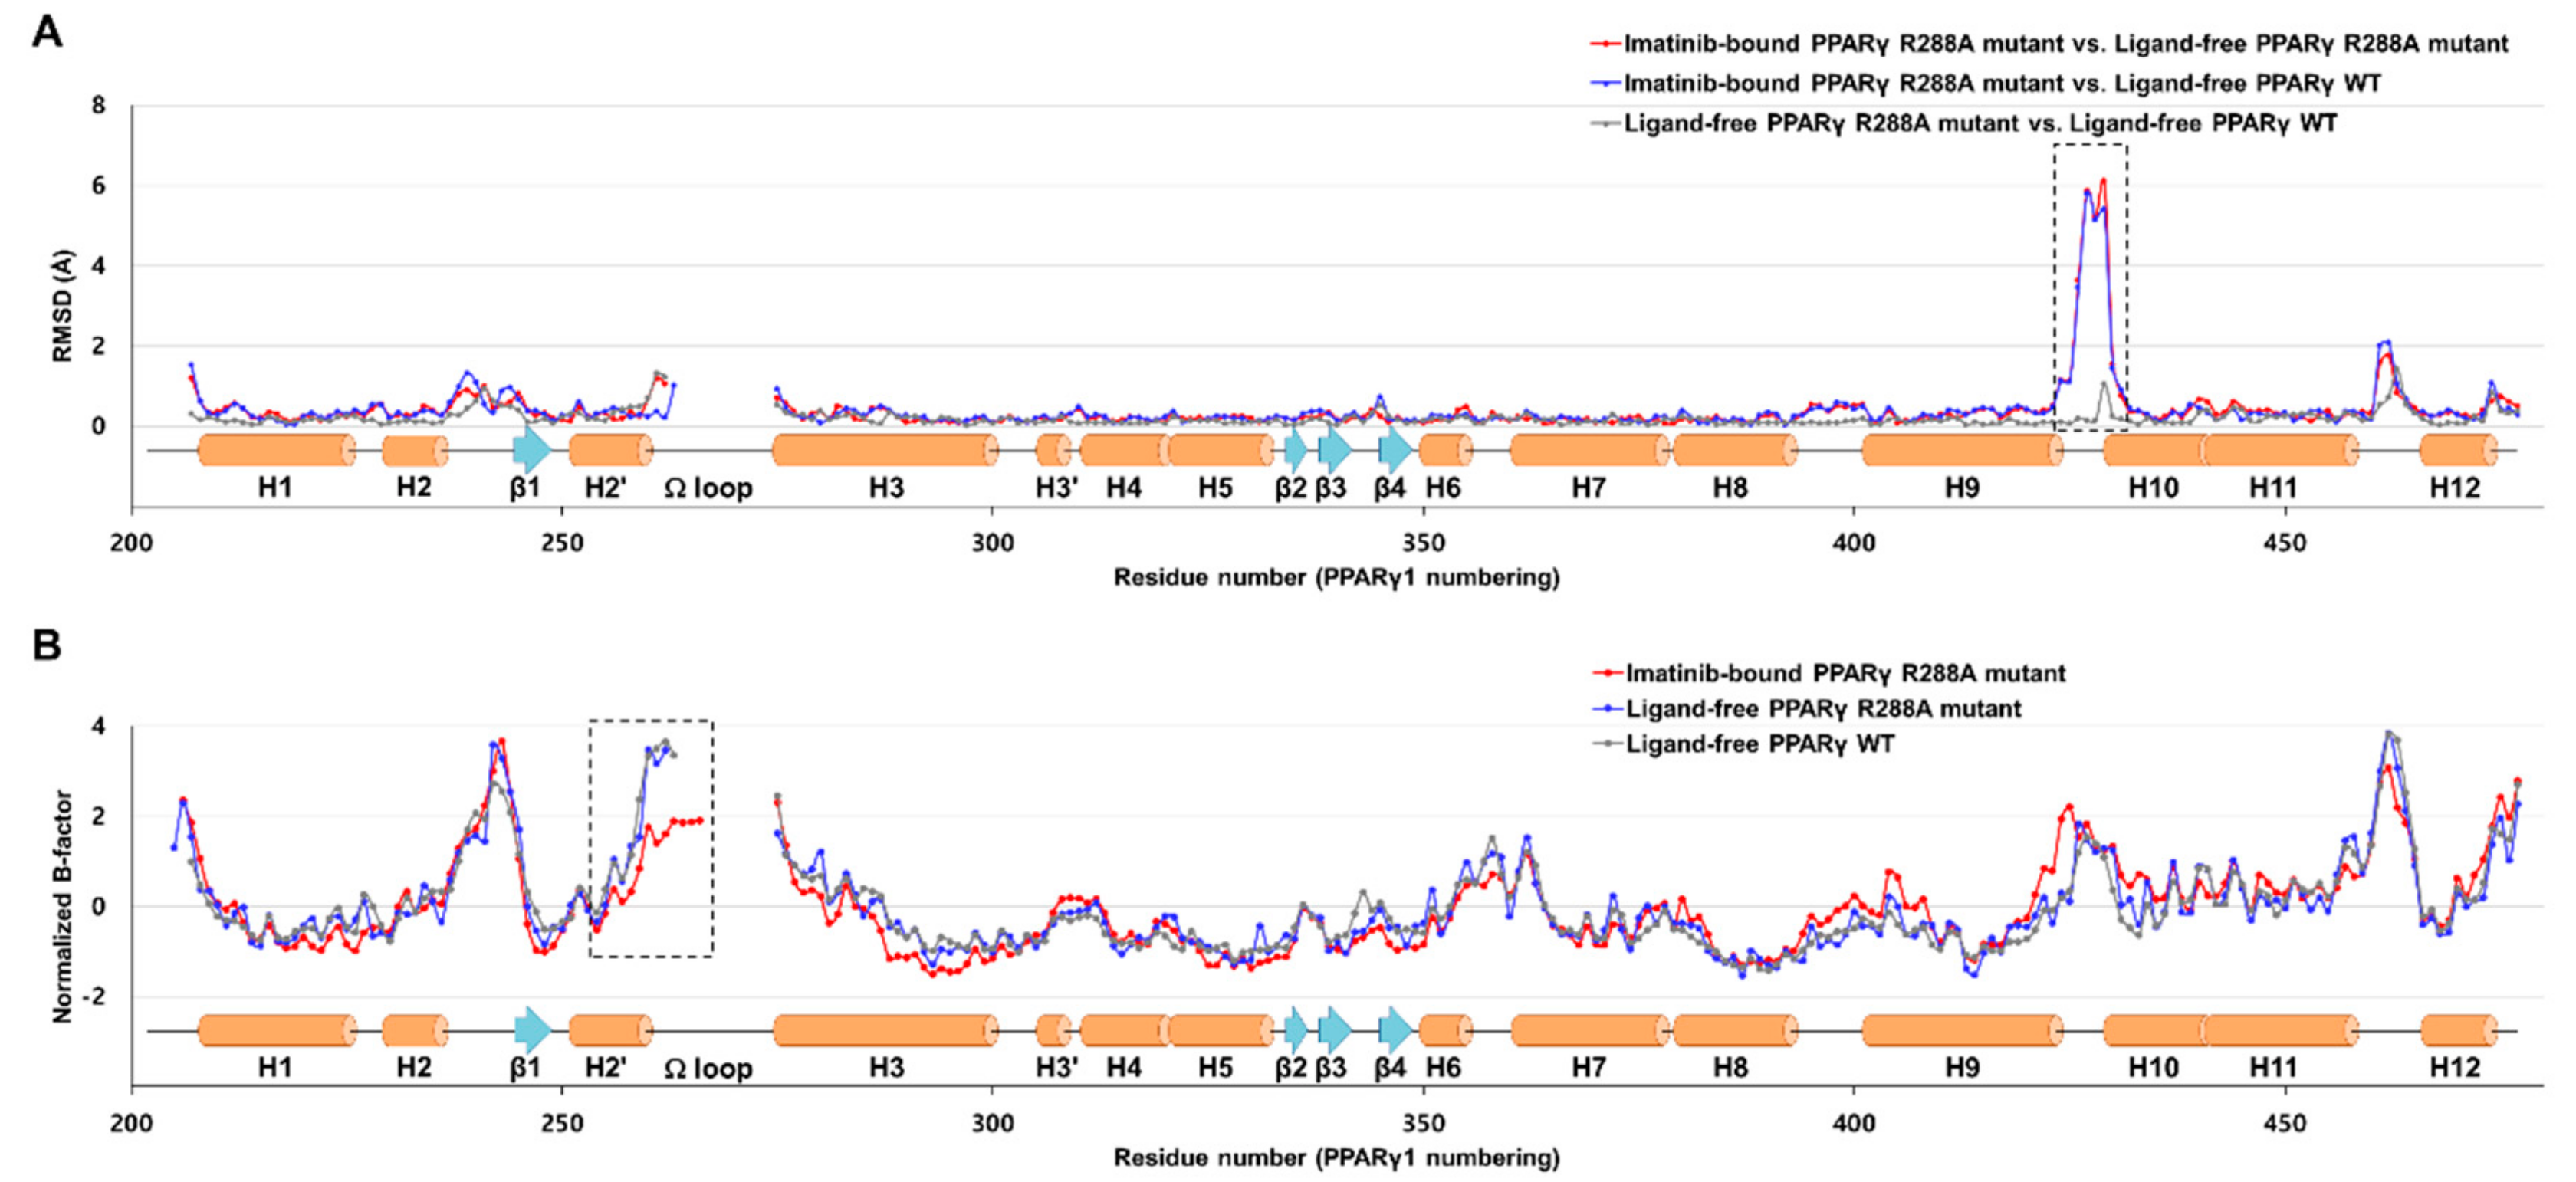
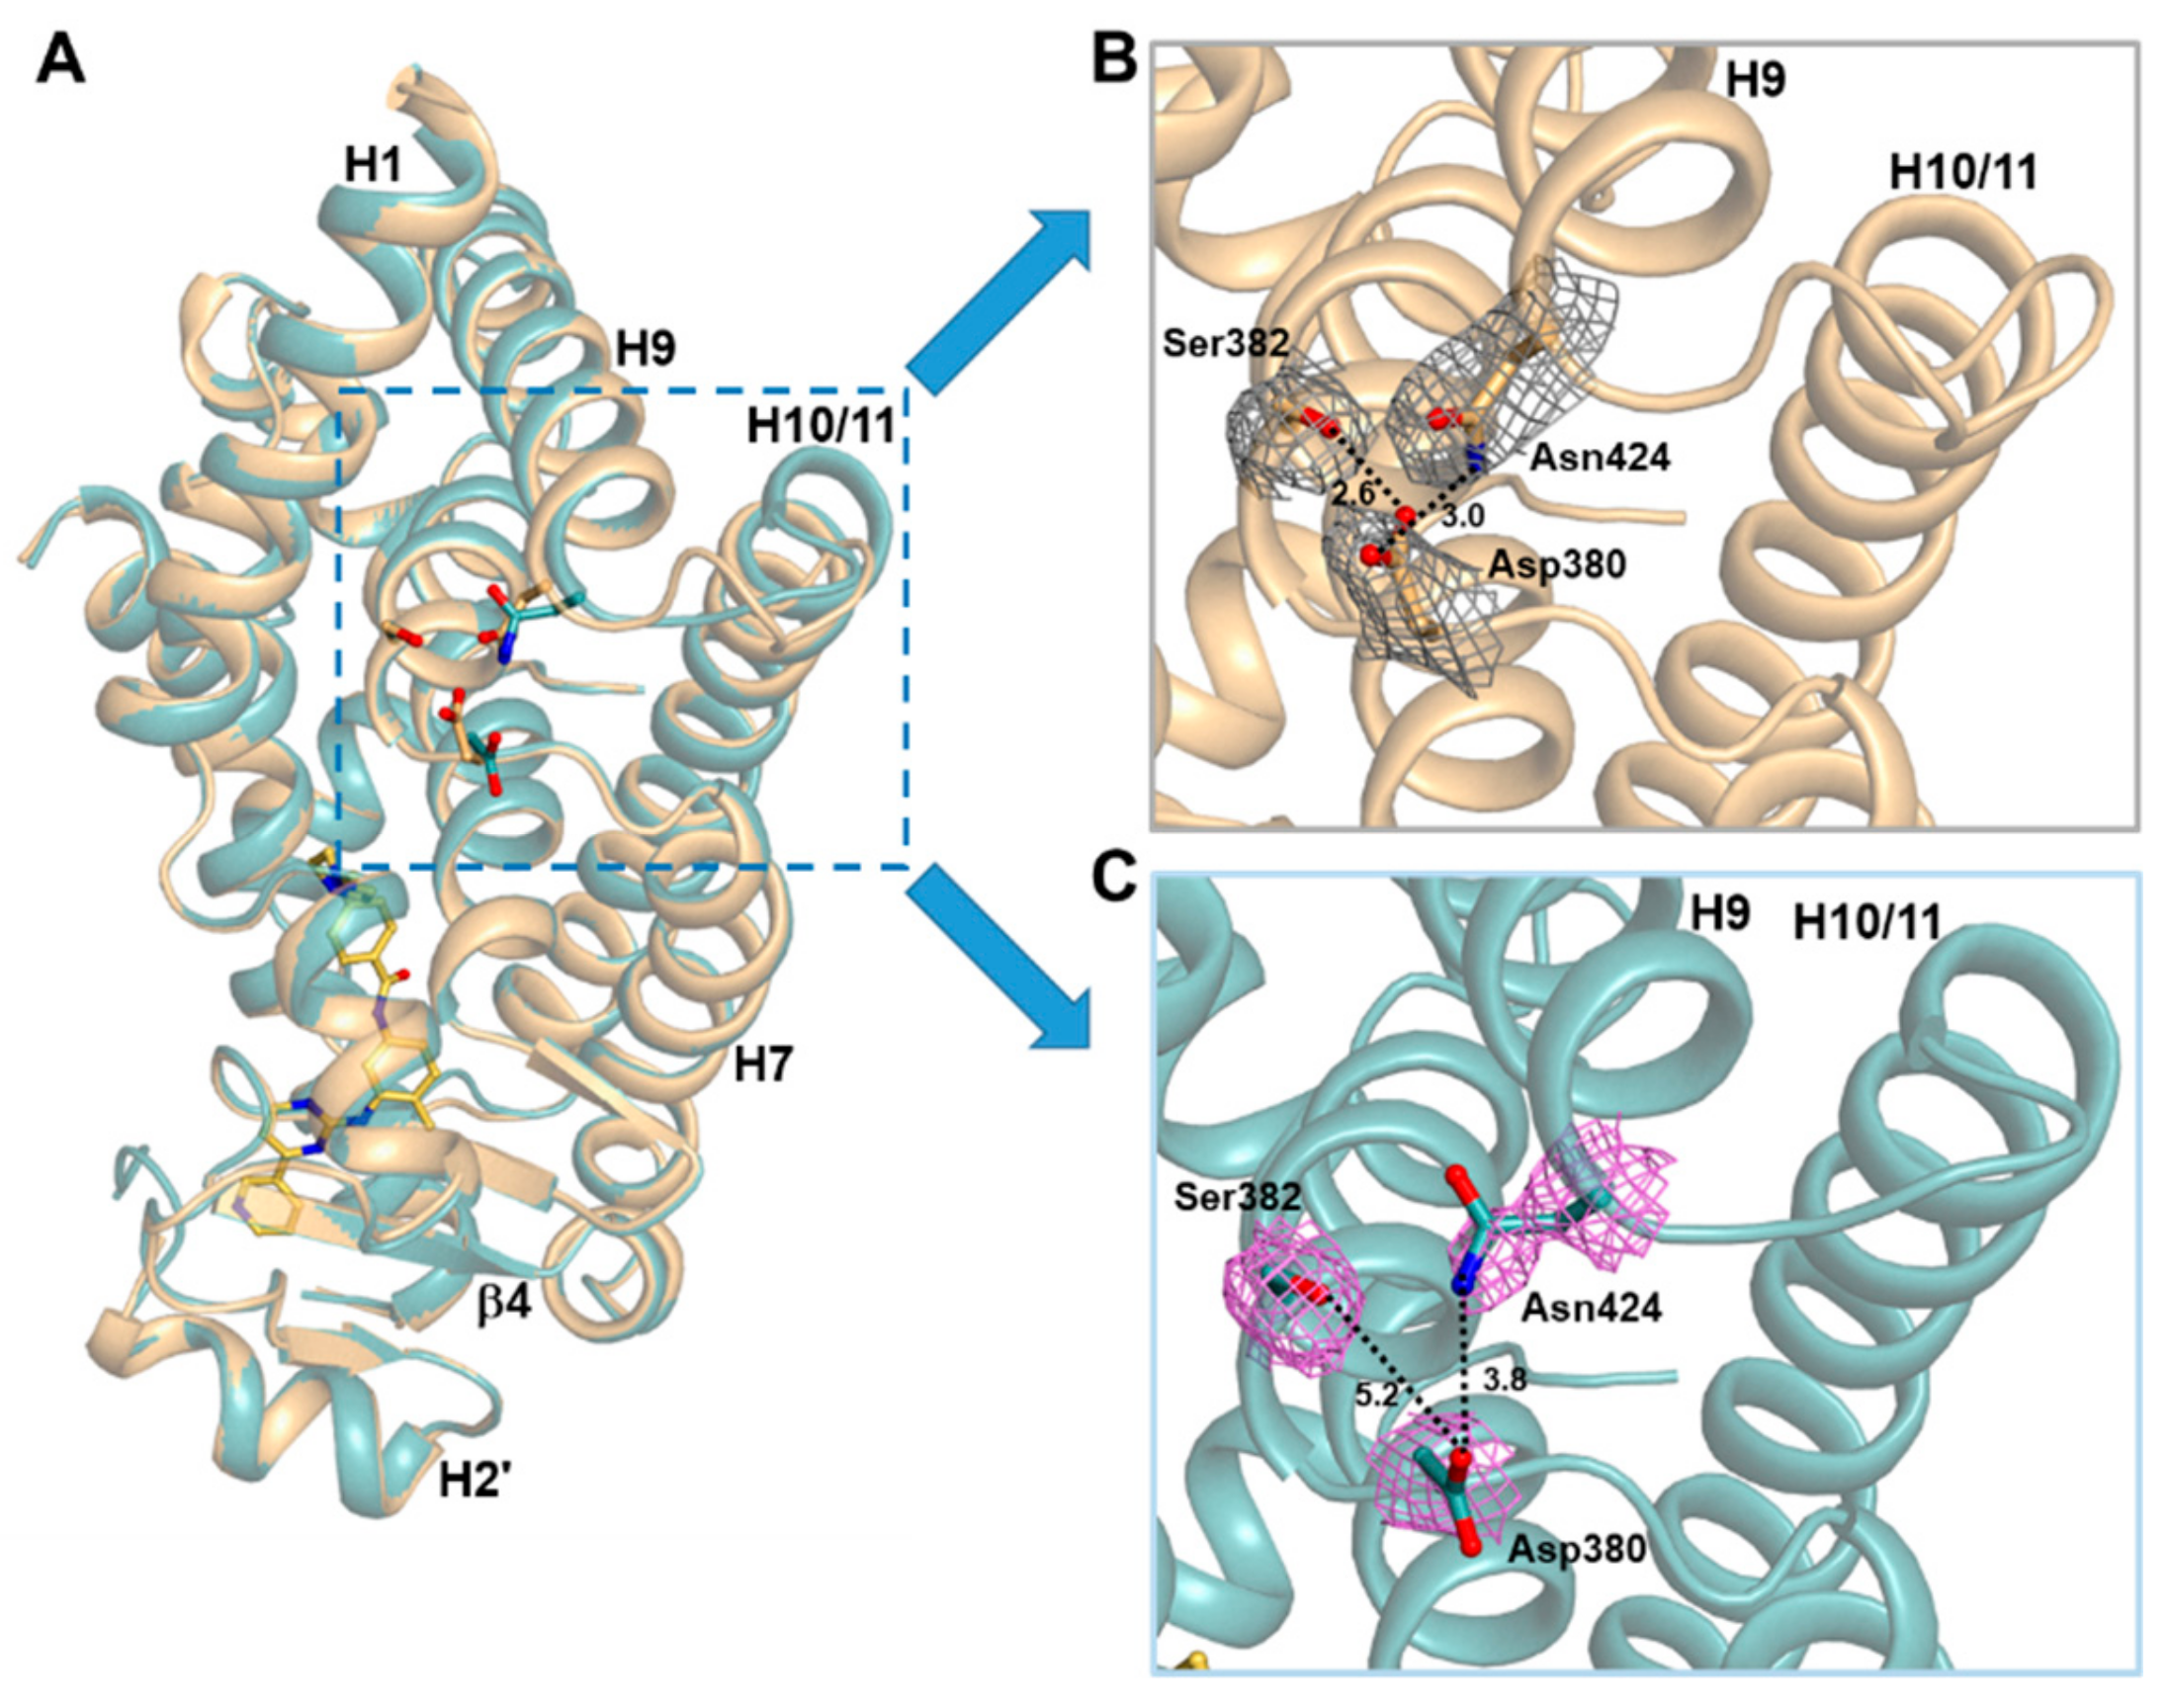
2.3. Imatinib Binding Induced Conformational Change of H9-H10 Loop
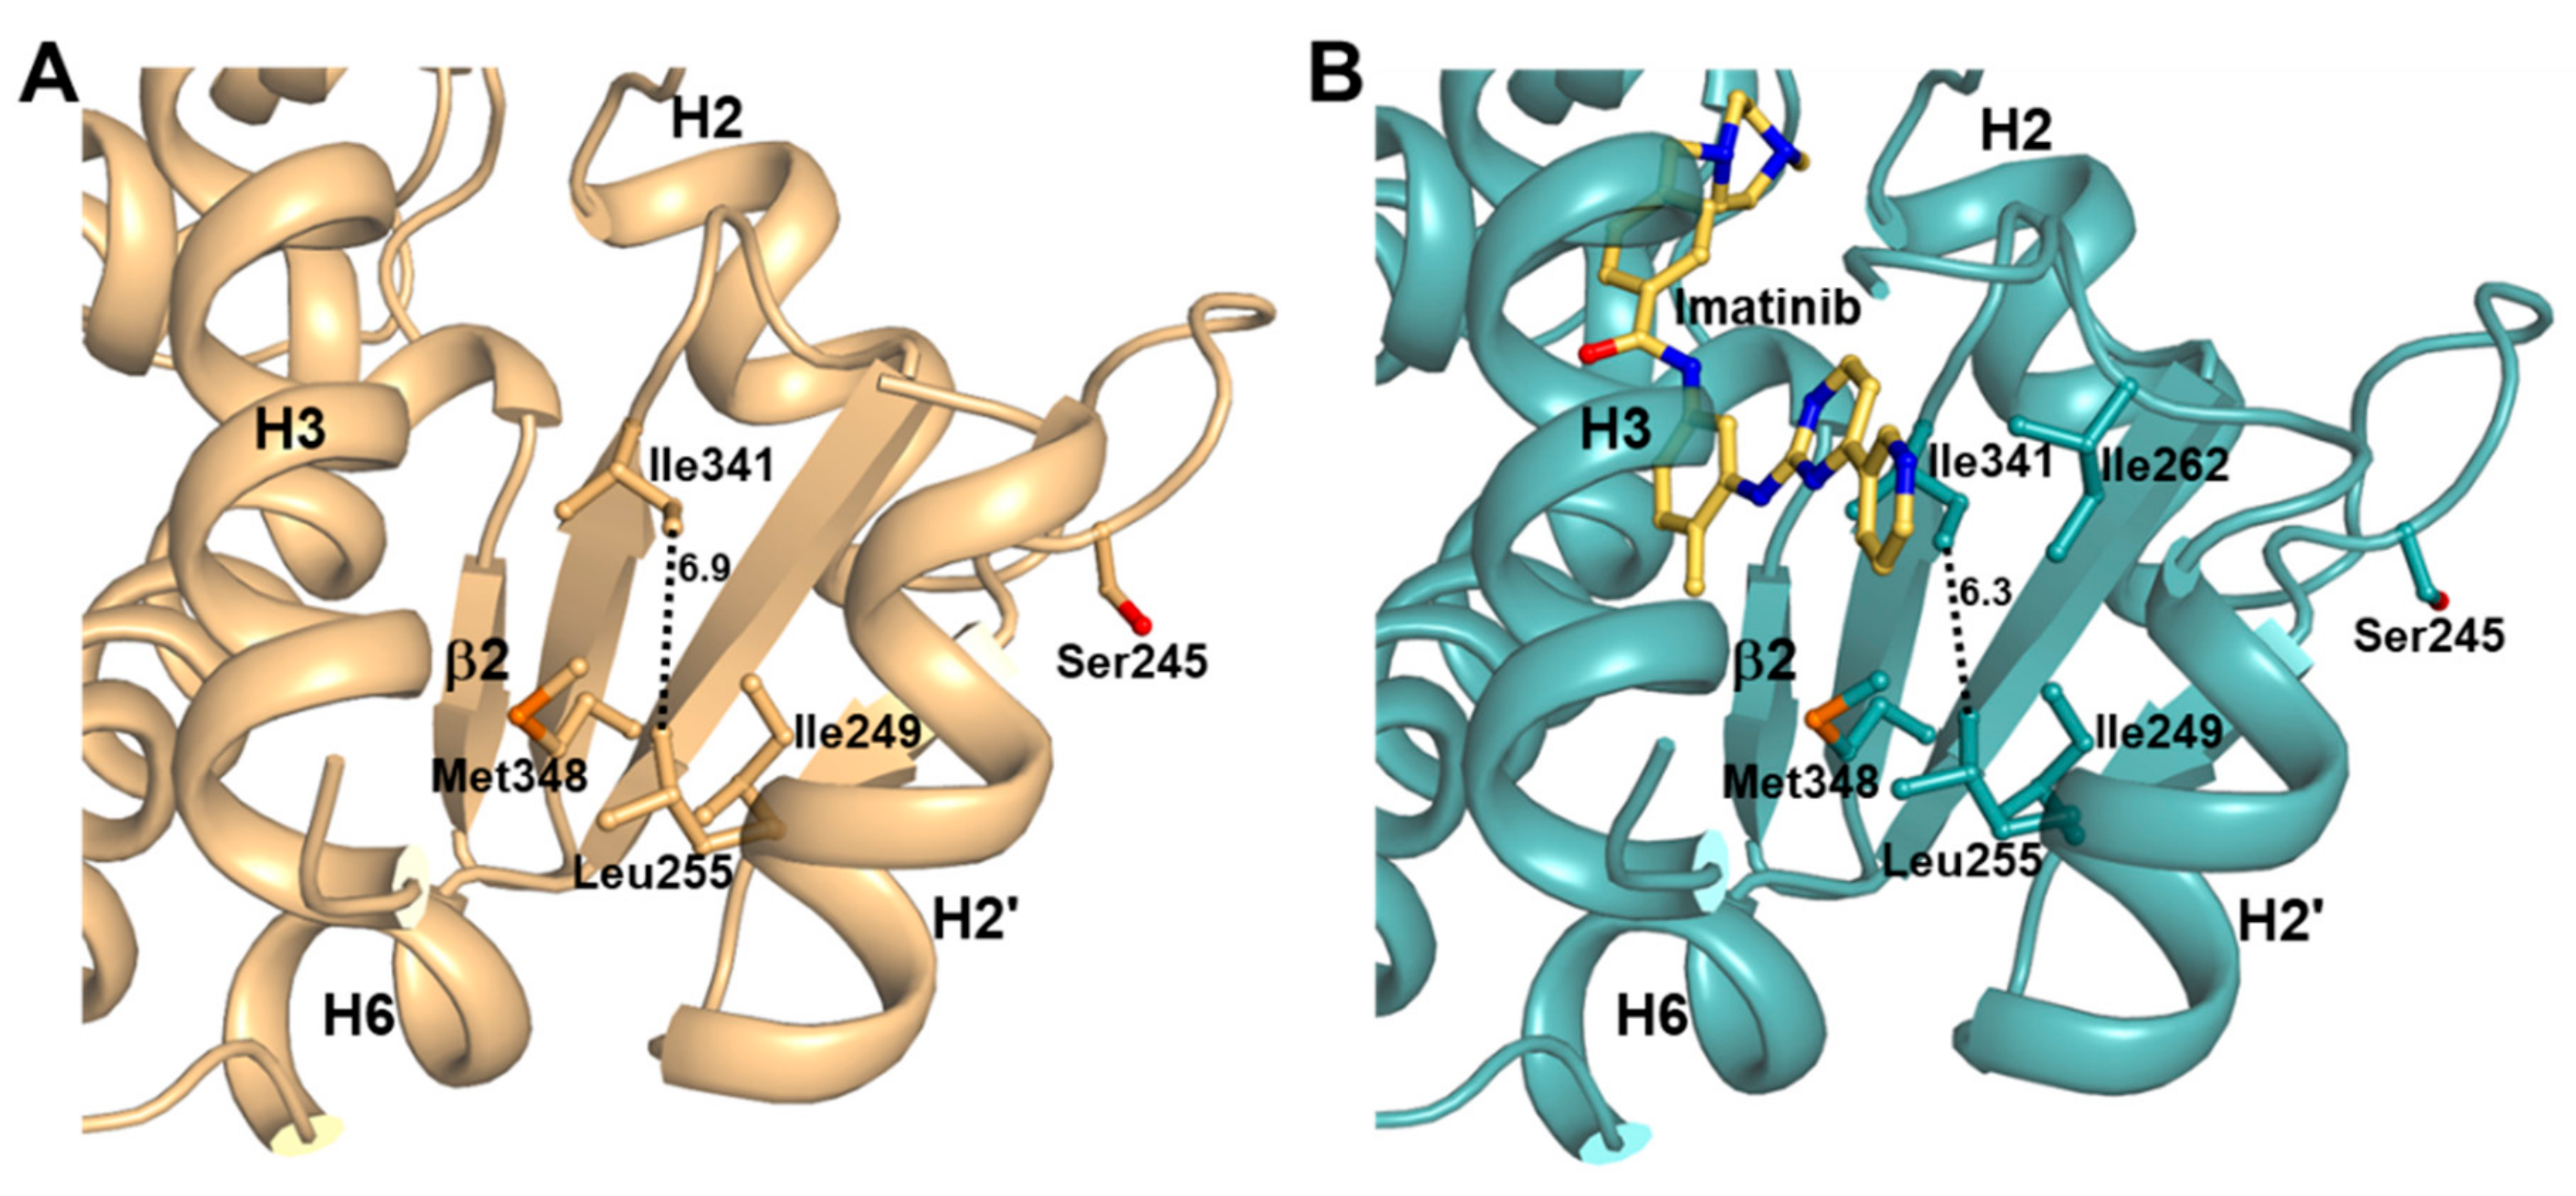
2.4. Imatinib Binding in PPARγ LBD Stabilizes Helix H2′ and Ω Loop
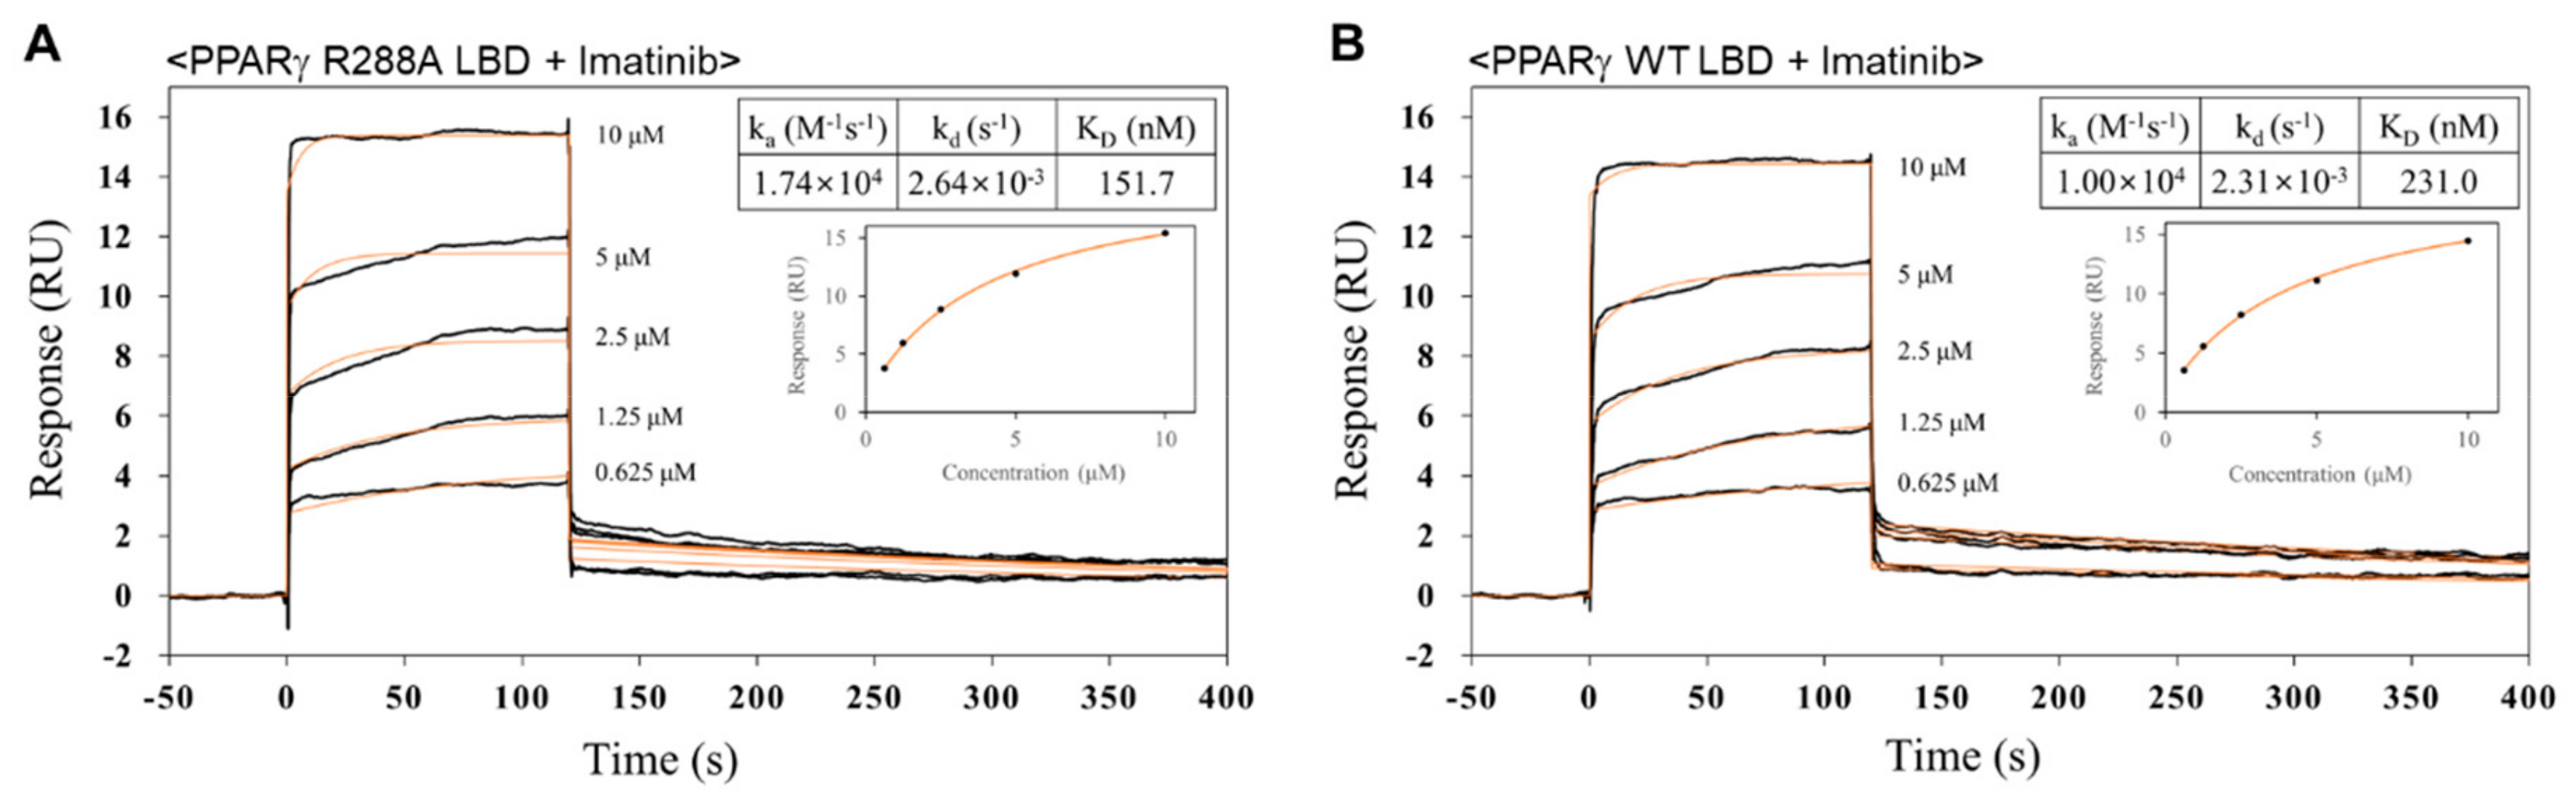
2.5. Imatinib has Higher Binding Affinity for PPARγ R288A Mutant LBD than PPARγ WT LBD
3. Discussion
4. Materials and Methods
4.1. Cloning, Expression, and Mutagenesis
4.2. Purification
4.3. Crystallization
4.4. X-ray Data Collection
4.5. Structure Determination and Refinement
4.6. Surface Plasmon Resonance
4.7. Accession Codes
Supplementary Materials
Author Contributions
Funding
Acknowledgments
Conflicts of Interest
References
- Gallastegui, N.; Mackinnon, J.A.G.; Fletterick, R.J.; Estebanez-Perpina, E. Advances in our structural understanding of orphan nuclear receptors. Trends Biochem. Sci. 2015, 40, 25–35. [Google Scholar] [CrossRef] [PubMed]
- Berger, J.; Moller, D.E. The mechanisms of action of PPARs. Annu. Rev. Med. 2002, 53, 409–435. [Google Scholar] [CrossRef] [PubMed]
- Fajas, L.; Auboeuf, D.; Raspe, E.; Schoonjans, K.; Lefebvre, A.M.; Saladin, R.; Najib, J.; Laville, M.; Fruchart, J.C.; Deeb, S.; et al. The organization, promoter analysis, and expression of the human PPAR gamma gene. J. Biol. Chem. 1997, 272, 18779–18789. [Google Scholar] [CrossRef] [PubMed]
- Ricote, M.; Huang, J.; Fajas, L.; Li, A.; Welch, J.; Najib, J.; Witztum, J.L.; Auwerx, J.; Palinski, W.; Glass, C.K. Expression of the peroxisome proliferator-activated receptor gamma (PPAR gamma) in human atherosclerosis and regulation in macrophages by colony stimulating factors and oxidized low density lipoprotein. Proc. Natl. Acad. Sci. USA 1998, 95, 7614–7619. [Google Scholar] [CrossRef] [PubMed]
- Lehrke, M.; Lazar, M.A. The many faces of PPAR gamma. Cell 2005, 123, 993–999. [Google Scholar] [CrossRef] [PubMed]
- Nolte, R.T.; Wisely, G.B.; Westin, S.; Cobb, J.E.; Lambert, M.H.; Kurokawa, R.; Rosenfeld, M.G.; Willson, T.M.; Glass, C.K.; Milburn, M.V. Ligand binding and co-activator assembly of the peroxisome proliferator-activated receptor-gamma. Nature 1998, 395, 137–143. [Google Scholar] [CrossRef] [PubMed]
- Itoh, T.; Fairall, L.; Amin, K.; Inaba, Y.; Szanto, A.; Balint, B.L.; Nagy, L.; Yamamoto, K.; Schwabe, J.W.R. Structural basis for the activation of PPAR gamma by oxidized fatty acids. Nat. Struct. Mol. Biol. 2008, 15, 924–931. [Google Scholar] [CrossRef]
- Jang, J.Y.; Bae, H.; Lee, Y.J.; Il Choi, Y.; Kim, H.J.; Park, S.B.; Suh, S.W.; Kim, S.W.; Han, B.W. Structural Basis for the Enhanced Anti-Diabetic Efficacy of Lobeglitazone on PPAR gamma. Sci. Rep. 2018, 8, 31. [Google Scholar] [CrossRef]
- Berger, J.P.; Akiyama, T.E.; Meinke, P.T. PPARs: Therapeutic targets for metabolic disease. Trends Pharmacol. Sci. 2005, 26, 244–251. [Google Scholar] [CrossRef]
- Nissen, S.E.; Wolski, K. Effect of rosiglitazone on the risk of myocardial infarction and death from cardiovascular causes. N. Engl. J. Med. 2007, 356, 2457–2471. [Google Scholar] [CrossRef]
- Bruning, J.B.; Chalmers, M.J.; Prasad, S.; Busby, S.A.; Karnenecka, T.M.; He, Y.J.; Nettles, K.W.; Griffin, P.R. Partial agonists activate PPAR gamma using a helix 12 independent mechanism. Structure 2007, 15, 1258–1271. [Google Scholar] [CrossRef] [PubMed]
- Hughes, T.S.; Chalmers, M.J.; Novick, S.; Kuruvilla, D.S.; Chang, M.R.; Kamenecka, T.M.; Rance, M.; Johnson, B.A.; Burris, T.P.; Griffin, P.R.; et al. Ligand and receptor dynamics contribute to the mechanism of graded PPARgamma agonism. Structure 2012, 20, 139–150. [Google Scholar] [CrossRef] [PubMed]
- Christensen, L.P.; El-Houri, R.B. Development of an In Vitro Screening Platform for the Identification of Partial PPAR gamma Agonists as a Source for Antidiabetic Lead Compounds. Molecules 2018, 23, 2431. [Google Scholar] [CrossRef] [PubMed]
- Choi, J.H.; Banks, A.S.; Estall, J.L.; Kajimura, S.; Bostrom, P.; Laznik, D.; Ruas, J.L.; Chalmers, M.J.; Kamenecka, T.M.; Bluher, M.; et al. Anti-diabetic drugs inhibit obesity-linked phosphorylation of PPAR gamma by Cdk5. Nature 2010, 466, 451. [Google Scholar] [CrossRef] [PubMed]
- Hughes, T.S.; Giri, P.K.; de Vera, I.M.S.; Marciano, D.P.; Kuruvilla, D.S.; Shin, Y.; Blayo, A.L.; Kamenecka, T.M.; Burris, T.P.; Griffin, P.R.; et al. An alternate binding site for PPAR gamma ligands. Nat. Commun. 2014, 5, 3571. [Google Scholar] [CrossRef] [PubMed]
- Bae, H.; Jang, J.Y.; Choi, S.S.; Lee, J.J.; Kim, H.; Jo, A.; Lee, K.J.; Choi, J.H.; Suh, S.W.; Park, S.B. Mechanistic elucidation guided by covalent inhibitors for the development of anti-diabetic PPAR gamma ligands. Chem. Sci. 2016, 7, 5523–5529. [Google Scholar] [CrossRef]
- Druker, B.J.; Tamura, S.; Buchdunger, E.; Ohno, S.; Segal, G.M.; Fanning, S.; Zimmermann, J.; Lydon, N.B. Effects of a selective inhibitor of the Abl tyrosine kinase on the growth of Bcr-Abl positive cells. Nat. Med. 1996, 2, 561–566. [Google Scholar] [CrossRef]
- Duensing, A.; Medeiros, F.; McConarty, B.; Joseph, N.E.; Panigrahy, D.; Singer, S.; Fletcher, C.D.M.; Demetri, G.D.; Fletcher, J.A. Mechanisms of oncogenic KIT signal transduction in primary gastrointestinal stromal tumors (GISTs). Oncogene 2004, 23, 3999–4006. [Google Scholar] [CrossRef]
- Pardanani, A.; Reeder, T.; Porrata, L.F.; Li, C.Y.; Tazelaar, H.D.; Baxter, E.J.; Witzig, T.E.; Cross, N.C.P.; Tefferi, A. Imatinib therapy for hypereosinophilic syndrome and other eosinophilic disorders. Blood 2003, 101, 3391–3397. [Google Scholar] [CrossRef]
- Druker, B.J.; Lydon, N.B. Lessons learned from the development of an Abl tyrosine kinase inhibitor for chronic myelogenous leukemia. J. Clin. Investig. 2000, 105, 3–7. [Google Scholar] [CrossRef]
- Choi, S.S.; Kim, E.S.; Jung, J.E.; Marciano, D.P.; Jo, A.; Koo, J.Y.; Choi, S.Y.; Yang, Y.R.; Jang, H.J.; Kim, E.K.; et al. PPAR gamma Antagonist Gleevec Improves Insulin Sensitivity and Promotes the Browning of White Adipose Tissue. Diabetes 2016, 65, 829–839. [Google Scholar] [CrossRef] [PubMed]
- Sarraf, P.; Mueller, E.; Smith, W.M.; Wright, H.M.; Kum, J.B.; Aaltonen, L.A.; de la Chapelle, A.; Spiegelman, B.M.; Eng, C. Loss-of-function mutations in PPAR gamma associated with human colon cancer. Mol. Cell 1999, 3, 799–804. [Google Scholar] [CrossRef]
- Laskowski, R.A.; Swindells, M.B. LigPlot+: Multiple Ligand-Protein Interaction Diagrams for Drug Discovery. J. Chem. Inf. Model. 2011, 51, 2778–2786. [Google Scholar] [CrossRef] [PubMed]
- Nagar, B.; Bornmann, W.G.; Pellicena, P.; Schindler, T.; Veach, D.R.; Miller, W.T.; Clarkson, B.; Kuriyan, J. Crystal structures of the kinase domain of c-Abl in complex with the small molecule inhibitors PD173955 and imatinib (STI-571). Cancer Res. 2002, 62, 4236–4243. [Google Scholar] [PubMed]
- Atwell, S.; Adams, J.M.; Badger, J.; Buchanan, M.D.; Feil, I.K.; Froning, K.J.; Gao, X.; Hendle, J.; Keegan, K.; Leon, B.C.; et al. A novel mode of Gleevec binding is revealed by the structure of spleen tyrosine kinase. J. Biol. Chem. 2004, 279, 55827–55832. [Google Scholar] [CrossRef] [PubMed]
- Carugo, O.; Argos, P. Accessibility to internal cavities and ligand binding sites monitored by protein crystallographic thermal factors. Proteins 1998, 31, 201–213. [Google Scholar] [CrossRef]
- Lehmann, J.M.; Moore, L.B.; Smitholiver, T.A.; Wilkison, W.O.; Willson, T.M.; Kliewer, S.A. An Antidiabetic Thiazolidinedione Is a High-Affinity Ligand for Peroxisome Proliferator-Activated Receptor Gamma(Ppar-Gamma). J. Biol. Chem. 1995, 270, 12953–12956. [Google Scholar] [CrossRef]
- Choi, J.H.; Banks, A.S.; Kamenecka, T.M.; Busby, S.A.; Chalmers, M.J.; Kumar, N.; Kuruvilla, D.S.; Shin, Y.S.; He, Y.J.; Bruning, J.B.; et al. Antidiabetic actions of a non-agonist PPAR gamma ligand blocking Cdk5-mediated phosphorylation. Nature 2011, 477, 477. [Google Scholar] [CrossRef]
- Jang, J.Y.; Koh, M.; Bae, H.; An, D.R.; Im, H.N.; Kim, H.S.; Yoon, J.Y.; Yoon, H.J.; Han, B.W.; Park, S.B.; et al. Structural basis for differential activities of enantiomeric PPAR gamma agonists: Binding of S35 to the alternate site. Biochim. Biophys. Acta (BBA) Proteins Proteom. 2017, 1865, 674–681. [Google Scholar] [CrossRef]
- Ashburn, T.T.; Thor, K.B. Drug repositioning: Identifying and developing new uses for existing drugs. Nat. Rev. Drug Discov. 2004, 3, 673–683. [Google Scholar] [CrossRef]
- Ribeiro Filho, H.V.; Guerra, J.V.; Cagliari, R.; Batista, F.A.H.; Le Maire, A.; Oliveira, P.S.L.; Figueira, A.C.M. Exploring the mechanism of PPARγ phosphorylation mediated by CDK5. J. Struct. Biol. 2019, 207, 317–326. [Google Scholar] [CrossRef] [PubMed]
- Ostberg, T.; Svensson, S.; Selen, G.; Uppenberg, J.; Thor, M.; Sundbom, M.; Sydow-Backman, M.; Gustavsson, A.L.; Jendeberg, L. A new class of peroxisome proliferator-activated receptor agonists with a novel binding epitope shows antidiabetic effects. J. Biol. Chem. 2004, 279, 41124–41130. [Google Scholar] [CrossRef] [PubMed]
- Weidner, C.; de Groot, J.C.; Prasad, A.; Freiwald, A.; Quedenau, C.; Kliem, M.; Witzke, A.; Kodelja, V.; Han, C.T.; Giegold, S.; et al. Amorfrutins are potent antidiabetic dietary natural products. Proc. Natl. Acad. Sci. USA 2012, 109, 7257–7262. [Google Scholar] [CrossRef] [PubMed]
- Chandra, V.; Huang, P.X.; Hamuro, Y.; Raghuram, S.; Wang, Y.J.; Burris, T.P.; Rastinejad, F. Structure of the intact PPAR-gamma-RXR-alpha nuclear receptor complex on DNA. Nature 2008, 456, 350. [Google Scholar] [CrossRef] [PubMed]
- Jang, J.Y.; Kim, H.; Kim, H.J.; Suh, S.W.; Park, S.B.; Han, B.W. Structural basis for the inhibitory effects of a novel reversible covalent ligand on PPAR gamma phosphorylation. Sci. Rep. 2019, 9, 11168. [Google Scholar] [CrossRef]
- Otwinowski, Z.; Minor, W. Processing of X-ray diffraction data collected in oscillation mode. Method Enzymol. 1997, 276, 307–326. [Google Scholar]
- Vagin, A.; Teplyakov, A. Molecular replacement with MOLREP. Acta Crystallogr. D 2010, 66, 22–25. [Google Scholar] [CrossRef]
- Emsley, P.; Lohkamp, B.; Scott, W.G.; Cowtan, K. Features and development of Coot. Acta Crystallogr. D 2010, 66, 486–501. [Google Scholar] [CrossRef]
- Murshudov, G.N.; Vagin, A.A.; Dodson, E.J. Refinement of macromolecular structures by the maximum-likelihood method. Acta Crystallogr. Sect. D Struct. Biol. 1997, 53, 240–255. [Google Scholar] [CrossRef]
- Brunger, A.T. Free R-Value—A Novel Statistical Quantity for Assessing the Accuracy of Crystal-Structures. Nature 1992, 355, 472–475. [Google Scholar] [CrossRef]
- Chen, V.B.; Arendall, W.B.; Headd, J.J.; Keedy, D.A.; Immormino, R.M.; Kapral, G.J.; Murray, L.W.; Richardson, J.S.; Richardson, D.C. MolProbity: All-atom structure validation for macromolecular crystallography. Acta Crystallogr. Sect. D Struct. Biol. 2010, 66, 12–21. [Google Scholar] [CrossRef] [PubMed]
Sample Availability: Samples of the compounds are not available from the authors. |


| Model Name | Imatinib-Bound (PDB ID: 6KTN) | Ligand-Free (PDB ID: 6KTM) |
|---|---|---|
| X-ray source | PF-NE3A | PLS-7A |
| X-ray wavelength (Å) | 1.00000 | 0.97933 |
| Space group | P21212 | P21212 |
| Unit cell parameters | ||
| a, b, c (Å) | 130.93, 52.78, 53.44 | 131.47, 52.70, 53.67 |
| α = β = γ (°) | 90 | 90 |
| Resolution range (Å) | 50.0–2.75 (2.80–2.75) a | 50.0–2.70 (2.75–2.70) a |
| Total/unique reflections | 69,349/10,176 | 101,468/10,775 |
| Completeness (%) | 99.9 (99.6) a | 99.6 (100.0) a |
| <I/σI> | 30.1 (2.7) a | 41.1 (4.1) a |
| Rmergeb (%) | 5.9 (67.9) a | 7.9 (70.4) a |
| CC1/2 | 0.971 (0.860) a | 0.975 (0.875) a |
| Model Name | Imatinib-Bound | Ligand-Free |
|---|---|---|
| Resolution range (Å) | 30.0–2.75 | 30.0–2.70 |
| Rwork/Rfreea (%) | 22.1/25.6 | 21.7/25.8 |
| No. of nonhydrogen atoms | ||
| Protein | 2216 | 2174 |
| Ligand | 37 | - |
| Water oxygen | 30 | 20 |
| Average B factor (Å2) | ||
| Protein | 48.3 | 77.9 |
| Ligand | 56.1 | - |
| Water oxygen | 38.3 | 60.4 |
| R.m.s. deviations from ideal geometry | ||
| Bond lengths (Å) | 0.007 | 0.005 |
| Bond angles (°) | 1.39 | 1.31 |
| Ramachandran plot b | ||
| Favored/Outliers (%) | 93.3/0.0 | 98.5/0.0 |
| Poor rotamers b (%) | 0.00 | 0.00 |
© 2019 by the authors. Licensee MDPI, Basel, Switzerland. This article is an open access article distributed under the terms and conditions of the Creative Commons Attribution (CC BY) license (http://creativecommons.org/licenses/by/4.0/).
Share and Cite
Jang, J.Y.; Kim, H.-J.; Han, B.W. Structural Basis for the Regulation of PPARγ Activity by Imatinib. Molecules 2019, 24, 3562. https://doi.org/10.3390/molecules24193562
Jang JY, Kim H-J, Han BW. Structural Basis for the Regulation of PPARγ Activity by Imatinib. Molecules. 2019; 24(19):3562. https://doi.org/10.3390/molecules24193562
Chicago/Turabian StyleJang, Jun Young, Hyun-Jung Kim, and Byung Woo Han. 2019. "Structural Basis for the Regulation of PPARγ Activity by Imatinib" Molecules 24, no. 19: 3562. https://doi.org/10.3390/molecules24193562
APA StyleJang, J. Y., Kim, H.-J., & Han, B. W. (2019). Structural Basis for the Regulation of PPARγ Activity by Imatinib. Molecules, 24(19), 3562. https://doi.org/10.3390/molecules24193562