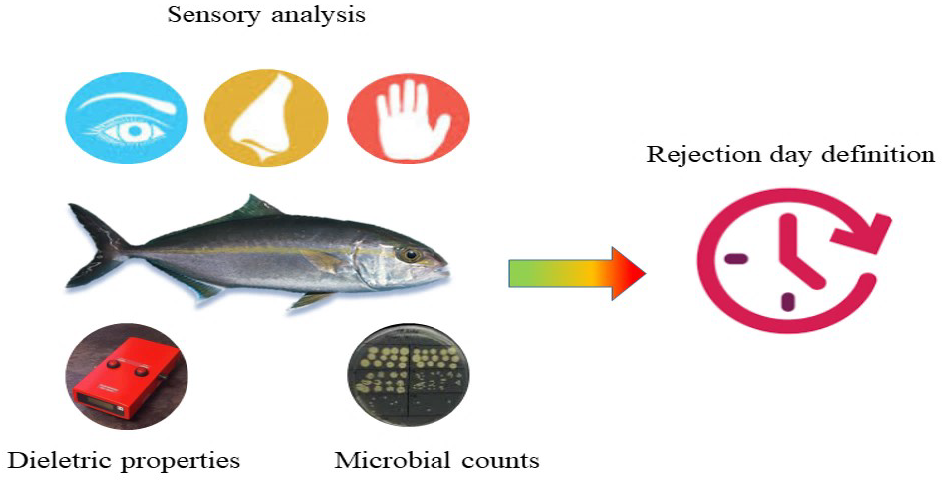
Freshness Assessment and Shelf-Life Prediction for Seriola dumerili from Aquaculture Based on the Quality Index Method


Abstract
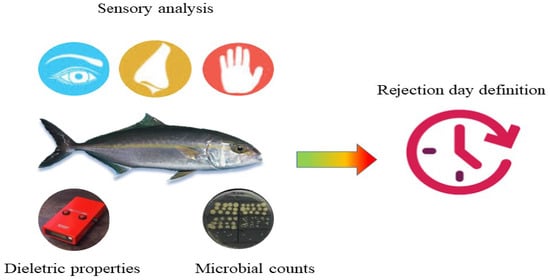
1. Introduction
2. Results and Discussion
2.1. QIM Development
2.2. Microbiological Analysis
2.3. Physical Evaluation
2.4. pH Analysis
2.5. TMA Analysis
2.5.1. HS-SPME–GC–MS Method Validation
2.5.2. Method Application for TMA Quantification in GrA
3. Materials and Methods
3.1. Samples
3.2. Sensory Analysis, QIM
3.3. Microbiological Analysis
3.4. Physical Evaluation
3.5. pH Measurement
3.6. TMA Analysis
3.6.1. HS-SPME Procedure
3.6.2. Method Validation
3.6.3. GC–MS Conditions.
3.7. Statistical Analysis
4. Conclusions
Author Contributions
Funding
Acknowledgments
Conflicts of Interest
References
- EATIP: The future of European Aquaculture. The Vision and Strategic Research & Innovation Agenda of the European Aquaculture Technology and Innovation Platform. Available online: eatip.eu (accessed on 16 June 2019).
- Lazo, O.; Guerrero, L.; Alexi, N.; Grigorakis, K.; Claret, A.; Pérez, J.A.; Bou, R. Sensory characterization, physico-chemical properties and somatic yields of five emerging fish species. Food Res. Int. 2017, 100, 396–406. [Google Scholar] [CrossRef]
- Sicuro, B.; Luzzana, U. The State of Seriola spp. Other Than Yellowtail (S. quinqueradiata) Farming in the World. Rev. Fish. Sci. Aquac. 2016, 24, 314–325. [Google Scholar] [CrossRef]
- Mylonas, C.C.; Papandroulakis, N.; Smboukis, A.; Papadaki, M.; Divanach, P. Induction of spawning of cultured greater amberjack (Seriola dumerili) using GnRHa implants. Aquaculture 2004, 237, 141–154. [Google Scholar] [CrossRef]
- Gonçalves, A.C. Quality and value in aquaculture. Sensory properties and useful shelf life of fish and bivalve. Ph.D. Thesis, Univerisity of Lisbon, Lisbon, Portugal, 2010. [Google Scholar]
- Martinsdóttir, E. Sensory quality management of fish. In Sensory Analysis for Food and Beverage Quality Control; Woodhead Publishing Limited: Cambridge, UK, 2010; pp. 293–315. ISBN 9781845694760. [Google Scholar]
- Bernardi, D.C.; Mársico, E.T.; de Freitas, M.Q. Quality index method (QIM) to assess the freshness and shelf life of fish. Brazilian Arch. Biol. Technol. 2013, 56, 587–598. [Google Scholar] [CrossRef]
- Hassoun, A.; Karoui, R. Quality evaluation of fish and other seafood by traditional and nondestructive instrumental methods: Advantages and limitations. Crit. Rev. Food Sci. Nutr. 2017, 57, 1976–1998. [Google Scholar] [CrossRef]
- Rehbein, H.; Oehlenschläger, J. Fishery Products: Quality, safety and authenticity; Willey-Blackwell: Hoboken, NJ, USA, 2009; ISBN 9781405141628. [Google Scholar]
- Cheng, J.-H.; Sun, D.-W.; Zeng, X.-A.; Liu, D. Recent Advances in Methods and Techniques for Freshness Quality Determination and Evaluation of Fish and Fish Fillets: A Review. Crit. Rev. Food Sci. Nutr. 2015, 55, 1012–1225. [Google Scholar] [CrossRef]
- Alasalvar, C.; Shalidi, F.; Miyaslita, K.; Wanasundara, U. Handbook of Seafood Quality, Safety and Health Applications; A John Wiley & Sons, Ltd.: Publication, UK, 2011; Volume 518, ISBN 978-1-4051-8070-2. [Google Scholar]
- Hyldig, G.; Bremmer, E.; Martinsdóttir, E.; Schelvis, R. Quality Index Method. In Sensory Analysis of Foods of Animal Origin; Nollet, L.M.L., Toldra, F., Eds.; CRC Press: Boca Raton, FL, USA, 2010; pp. 267–284. [Google Scholar]
- Sant’Ana, L.S.; Soares, S.; Vaz-Pires, P. Development of a quality index method (QIM) sensory scheme and study of shelf-life of ice-stored blackspot seabream (Pagellus bogaraveo). LWT-Food Sci. Technol. 2011, 44, 2253–2259. [Google Scholar] [CrossRef][Green Version]
- Vaz-Pires, P.; Seixas, P. Development of new quality index method (QIM) schemes for cuttlefish (Sepia officinalis) and broadtail shortfin squid (Illex coindetii). Food Control 2006, 17, 942–949. [Google Scholar] [CrossRef]
- Gram, L.; Dalgaard, P. Fish spoilage bacteria–problems and solutions. Curr. Opin. Biotechnol. 2002, 13, 262–266. [Google Scholar] [CrossRef]
- Martinsdóttir, E.; Sveinsdóttir, K.; Luten, J.; Schelvis-Smit, R.; Hyldig, G. Reference Manual for the Fish Sector: Sensory Evaluation of Fish Freshness; Technical University of Denmark: Lyngby, Denmark, 2001; Volume 49. [Google Scholar]
- Barbosa, A.; Vaz-Pires, P. Quality index method (QIM): Development of a sensorial scheme for common octopus (Octopus vulgaris). Food Control 2004, 15, 161–168. [Google Scholar] [CrossRef]
- Ndraha, N. Fish Quality Evaluation Using Quality Index Method (QIM), Correlating with Physical, Chemical and Bacteriological Changes During the Ice-Storage Period: A Review. In Proceeding of the 1st International Conference on Tropical Agriculture; Springer International Publishing: Cham, Switzerland, 2017; pp. 185–196. [Google Scholar]
- Lanzarin, M.; Ritter, D.O.; Novaes, S.F.; Monteiro, M.L.G.; Filho, E.S.A.; Mársico, E.T.; Franco, R.M.; Conte, C.A.; Freitas, M.Q. Quality Index Method (QIM) for ice stored gutted Amazonian Pintado (Pseudoplatystoma fasciatum × Leiarius marmoratus) and estimation of shelf life. LWT - Food Sci. Technol. 2016, 65, 363–370. [Google Scholar] [CrossRef]
- Bogdanović, T.; Šimat, V.; Frka-Roić, A.; Marković, K. Development and Application of Quality Index Method Scheme in a Shelf-Life Study of Wild and Fish Farm Affected Bogue (Boops boops, L.). J. Food Sci. 2012, 77. [Google Scholar] [CrossRef]
- Agüeria, D.; Sanzano, P.; Vaz-Pires, P.; Rodríguez, E.; Yeannes, M.I. Development of Quality Index Method Scheme for Common Carp (Cyprinus carpio) Stored in Ice: Shelf-Life Assessment by Physicochemical, Microbiological, and Sensory Quality Indices. J. Aquat. Food Prod. Technol. 2016, 25, 708–723. [Google Scholar] [CrossRef]
- Oehlenschläger, J. Seafood Quality Assessment. In Seafood Processing: Technology, Quality and Safety; Wiley, John: Hoboken, NJ, USA, 2014; pp. 359–386. ISBN 9781118346174. [Google Scholar]
- Vaz-Pires, P.; Araújo, I.; Kirby, R.M. Physical measurement of the quality of fresh scad (Trachurus trachurus) and rainbow trout (Oncorhynchus mykiss) during ice storage using the RT Freshmeter. Int. J. Food Sci. Technol. 1995, 30, 799–805. [Google Scholar] [CrossRef]
- Distell User Manual Distell Fish Freshness Meter. Available online: www.distell.com (accessed on 18 June 2019).
- Ochrem, A.S.; Zapletal, P.; Maj, D.; Gil, Z.; Zychlińska-Buczek, J. Changes in physical and dielectrical properties of carp meat (Cyprinus carpio) during cold storage. J. Food Process Eng. 2014, 37, 177–184. [Google Scholar] [CrossRef]
- Pereira, J.; Silva, C.L.; Perestrelo, R.; Gonçalves, J.; Alves, V.; Câmara, J.S. Re-exploring the high-throughput potential of microextraction techniques, SPME and MEPS, as powerful strategies for medical diagnostic purposes. Innovative approaches, recent applications and future trends. Anal. Bioanal. Chem. 2014, 406, 2101–2122. [Google Scholar] [CrossRef]
- Barbosa-Pereira, L.; Otero-Pazos, P.; Rodríguez-Bernaldo De Quirós, A.; Sendón, R.; Vecino, X.; Cruz, J.M.; Romero-Rodríguez, M.A.; Estévez, N.; Maroto, J.; Paseiro-Losada, P. SPME-GC method for the determination of volatile amines as indices of freshness in fish samples. Ital. J. Food Sci. 2012, 24, 211–214. [Google Scholar]
- Araujo, P. Key aspects of analytical method validation and linearity evaluation. J. Chromatogr. B. Analyt. Technol. Biomed. Life Sci. 2009, 877, 2224–2234. [Google Scholar] [CrossRef]
- Horwitz, W. AOAC Guidelines for Single Laboratory Validation of Chemical Methods for Dietary Supplements and Botanicals; AOAC International: Rockville, MD, USA, 2002; Vol. 1219. [Google Scholar]
- Howgate, P. A Critical review of total volatile bases and trimethylamine as indices of freshness of fish. Part 1. Determination. Electron. J. Environ. Agric. Food Chem. 2010, 9, 29–57. [Google Scholar]
- Billar dos Santos, A.P.; Kushida, M.M.; Viegas, E.M.M.; Lapa-Guimarães, J. Development of Quality Index Method (QIM) scheme for Acoupa weakfish (Cynoscion acoupa). LWT - Food Sci. Technol. 2014, 57, 267–275. [Google Scholar] [CrossRef]
- Kyrana, V.R.; Lougovois, V.P.; Valsamis, D.S. Assessment of shelf-life of maricultured gilthead sea bream (Sparus aurata) stored in ice. Int. J. Food Sci. Technol. 1997, 32, 339–347. [Google Scholar] [CrossRef]
- Dehaut, A.; Duthen, S.; Grard, T.; Krzewinski, F.; N’Guessan, A.; Brisabois, A.; Duflos, G. Development of an SPME-GC-MS method for the specific quantification of dimethylamine and trimethylamine: use of a new ratio for the freshness monitoring of cod fillets. J. Sci. Food Agric. 2016, 96, 3787–3794. [Google Scholar] [CrossRef]
- Chan, S.T.; Yao, M.W.Y.; Wong, Y.C.; Wong, T.; Mok, C.S.; Sin, D.W.M. Evaluation of chemical indicators for monitoring freshness of food and determination of volatile amines in fish by headspace solid-phase microextraction and gas chromatography-mass spectrometry. Eur. Food Res. Technol. 2006, 224, 67–74. [Google Scholar] [CrossRef]
- Silva, P.; Freitas, J.; Silva, C.L.; Perestrelo, R.; Nunes, F.M.; Câmara, J.S. Establishment of authenticity and typicality of sugarcane honey based on volatile profile and multivariate analysis. Food Control 2017, 73, 1176–1188. [Google Scholar] [CrossRef]
- de Oliveira, M.C.S.D.; Yohanna, F.A.; de Lima Marques, J.; da Silva, I.C.R.; Daniel, O.F.; Daniela, C.O. Microbiological evaluation and development of quality index method (QIM) scheme for farmed pintado fish (Pseudoplatystoma corruscans). African J. Microbiol. Res. 2017, 11, 426–432. [Google Scholar]
- Le, N.T.; Doan, N.K.; Nguyen Ba, T.; Tran, T.V.T. Towards improved quality benchmarking and shelf life evaluation of black tiger shrimp (Penaeus monodon). Food Chem. 2017, 235, 220–226. [Google Scholar] [CrossRef] [PubMed]
- Li, X.; Chen, Y.; Cai, L.; Xu, Y.; Yi, S.; Zhu, W.; Mi, H.; Li, J.; Lin, H. Freshness assessment of turbot (Scophthalmus maximus) by Quality Index Method (QIM), biochemical, and proteomic methods. LWT 2017, 78, 172–180. [Google Scholar] [CrossRef]
- Fogaça, F.H.D.S.; Gonzaga Junior, M.A.; Vieira, S.G.A.; Araujo, T.D.S.; Farias, E.A.; Ferreira-Bravo, I.A.; Silva, T.F.A.; Calvet, R.M.; Pereira, A.L.M.; Prentice-Hernández, C. Appraising the Shelf Life of Farmed Cobia, Rachycentron canadum, by Application of a Quality Index Method. J. World Aquac. Soc. 2017, 48, 70–82. [Google Scholar]
- Miao, H.; Liu, Q.; Bao, H.; Wang, X.; Miao, S. Effects of different freshness on the quality of cooked tuna steak. Innov. Food Sci. Emerg. Technol. 2017, 44, 67–73. [Google Scholar] [CrossRef]
- Mu, G.; Jonsson, A.; Bergsson, A.B.; Thorarinsdottir, K.A. The Effects of Short-Time Temperature Abuse on the Microbial and Sensory Quality of Chilled Saithe (Pollachius virens) Fillets. J. Food Sci. 2017, 82, 2690–2699. [Google Scholar] [CrossRef]
- Öz, M. Effects of garlic (Allium sativum) supplemented fish diet on sensory, chemical and microbiological properties of rainbow trout during storage at −18 °C. LWT 2018, 92, 155–160. [Google Scholar] [CrossRef]
- Özogul, Y.; Durmus, M.; Ucar, Y.; Özogul, F.; Regenstein, J.M. Comparative study of nanoemulsions based on commercial oils (sunflower, canola, corn, olive, soybean, and hazelnut oils): Effect on microbial, sensory, and chemical qualities of refrigerated farmed sea bass. Innov. Food Sci. Emerg. Technol. 2016, 33, 422–430. [Google Scholar] [CrossRef]
- Shadman, S.; Hosseini, S.E.; Langroudi, H.E.; Shabani, S. Evaluation of the effect of a sunflower oil-based nanoemulsion with Zataria multiflora Boiss. essential oil on the physicochemical properties of rainbow trout (Oncorhynchus mykiss) fillets during cold storage. LWT - Food Sci. Technol. 2017, 79, 511–517. [Google Scholar] [CrossRef]
- Diler, A.; Yüksel Genç, İ. A practical quality index method (QIM) developed for aquacultured rainbow trout (Oncorhynchus mykiss). Int. J. Food Prop. 2018, 21, 858–867. [Google Scholar] [CrossRef]
- Vaz-Pires, P.; Seixas, P.; Mota, M.; Lapa-Guimarães, J.; Pickova, J.; Lindo, A.; Silva, T. Sensory, microbiological, physical and chemical properties of cuttlefish (Sepia officinalis) and broadtail shortfin squid (Illex coindetii) stored in ice. LWT - Food Sci. Technol. 2008, 41, 1655–1664. [Google Scholar] [CrossRef]
- Béné, A.; Hayman, A.; Reynard, E.; Luisier, J.L.; Villettaz, J.C. A new method for the rapid determination of volatile substances: the SPME-direct method: Part II. Determination of the freshness of fish. Sensors Actuators B Chem. 2001, 72, 204–207. [Google Scholar] [CrossRef]
Sample Availability: Samples of the compounds are not available from the authors. |


| Country | Common Name |
|---|---|
| Germany | Bernstein-Stachelmakrele; Bernsteinfisch; Grünel |
| Spain | Cèrvia; Pez de limón; Seriola; Serviola |
| UK | Amberjack; Greater amberjack |
| France | Ciriola; Seriole |
| Portugal | Charuteiro; Charuteiro-catarino; Írio; Lírio |
| Croatia | Bilizmuša; Felun; Gof; Orhan; Orva |
| Malta | Accola; Cervjola; Serjola; Serra |
| Denmark | Stor ravfisk |
| Sweden | Bärnstensfisk; Seriola |
| Serbia | Orfan; Orhan |
| Slovenia | Gof |
| Italy | Acciola; Alice grande; Alici; Alicosa; Aricciola; Cavagnola; Jarrupe; Lampuga; Lecc; Leccia; Lecciutte; Licciòla; Lissa; Lissa bastarda; Lupina; Occhio grasso; Ricciola; Sartaleone; Seriola; Seriola di Dumeril; Sirviola; Sumu |
| Greece | Magiatiko; Manali; Mayàtico; Mayatiko |
| Finland | Isopiikkimakrilli |
| Attribute | Parameter | Description | |
|---|---|---|---|
| Appearance | Skin | Very bright and iridescent; Side brownish (>50% covered) | 0 |
| Bright; side brownish (<50% covered) | 1 | ||
| Pale and dull; Side greyish; mouth or operculum reddish-pink | 2 | ||
| Marked; Superficial mucus; Blood on operculum and mouth | 3 | ||
| Anus | Clean and closed | 0 | |
| Abundant yellow feces | 1 | ||
| Dry light brown feces and open | 2 | ||
| Odor | Sea, seaweed | 0 | |
| Neutral | 1 | ||
| Rancid; Metallic | 2 | ||
| Putrid | 3 | ||
| Texture | Firmness | In rigor mortis | 0 |
| Firm, recovers shape fast (≤2 sec) | 1 | ||
| Softness; recovers shape slow (>2 sec) | 2 | ||
| Clearly marked and spongy | 3 | ||
| Eyes | Color | Black; shinny | 0 |
| Black opaque/slightly milky | 1 | ||
| Greyish/milky | 2 | ||
| White/grey in partial or total eye | 3 | ||
| Shape | Convex | 0 | |
| Flat | 1 | ||
| Concave | 2 | ||
| Gills | Color | Dark red | 0 |
| Light red | 1 | ||
| Brownish red | 2 | ||
| Brown, grey, or discolored; Bacteria present | 3 | ||
| Mucus | Absent | 0 | |
| Present and colorless | 1 | ||
| Whitish/cream | 2 | ||
| Abundant, brown, or yellowish | 3 | ||
| Odor | Sea or seaweed | 0 | |
| Neutral | 1 | ||
| Rancid; metallic | 2 | ||
| Putrid | 3 | ||
| Total Demerit Points | 0–25 | ||
| Validation Parameters 1 | |
|---|---|
| Concentration range (µg/mL) | 0.1–15 |
| Regression equation | y = −0.0108x2 + 1.080x + 0.1102 |
| R2 | 0.9994 |
| Linearity test (Ftheo/Fexp) | 2.51 2 |
| LOD (µg/ml) | 0.6 |
| LOQ (µg/ml) | 1.9 |
| Matrix effect (%) | 106 |
| Recovery (%) | 93.3 LL 3; 98.0 ML 4; 99.0 HL 5 |
| Intermediate precision (% RSD) | 8.4 LL; 7.1 ML; 9.7 HL |
| Repeatability (% RSD) | 8.2 LL; 6.0 ML; 9.6 HL |
| Method | Rejection Criteria | Value at Rejection | Estimated Rejection Day |
|---|---|---|---|
| QIM | Off-odors | 17.5 | 11–12 |
| Torrymeter | Slope change | 8 | 11–12 |
| Microbiology (TVC) | Log (cfu/cm2) = 7–9 | 8.0 | 10–11 |
| Microbiology (H2S) | Log (cfu/cm2) = 7–9 | 7.5 | 10–11 |
| Trimethylamine (TMA) | 12 mg/100g | 12.5 | 12–13 |
© 2019 by the authors. Licensee MDPI, Basel, Switzerland. This article is an open access article distributed under the terms and conditions of the Creative Commons Attribution (CC BY) license (http://creativecommons.org/licenses/by/4.0/).
Share and Cite
Freitas, J.; Vaz-Pires, P.; Câmara, J.S. Freshness Assessment and Shelf-Life Prediction for Seriola dumerili from Aquaculture Based on the Quality Index Method. Molecules 2019, 24, 3530. https://doi.org/10.3390/molecules24193530
Freitas J, Vaz-Pires P, Câmara JS. Freshness Assessment and Shelf-Life Prediction for Seriola dumerili from Aquaculture Based on the Quality Index Method. Molecules. 2019; 24(19):3530. https://doi.org/10.3390/molecules24193530
Chicago/Turabian StyleFreitas, Jorge, Paulo Vaz-Pires, and José S. Câmara. 2019. "Freshness Assessment and Shelf-Life Prediction for Seriola dumerili from Aquaculture Based on the Quality Index Method" Molecules 24, no. 19: 3530. https://doi.org/10.3390/molecules24193530
APA StyleFreitas, J., Vaz-Pires, P., & Câmara, J. S. (2019). Freshness Assessment and Shelf-Life Prediction for Seriola dumerili from Aquaculture Based on the Quality Index Method. Molecules, 24(19), 3530. https://doi.org/10.3390/molecules24193530