
Theoretical Studies of IR and NMR Spectral Changes Induced by Sigma-Hole Hydrogen, Halogen, Chalcogen, Pnicogen, and Tetrel Bonds in a Model Protein Environment


Abstract
1. Introduction
2. Results
2.1. IR Spectra
2.2. NMR Spectra and Atomic Charges
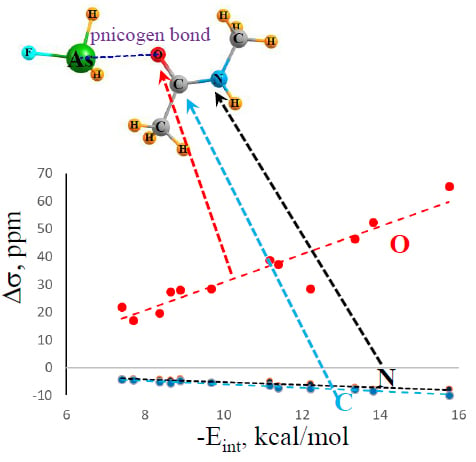
2.3. Relation to Binding Energies
2.4. Contributions to Binding Energies
3. Computational Methods
4. Summary
Supplementary Materials
Author Contributions
Funding
Acknowledgments
Conflicts of Interest
References
- Hadzi, D.; Bratos, S. Vibrational Spectroscopy of the hydrogen bond. In The Hydrogen Bond. Recent Developments in Theory and Experiments; Schuster, P., Zundel, G., Sandorfy, C., Eds.; North-Holland Publishing Co.: Amsterdam, The Netherlands, 1976; Volume 2, pp. 565–611. [Google Scholar]
- Gilli, G.; Gilli, P. The Nature of the Hydrogen Bond; Oxford University Press: Oxford, UK, 2009; p. 313. [Google Scholar]
- Sponer, J.; Leszczynski, J.; Hobza, P. Hydrogen bonding and stacking of DNA bases: a review of quantum-chemical ab initio studies. Biomol. Struct. Dyn. 1996, 14, 117–135. [Google Scholar] [CrossRef] [PubMed]
- Scheiner, S. Hydrogen Bonding: A Theoretical Perspective; Oxford University Press: New York, NY, USA, 1997; p. 375. [Google Scholar]
- Rivera-Rivera, L.A.; McElmurry, B.A.; Scott, K.W.; Lucchese, R.R.; Bevan, J.W. The Badger–Bauer Rule Revisited: Correlation of Proper Blue Frequency Shifts in the OC Hydrogen Acceptor with Morphed Hydrogen Bond Dissociation Energies in OC–HX (X = F, Cl, Br, I, CN, CCH). J. Phys. Chem. A 2013, 117, 8477–8483. [Google Scholar] [CrossRef] [PubMed]
- Cook, J.L.; Hunter, C.A.; Low, C.M.R.; Perez-Velasco, A.; Vinter, J.G. Solvent effects on hydrogen bonding. Angew. Chem. Int. Ed. 2007, 46, 3706–3708. [Google Scholar] [CrossRef] [PubMed]
- Du, L.; Mackeprang, K.; Kjaergaard, H.G. Fundamental and overtone vibrational spectroscopy, enthalpy of hydrogen bond formation and equilibrium constant determination of the methanol-dimethylamine complex. Phys. Chem. Chem. Phys. 2013, 15, 10194–10206. [Google Scholar] [CrossRef] [PubMed]
- Boyer, M.A.; Marsalek, O.; Heindel, J.P.; Markland, T.E.; McCoy, A.B.; Xantheas, S.S. Beyond Badger’s Rule: The Origins and Generality of the Structure–Spectra Relationship of Aqueous Hydrogen Bonds. J. Phys. Chem. Lett. 2019, 10, 918–924. [Google Scholar] [CrossRef] [PubMed]
- Thatcher, R.J.; Johnson, D.G.; Slattery, J.M.; Douthwaite, R.E. Structure of Amido Pyridinium Betaines: Persistent Intermolecular C−H⋅⋅⋅N Hydrogen Bonding in Solution. Chem. Eur. J. 2016, 22, 3414–3421. [Google Scholar] [CrossRef] [PubMed]
- Del Bene, J.E.; Alkorta, I.; Elguero, J. Exploring N···C tetrel and O···S chalcogen bonds in HN(CH)SX:OCS systems, for X = F, NC, Cl, CN, CCH, and H. Chem. Phys. Lett. 2019, 730, 466–471. [Google Scholar] [CrossRef]
- Gougoula, E.; Medcraft, C.; Alkorta, I.; Walker, N.R.; Legon, A.C. A chalcogen-bonded complex H3N···S=C=S formed by ammonia and carbon disulfide characterised by chirped-pulse, broadband microwave spectroscopy. J. Chem. Phys. 2019, 150, 084307. [Google Scholar] [CrossRef] [PubMed]
- Alkorta, I.; Legon, A. An Ab Initio Investigation of the Geometries and Binding Strengths of Tetrel-, Pnictogen-, and Chalcogen-Bonded Complexes of CO2, N2O, and CS2 with Simple Lewis Bases: Some Generalizations. Molecules 2018, 23, 2250. [Google Scholar] [CrossRef] [PubMed]
- Grabowski, S.J. Pnicogen and tetrel bonds—Tetrahedral Lewis acid centres. Struct. Chem. 2019, 30, 1141–1152. [Google Scholar] [CrossRef]
- Grabowski, S. Tetrel Bonds with π-Electrons Acting as Lewis Bases—Theoretical Results and Experimental Evidences. Molecules 2018, 23, 1183. [Google Scholar] [CrossRef] [PubMed]
- Alkorta, I.; Elguero, J.; Grabowski, S.J. Pnicogen and hydrogen bonds: complexes between PH3X+ and PH2X systems. Phys. Chem. Chem. Phys. 2015, 17, 3261–3272. [Google Scholar] [CrossRef] [PubMed]
- Franconetti, A.; Quiñonero, D.; Frontera, A.; Resnati, G. Unexpected chalcogen bonds in tetravalent sulfur compounds. Phys. Chem. Chem. Phys. 2019, 21, 11313–11319. [Google Scholar] [CrossRef] [PubMed]
- Franconetti, A.; Frontera, A. Theoretical and Crystallographic Study of Lead(IV) Tetrel Bonding Interactions. Chem. Eur. J. 2019, 25, 6007–6013. [Google Scholar] [CrossRef]
- Frontera, A.; Bauzá, A.S. S...Sn Tetrel Bonds in the Activation of Peroxisome Proliferator-Activated Receptors (PPARs) by Organotin Molecules. Chem. Eur. J. 2018, 24, 16582–16587. [Google Scholar] [CrossRef] [PubMed]
- Murray, J.S.; Politzer, P. σ-Holes and Si···N intramolecular interactions. J. Mol. Model. 2019, 25, 101. [Google Scholar] [CrossRef] [PubMed]
- Clark, T.; Murray, J.S.; Politzer, P. A perspective on quantum mechanics and chemical concepts in describing noncovalent interactions. Phys. Chem. Chem. Phys. 2018, 20, 30076–30082. [Google Scholar] [CrossRef]
- Riley, K.E.; Tran, K.-A. Strength, character, and directionality of halogen bonds involving cationic halogen bond donors. Faraday Disc. 2017, 203, 47–60. [Google Scholar] [CrossRef]
- Riley, K.E.; Vazquez, M.; Umemura, C.; Miller, C.; Tran, K.-A. Exploring the (Very Flat) Potential Energy Landscape of R−Br···π Interactions with Accurate CCSD(T) and SAPT Techniques. Chem. Eur. J. 2016, 22, 17690–17695. [Google Scholar] [CrossRef]
- Scheiner, S. The pnicogen bond: Its relation to hydrogen, halogen, and other noncovalent bonds. Acc. Chem. Res. 2013, 46, 280–288. [Google Scholar] [CrossRef]
- Zierkiewicz, W.; Michalczyk, M.; Wysokiński, R.; Scheiner, S. On the ability of pnicogen atoms to engage in both σ and π-hole complexes. Heterodimers of ZF2C6H5 (Z = P, As, Sb, Bi) and NH3. J. Mol. Model. 2019, 25, 152. [Google Scholar] [CrossRef] [PubMed]
- Zierkiewicz, W.; Michalczyk, M.; Wysokiński, R.; Scheiner, S. Dual Geometry Schemes in Tetrel Bonds: Complexes between TF4 (T = Si, Ge, Sn) and Pyridine Derivatives. Molecules 2019, 24, 376. [Google Scholar] [CrossRef] [PubMed]
- Zierkiewicz, W.; Fanfrlík, J.; Michalczyk, M.; Michalska, D.; Hobza, P. S···N chalcogen bonded complexes of carbon disulfide with diazines. Theoretical study. Chem. Phys. 2018, 500, 37–44. [Google Scholar] [CrossRef]
- Dong, W.; Niu, B.; Liu, S.; Cheng, J.; Liu, S.; Li, Q. Comparison of σ-/π-Hole Tetrel Bonds between TH3F/F2TO and H2CX (X = O, S, Se). ChemPhysChem 2019, 20, 627–635. [Google Scholar] [CrossRef] [PubMed]
- Dong, W.; Wang, Y.; Cheng, J.; Yang, X.; Li, Q. Competition between σ-hole pnicogen bond and π-hole tetrel bond in complexes of CF2=CFZH2 (Z = P, As, and Sb). Mol. Phys. 2019, 117, 251–259. [Google Scholar] [CrossRef]
- Dong, W.; Li, Q.; Scheiner, S. Comparative Strengths of Tetrel, Pnicogen, Chalcogen, and Halogen Bonds and Contributing Factors. Molecules 2018, 23, 1681. [Google Scholar] [CrossRef] [PubMed]
- Stasyuk, O.A.; Sedlak, R.; Guerra, C.F.; Hobza, P. Comparison of the DFT-SAPT and Canonical EDA Schemes for the Energy Decomposition of Various Types of Noncovalent Interactions. J. Chem. Theory Comput. 2018, 14, 3440–3450. [Google Scholar] [CrossRef] [PubMed]
- Sedlak, R.; Eyrilmez, S.M.; Hobza, P.; Nachtigallova, D. The role of the s-holes in stability of non-bonded chalcogenide...benzene interactions: the ground and excited states. Phys. Chem. Chem. Phys. 2018, 20, 299–306. [Google Scholar] [CrossRef]
- Esrafili, M.; Mousavian, P. Strong Tetrel Bonds: Theoretical Aspects and Experimental Evidence. Molecules 2018, 23, 2642. [Google Scholar] [CrossRef]
- Scheiner, S.; Adhikari, U. Abilities of different electron donors (D) to engage in a P···D noncovalent interaction. J. Phys. Chem. A 2011, 115, 11101–11110. [Google Scholar] [CrossRef]
- Esrafili, M.D.; Mousavian, P.; Mohammadian-Sabet, F. Tuning of pnicogen and chalcogen bonds by an aerogen-bonding interaction: a comparative ab initio study. Mol. Phys. 2019, 117, 58–66. [Google Scholar] [CrossRef]
- Cavallo, G.; Metrangolo, P.; Milani, R.; Pilati, T.; Priimagi, A.; Resnati, G.; Terraneo, G. The Halogen Bond. Chem. Rev. 2016, 116, 2478–2601. [Google Scholar] [CrossRef] [PubMed]
- Syssa-Magale, J.L.; Boubekeur, K.; Schollhorn, B. First molecular self-assembly of 1,4-diiodo-tetrafluoro-benzene and a ketone via (O center dot center dot center dot I) non-covalent halogen bonds. J Mol Struct 2005, 737, 103–107. [Google Scholar] [CrossRef]
- Del Bene, J.E.; Alkorta, I.; Elguero, J. Anionic complexes of F− and Cl− with substituted methanes: Hydrogen, halogen, and tetrel bonds. Chem. Phys. Lett. 2016, 655–656, 115–119. [Google Scholar] [CrossRef]
- Scheiner, S. Can two trivalent N atoms engage in a direct N···N noncovalent interaction? Chem. Phys. Lett. 2011, 514, 32–35. [Google Scholar] [CrossRef]
- Southern, S.A.; Bryce, D.L. NMR Investigations of Noncovalent Carbon Tetrel Bonds. Computational Assessment and Initial Experimental Observation. J. Phys. Chem. A 2015, 119, 11891–11899. [Google Scholar] [CrossRef] [PubMed]
- Scheiner, S. Comparison of CH···O, SH···O, Chalcogen, and Tetrel Bonds Formed by Neutral and Cationic Sulfur-Containing Compounds. J. Phys. Chem. A 2015, 119, 9189–9199. [Google Scholar] [CrossRef] [PubMed]
- Nziko, V.d.P.N.; Scheiner, S. Comparison of p-hole tetrel bonding with s-hole halogen bonds in complexes of XCN (X = F, Cl, Br, I) and NH3. Phys. Chem. Chem. Phys. 2016, 18, 3581–3590. [Google Scholar] [CrossRef]
- Liu, M.; Li, Q.; Scheiner, S. Comparison of tetrel bonds in neutral and protonated complexes of pyridineTF3 and furanTF3 (T = C, Si, and Ge) with NH3. Phys. Chem. Chem. Phys. 2017, 19, 5550–5559. [Google Scholar] [CrossRef]
- Scheiner, S. Systematic Elucidation of Factors That Influence the Strength of Tetrel Bonds. J. Phys. Chem. A 2017, 121, 5561–5568. [Google Scholar] [CrossRef]
- Bene, J.E.D.; Alkorta, I.; Elguero, J. Properties of cationic pnicogen-bonded complexes F4-nHnP+: N-base with H–P···N linear and n = 1–4. Mol. Phys. 2016, 114, 102–117. [Google Scholar] [CrossRef]
- Ellington, T.L.; Reves, P.L.; Simms, B.L.; Wilson, J.L.; Watkins, D.L.; Tschumper, G.S.; Hammer, N.I. Quantifying the Effects of Halogen Bonding by Haloaromatic Donors on the Acceptor Pyrimidine. ChemPhysChem 2017, 18, 1267–1273. [Google Scholar] [CrossRef]
- Esrafili, M.D.; Vakili, M. The effect of hydrogen-bonding cooperativity on the strength and properties of σ-hole interactions: an ab initio study. Mol. Phys. 2017, 115, 913–924. [Google Scholar] [CrossRef]
- Gholipour, A.; Farhadi, S.; Neyband, R.S. Theoretical investigation of the nature and strength of simultaneous interactions of π–π stacking and halogen bond including NMR, SAPT, AIM and NBO analysis. Struct. Chem. 2016, 27, 1543–1551. [Google Scholar] [CrossRef]
- Cormanich, R.A.; Rittner, R.; O’Hagan, D.; Bühl, M. Inter- and intramolecular CF···C=O interactions on aliphatic and cyclohexane carbonyl derivatives. J. Comput. Chem. 2016, 37, 25–33. [Google Scholar] [CrossRef]
- Viger-Gravel, J.; Leclerc, S.; Korobkov, I.; Bryce, D.L. Correlation between 13C chemical shifts and the halogen bonding environment in a series of solid para-diiodotetrafluorobenzene complexes. CrystEngComm 2013, 15, 3168–3177. [Google Scholar] [CrossRef]
- Alkorta, I.; Sánchez-Sanz, G.; Elguero, J.; Del Bene, J.E. Influence of hydrogen bonds on the P···P pnicogen bond. J. Chem. Theory Comput. 2012, 8, 2320–2327. [Google Scholar] [CrossRef]
- Ma, N.; Zhang, Y.; Ji, B.; Tian, A.; Wang, W. Structural competition between halogen bonds and lone-pair..p interactions in solution. ChemPhysChem 2012, 13, 1411–1414. [Google Scholar] [CrossRef]
- Ghafari Nikoo Jooneghani, S.; Gholipour, A. Mutual cooperation of π–π stacking and pnicogen bond interactions of substituted monomeric Lawesson’s reagent and pyridine rings: Theoretical insight into Pyr||X-PhPS2⊥pyr complexes. Chem. Phys. Lett. 2019, 721, 91–98. [Google Scholar] [CrossRef]
- Watson, B.; Grounds, O.; Borley, W.; Rosokha, S.V. Resolving the halogen vs hydrogen bonding dichotomy in solutions: intermolecular complexes of trihalomethanes with halide and pseudohalide anions. Phys. Chem. Chem. Phys. 2018, 20, 21999–22007. [Google Scholar] [CrossRef]
- Xu, Y.; Gabidullin, B.; Bryce, D.L. Single-Crystal NMR Characterization of Halogen Bonds. J. Phys. Chem. A 2019, 123, 6194–6209. [Google Scholar] [CrossRef]
- Barbas, R.; Prohens, R.; Bauzá, A.; Franconetti, A.; Frontera, A. H-Bonded anion–anion complexes in fentanyl citrate polymorphs and solvates. Chem. Commun. 2019, 55, 115–118. [Google Scholar] [CrossRef]
- Mundlapati, V.R.; Sahoo, D.K.; Bhaumik, S.; Jena, S.; Chandrakar, A.; Biswal, H.S. Noncovalent Carbon-Bonding Interactions in Proteins. Angew. Chem. Int. Ed. 2018, 57, 16496–16500. [Google Scholar] [CrossRef]
- Danelius, E.; Andersson, H.; Jarvoll, P.; Lood, K.; Gräfenstein, J.; Erdélyi, M. Halogen Bonding: A Powerful Tool for Modulation of Peptide Conformation. Biochem. 2017, 56, 3265–3272. [Google Scholar] [CrossRef]
- Xia, Y.; Viel, S.; Wang, Y.; Ziarelli, F.; Laurini, E.; Posocco, P.; Fermeglia, M.; Qu, F.; Pricl, S.; Peng, L. Rationalizing the FS interaction discovered within a tetrafluorophenylazido-containing bola-phospholipid. Chem. Commun. 2012, 48, 4284–4286. [Google Scholar] [CrossRef]
- Junming, L.; Yunxiang, L.; Subin, Y.; Weiliang, Z. Theoretical and crystallographic data investigations of noncovalent S···O interactions. Struct. Chem. 2011, 22, 757–963. [Google Scholar] [CrossRef]
- Parisini, E.; Metrangolo, P.; Pilati, T.; Resnati, G.; Terraneo, G. Halogen bonding in halocarbon–protein complexes: A structural survey. Chem. Soc. Rev. 2011, 40, 2267–2278. [Google Scholar] [CrossRef]
- Fick, R.J.; Kroner, G.M.; Nepal, B.; Magnani, R.; Horowitz, S.; Houtz, R.L.; Scheiner, S.; Trievel, R.C. Sulfur–Oxygen Chalcogen Bonding Mediates AdoMet Recognition in the Lysine Methyltransferase SET7/9. ACS Chem. Biol. 2016, 11, 748–754. [Google Scholar] [CrossRef]
- Trievel, R.C.; Scheiner, S. Crystallographic and Computational Characterization of Methyl Tetrel Bonding in S-Adenosylmethionine-Dependent Methyltransferases. Molecules 2018, 23, 2965. [Google Scholar] [CrossRef]
- Moller, C.; Plesset, M.S. Note on an approximation treatment for many-electron systems. Phys. Rev. 1934, 46, 0618–0622. [Google Scholar] [CrossRef]
- Dunning, T.H. Gaussian-Basis Sets for Use in Correlated Molecular Calculations .1. The Atoms Boron through Neon and Hydrogen. J. Chem. Phys. 1989, 90, 1007–1023. [Google Scholar] [CrossRef]
- Schuchardt, K.L.; Didier, B.T.; Elsethagen, T.; Sun, L.S.; Gurumoorthi, V.; Chase, J.; Li, J.; Windus, T.L. Basis set exchange: A community database for computational sciences. J. Chem. Inf. Model. 2007, 47, 1045–1052. [Google Scholar] [CrossRef]
- Feller, D. The role of databases in support of computational chemistry calculations. J. Comput. Chem. 1996, 17, 1571–1586. [Google Scholar] [CrossRef]
- Becke, A.D. Density-Functional Thermochemistry .3. The Role of Exact Exchange. J. Chem. Phys. 1993, 98, 5648–5652. [Google Scholar] [CrossRef]
- Lee, C.T.; Yang, W.T.; Parr, R.G. Development of the Colle-Salvetti Correlation-Energy Formula into a Functional of the Electron-Density. Phys. Rev. B 1988, 37, 785–789. [Google Scholar] [CrossRef]
- Purvis, G.D.; Bartlett, R.J. A full coupled-cluster singles and doubles model: The inclusion of disconnected triples. J. Chem. Phys. 1982, 76, 1910–1918. [Google Scholar] [CrossRef]
- Raghavachari, K.; Trucks, G.W.; Pople, J.A.; Headgordon, M. A 5th-Order Perturbation Comparison of Electron Correlation Theories. Chem. Phys. Lett. 1989, 157, 479–483. [Google Scholar] [CrossRef]
- Noro, T.; Sekiya, M.; Koga, T. Segmented contracted basis sets for atoms H through Xe: Sapporo-(DK)-nZP sets (n = D, T, Q). Theor. Chem. Acc. 2012, 131, 1124. [Google Scholar] [CrossRef]
- Frisch, M.J.; Trucks, G.W.; Schlegel, H.B.; Scuseria, G.E.; Robb, M.A.; Cheeseman, J.R.; Scalmani, G.; Barone, V.; Mennucci, B.; Petersson, G.A.; et al. Fox Gaussian 09; Gaussian, Inc.: Wallingford, CT, USA, 2009. [Google Scholar]
- Bulat, F.A.; Toro-Labbe, A.; Brinck, T.; Murray, J.S.; Politzer, P. Quantitative analysis of molecular surfaces: areas, volumes, electrostatic potentials and average local ionization energies. J. Mol. Model. 2010, 16, 1679–1691. [Google Scholar] [CrossRef]
- Lu, T.; Chen, F. Quantitative analysis of molecular surface based on improved Marching Tetrahedra algorithm. J. Mol. Graphics Model. 2012, 38, 314–323. [Google Scholar] [CrossRef]
- Lu, T.; Chen, F. Multiwfn: A multifunctional wavefunction analyzer. J. Comp. Chem. 2012, 33, 580–592. [Google Scholar] [CrossRef]
- Boys, S.F.; Bernardi, F. Calculation of Small Molecular Interactions by Differences of Separate Total Energies—Some Procedures with Reduced Errors. Mol. Phys. 1970, 19, 553–566. [Google Scholar] [CrossRef]
- Keith, A.T. AIMAll (Version 14.11.23); TK Gristmill Software: Overland Park, KS, USA, 2014. [Google Scholar]
- Weinhold, F.; Landis, C.R.; Glendening, E.D. What is NBO analysis and how is it useful? Int. Rev. Phys. Chem. 2016, 35, 399–440. [Google Scholar] [CrossRef]
- ADF2014, SCM, Theoretical Chemistry; Vrije Universiteit: Amsterdam, The Netherlands, 2014.
- Te Velde, G.; Bickelhaupt, F.M.; Baerends, E.J.; Guerra, C.F.; Van Gisbergen, S.J.A.; Snijders, J.G.; Ziegler, T. Chemistry with ADF. J. Comput. Chem. 2001, 22, 931–967. [Google Scholar] [CrossRef]
- Guerra, C.F.; Snijders, J.G.; Te Velde, G.; Baerends, E.J. Towards an order-N DFT method. Theor. Chem. Acc. 1998, 99, 391–403. [Google Scholar] [CrossRef]
- Lu, J.; Scheiner, S. Effects of Halogen, Chalcogen, Pnicogen, and Tetrel Bonds on IR and NMR Spectra. Molecules 2019, 24, 2822. [Google Scholar] [CrossRef]


| – | Δr (X–H) | Δν (X–H) | Icomp/Imon | Δr (C=O) | Δν (C=O)b | Icomp/Imon | Δν (Amide II Band)c | Icomp/Imon |
|---|---|---|---|---|---|---|---|---|
| FH∙∙∙NMA | 0.032 | −729 | 14.0 | 0.012 | −30 | 1.6 | +26 | 0.9 |
| ClH∙∙∙NMA | 0.051 | −695 | 48.6 | 0.013 | −50 | 2.8 | +25 | 0.9 |
| BrH∙∙∙NMA | 0.060 | −705 | 146.8 | 0.014 | −75 | 4.8 | +26 | 0.8 |
| IH∙∙∙NMA | 0.069 | −606 | 47,960.0 | 0.014 | −169 | 10.1 | +25 | 1.8 |
| XB | Δr (F−X) | Δν (F−X) | ||||||
| FCl∙∙∙NMA | 0.042 | −103 | 10.5 | 0.013 | −45 | 2.2 | +22 | 0.9 |
| FBr∙∙∙NMA | 0.048 | −80 | 6.8 | 0.017 | −55 | 2.5 | +30 | 0.8 |
| FI∙∙∙NMA | 0.044 | −58 | 4.4 | 0.019 | −55 | 2.6 | +35 | 0.7 |
| YB | Δr (F−Y) | Δν (F−Y) | ||||||
| HFS∙∙∙NMA | 0.030 | −71 | 3.7 | 0.009 | −28 | 1.8 | +19 | 1.0 |
| HFSe∙∙∙NMA | 0.039 | −64 | 3.4 | 0.013 | −36 | 2.1 | +25 | 0.9 |
| HFTe∙∙∙NMA | 0.041 | −56 | 2.6 | 0.016 | −49 | 2.3 | +30 | 0.8 |
| ZB | Δr (F–Z) | Δν (F–Z) | ||||||
| H2FP∙∙∙NMA | 0.024 | −58 | 2.3 | 0.008 | −24 | 1.7 | +15 | 1.0 |
| H2FAs∙∙∙NMA | 0.032 | −54 | 2.2 | 0.010 | −29 | 1.8 | +20 | 1.0 |
| H2FSb∙∙∙NMA | 0.036 | −51 | 1.9 | 0.013 | −40 | 1.9 | +25 | 0.9 |
| TB | Δr (F–T) | Δν (F–T) | ||||||
| H3FSi∙∙∙NMA | 0.024 | −57 | 3.2 | 0.008 | −23 | 1.5 | +17 | 1.0 |
| H3FGe∙∙∙NMA | 0.031 | −57 | 2.0 | 0.009 | −25 | 1.6 | +20 | 1.0 |
| H3FSn∙∙∙NMA | 0.034 | −50 | 1.7 | 0.013 | −35 | 1.8 | +28 | 0.9 |
| System | Atoms | ||||
|---|---|---|---|---|---|
| HB | H | X | O | Cb | N |
| FH∙∙∙NMA | −6.9 | −19.5 | 34.4 | −6.3 | −5.1 |
| ClH∙∙∙NMA | −9.5 | −1.0 | 20.0 | −6.0 | −5.4 |
| BrH∙∙∙NMA | −10.6 | 35.8 | 15.4 | −6.2 | −5.6 |
| IH∙∙∙NMA | −11.2 | 175.7 | 7.0 | −6.1 | −5.7 |
| XB | X | F | |||
| FCl∙∙∙NMA | 239.3 | −139.2 | 28.4 | −5.4 | −5.4 |
| FBr∙∙∙NMA | 929.2 | −208.8 | 46.5 | −7.1 | −7.7 |
| FI∙∙∙NMA | 2196.7 | −296.2 | 62.6 | −7.8 | −9.9 |
| YB | Y | F | |||
| HFS∙∙∙NMA | 141.2 | −112.0 | 28.1 | −4.0 | −4.6 |
| HFSe∙∙∙NMA | 521.2 | −151.9 | 38.8 | −4.9 | −6.5 |
| HFTe∙∙∙NMA | 1310.8 | −193.1 | 49.4 | −7.6 | −8.4 |
| ZB | Z | F | |||
| H2FP∙∙∙NMA | 40.0 | −62.2 | 22.0 | −4.0 | −4.3 |
| H2FAs∙∙∙NMA | 107.6 | −71.1 | 27.5 | −4.5 | −5.5 |
| H2FSb∙∙∙NMA | 283.9 | −80.6 | 35.2 | −6.3 | −7.2 |
| TB | T | F | |||
| H3FSi∙∙∙NMA | 17.3 | −42.5 | 17.0 | −4.0 | −4.5 |
| H3FGe∙∙∙NMA | 42.5 | −47.3 | 19.8 | −4.3 | −5.2 |
| H3FSn∙∙∙NMA | 127.0 | −53.0 | 29.4 | −5.8 | −7.6 |
| Donors | Atoms | ||||
|---|---|---|---|---|---|
| HB | H | X | O | C | N |
| FH∙∙∙NMA | −0.003 | −0.064 | −0.035 | 0.020 | 0.025 |
| ClH∙∙∙NMA | 0.038 | −0.123 | −0.013 | 0.019 | 0.025 |
| BrH∙∙∙NMA | 0.050 | −0.155 | −0.005 | 0.020 | 0.029 |
| IH∙∙∙NMA | 0.052 | −0.168 | 0.006 | 0.020 | 0.031 |
| XB | X | F | |||
| FCl∙∙∙NMA | −0.072 | −0.094 | 0.044 | 0.016 | 0.033 |
| FBr∙∙∙NMA | −0.058 | −0.093 | 0.021 | 0.019 | 0.036 |
| FI∙∙∙NMA | −0.050 | −0.087 | −0.001 | 0.022 | 0.040 |
| YB | Y | F | |||
| HFS∙∙∙NMA | −0.043 | −0.056 | −0.002 | 0.016 | 0.023 |
| HFSe∙∙∙NMA | −0.042 | −0.063 | −0.007 | 0.016 | 0.027 |
| HFTe∙∙∙NMA | −0.013 | −0.063 | −0.023 | 0.022 | 0.035 |
| ZB | Z | F | |||
| H2FP∙∙∙NMA | −0.035 | −0.032 | −0.020 | 0.013 | 0.016 |
| H2FAs∙∙∙NMA | −0.027 | −0.039 | −0.019 | 0.014 | 0.020 |
| H2FSb∙∙∙NMA | 0.018 | −0.046 | −0.036 | 0.021 | 0.029 |
| TB | T | F | |||
| H3FSi∙∙∙NMA | −0.004 | −0.025 | −0.025 | 0.015 | 0.017 |
| H3FGe∙∙∙NMA | −0.005 | −0.030 | −0.025 | 0.014 | 0.017 |
| H3FSn∙∙∙NMA | −0.001 | −0.038 | −0.036 | 0.023 | 0.032 |
| System | (I) | (II) | (III) |
|---|---|---|---|
| HB | |||
| FH∙∙∙NMA | −12.68 | −14.59 | −12.78 |
| ClH∙∙∙NMA | −10.14 | −11.27 | −9.07 |
| BrH∙∙∙NMA | −9.22 | −11.37 | −7.80 |
| IH∙∙∙NMA | −7.23 | −9.24 | −5.38 |
| XB | |||
| FCl∙∙∙NMA | −9.69 | −14.88 | −8.49 |
| FBr∙∙∙NMA | −13.34 | −16.86 | −11.92 |
| FI∙∙∙NMA | −15.75 | −17.69 | −14.40 |
| YB | |||
| HFS∙∙∙NMA | −8.90 | −10.32 | −8.17 |
| HFSe∙∙∙NMA | −11.18 | −12.37 | −10.21 |
| HFTe∙∙∙NMA | −13.82 | −13.95 | −12.89 |
| ZB | |||
| H2FP∙∙∙NMA | −7.40 | −7.21 | −7.00 |
| H2FAs∙∙∙NMA | −8.65 | −8.53 | −8.13 |
| H2FSb∙∙∙NMA | −11.40 | −10.63 | −10.93 |
| TB | |||
| H3FSi∙∙∙NMA | −7.70 | −7.11 | −7.72 |
| H3FGe∙∙∙NMA | −8.37 | −7.53 | −8.34 |
| H3FSn∙∙∙NMA | −12.22 | −10.20 | −12.09 |
| System | Eint | EPauli | Eelec | % | Eoi | % | Edisp | % |
|---|---|---|---|---|---|---|---|---|
| HB | ||||||||
| FH∙∙∙NMA | −14.86 | 21.59 | −20.70 | 57 | −13.93 | 38 | −1.83 | 5 |
| ClH∙∙∙NMA | −11.46 | 28.82 | −20.22 | 50 | −17.21 | 43 | −2.85 | 7 |
| BrH∙∙∙NMA | −11.21 | 33.58 | −21.17 | 47 | −20.34 | 45 | −3.29 | 7 |
| IH∙∙∙NMA | −8.87 | 37.65 | −21.44 | 46 | −21.53 | 46 | −3.55 | 8 |
| XB | ||||||||
| FCl∙∙∙NMA | −14.07 | 32.53 | −22.40 | 48 | −21.91 | 47 | −2.29 | 5 |
| FBr∙∙∙NMA | −17.01 | 43.71 | −31.66 | 52 | −26.58 | 44 | −2.48 | 4 |
| FI∙∙∙NMA | −17.36 | 49.65 | −37.72 | 56 | −26.66 | 40 | −2.63 | 4 |
| YB | ||||||||
| HFS∙∙∙NMA | −10.85 | 25.45 | −18.92 | 52 | −14.72 | 41 | −2.66 | 7 |
| HFSe∙∙∙NMA | −12.75 | 35.40 | −26.27 | 55 | −19.05 | 40 | −2.83 | 6 |
| HFTe∙∙∙NMA | −13.91 | 42.18 | −32.62 | 58 | −20.26 | 36 | −3.21 | 6 |
| ZB | ||||||||
| H2FP∙∙∙NMA | −8.04 | 20.43 | −15.78 | 55 | −9.91 | 35 | −2.79 | 10 |
| H2FAs∙∙∙NMA | −8.88 | 26.12 | −20.03 | 57 | −11.94 | 34 | −3.02 | 9 |
| H2FSb∙∙∙NMA | −10.59 | 32.23 | −25.76 | 60 | −13.93 | 33 | −3.13 | 7 |
| TB | ||||||||
| H3FSi∙∙∙NMA | −8.32 | 23.22 | −17.73 | 56 | −10.35 | 33 | −3.48 | 11 |
| H3FGe∙∙∙NMA | −7.88 | 25.96 | −19.82 | 59 | −10.51 | 31 | −3.51 | 10 |
| H3FSn∙∙∙NMA | −10.35 | 35.60 | −28.63 | 62 | −14.12 | 31 | −3.20 | 7 |
| LP(O)→σ*a | Σ(base→acid) | CT | |
|---|---|---|---|
| HB | |||
| FH∙∙∙NMA | 29.85 | 31.22 | 66 |
| ClH∙∙∙NMA | 31.24 | 33.69 | 84 |
| BrH∙∙∙NMA | 39.14 | 43.25 | 105 |
| IH∙∙∙NMA | 37.36 | 43.04 | 107 |
| XB | |||
| FCl∙∙∙NMA | 23.94 | 27.93 | 167 |
| FBr∙∙∙NMA | 26.75 | 30.63 | 151 |
| FI∙∙∙NMA | 24.80 | 29.79 | 122 |
| YB | |||
| HFS∙∙∙NMA | 13.05 | 16.21 | 86 |
| HFSe∙∙∙NMA | 17.12 | 22.03 | 93 |
| HFTe∙∙∙NMA | 17.65 | 23.28 | 80 |
| ZB | |||
| H2FP∙∙∙NMA | 6.03 | 8.24 | 43 |
| H2FAs∙∙∙NMA | 10.41 | 13.32 | 54 |
| H2FSb∙∙∙NMA | 11.34 | 16.21 | 57 |
| TB | |||
| H3FSi∙∙∙NMA | 5.24 | 10.63 | 41 |
| H3FGe∙∙∙NMA | 7.30 | 12.78 | 41 |
| H3FSn∙∙∙NMA | 9.37 | 19.21 | 56 |
© 2019 by the authors. Licensee MDPI, Basel, Switzerland. This article is an open access article distributed under the terms and conditions of the Creative Commons Attribution (CC BY) license (http://creativecommons.org/licenses/by/4.0/).
Share and Cite
Michalczyk, M.; Zierkiewicz, W.; Wysokiński, R.; Scheiner, S. Theoretical Studies of IR and NMR Spectral Changes Induced by Sigma-Hole Hydrogen, Halogen, Chalcogen, Pnicogen, and Tetrel Bonds in a Model Protein Environment. Molecules 2019, 24, 3329. https://doi.org/10.3390/molecules24183329
Michalczyk M, Zierkiewicz W, Wysokiński R, Scheiner S. Theoretical Studies of IR and NMR Spectral Changes Induced by Sigma-Hole Hydrogen, Halogen, Chalcogen, Pnicogen, and Tetrel Bonds in a Model Protein Environment. Molecules. 2019; 24(18):3329. https://doi.org/10.3390/molecules24183329
Chicago/Turabian StyleMichalczyk, Mariusz, Wiktor Zierkiewicz, Rafał Wysokiński, and Steve Scheiner. 2019. "Theoretical Studies of IR and NMR Spectral Changes Induced by Sigma-Hole Hydrogen, Halogen, Chalcogen, Pnicogen, and Tetrel Bonds in a Model Protein Environment" Molecules 24, no. 18: 3329. https://doi.org/10.3390/molecules24183329
APA StyleMichalczyk, M., Zierkiewicz, W., Wysokiński, R., & Scheiner, S. (2019). Theoretical Studies of IR and NMR Spectral Changes Induced by Sigma-Hole Hydrogen, Halogen, Chalcogen, Pnicogen, and Tetrel Bonds in a Model Protein Environment. Molecules, 24(18), 3329. https://doi.org/10.3390/molecules24183329