
Assessment of Antifouling Potential of Novel Transparent Sol Gel Coatings for Application in the Marine Environment


Abstract
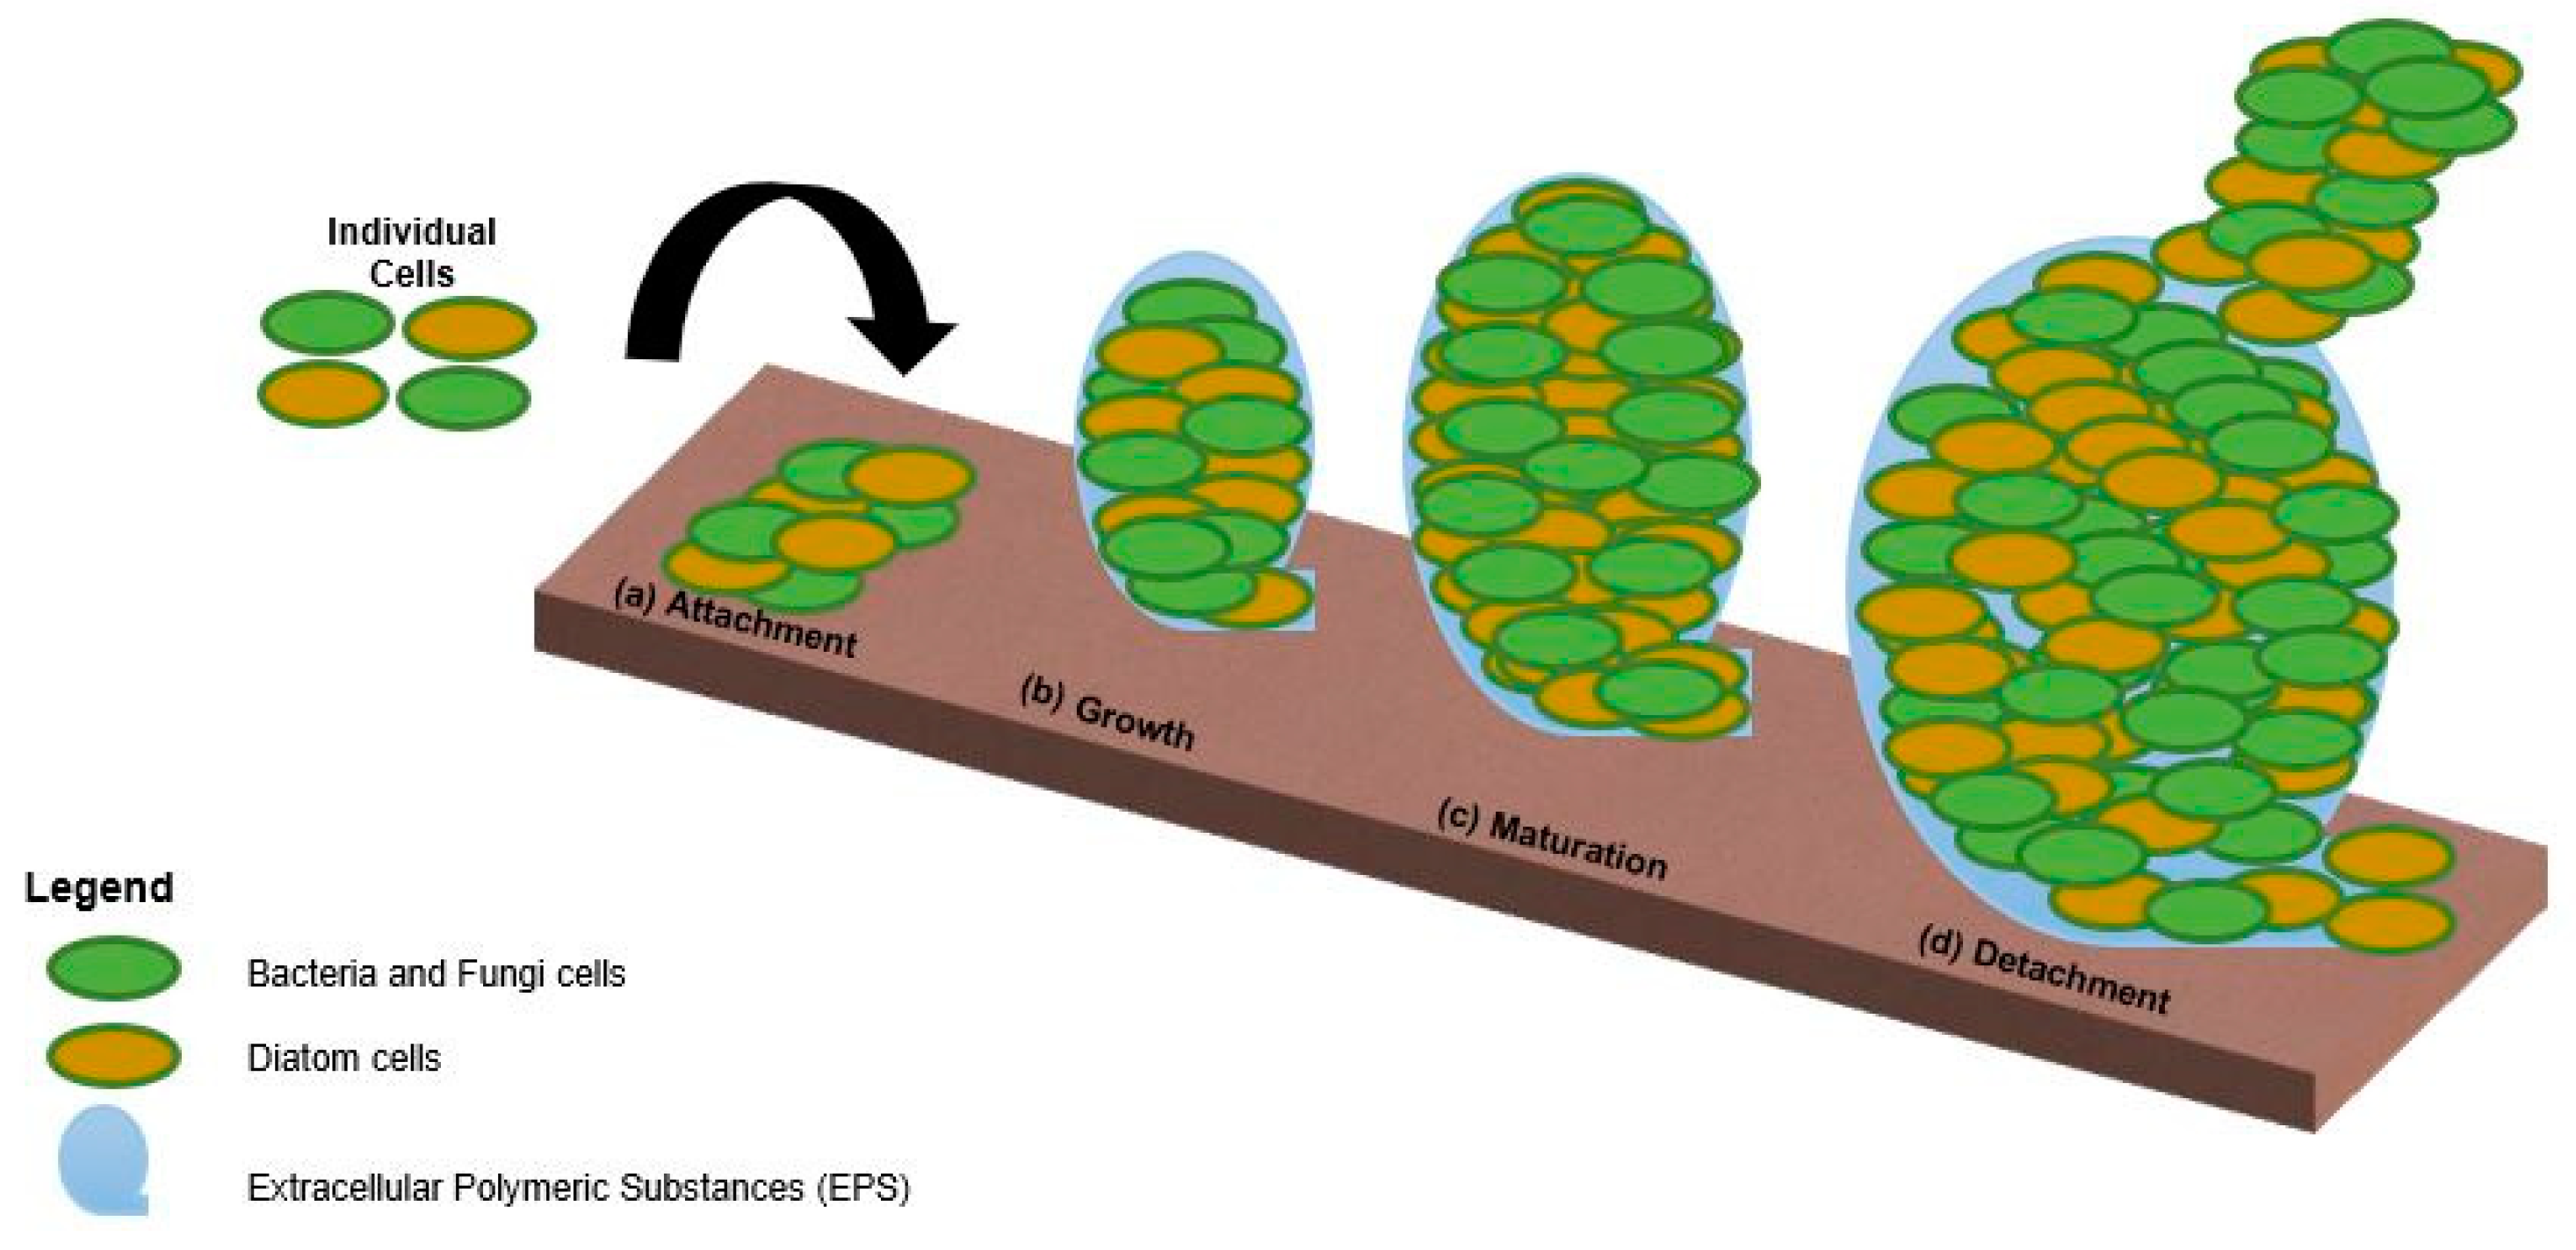
1. Introduction
2. Results and Discussion
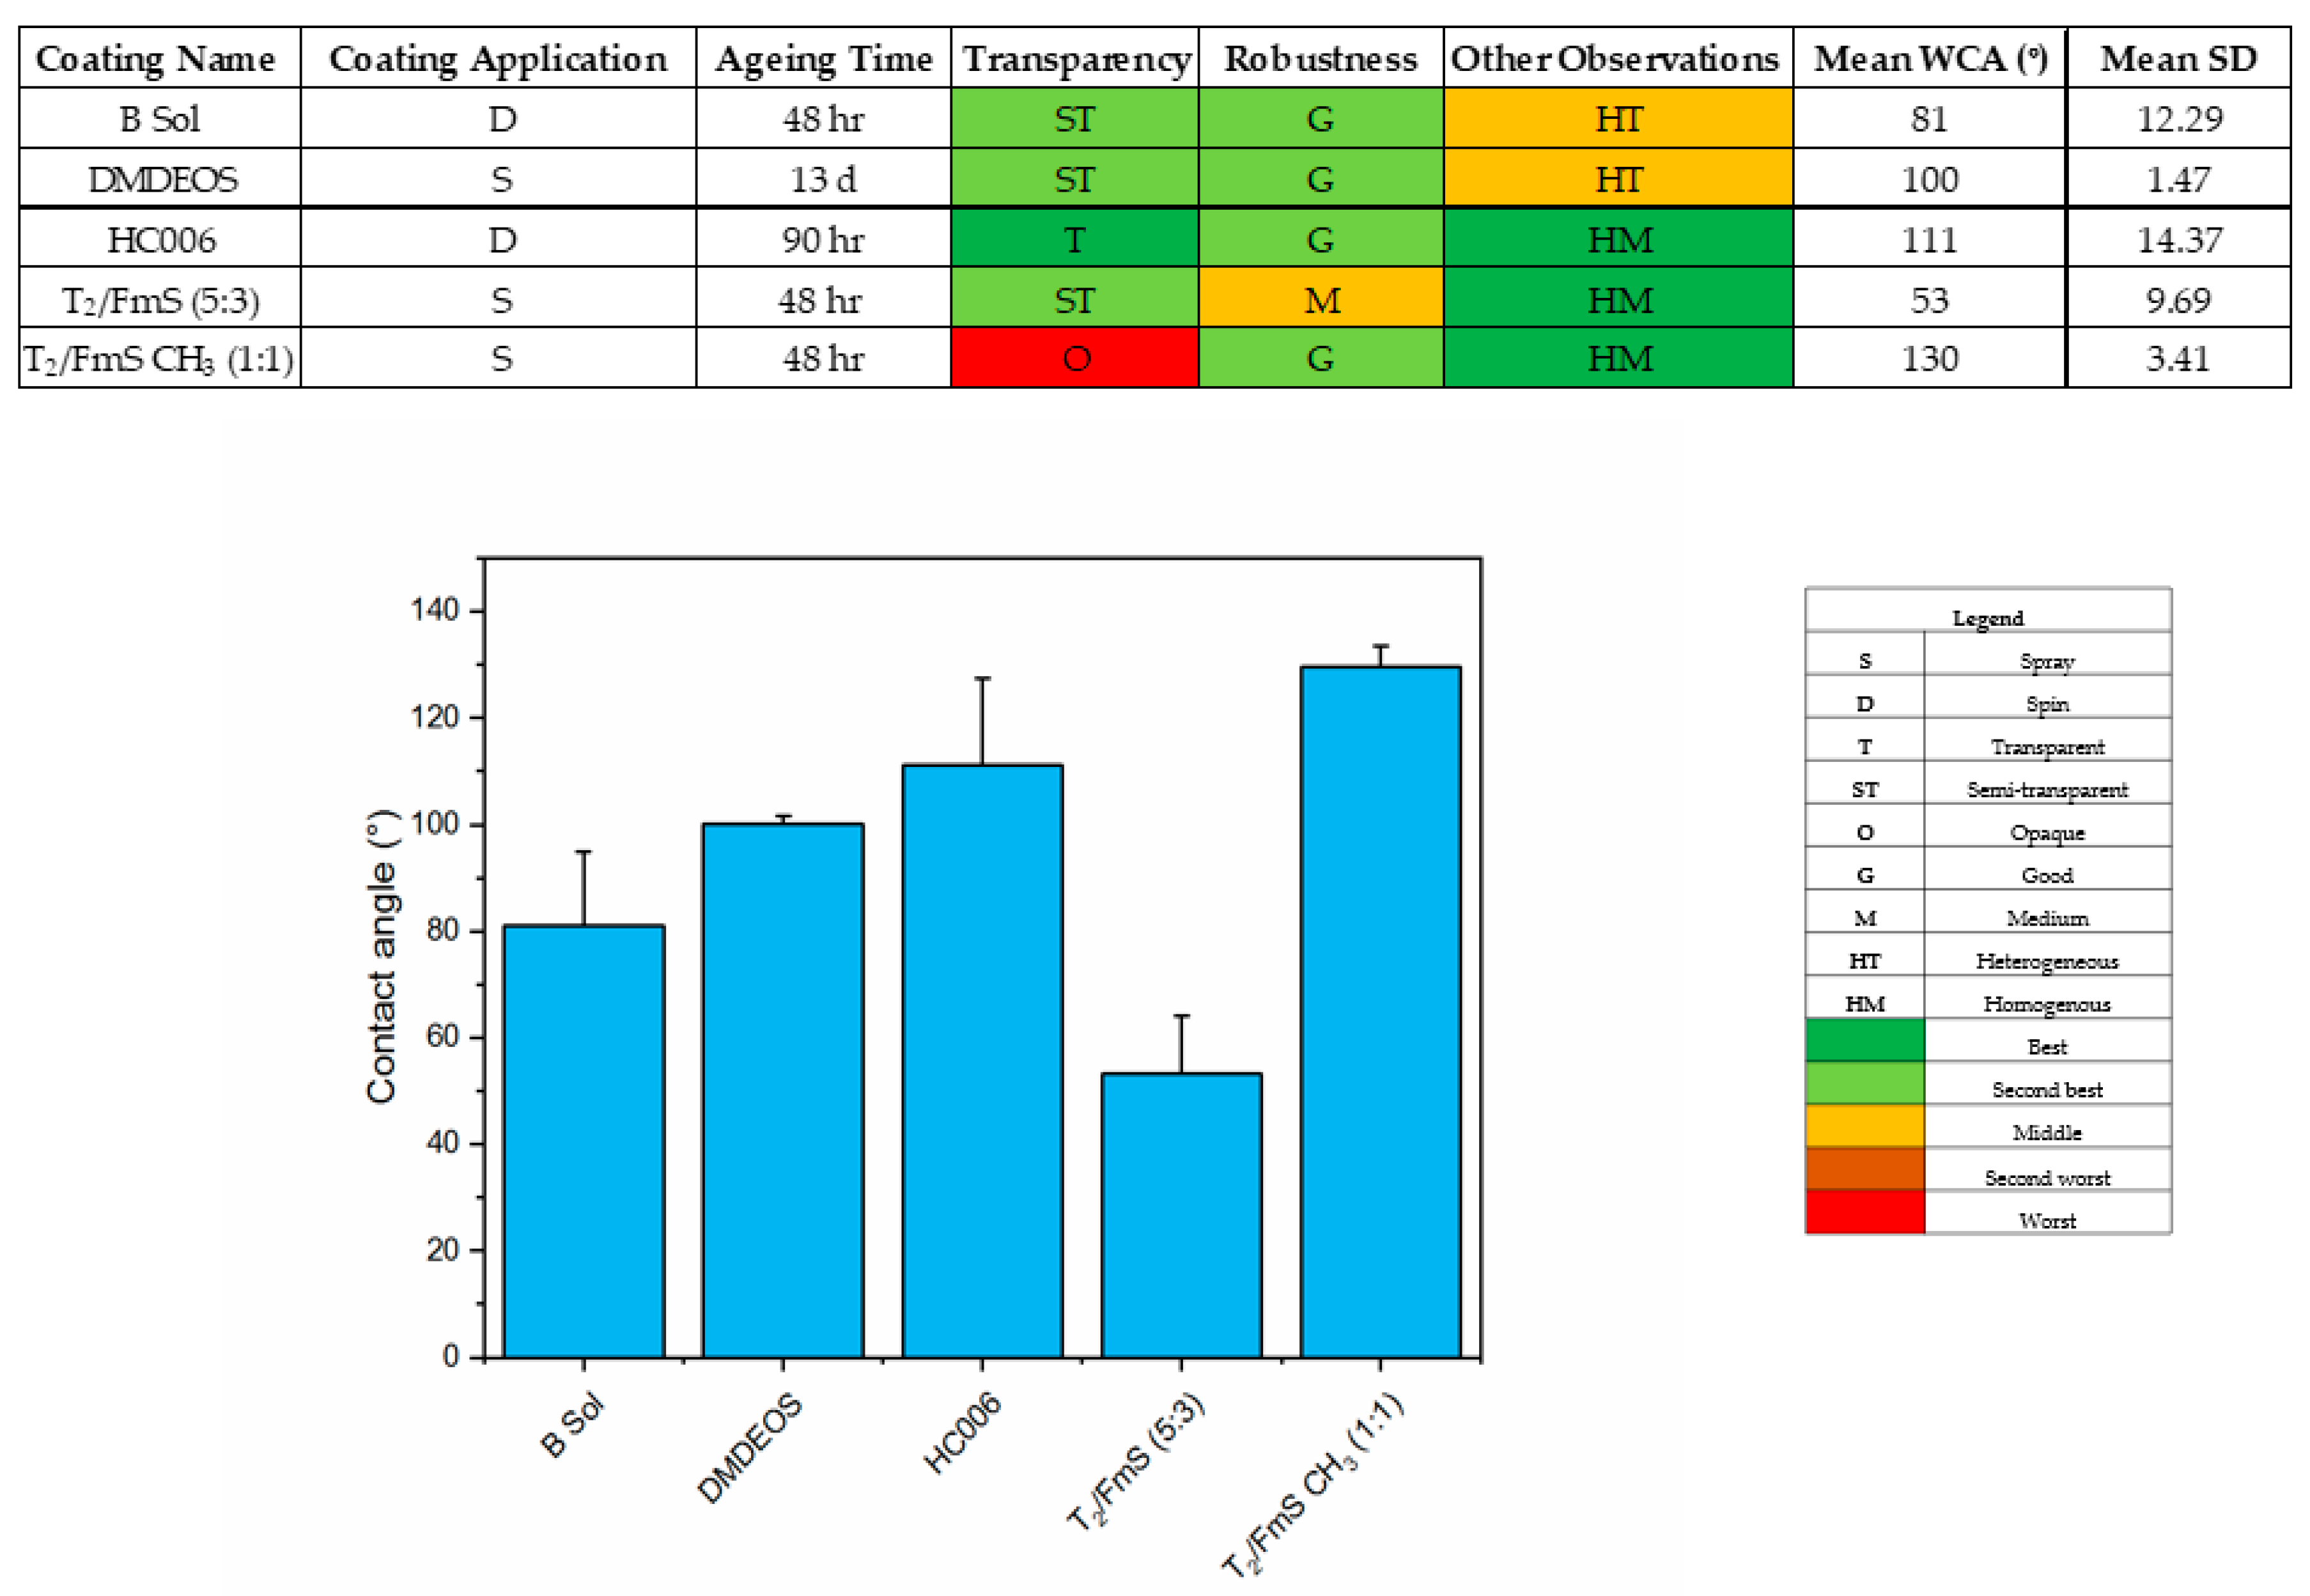
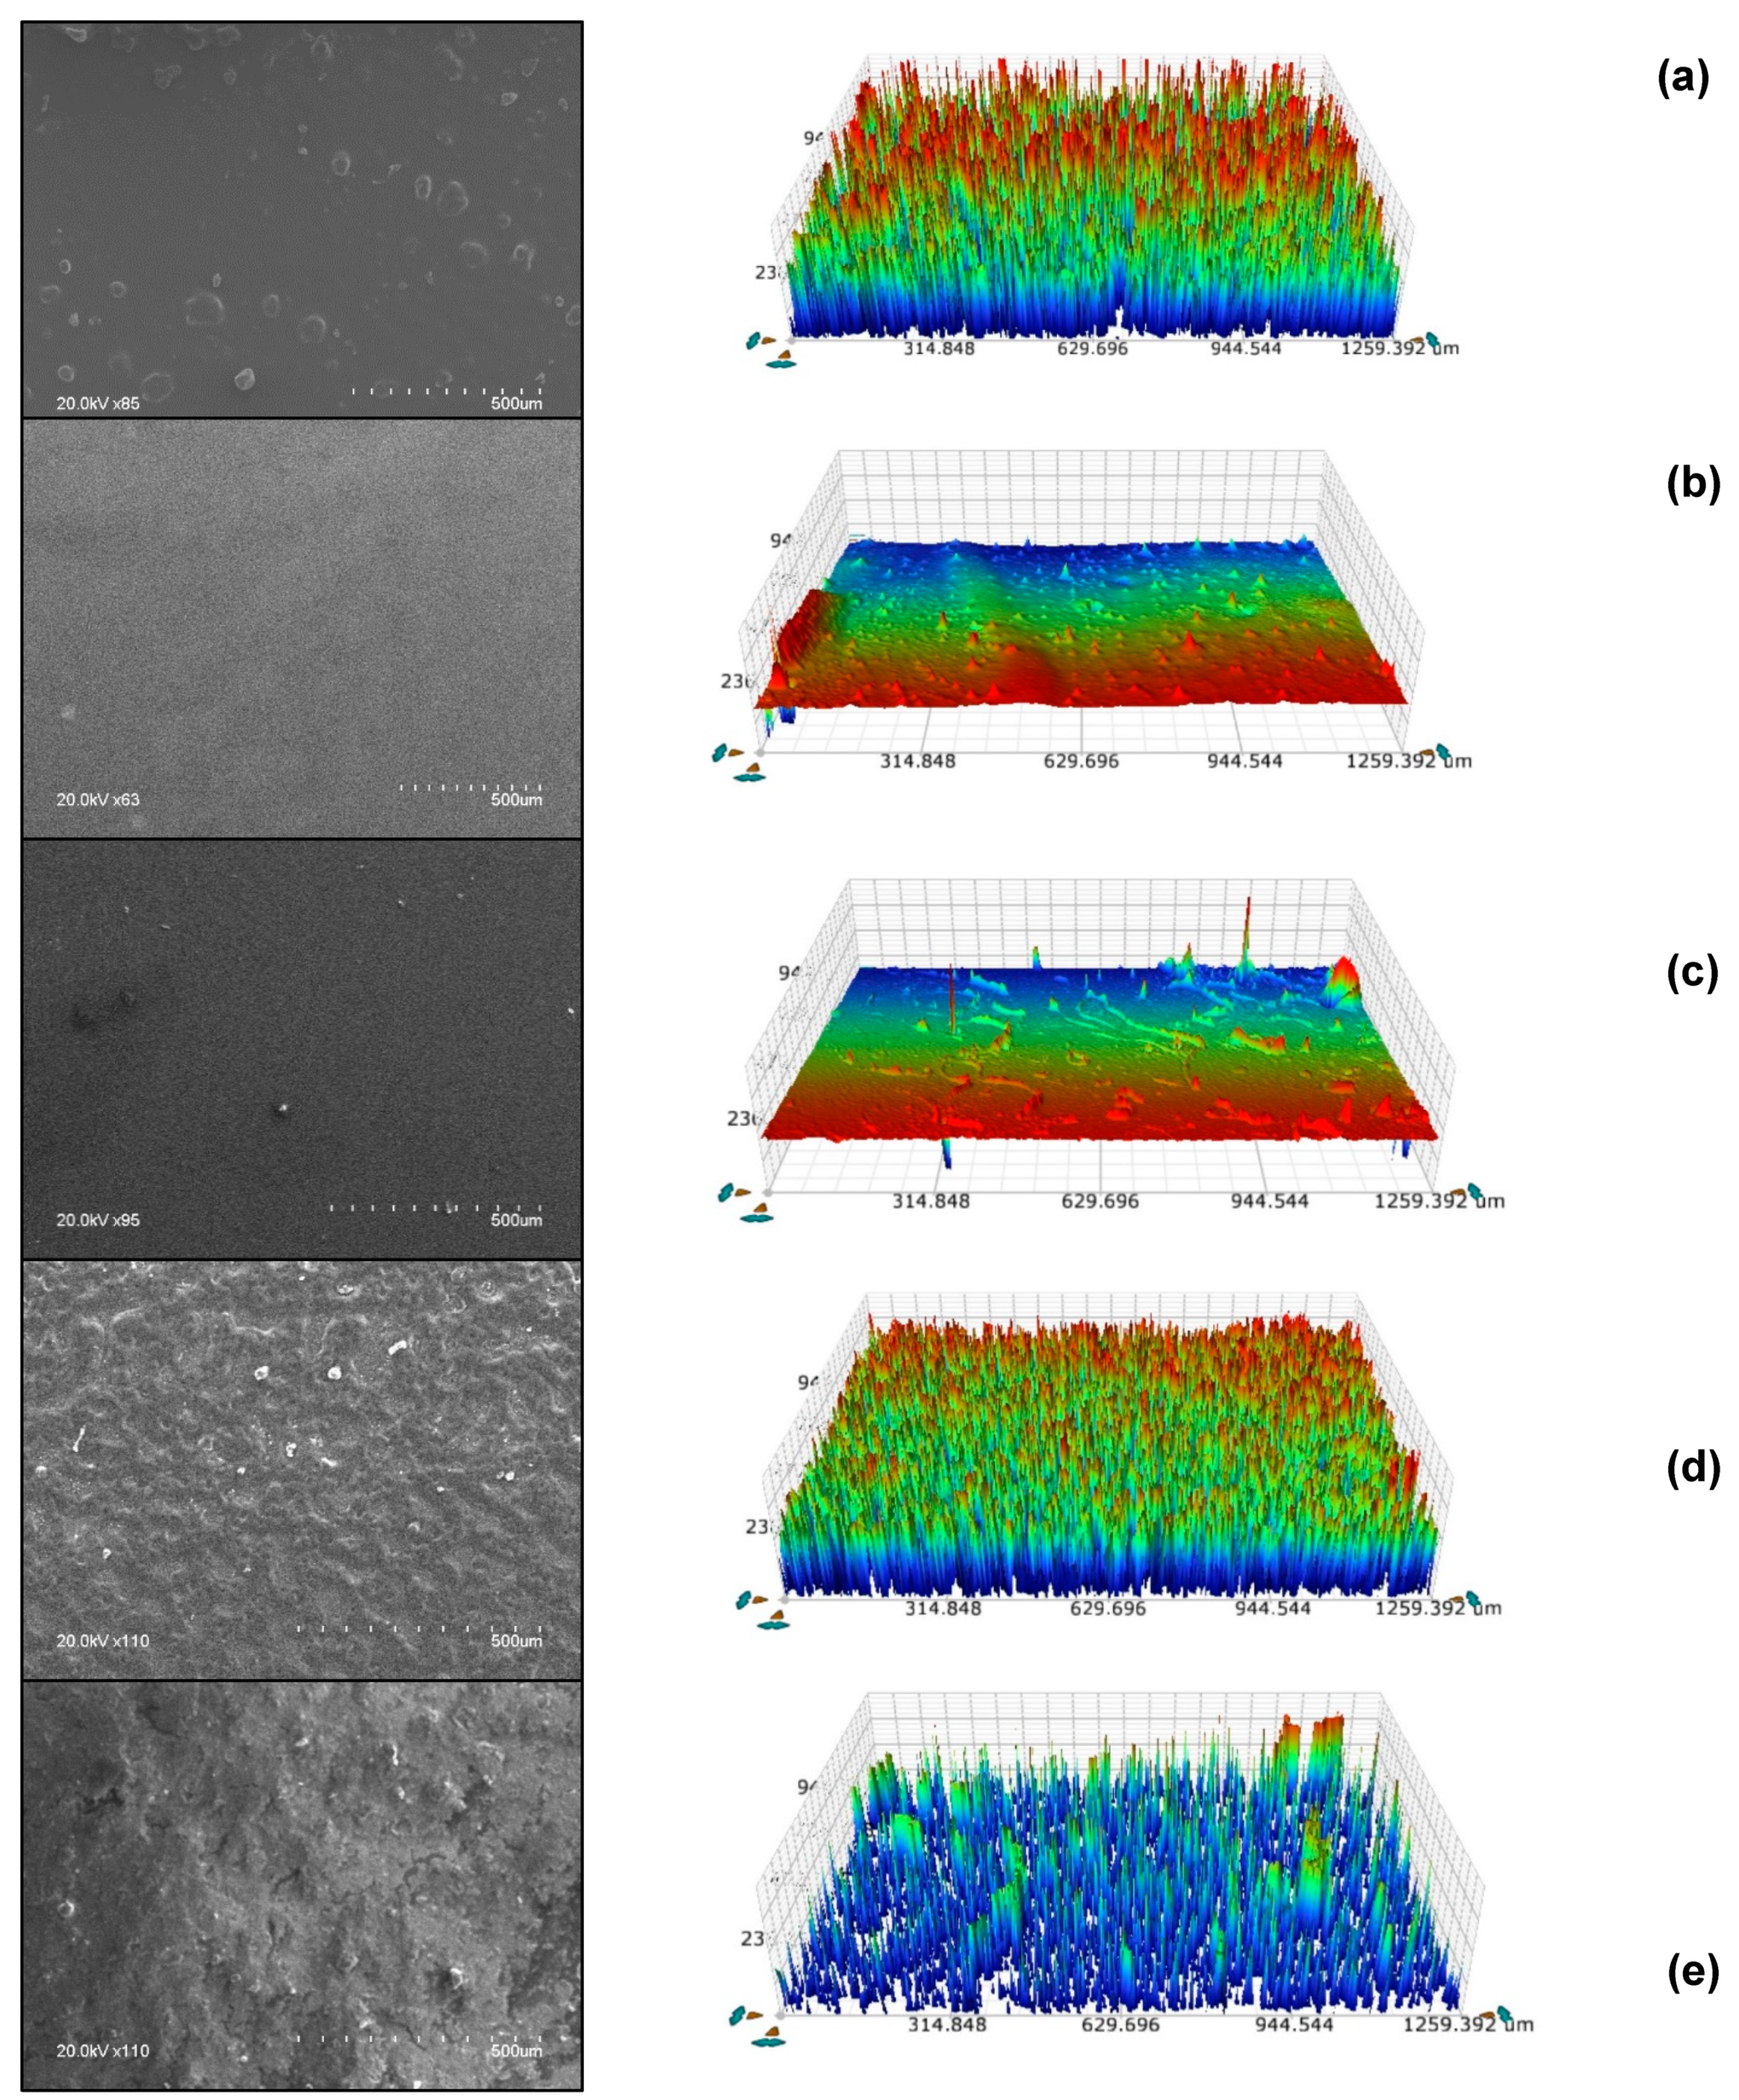
2.1. Characterization of Developed Coatings
2.2. Biofouling Assessment
2.2.1. Microfouling Assessment
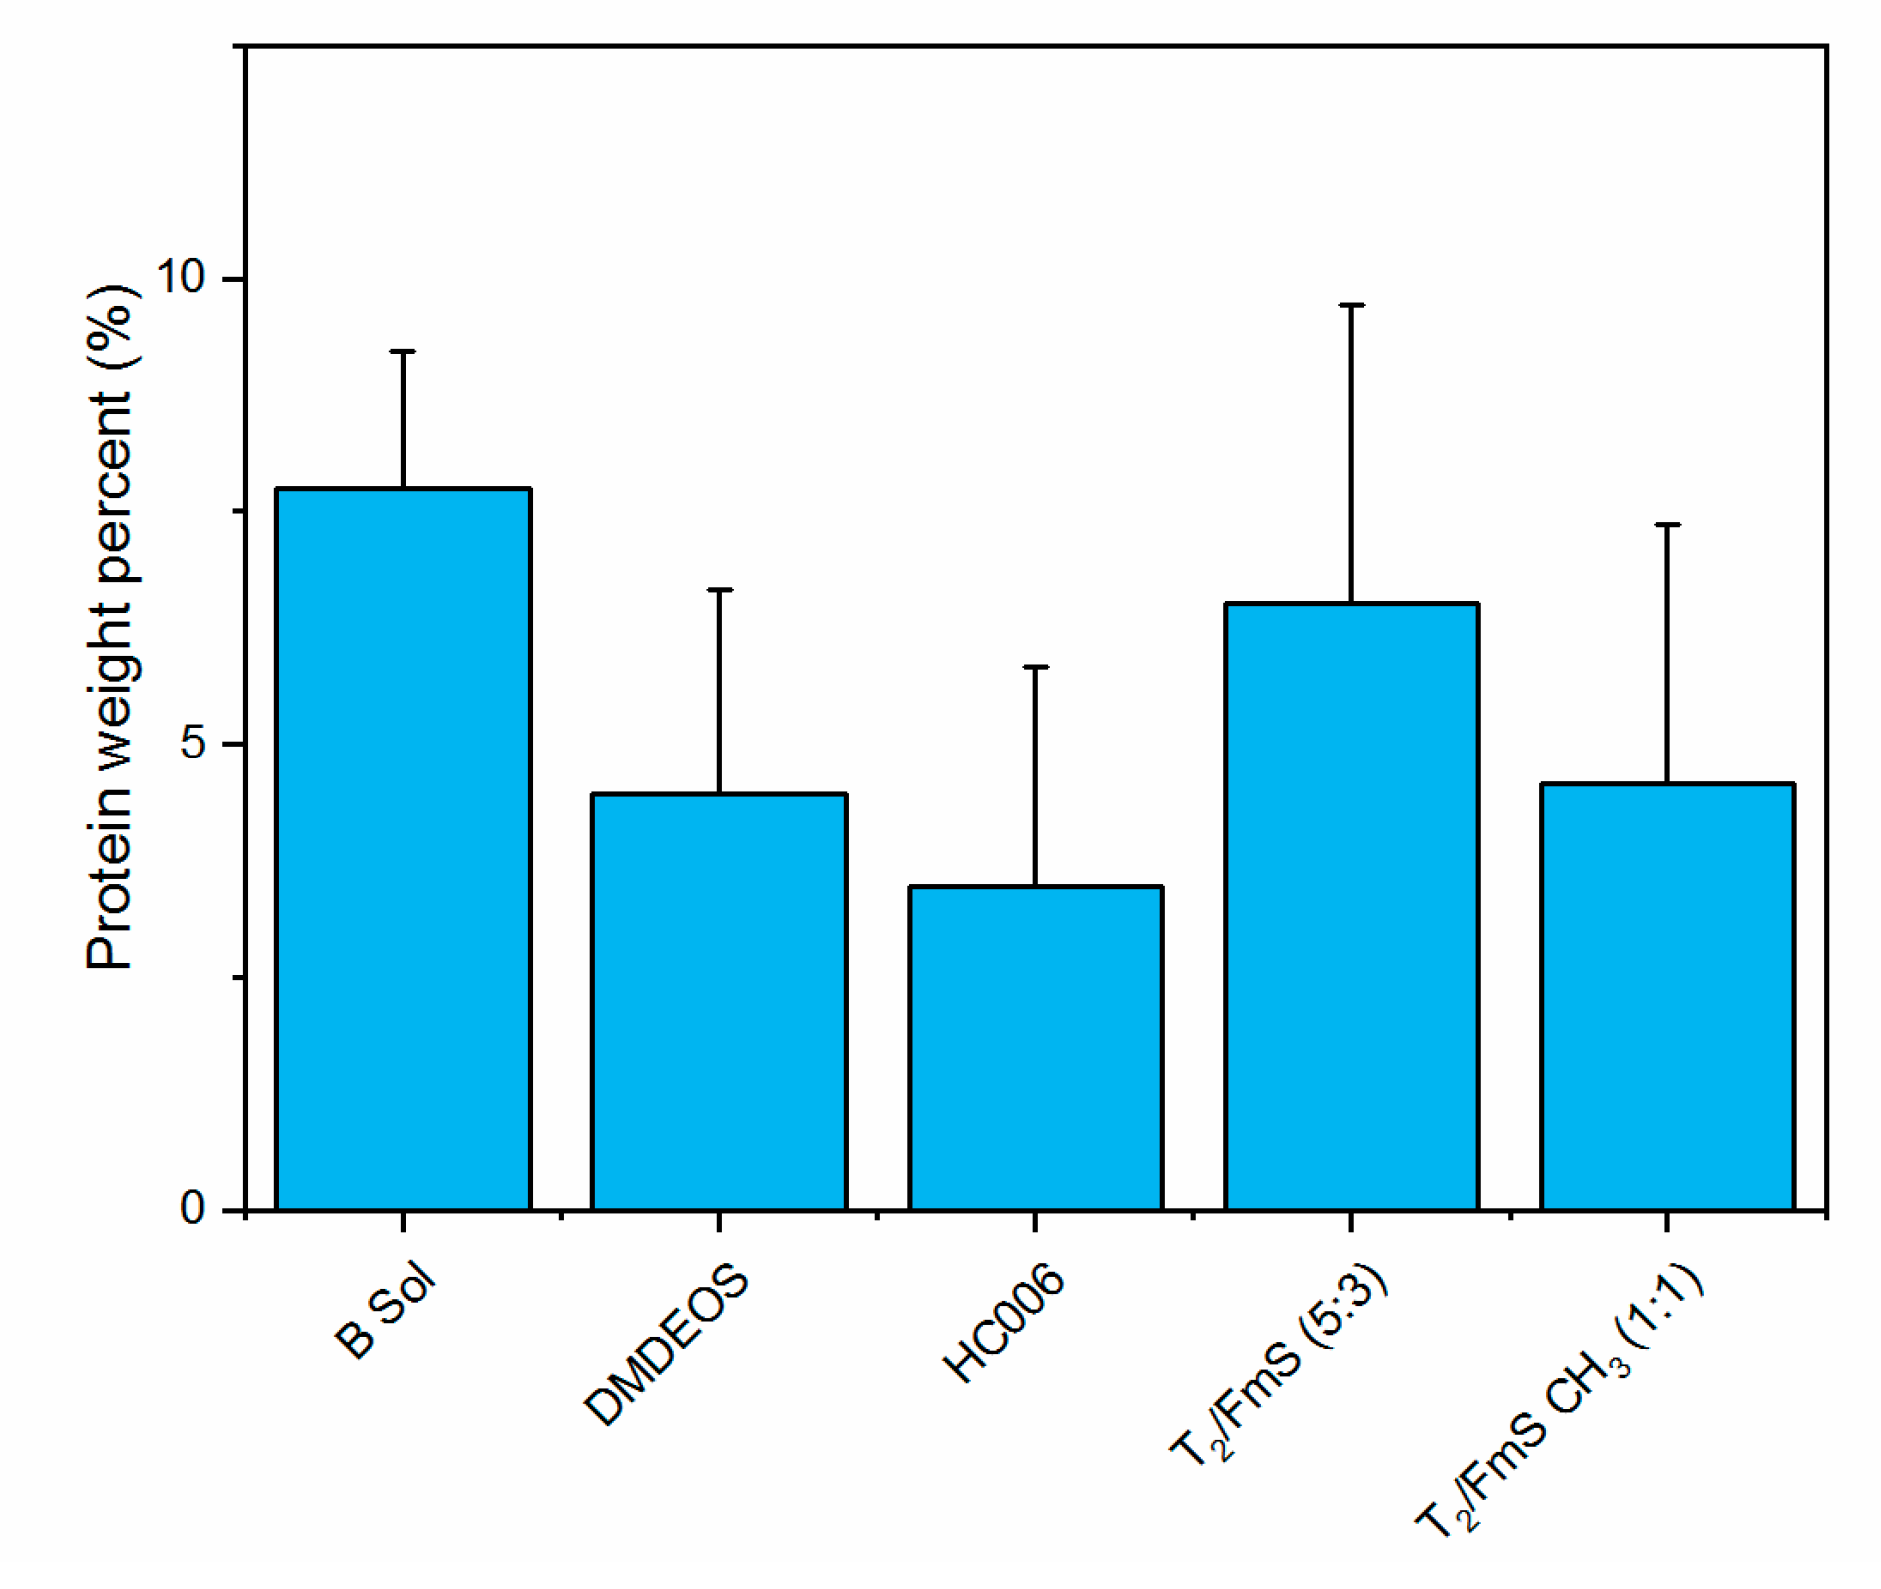
2.2.2. Quantification of Protein by Lowry Assay
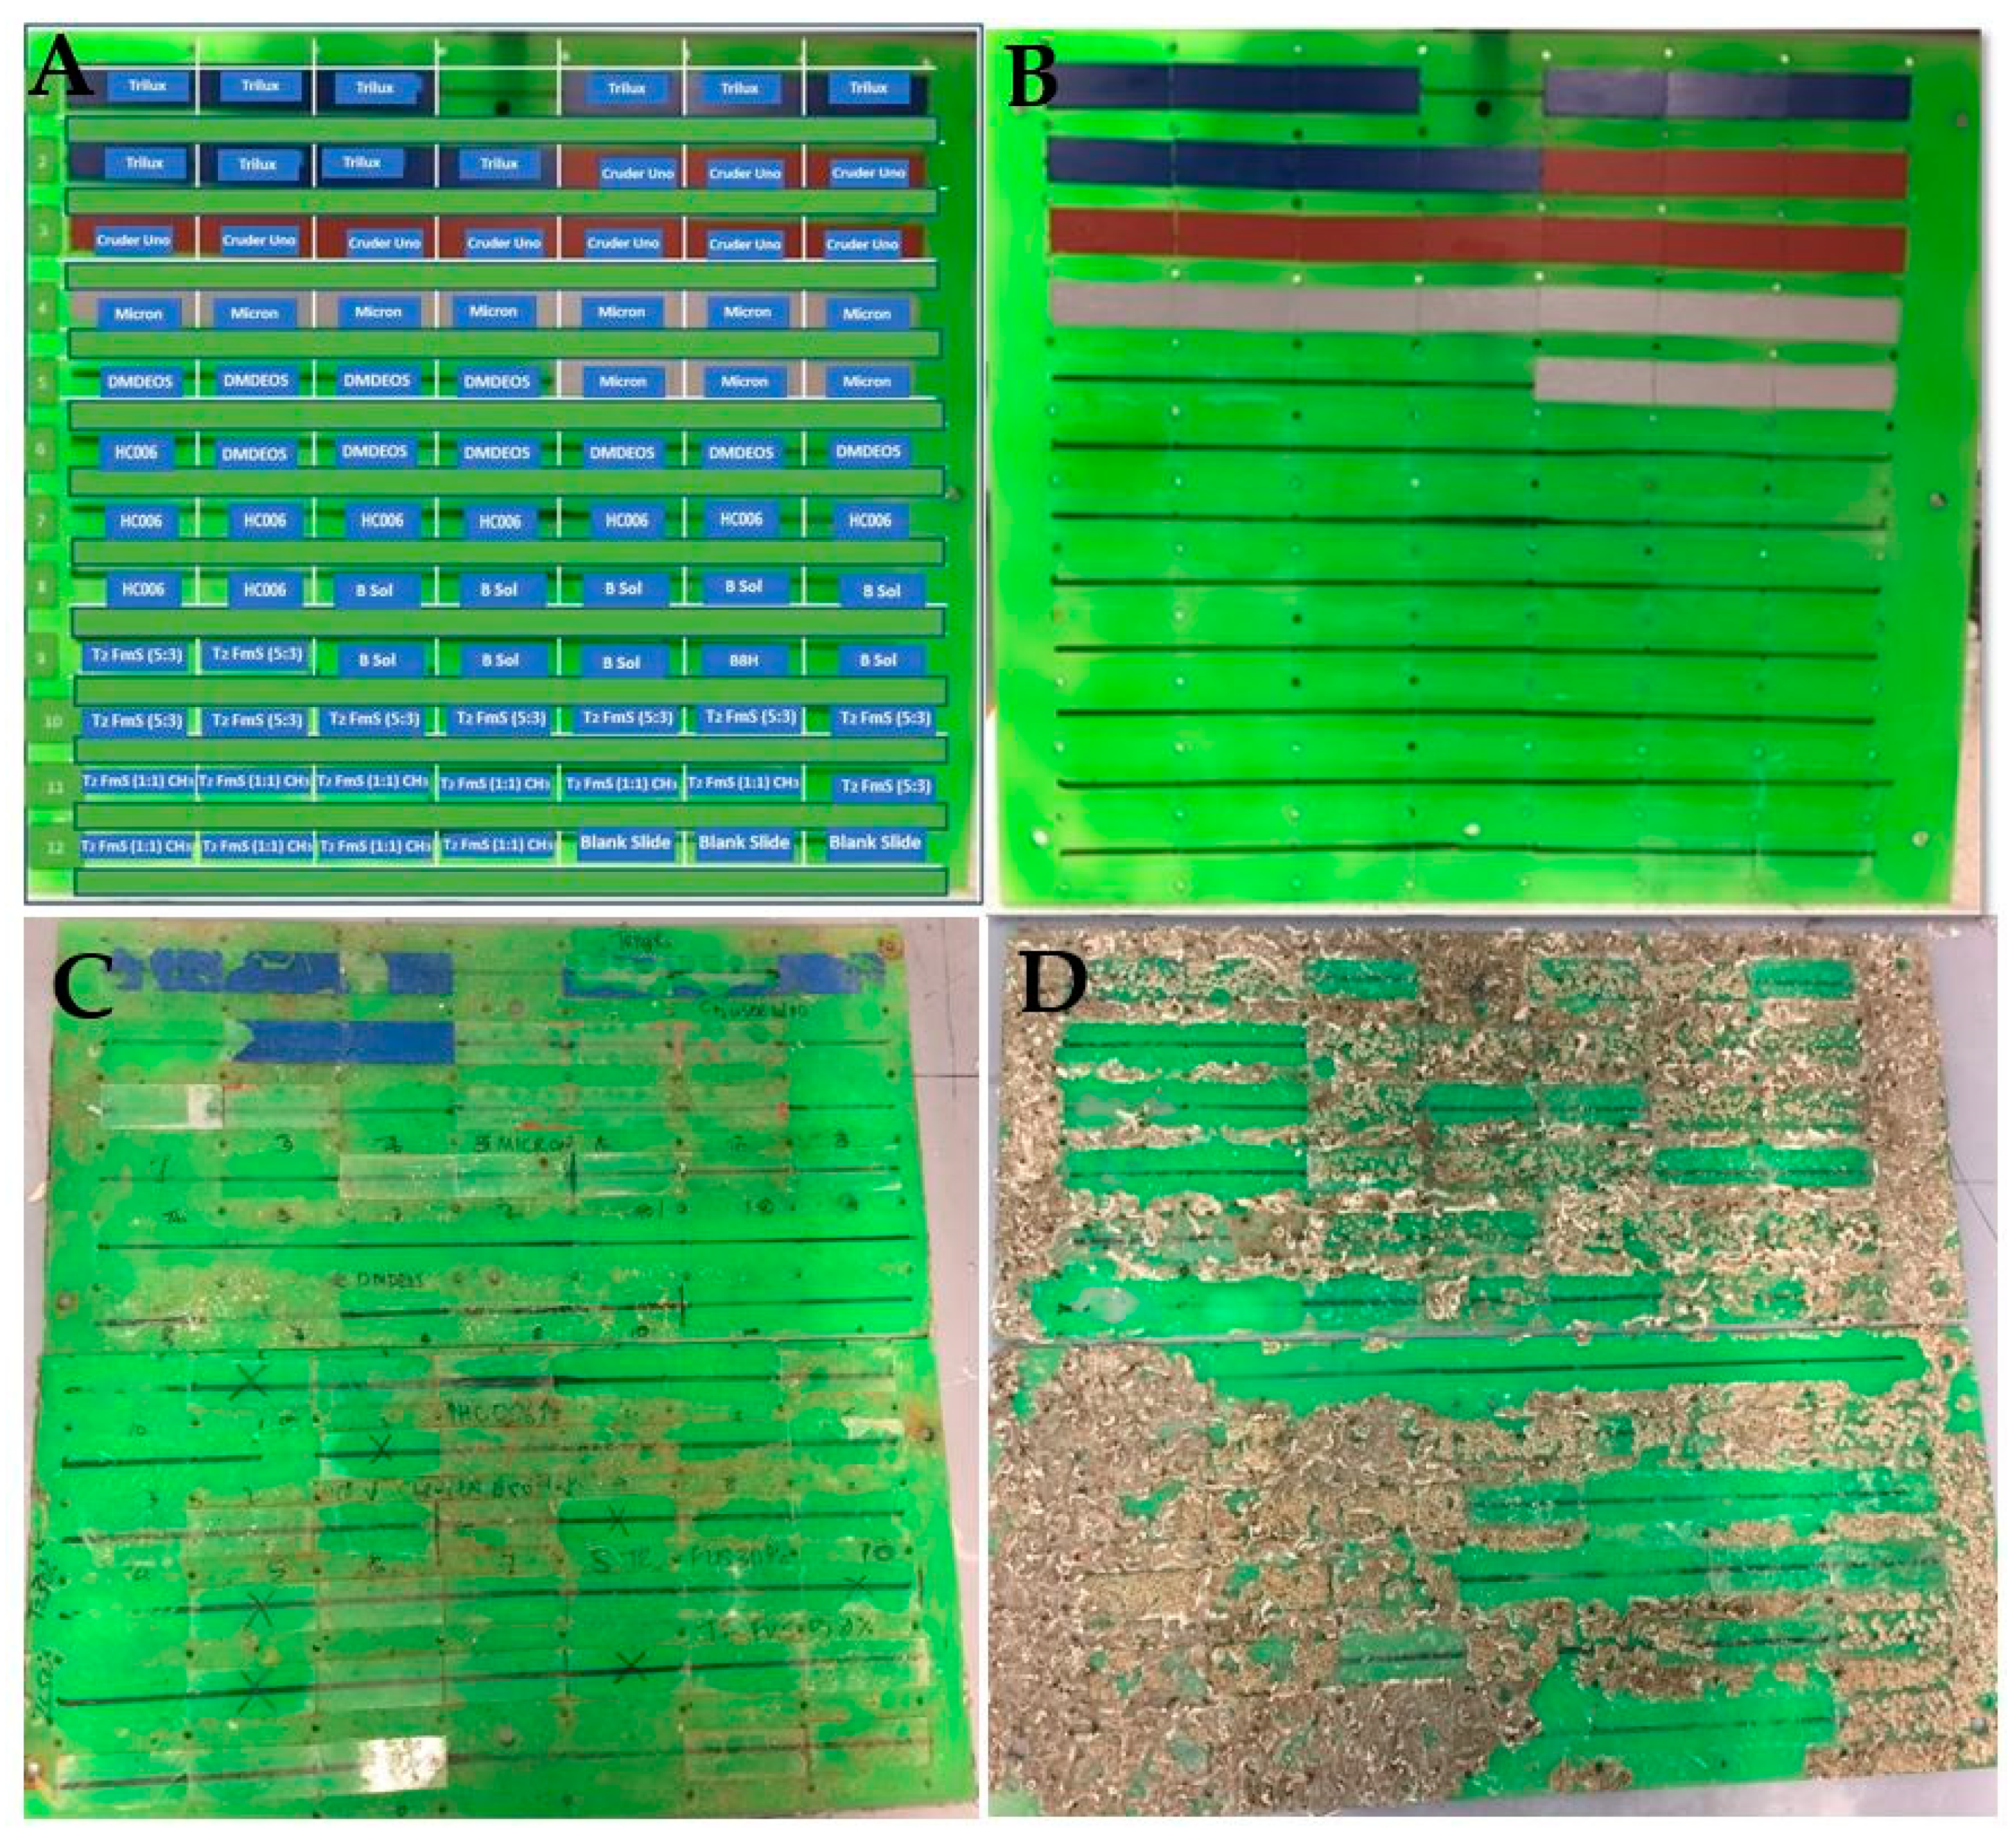
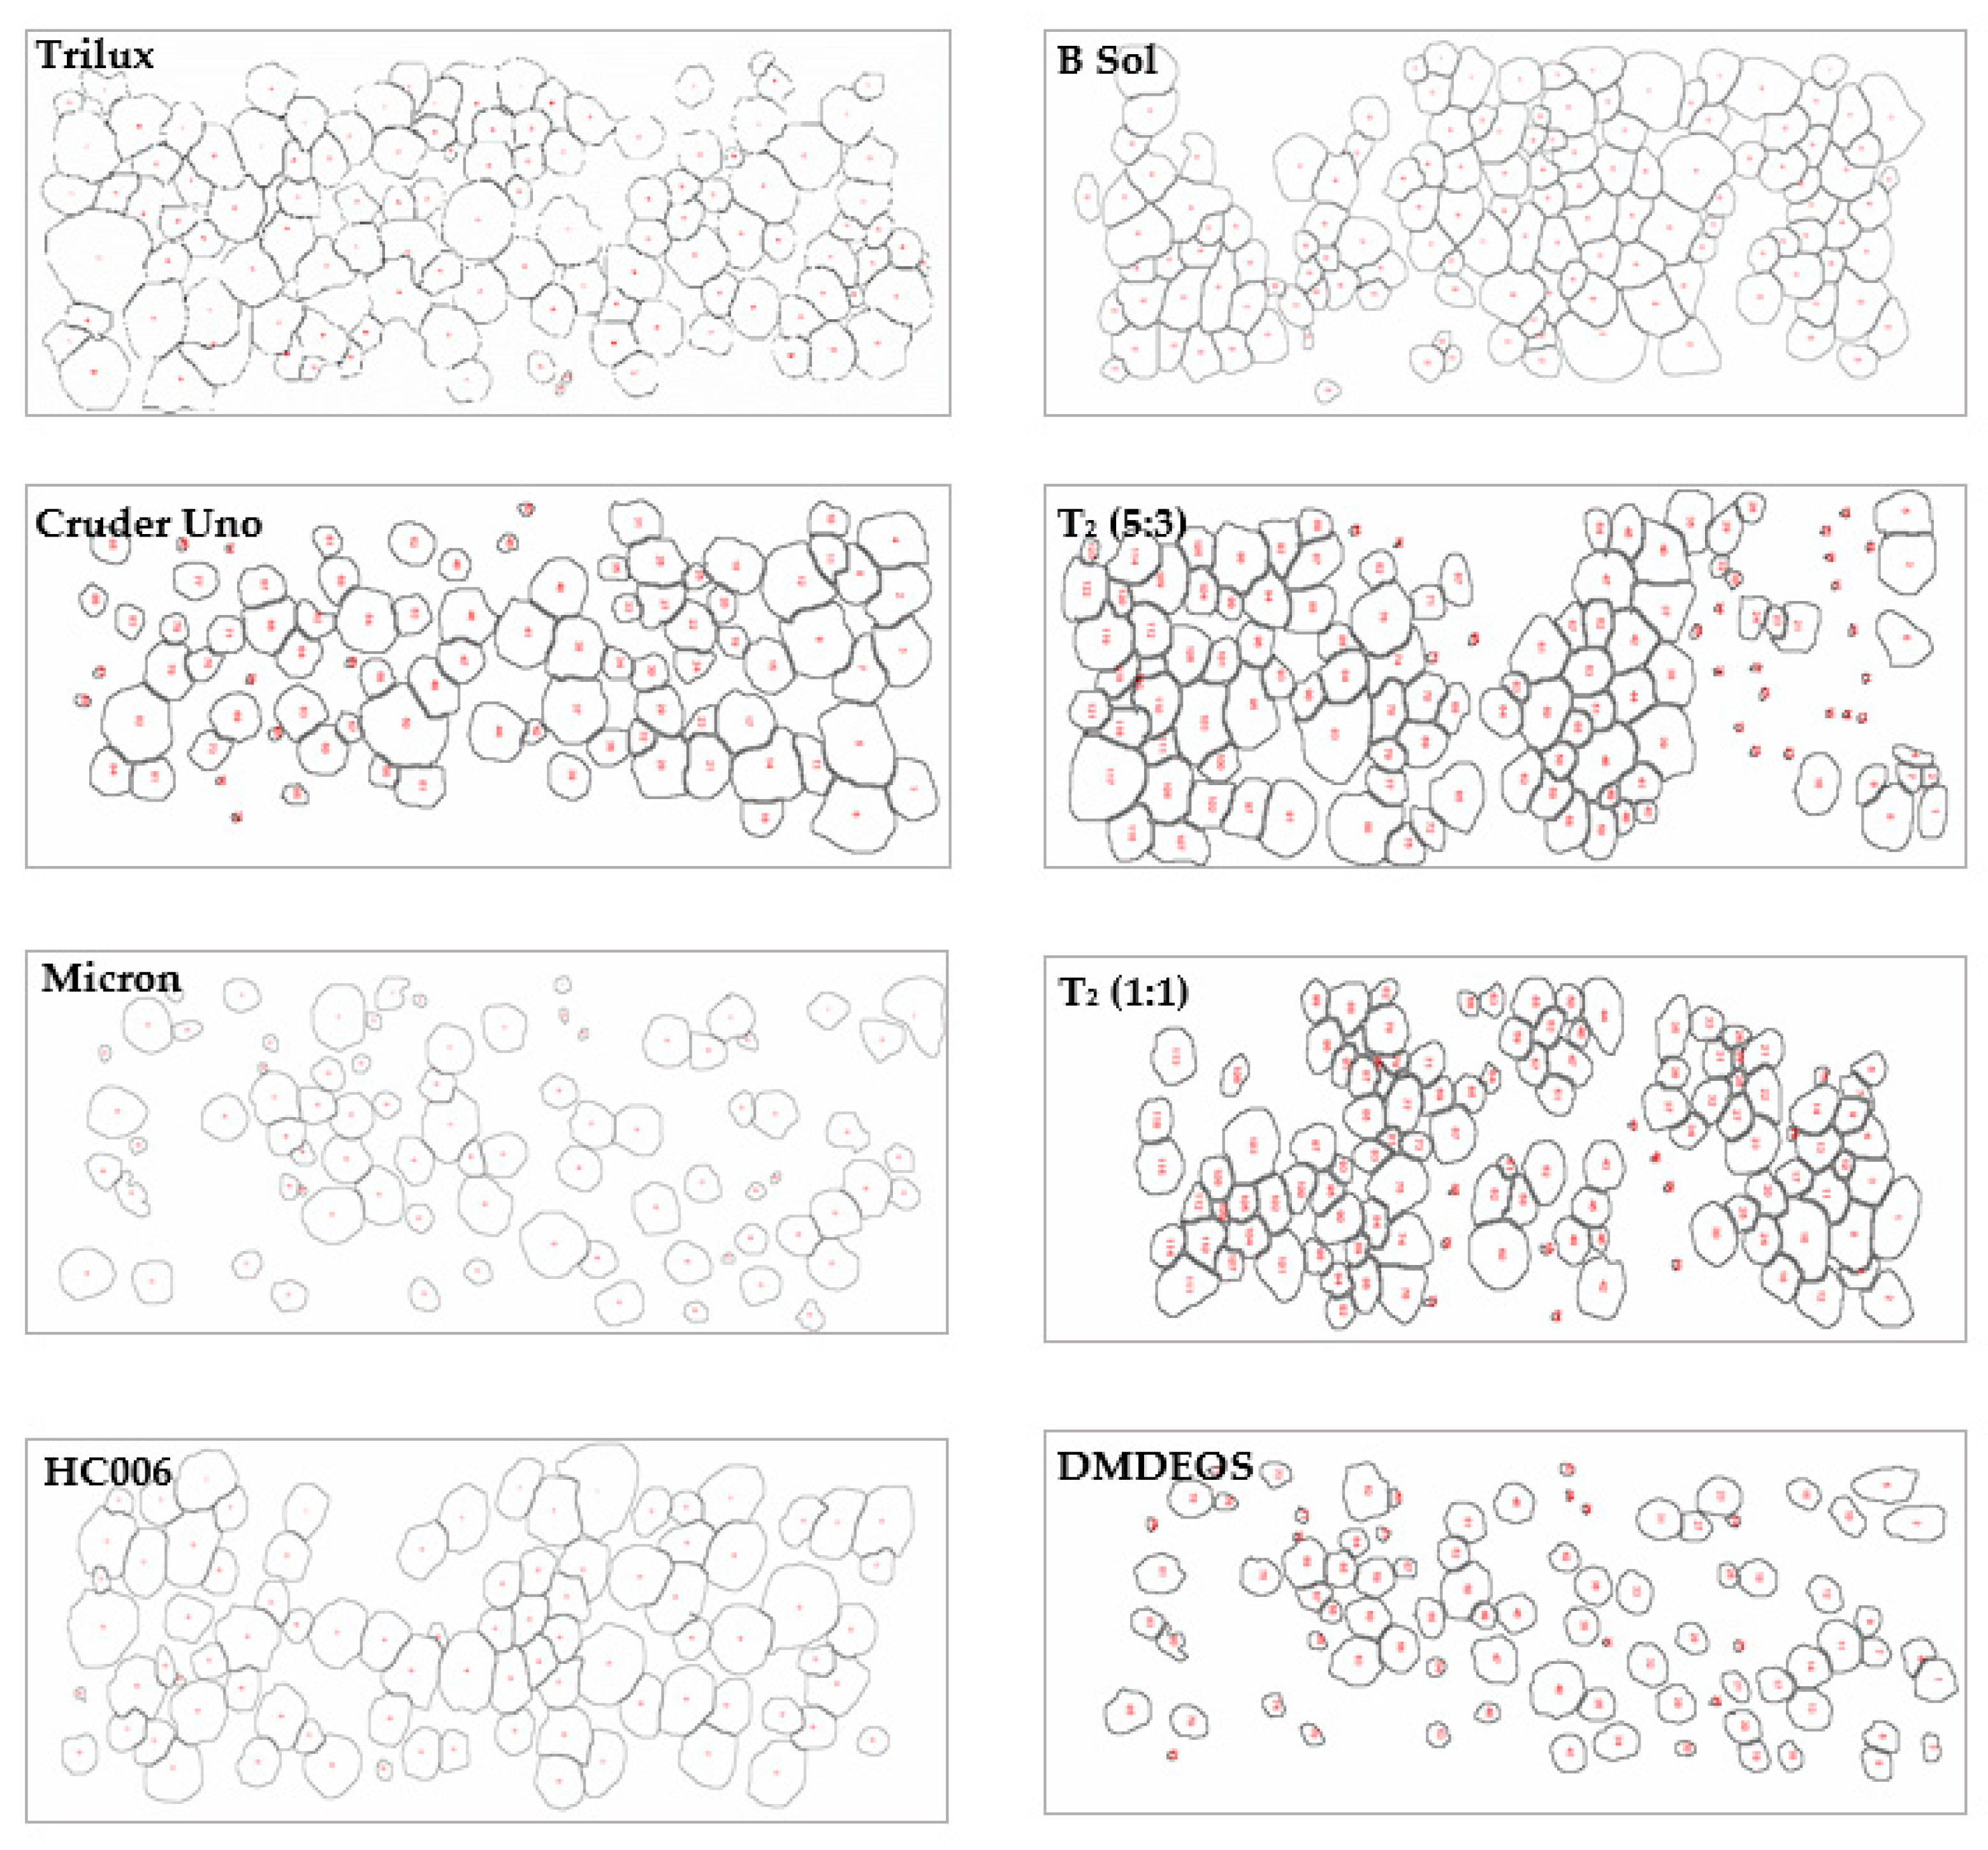
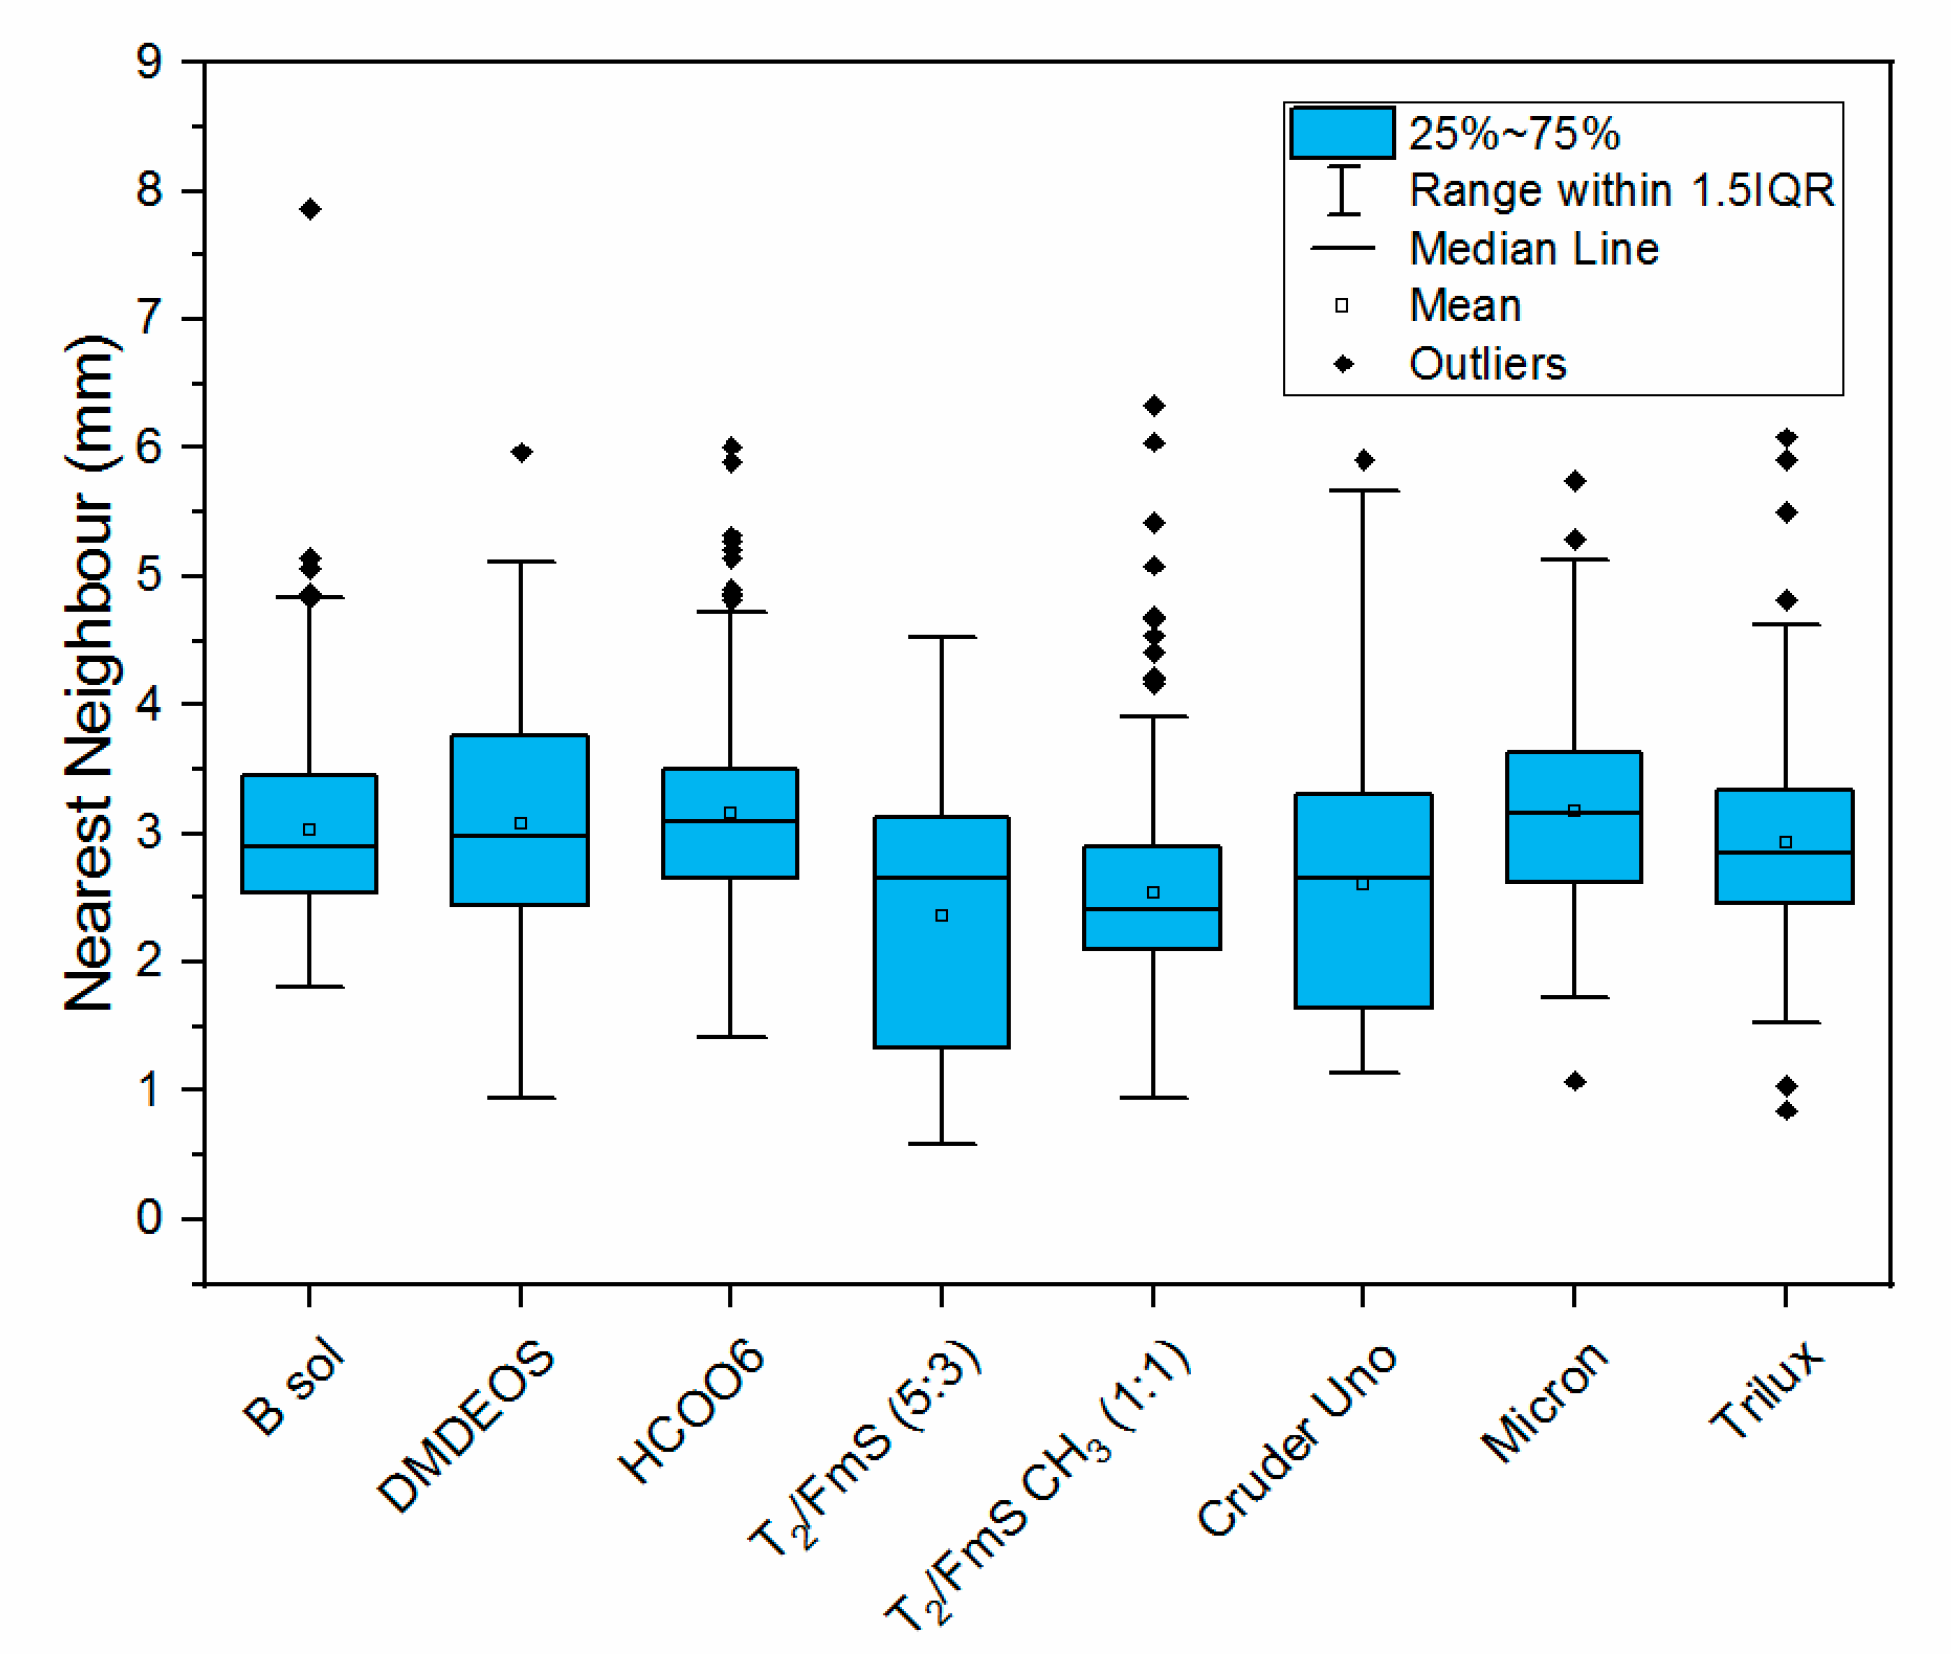
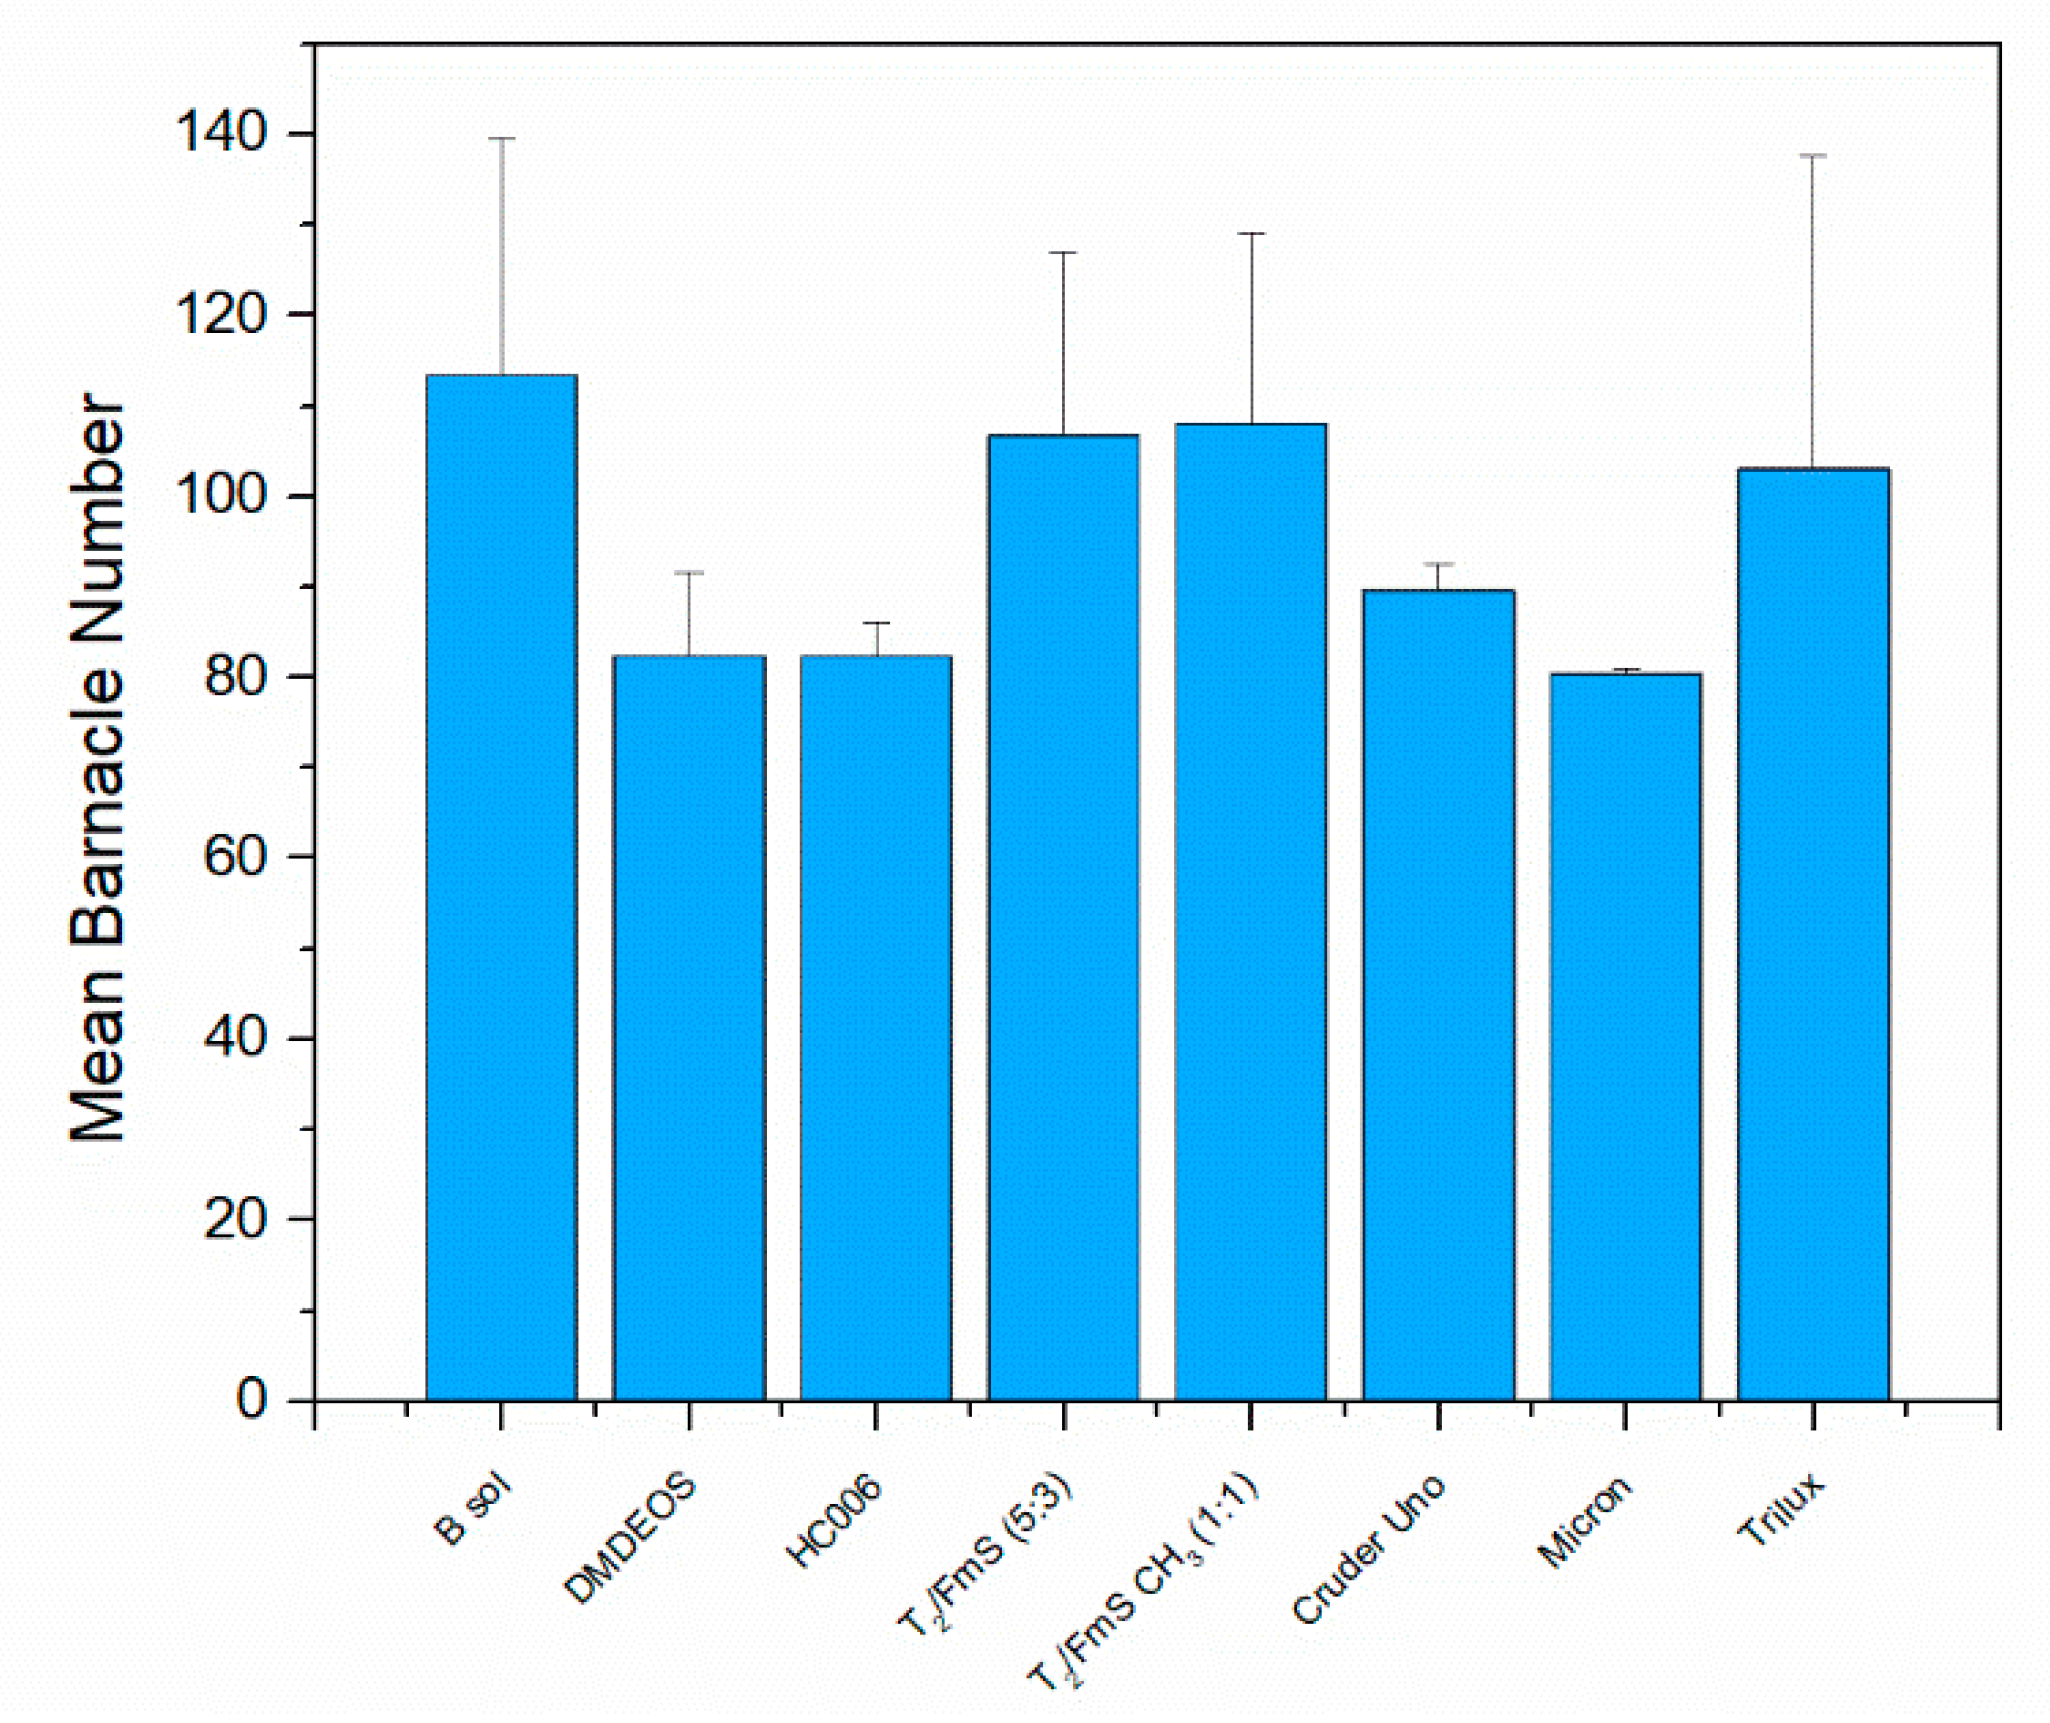
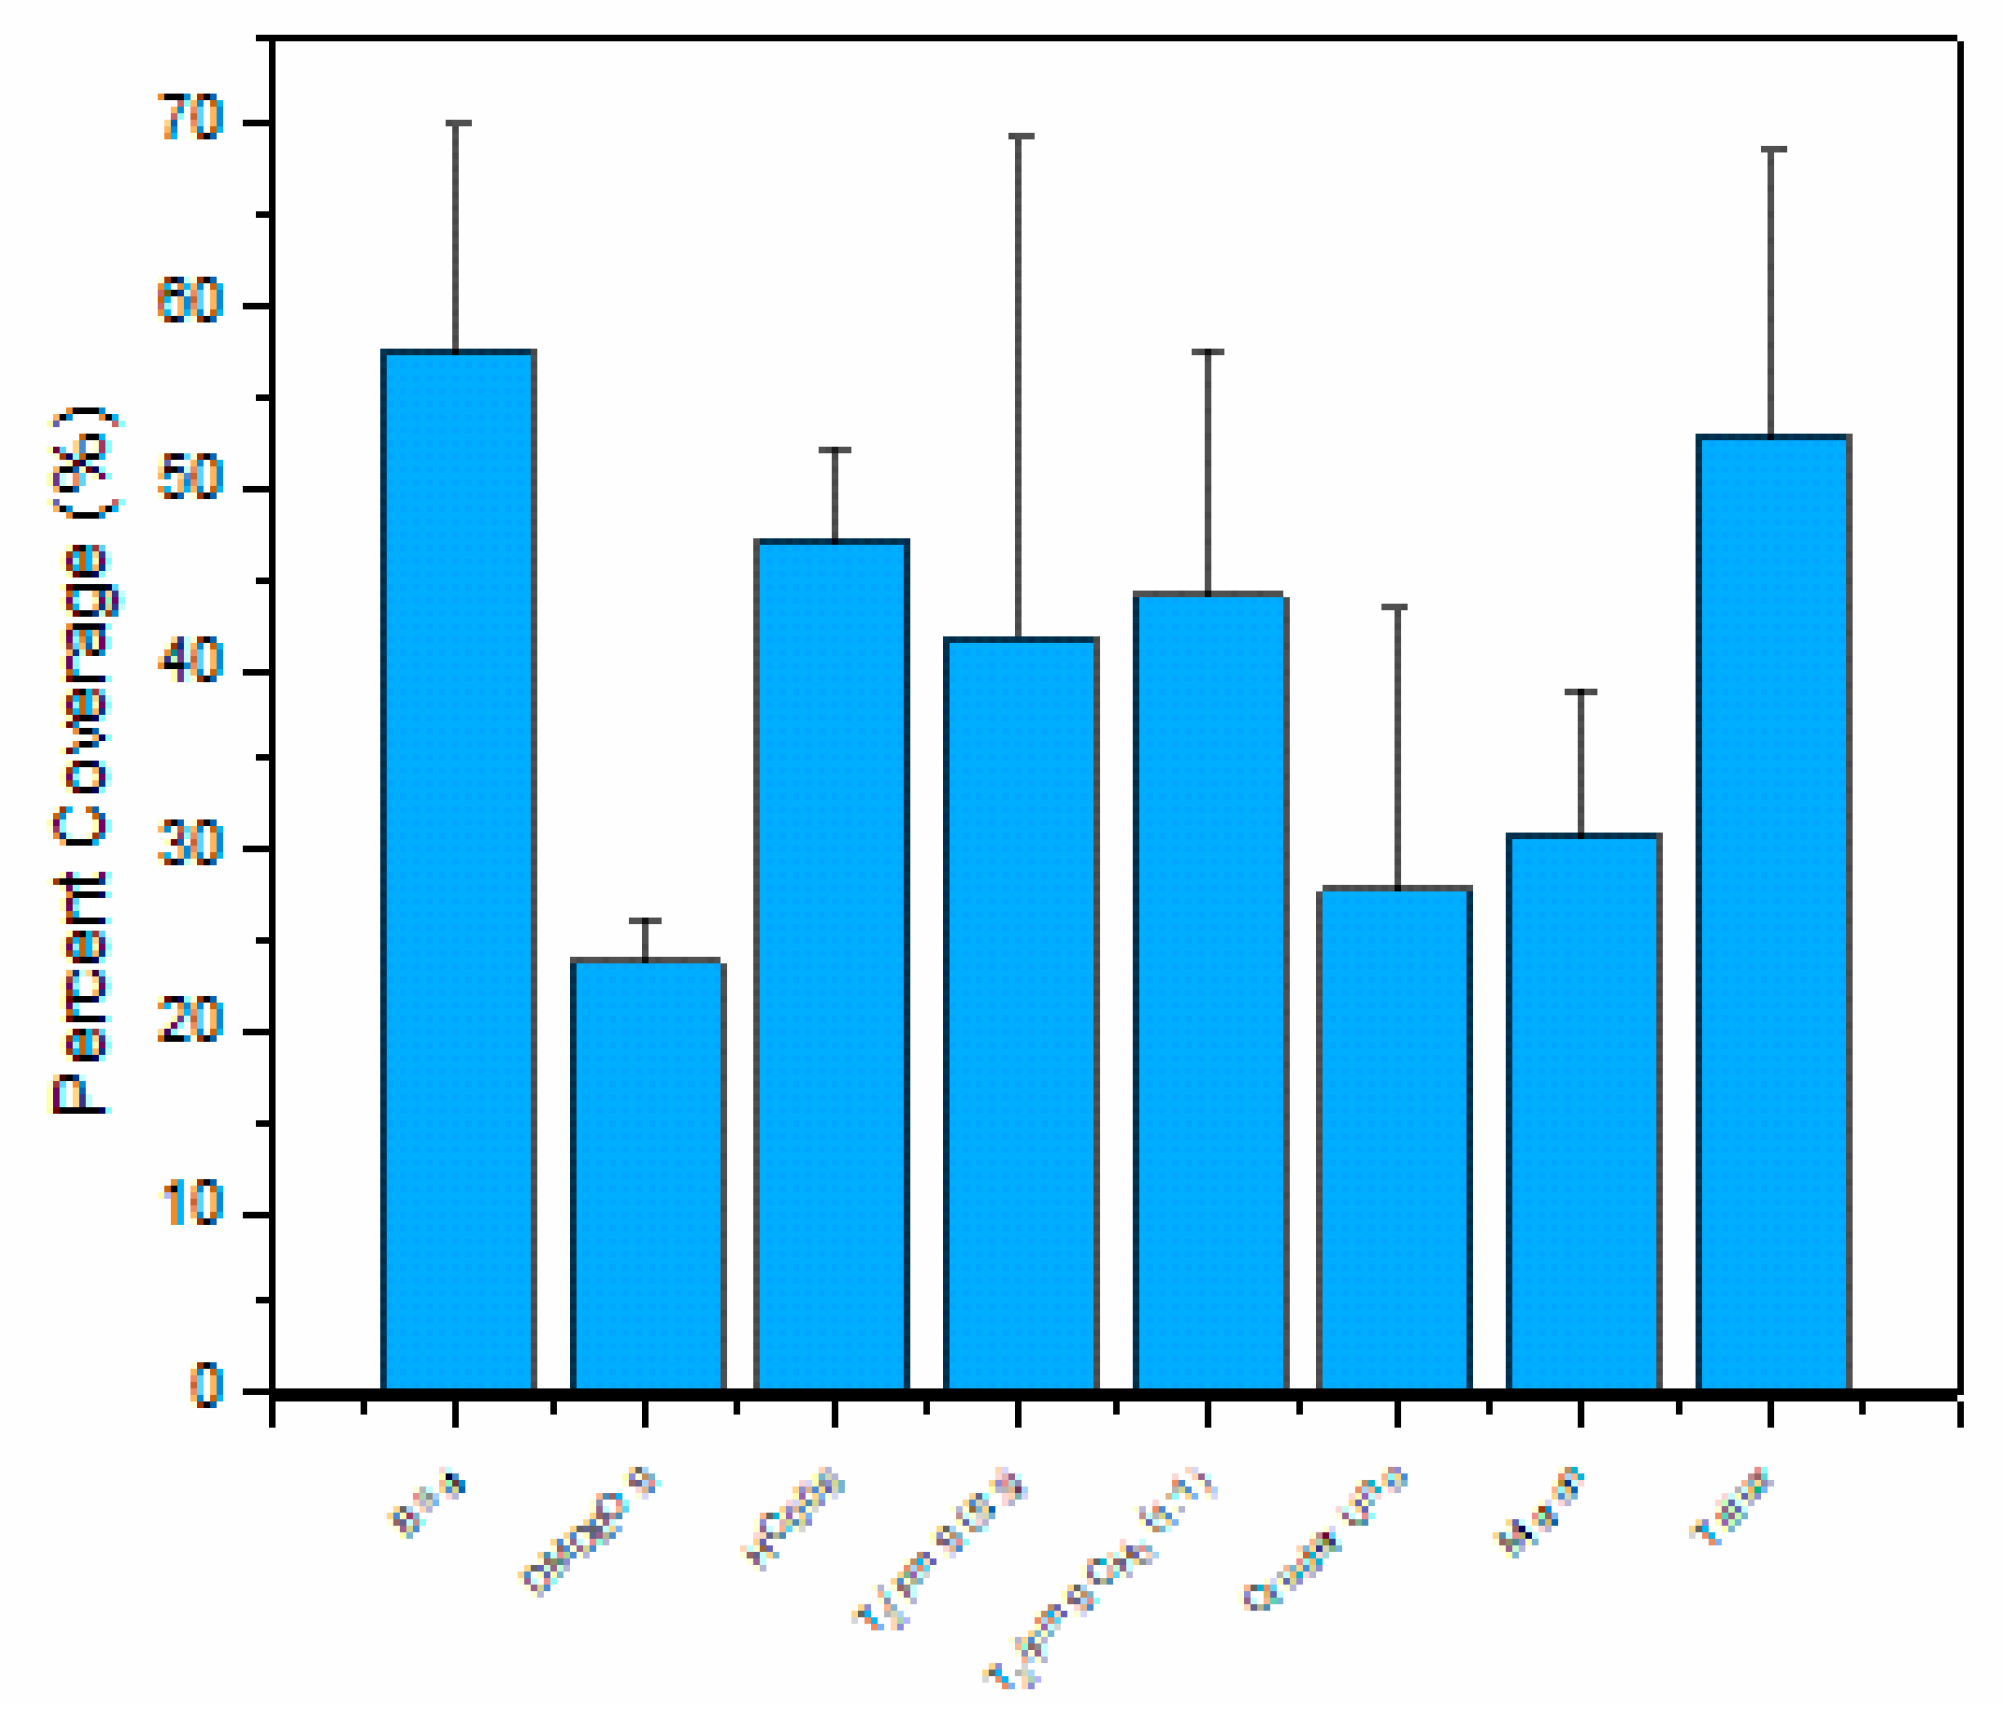
2.2.3. Macrofouling Assessment
3. Materials and Methods
3.1. Chemical Reagents
3.2. Instrumentation
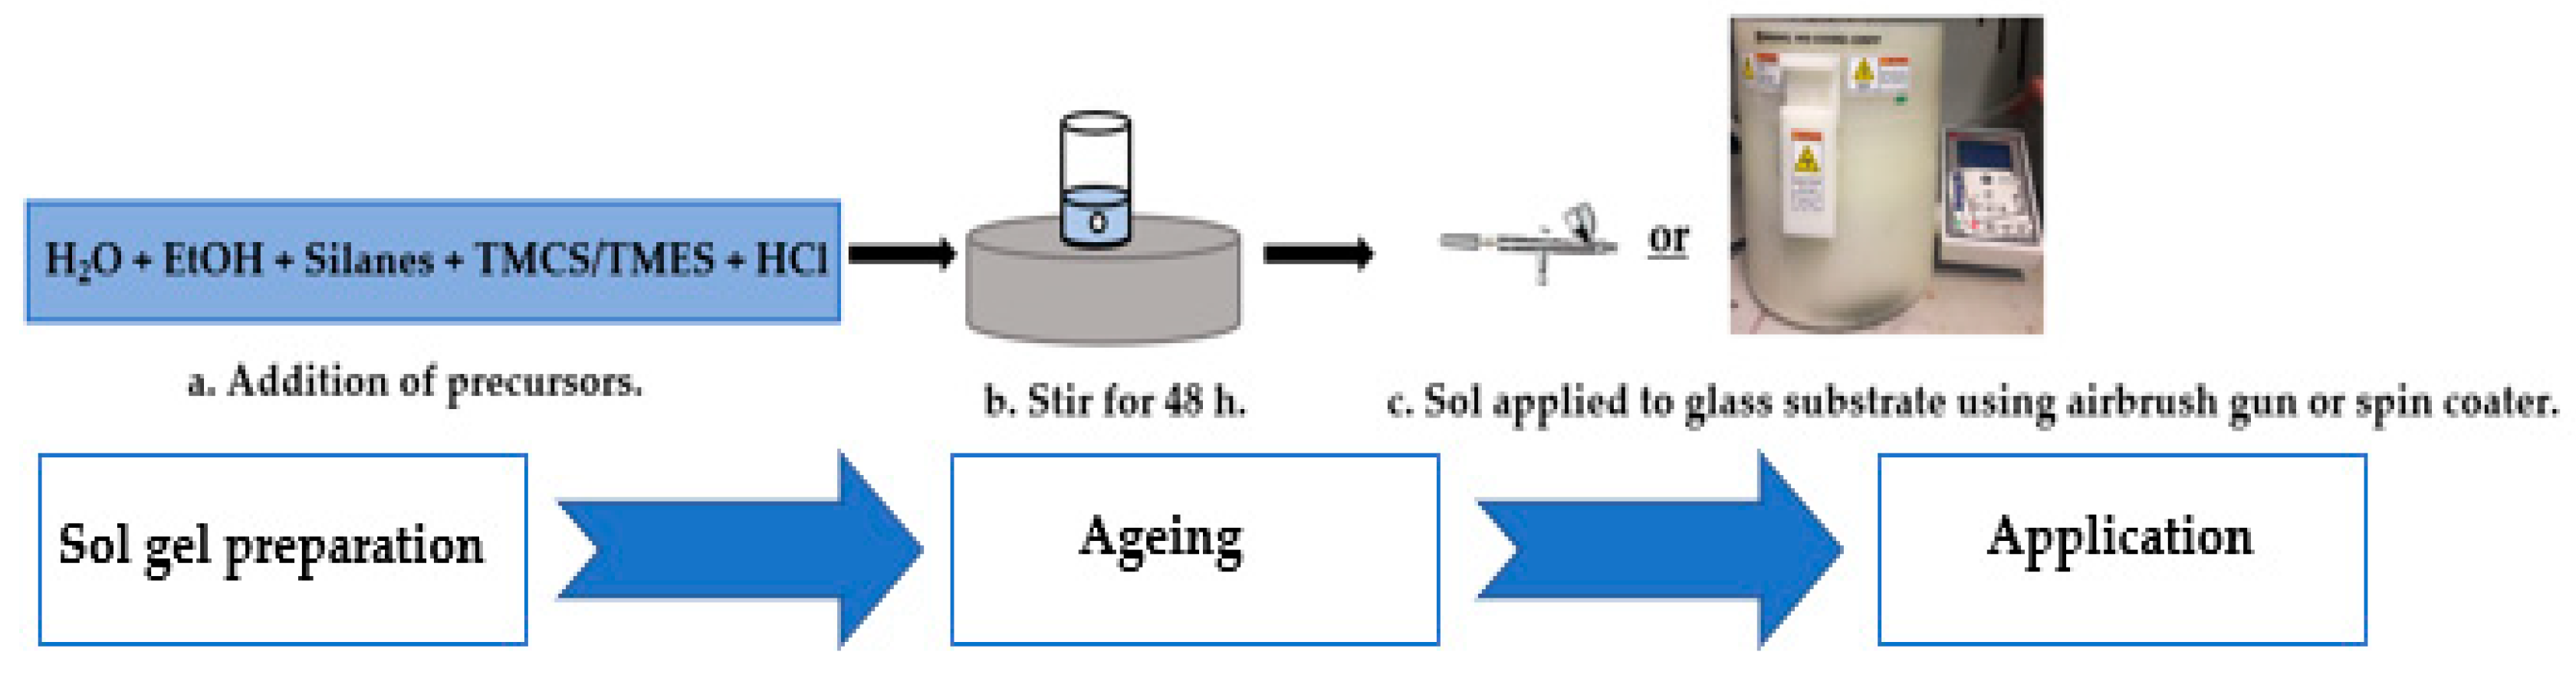
3.3. Preparation of Sol-Gel Coated Surfaces
3.3.1. Sol-Gels Synthesis
3.3.2. Application to Substrate
3.3.3. Characterization of Sol Gel Coatings
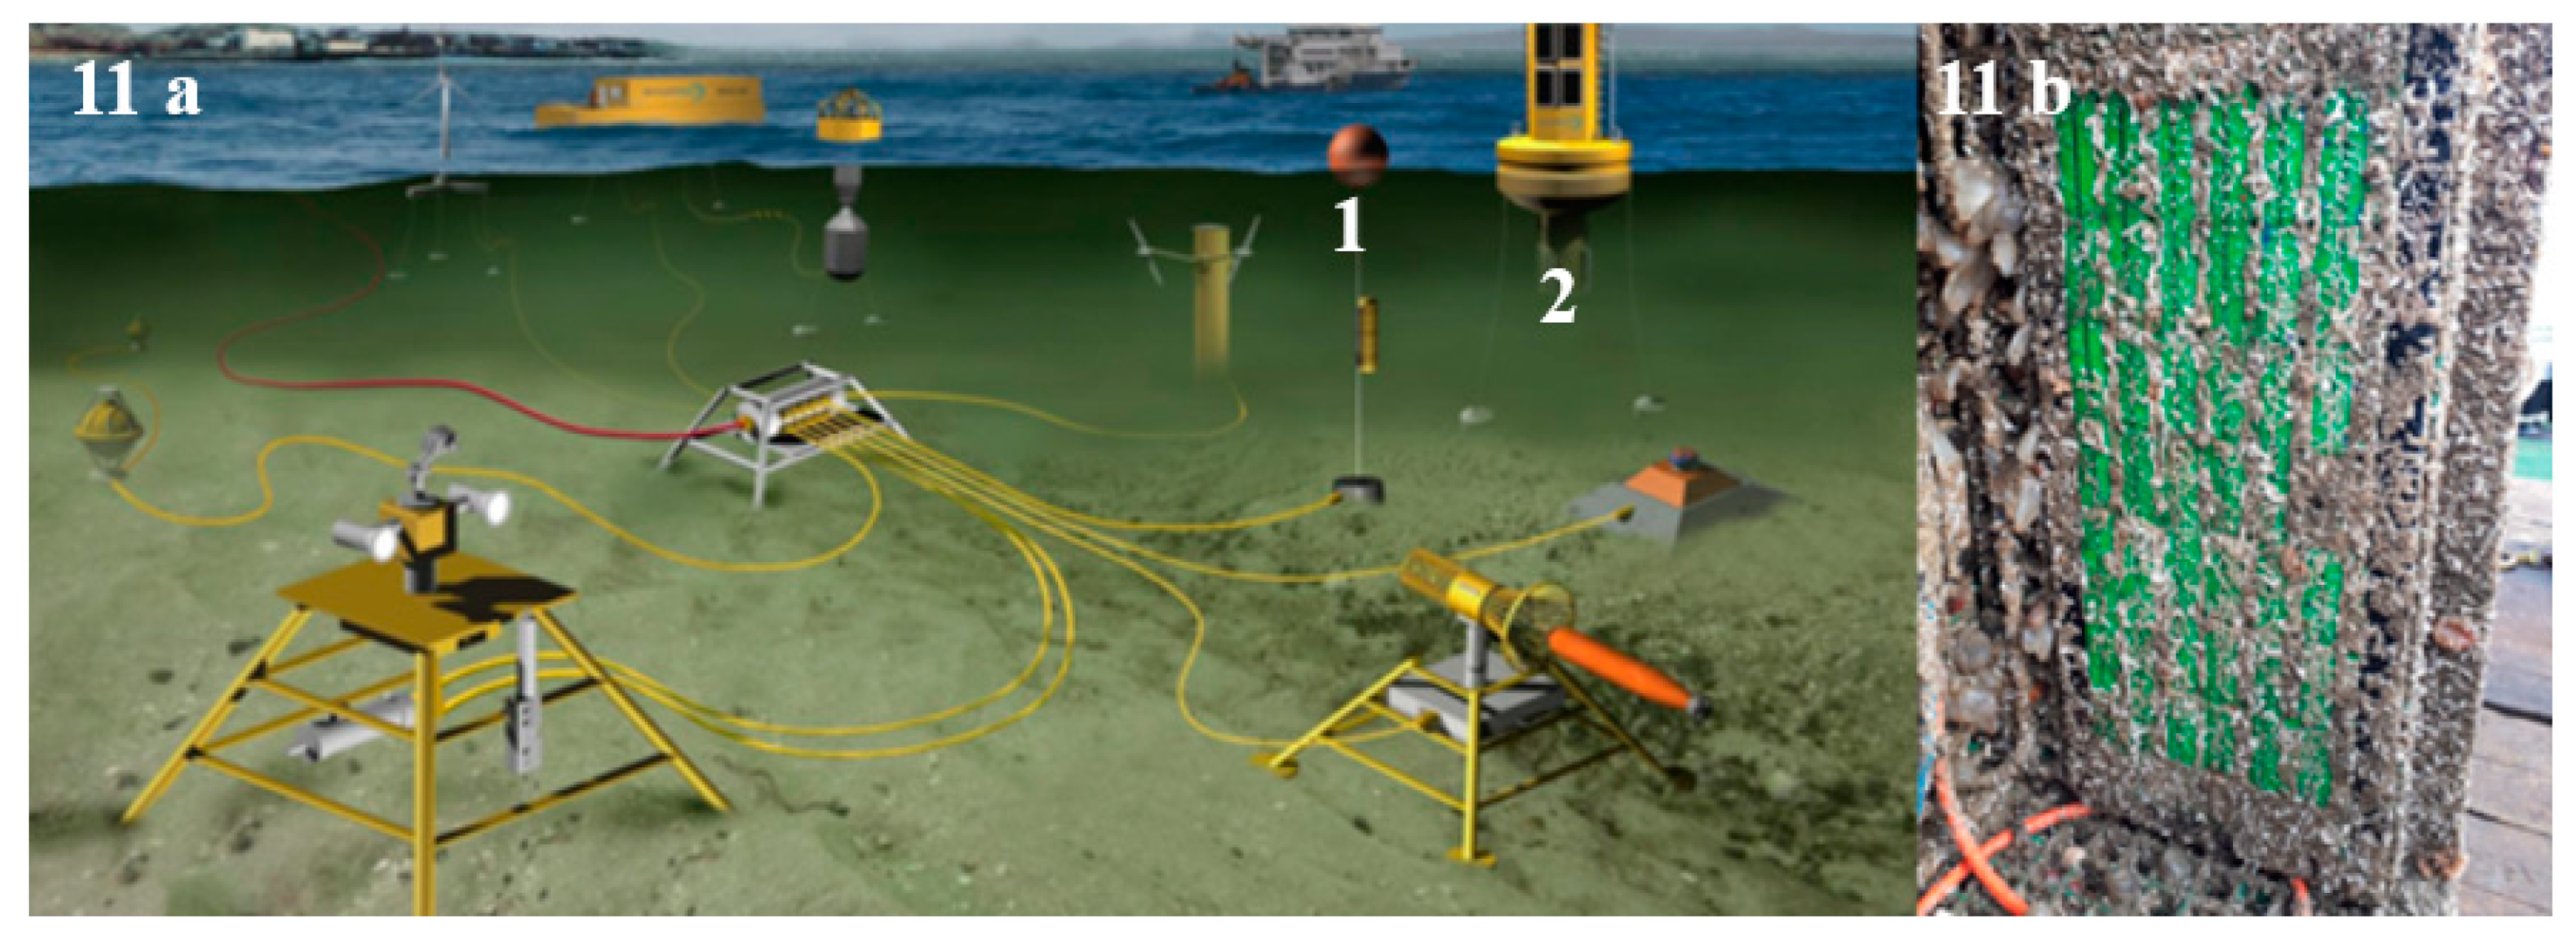
3.4. Site Description and Deployment Procedure
3.5. Characterization of Biofouling
3.5.1. Microfouling
Lowry Assay for Protein Determination
Diatom Identification Using Scanning Electron Microscopy
3.5.2. Macrofouling
Image J analysis
Statistical Analysis
4. Conclusions
Author Contributions
Funding
Conflicts of Interest
References
- Kirschner, C.M.; Brennan, A.B. Bio-Inspired Antifouling Strategies. Annu. Rev. Mater. Res. 2012, 42, 211–229. [Google Scholar] [CrossRef]
- Monroe, D. Looking for Chinks in the Armor of Bacterial Biofilms. PLoS Biol. 2007, 5, 2458–2461. [Google Scholar] [CrossRef] [PubMed]
- Alexander, I.R. Marine Biofouling: Colonization Processes and Defenses; CRC Press: Baco Raton, FL, USA, 2004. [Google Scholar]
- Schleno, J.B. Zwitteration: Coating Surfaces with Zwitterionic Functionality to Reduce Nonspeci fi c Adsorption. Langmuir 2014, 30, 9625–9636. [Google Scholar] [CrossRef] [PubMed]
- Jamal, M.; Tasneem, U.; Hussain, T.; Andleeb, S. Bacterial Biofilm: Its Composition, Formation and Role in Human Infections. Res. Rev. J. Microbiol. Biotechnol. 2015, 4, 1–14. [Google Scholar]
- Selim, M.S.; Shenashen, M.A.; Higazy, S.A.; Selim, M.M.; Isago, H.; Elmarakbi, A.; El-Safty, S.A. Recent progress in marine foul-release polymeric nanocomposite coatings. Prog. Mater. Sci. 2017, 87, 1–32. [Google Scholar] [CrossRef]
- Chapman, J.; Hellio, C.; Sullivan, T.; Brown, R.; Russell, S.; Kiterringham, E.; Nor, L.L.; Regan, F. Bioinspired synthetic macroalgae: Examples from nature for antifouling applications. Int. Biodeterior. Biodegrad. 2014, 86, 6–13. [Google Scholar] [CrossRef]
- Piazza, V.; Dragić, L.; Sepčić, K.; Faimali, M.; Garaventa, F.; Turk, T.; Berne, S. Antifouling activity of synthetic alkylpyridinium polymers using the barnacle model. Mar. Drugs 2014, 12, 1959–1976. [Google Scholar] [CrossRef]
- Delauney, L.; Comp, C. Biofouling protection for marine environmental sensors. Ocean Sci. 2010, 6, 503–511. [Google Scholar] [CrossRef]
- Murphy, K.; Heery, B.; Sullivan, T.; Zhang, D.; Paludetti, L.; Lau, K.T.; Diamond, D.; Costa, E.; Connor, N.O.; Regan, F. A low-cost autonomous optical sensor for water quality monitoring. Talanta 2015, 132, 520–527. [Google Scholar] [CrossRef]
- Amara, I.; Miled, W.; Slama, R.B.; Ladhari, N. Antifouling processes and toxicity effects of antifouling paints on marine environment. A review. Environ. Toxicol. Pharm. 2018, 57, 115–130. [Google Scholar] [CrossRef]
- Pagliaro, S.M.; Ciriminna, R.; Palmisano, G. Silica-based hybrid coatings. J. Mater. Chem. Pages 2009, 19, 3093–3312. [Google Scholar] [CrossRef]
- Nir, S.; Reches, M. Bio-inspired antifouling approaches: The quest towards non-toxic and non-biocidal materials. Curr. Opin. Biotechnol. 2016, 39, 48–55. [Google Scholar] [CrossRef] [PubMed]
- Detty, M.R.; Ciriminna, R.; Bright, F.V.; Pagliaro, M. Environmentally Benign Sol–Gel Antifouling and Foul-Releasing Coatings. Acc. Chem. Res. 2014, 47, 678–687. [Google Scholar] [CrossRef] [PubMed]
- Tang, Y.; Finlay, J.A.; Kowalke, G.L.; Meyer, A.E.; Bright, F.V.; Callow, M.E.; Callow, J.A.; Wendt, D.E.; Detty, M.R. Hybrid xerogel films as novel coatings for antifouling and fouling release. Biofouling 2005, 21, 59–71. [Google Scholar] [CrossRef] [PubMed]
- Bennett, S.M.; Finlay, J.A.; Gunari, N.; Wells, D.D.; Meyer, A.E.; Walker, G.C.; Callow, M.E.; Callow, A.J.; Bright, F.V.; Detty, M.R.; et al. The role of surface energy and water wettability in aminoalkyl/fluorocarbon/hydrocarbon-modified xerogel surfaces in the control of marine biofouling. Biofouling 2010, 26, 235–246. [Google Scholar] [CrossRef]
- Oldani, V.; Sergi, G.; Pirola, C.; Sacchi, B.; Bianchi, C.L. Sol-gel hybrid coatings containing silica and a perfluoropolyether derivative with high resistance and anti-fouling properties in liquid media. J. Fluor. Chem. 2016, 188, 43–49. [Google Scholar] [CrossRef]
- Chapman, J.; Weir, E.; Regan, F. Period four metal nanoparticles on the inhibition of biofouling. Colloids Surf. B Biointerfaces 2010, 78, 208–216. [Google Scholar] [CrossRef]
- Ebert, D.; Bhushan, B. Transparent, superhydrophobic, and wear-resistant coatings on glass and polymer substrates using SiO2, ZnO, and ITO nanoparticles. Langmuir 2012, 28, 11391–11399. [Google Scholar] [CrossRef] [PubMed]
- Zhang, X.X.; Xia, B.B.; Ye, H.-P.; Zhang, Y.-L.; Xiao, B.; Yan, L.-H.; LV, H.-B.; Jiang, B. One-step sol-gel preparation of PDMS-silica ORMOSILs as environment-resistant and crack-free thick antireflective coatings. J. Mater. Chem. 2012, 22, 13132–13140. [Google Scholar] [CrossRef]
- Baier, R.E.; Shafrin, E.G.; Zisman, W.A. Adhesion: Mechanisms That Assit or Impede It. Science 1968, 162, 1360–1368. [Google Scholar] [CrossRef]
- Ulbricht, M. Advanced functional polymer membranes. Polymer 2006, 47, 2217–2262. [Google Scholar] [CrossRef]
- Callow, M.E.; Callow, J.A. Marine biofouling: A sticky problem. Biologist 2002, 49, 1–5. [Google Scholar]
- Koc, Y.; Mello, A.J.D.; Newton, M.A.; Roach, P.; Shirtcliffe, N.J. Nano-scale superhydrophobicity: Suppression of protein adsorption and promotion of flow-induced detachment. Lab Chip 2008, 8, 582–586. [Google Scholar] [CrossRef] [PubMed]
- Ellinas, K.; Kefallinou, D.; Stamatakis, K.; Gogolides, E.; Tserepi, A. Is There a Threshold in the Antibacterial Action of Superhydrophobic Surfaces? ACS Appl. Mater. Interfaces 2017, 9, 39781–39789. [Google Scholar] [CrossRef] [PubMed]
- Yu, Q.; Wu, Z.; Chen, H. Dual-function antibacterial surfaces for biomedical applications. Acta Biomater. 2015, 16, 1–13. [Google Scholar] [CrossRef] [PubMed]
- Liu, Y.; Cao, H.; Chen, S.; Wang, D. Ag Nanoparticle-Loaded Hierarchical Superamphiphobic Surface on an Al Substrate with Enhanced Anticorrosion and Antibacterial Properties. J. Phys. Chem. 2015, 119, 25449–25456. [Google Scholar] [CrossRef]
- Dodiuk, H.; Rios, P.F.; Dotan, A.; Kenig, S. Hydrophobic and self-cleaning coatings. Polym. Adv. Technol. 2007, 19, 560–568. [Google Scholar] [CrossRef]
- Chapman, B.J.; Regan, F. Nanofunctionalized Superhydrophobic Antifouling Coatings for Environmental Sensor Applications—Advancing Deployment with Answers from Nature. Adv. Eng. Mater. 2012, 14, 175–184. [Google Scholar] [CrossRef]
- Rahmawan, Y.; Xu, L.; Yang, S. Self-Assembly of Nanostructures towards Transparent, Superhydrophobic Surfaces. J. Mater. Chem. A 2013, 1, 2955–2969. [Google Scholar] [CrossRef]
- Lin, N.; Berton, P.; Moraes, C.; Rogers, R.D.; Tufenkji, N. Nanodarts, nanoblades, and nanospikes: Mechano-bactericidal nanostructures and where to find them. Adv. Colloid Interface Sci. 2018, 252, 55–68. [Google Scholar] [CrossRef] [PubMed]
- Power, A.C.; Barrett, A.; Abubakar, J. Versatile Self-Cleaning Coating Production Through Sol–Gel Chemistry. Adv. Eng. Mater. 2015, 18, 76–82. [Google Scholar] [CrossRef]
- Dash, S.; Mishra, S.; Patel, S.; Mishra, B.K. Organically modified silica: Synthesis and applications due to its surface interaction with organic molecules. Adv. Colloid Interface Sci. 2008, 140, 77–94. [Google Scholar] [CrossRef] [PubMed]
- Shang, H.M.; Wang, Y.; Limmer, S.J.; Chou, T.P.; Cao, G.Z.; Takahashi, K. Optically transparent superhydrophobic silica-based films. Thin Solid Film 2005, 472, 37–43. [Google Scholar] [CrossRef]
- Maloney, R.; Sakamoto, J. Large deformation of chlorotrimethylsilane treated silica aerogels. J. Non-Cryst. Solids 2011, 357, 2059–2062. [Google Scholar] [CrossRef]
- Kelly, M. Identification of common benthic diatoms in rivers. Field Stud. 2000, 9, 583–700. [Google Scholar]
- Petrova, O.E.; Sauer, K. Sticky Situations: Key Components That Control Bacterial Surface Attachment. J. Bacteriol. 2012, 194, 2413–2425. [Google Scholar] [CrossRef] [PubMed]
- Howell, D.; Behrends, B.; Howell, D.; Behrends, B. A review of surface roughness in antifouling coatings illustrating the importance of cutoff length. Biofouling 2007, 7014, 1029–2454. [Google Scholar] [CrossRef] [PubMed]
- Mao, Y. Nearest Neighbor Distances Calculation with ImageJ. Available online: https://icme.hpc.msstate.edu (accessed on 15 June 2019).
- Maccraith, B.D.; McDonagh, C.M.; O’Keeffe, G.; McEvoy, A.K.; Butler, T.; Sheridan, F.R. Sol-gel coatings for optical chemical sensors and biosensors. Sens. Actuators 1995, 29, 51–57. [Google Scholar] [CrossRef]
- Liu, D.; Han, W.; Mallik, A.K.; Yuan, J.; Yu, C.; Farrell, G.; Semenova, Y.; Wu, Q. High sensitivity sol-gel silica coated optical fiber sensor for detection of ammonia in water. Opt. Express 2016, 24, 2837–2845. [Google Scholar] [CrossRef] [PubMed]
- Mcdonagh, C.; Maccraith, B.D.; Mcevoy, A.K. Tailoring of Sol–Gel Films for Optical Sensing of Oxygen in Gas and Aqueous Phase. Anal. Chem. 1998, 70, 45–50. [Google Scholar] [CrossRef] [PubMed]
Sample Availability: Samples of the compounds are available from the authors. |


| Sol/Genus Number * | 1 | 2 | 3 | 4 | 5 | 6 | 7 | 8 | 9 | 10 | 11 | 12 | 13 | 14 | 15 |
|---|---|---|---|---|---|---|---|---|---|---|---|---|---|---|---|
| B sol | + | + | + | + | + | + | |||||||||
| DMDEOS | + | + | + | + | |||||||||||
| HC006 | + | + | + | + | + | + | + | + | + | ||||||
| T2/FmS (5:3) | + | + | + | ||||||||||||
| T2/FmS (1:1) CH3 | + | + | + | + | + | + | + | + | + | ||||||
| Trilux | + | + | |||||||||||||
 | |||||||||||||||
| Material Name | Total No. of Barnacles | Mean Barnacle Area (mm2) | Percent Coverage (%) | Mean NN (mm) | NN SD (mm) | Mean Total Area (mm2) | Mean Total Area SD (mm2) |
|---|---|---|---|---|---|---|---|
| Trilux | 309 | 9.63 | 52.91 | 2.93 | 0.75 | 992.11 | 6.32 |
| Cruder Uno | 269 | 5.84 | 26.78 | 2.59 | 1 | 502.05 | 4.71 |
| Micron | 241 | 7.31 | 30.82 | 4.24 | 2.96 | 577.81 | 5.13 |
| HC006 | 247 | 10.66 | 46.81 | 3.16 | 0.72 | 877.65 | 6.16 |
| B Sol | 340 | 9.43 | 54.15 | 2.74 | 0.74 | 1015.32 | 6.99 |
| T2 (5:3) | 320 | 6.44 | 35.93 | 2.30 | 0.98 | 673.62 | 5.71 |
| T2 (1:1) | 324 | 6.55 | 37.73 | 2.50 | 0.73 | 707.41 | 5.85 |
| DMDEOS | 247 | 5.42 | 23.80 | 3.07 | 0.83 | 446.29 | 3.89 |
| Sol Name | TEOS | ETEOS | CTMS | EtOH | HCl | H2O | DMDEOS | TMES |
|---|---|---|---|---|---|---|---|---|
| DMDEOS | 2.679 | - | - | 18.24 | 0.029 | 3.6 | 6.51 | - |
| HC006 | 2.763 | 0.886 | 2.094 | 12.04 | 0.007 | 2.378 | - | - |
| T2 | 4.06 | 0.84 | - | 11.67 | 0.007 | 2.252 | - | 1.42 |
| B Sol | 2.793 | 0.886 | 2.094 1 | 12.04 2 | 0.007 | 2.378 | - | - |
© 2019 by the authors. Licensee MDPI, Basel, Switzerland. This article is an open access article distributed under the terms and conditions of the Creative Commons Attribution (CC BY) license (http://creativecommons.org/licenses/by/4.0/).
Share and Cite
Richards, C.; Briciu-Burghina, C.; Jacobs, M.R.; Barrett, A.; Regan, F. Assessment of Antifouling Potential of Novel Transparent Sol Gel Coatings for Application in the Marine Environment. Molecules 2019, 24, 2983. https://doi.org/10.3390/molecules24162983
Richards C, Briciu-Burghina C, Jacobs MR, Barrett A, Regan F. Assessment of Antifouling Potential of Novel Transparent Sol Gel Coatings for Application in the Marine Environment. Molecules. 2019; 24(16):2983. https://doi.org/10.3390/molecules24162983
Chicago/Turabian StyleRichards, Chloe, Ciprian Briciu-Burghina, Matthew R. Jacobs, Alan Barrett, and Fiona Regan. 2019. "Assessment of Antifouling Potential of Novel Transparent Sol Gel Coatings for Application in the Marine Environment" Molecules 24, no. 16: 2983. https://doi.org/10.3390/molecules24162983
APA StyleRichards, C., Briciu-Burghina, C., Jacobs, M. R., Barrett, A., & Regan, F. (2019). Assessment of Antifouling Potential of Novel Transparent Sol Gel Coatings for Application in the Marine Environment. Molecules, 24(16), 2983. https://doi.org/10.3390/molecules24162983