ANOVA Design for the Optimization of TiO2 Coating on Polyether Sulfone Membranes


Abstract
1. Introduction
2. Experimental Section
2.1. Material
2.2. Fractional Factorial Design
2.3. Membrane Preparation
2.4. Effect of Template Agent and TTIP Concentration
2.5. Membrane Characterization
3. Results and Discussions
3.1. One-Half Fractional Factorial Design
3.2. Two-Way ANOVA
3.2.1. Effect of Nonsolvent (Factor E)
3.2.2. BSA Rejection
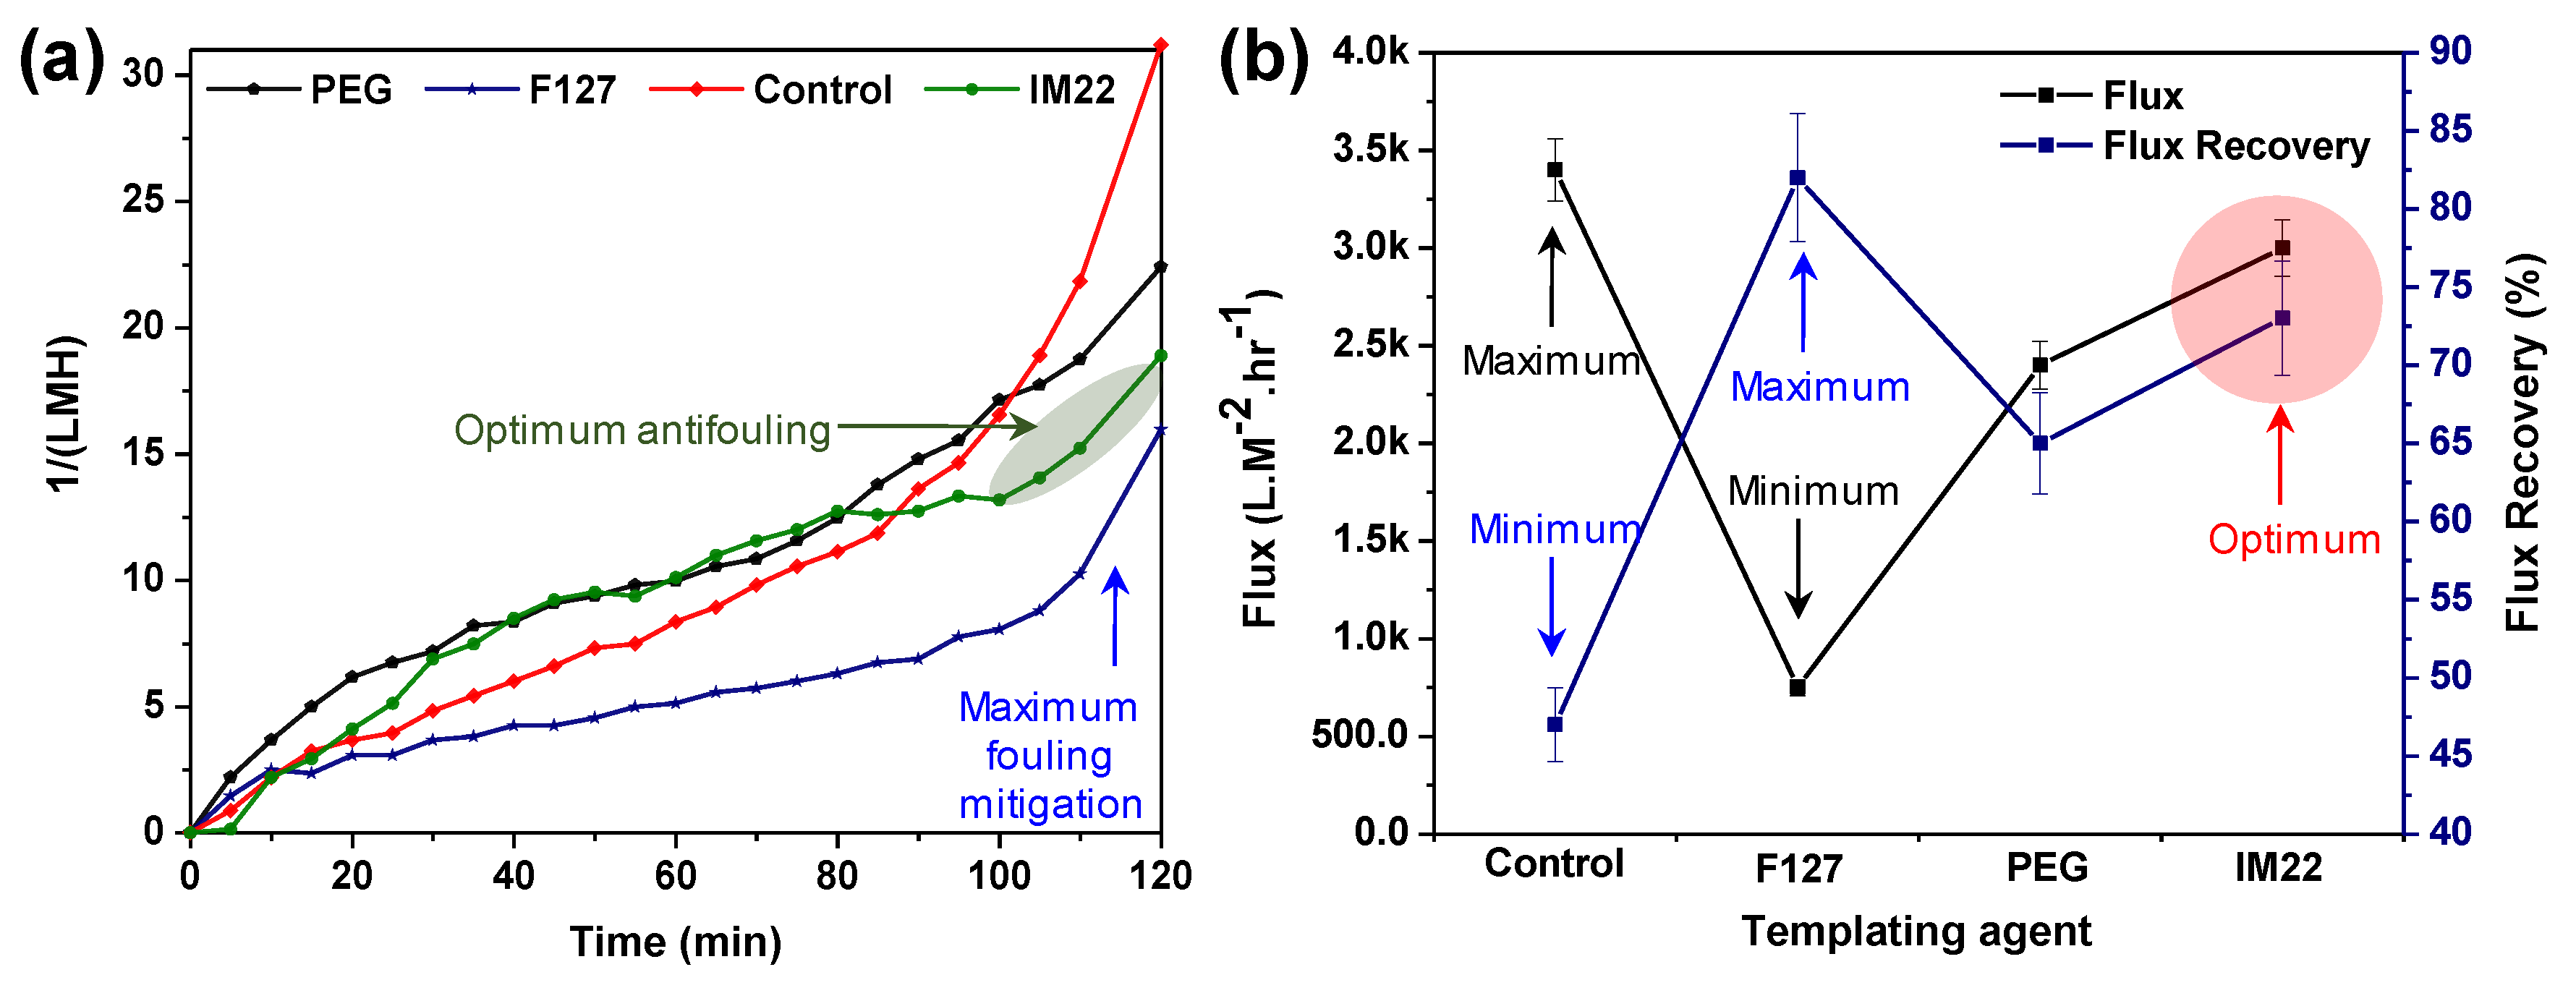
3.3. Effect of Template Agents
BSA Rejection
4. Conclusions
Supplementary Materials
Author Contributions
Funding
Acknowledgments
Conflicts of Interest
References
- Zhai, Y.; Wang, J.; Wang, H.; Song, T.; Hu, W.; Li, S. Preparation and Characterization of Antioxidative and UV-Protective Larch Bark Tannin/PVA Composite Membranes. Molecules 2018, 23, 2073. [Google Scholar] [CrossRef]
- He, K.; He, K.Q.; Chen, C.l.; Liao, C.Z.; Xu, Y.; Tang, J.N.; Li, R.K.Y. Polyethylene oxide/garnet-type Li6.4La3Zr1.4Nb0.6O12 composite electrolytes with improved electrochemical performance for solid state lithium rechargeable batteries. Compos. Sci. Technol. 2019, 175, 28–34. [Google Scholar] [CrossRef]
- Iulianelli, A.; Alavi, M.; Bagnato, G.; Liguori, S.; Wilcox, J.; Rahimpour, M.R.; Eslamlouyan, R.; Anzelmo, B.; Basile, A. Supported Pd-Au Membrane Reactor for Hydrogen Production: Membrane Preparation, Characterization and Testing. Molecules 2016, 21, 581. [Google Scholar]
- Arefi-Oskoui, S.; Khataee, A.; Safarpour, M.; Orooji, Y.; Vatanpour, V. A review on the applications of ultrasonic technology in membrane bioreactors. Ultrasonics Sonochemistry 2019, 58, 104633. [Google Scholar] [CrossRef]
- Mahmoudi, N.; Reed, L.; Alex, M.; Alshammari, N.; Hestekin, J.L.; Servoss, S. PEG-mimetic peptoid reduces protein fouling of polysulfone hollow fibers. Colloids Surf. B Biointerfaces 2017, 149, 23–29. [Google Scholar]
- Razmjou, A.; Eshaghi, G.; Orooji, Y.; Hossein, I.; Korayem, A.H.; Mohagheghian, F. Lithium ion-selective membrane with 2D subnanometer channels. Water Res. 2019, 159, 313–323. [Google Scholar] [CrossRef]
- Orooji, Y.; Faghih, M.; Razmjou, A.; Hou, J.W.; Moazzam, P.; Emami, N.; Aghababaie, M.; Nourrisfa, F.; Chen, V.; Jin, W.Q. Nanostructured Mesoporous Carbon Polyethersulfone Composite Ultrafiltration Membrane with Significantly Low Protein Adsorption and Bacterial Adhesion. Carbon 2017, 111, 689–704. [Google Scholar] [CrossRef]
- Maiti, J.; Kakati, N.; Woo, S.P.; Yoon, Y.S. Nafion based hybrid composite membrane containing GO and dihydrogen phosphate functionalized ionic liquid for high temperature polymer electrolyte membrane fuel cell. Compos. Sci. Technol. 2018, 155, 189–196. [Google Scholar] [CrossRef]
- Orooji, Y.; Liang, F.; Razmjou, A.; Li, S.; Mofid, M.R.; Liu, Q.; Guan, K.; Liu, Z.; Jin, W. Excellent Biofouling Alleviation of Thermoexfoliated Vermiculite Blended Poly(ether sulfone) Ultrafiltration Membrane. ACS Appl. Mater. Interfaces 2017, 9, 30024–30034. [Google Scholar] [CrossRef]
- Orooji, Y.; Liang, F.; Razmjou, A.; Liu, G.; Jin, W.Q. Preparation of anti-adhesion and bacterial destructive polymeric ultrafiltration membranes using modified mesoporous carbon. Sep. Purif. Technol. 2018, 205, 273–283. [Google Scholar] [CrossRef]
- Razmjou, C. The Effect of TiO2 Nanoparticles on the Surface Chemistry, Structure and Fouling Performance of Polymeric Membranes. Ph.D. Thesis, University of New South Wales, Kensington, Australia, 2012. [Google Scholar]
- Razmjou, A.; Mansouri, J.; Chen, V. The effects of mechanical and chemical modification of TiO2 nanoparticles on the surface chemistry, structure and fouling performance of PES ultrafiltration membranes. J. Membr. Sci. 2011, 378, 73–84. [Google Scholar] [CrossRef]
- Razmjou, A.; Resosudarmo, A.; Holmes, R.L.; Li, H.Y.; Mansouri, J.; Chen, V. The effect of modified TiO2 nanoparticles on the polyethersulfone ultrafiltration hollow fiber membranes. Desalination 2012, 287, 271–280. [Google Scholar] [CrossRef]
- Leong, S.W.; Razmjou, A.; Wang, K.; Hapgood, K.; Zhang, X.W.; Wang, H.T. TiO2 based photocatalytic membranes: A review. J. Membr. Sci. 2014, 472, 167–184. [Google Scholar] [CrossRef]
- Yadav, M.; Mishra, D.K.; Hwang, J.S. Catalytic hydrogenation of xylose to xylitol using ruthenium catalyst on NiO modified TiO2 support. Appl. Catal. A Gen. 2012, 425–426, 110–116. [Google Scholar] [CrossRef]
- Meng, S.; Mansouri, J.; Ye, Y.; Chen, V. Effect of templating agents on the properties and membrane distillation performance of TiO2-coated PVDF membranes. J. Membr. Sci. 2014, 450, 48–59. [Google Scholar] [CrossRef]
- Emami, N.; Razmjou, A.; Noorisafa, F.; Korayem, A.H.; Zarrabi, A.; Ji, C. Fabrication of smart magnetic nanocomposite asymmetric membrane capsules for the controlled release of nitrate. Environ. Nanotechnol. Monit. Manag. 2017, 8, 233–243. [Google Scholar] [CrossRef]
- Barth, C.; Goncalves, M.C.; Piers, A.T.M.; Wolf, B.A. Asymmetric polysulfone and polyethersulfone membranes: effects of thermodynamic conditions during formation on their performance. J. Membr. Sc. 2000, 169, 287–299. [Google Scholar] [CrossRef]
- Wu, L.; Sun, J.; Wang, Q. Poly(vinylidene fluoride)/polyethersulfone blend membranes: Effects of solvent sort, polyethersulfone and polyvinylpyrrolidone concentration on their properties and morphology. J. Membr. Sci. 2006, 285, 290–298. [Google Scholar] [CrossRef]
- See-Toh, Y.H.; Ferreira, F.C.; Livingston, A.G. The influence of membrane formation parameters on the functional performance of organic solvent nanofiltration membranes. J. Membr. Sci. 2007, 299, 236–250. [Google Scholar] [CrossRef]
- Young, T.H.; Huang, Y.H.; Chen, L.Y. Effect of solvent evaporation on the formation of asymmetric and symmetric membranes with crystallizable EVAL polymer. J. Membr. Sci. 2000, 164, 111–120. [Google Scholar] [CrossRef]
- Cheng, L.P. Effect of temperature on the formation of microporous PVDF membranes by precipitation from 1-octanol/DMF/PVDF and water/DMF/PVDF systems. Macromolecules 1999, 32, 6668–6674. [Google Scholar] [CrossRef]
- Yeow, M.; Liu, Y.; Li, K. Morphological study of poly (vinylidene fluoride) asymmetric membranes: Effects of the solvent, additive, and dope temperature. J. Appl. Polym. Sci. 2004, 92, 1782–1789. [Google Scholar] [CrossRef]
- Wu, Y.; Wang, F.; Huang, Y. Facile and simple fabrication of strong, transparent and flexible aramid nanofibers/bacterial cellulose nanocomposite membranes. Compos. Sci. Technol. 2018, 159, 70–76. [Google Scholar] [CrossRef]
- Zhang, J.; Li, B.; Wang, Z.X.; Cheng, G.J.; Dong, S.J. Functionalized inorganic–organic composite material derivated by sol–gel for construction of mediated amperometric hydrogen peroxide biosensor. Anal. Chim. Acta 1999, 388, 71–78. [Google Scholar] [CrossRef]
- Ping, L.; Liu , P.; Lin, H.; Fu, X.; Meng, C. Preparation of the doped TiO2 film photocatalyst and its bactericidal mechanism. Chin. J. Catal. 1995, 20, 327–328. [Google Scholar]
- Mansouri, J.; Harrisson, S.; Chen, V. Strategies for controlling biofouling in membrane filtration systems: challenges and opportunities. J. Mater. Chem. 2010, 20, 4567–4586. [Google Scholar] [CrossRef]
- Razmjou, A.A.; Mansouri, J.; Chen, V.; Lim, M.; Amal, R. Titania nanocomposite polyethersulfone ultrafiltration membranes fabricated using a low temperature hydrothermal coating process. J. Membr. Sci. 2011, 380, 98–113. [Google Scholar] [CrossRef]
- Mahmoudi, N. Design of Peptoid-Based Coating to Reduce Biofouling in Gas Exchange Devices. Ph.D. Thesis, University of Arkansas, Fayetteville, AR, USA, 2018. [Google Scholar]
- Deshmukh, S.P.; Li, K. Effect of ethanol composition in water coagulation bath on morphology of PVDF hollow fibre membranes. J. Membr. Sci. 1998, 150, 75–85. [Google Scholar] [CrossRef]
- Tarrahi, R.; Movafeghi, A.; Khataee, A.; Rezanejad, F.; Gohari, G. Evaluating the Toxic Impacts of Cadmium Selenide Nanoparticles on the Aquatic Plant Lemna minor. Molecules 2019, 24, 410. [Google Scholar] [CrossRef]
- Khaledian, H.R.; Zolfaghari, P.; Elhami, V.; Aghbolaghy, M.; Khorram, S.; Karimi, A.; Khataee, A. Modification of Immobilized Titanium Dioxide Nanostructures by Argon Plasma for Photocatalytic Removal of Organic Dyes. Molecules 2019, 24, 383. [Google Scholar] [CrossRef]


| Run | Treatment Combination | Level of Factors (High Level:+; Low Level: −) | Response: Flux (LMH) | |||||||||||
|---|---|---|---|---|---|---|---|---|---|---|---|---|---|---|
| Replicates | Average | |||||||||||||
| Aa | Bb | Cc | Dd | Ee | Aa | Bb | Cc | Dd | Ee | i | ii | iii | ||
| 1 | 100 | 0 | 1 | 0 | 0 | + | − | − | − | − | 0 | 0 | 0 | 0 |
| 2 | 100 | 0 | 1 | 4 | 100 | + | − | − | + | + | 0 | 0 | 0 | 0 |
| 3 | 0 | 0 | 16 | 0 | 0 | − | − | + | − | − | 4 | 3.86 | 4.5 | 4.12 |
| 4 | 0 | 60 | 16 | 0 | 100 | − | + | + | − | + | 180 | 225 | 160 | 188 |
| 5 | 0 | 0 | 16 | 4 | 100 | − | − | + | + | + | 540 | 520 | 510 | 523 |
| 6 | 0 | 0 | 1 | 4 | 0 | − | − | − | + | − | 580 | 556 | 568 | 568 |
| 7 | 0 | 60 | 1 | 4 | 100 | − | + | − | + | + | 580 | 640 | 610 | 610 |
| 8 | 100 | 60 | 16 | 4 | 100 | + | + | + | + | + | 9 | 8.5 | 8 | 8.5 |
| 9 | 100 | 60 | 16 | 0 | 0 | + | + | + | − | − | 0 | 0 | 0 | 0 |
| 10 | 0 | 0 | 1 | 0 | 100 | − | − | − | − | + | 72 | 82.5 | 76 | 76.8 |
| 11 | 0 | 60 | 1 | 0 | 0 | − | + | − | − | − | 0 | 0 | 0 | 0 |
| 12 | 0 | 60 | 16 | 4 | 0 | − | + | + | + | − | 740 | 686 | 680 | 702 |
| 13 | 50 | 30 | 8.5 | 2 | 50 | 0 | 0 | 0 | 0 | 0 | 343 | 390 | 367 | 367 |
| 14 | 100 | 0 | 16 | 0 | 100 | + | − | + | − | + | 0 | 0 | 0 | 0 |
| 15 | 100 | 60 | 1 | 0 | 100 | + | + | − | − | + | 0 | 0 | 0 | 0 |
| 16 | 100 | 60 | 1 | 4 | 0 | + | + | − | + | − | 455 | 461 | 450 | 455 |
| 17 | 100 | 0 | 16 | 4 | 0 | + | − | + | + | − | 480 | 509 | 501 | 497 |
| Run | Treatment Combination | Level of Factors (High Level: +; Low Level: −) | Average of Membrane Top Layer Thickness (µm) | ||||||||
|---|---|---|---|---|---|---|---|---|---|---|---|
| Aa | Bb | Cc | Dd | Ee | Aa | Bb | Cc | Dd | Ee | ||
| 1 | 100 | 0 | 1 | 0 | 0 | + | − | − | − | − | 2.65 |
| 2 | 100 | 0 | 1 | 4 | 100 | + | − | − | + | + | 0 |
| 3 | 0 | 0 | 16 | 0 | 0 | − | − | + | − | − | 4.3 |
| 4 | 0 | 60 | 16 | 0 | 100 | − | + | + | − | + | 2 |
| 5 | 0 | 0 | 16 | 4 | 100 | − | − | + | + | + | 1.12 |
| 6 | 0 | 0 | 1 | 4 | 0 | − | − | − | + | − | 8 |
| 7 | 0 | 60 | 1 | 4 | 100 | − | + | − | + | + | 2 |
| 8 | 100 | 60 | 16 | 4 | 100 | + | + | + | + | + | 0.75 |
| 9 | 100 | 60 | 16 | 0 | 0 | + | + | + | − | − | 1.2 |
| 10 | 0 | 0 | 1 | 0 | 100 | − | − | − | − | + | 2 |
| 11 | 0 | 60 | 1 | 0 | 0 | − | + | − | − | − | 3.2 |
| 12 | 0 | 60 | 16 | 4 | 0 | − | + | + | + | − | 9 |
| 13 | 50 | 30 | 8.5 | 2 | 50 | 0 | 0 | 0 | 0 | 0 | 2.5 |
| 14 | 100 | 0 | 16 | 0 | 100 | + | − | + | − | + | 1.5 |
| 15 | 100 | 60 | 1 | 0 | 100 | + | + | − | − | + | 0.18 |
| 16 | 100 | 60 | 1 | 4 | 0 | + | + | − | + | − | 1.8 |
| 17 | 100 | 0 | 16 | 4 | 0 | + | − | + | + | − | 2.15 |
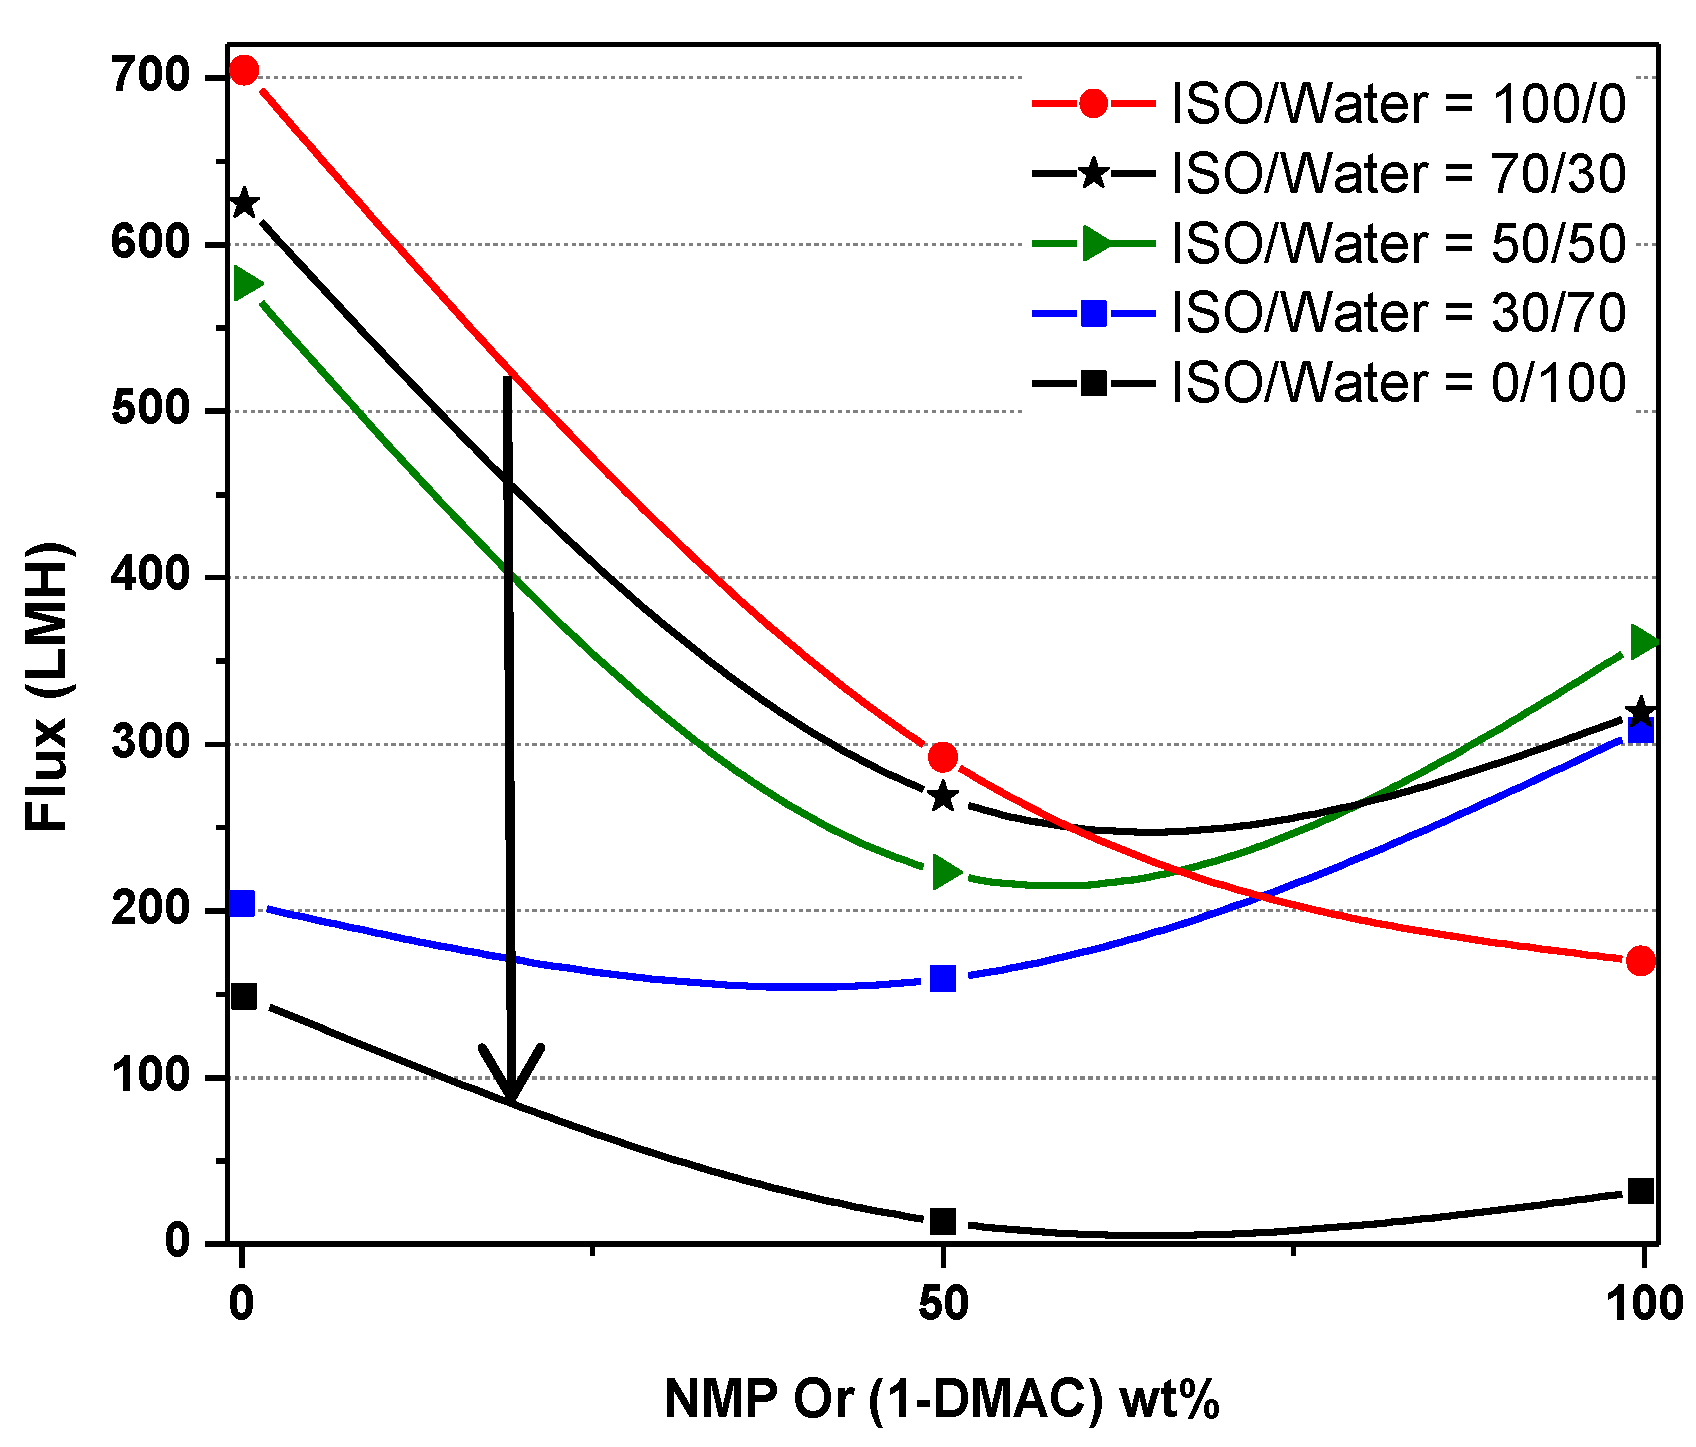
| NMP/DMAc (A) | ISO/Water (E) | ||||
|---|---|---|---|---|---|
| 0/100 | 30/70 | 50/50 | 70/30 | 100/0 | |
| 0/100 | 702 | 622 | 582 | 204 | 146.5 |
| 50/50 | 290 | 265 | 224 | 158 | 8 |
| 100/0 | 268 | 319 | 360 | 310 | 27 |
© 2019 by the authors. Licensee MDPI, Basel, Switzerland. This article is an open access article distributed under the terms and conditions of the Creative Commons Attribution (CC BY) license (http://creativecommons.org/licenses/by/4.0/).
Share and Cite
Orooji, Y.; Ghasali, E.; Emami, N.; Noorisafa, F.; Razmjou, A. ANOVA Design for the Optimization of TiO2 Coating on Polyether Sulfone Membranes. Molecules 2019, 24, 2924. https://doi.org/10.3390/molecules24162924
Orooji Y, Ghasali E, Emami N, Noorisafa F, Razmjou A. ANOVA Design for the Optimization of TiO2 Coating on Polyether Sulfone Membranes. Molecules. 2019; 24(16):2924. https://doi.org/10.3390/molecules24162924
Chicago/Turabian StyleOrooji, Yasin, Ehsan Ghasali, Nahid Emami, Fatemeh Noorisafa, and Amir Razmjou. 2019. "ANOVA Design for the Optimization of TiO2 Coating on Polyether Sulfone Membranes" Molecules 24, no. 16: 2924. https://doi.org/10.3390/molecules24162924
APA StyleOrooji, Y., Ghasali, E., Emami, N., Noorisafa, F., & Razmjou, A. (2019). ANOVA Design for the Optimization of TiO2 Coating on Polyether Sulfone Membranes. Molecules, 24(16), 2924. https://doi.org/10.3390/molecules24162924