
The Anomalous Influence of Polyelectrolyte Concentration on the Deposition and Nanostructure of Poly(ethyleneimine)/Poly(acrylic acid) Multilayers


Abstract
1. Introduction
2. Results
2.1. Charge State of the Used PEL and pH-Dependent Deposition
2.1.1. State
2.1.2. Deposition in Relation to pH
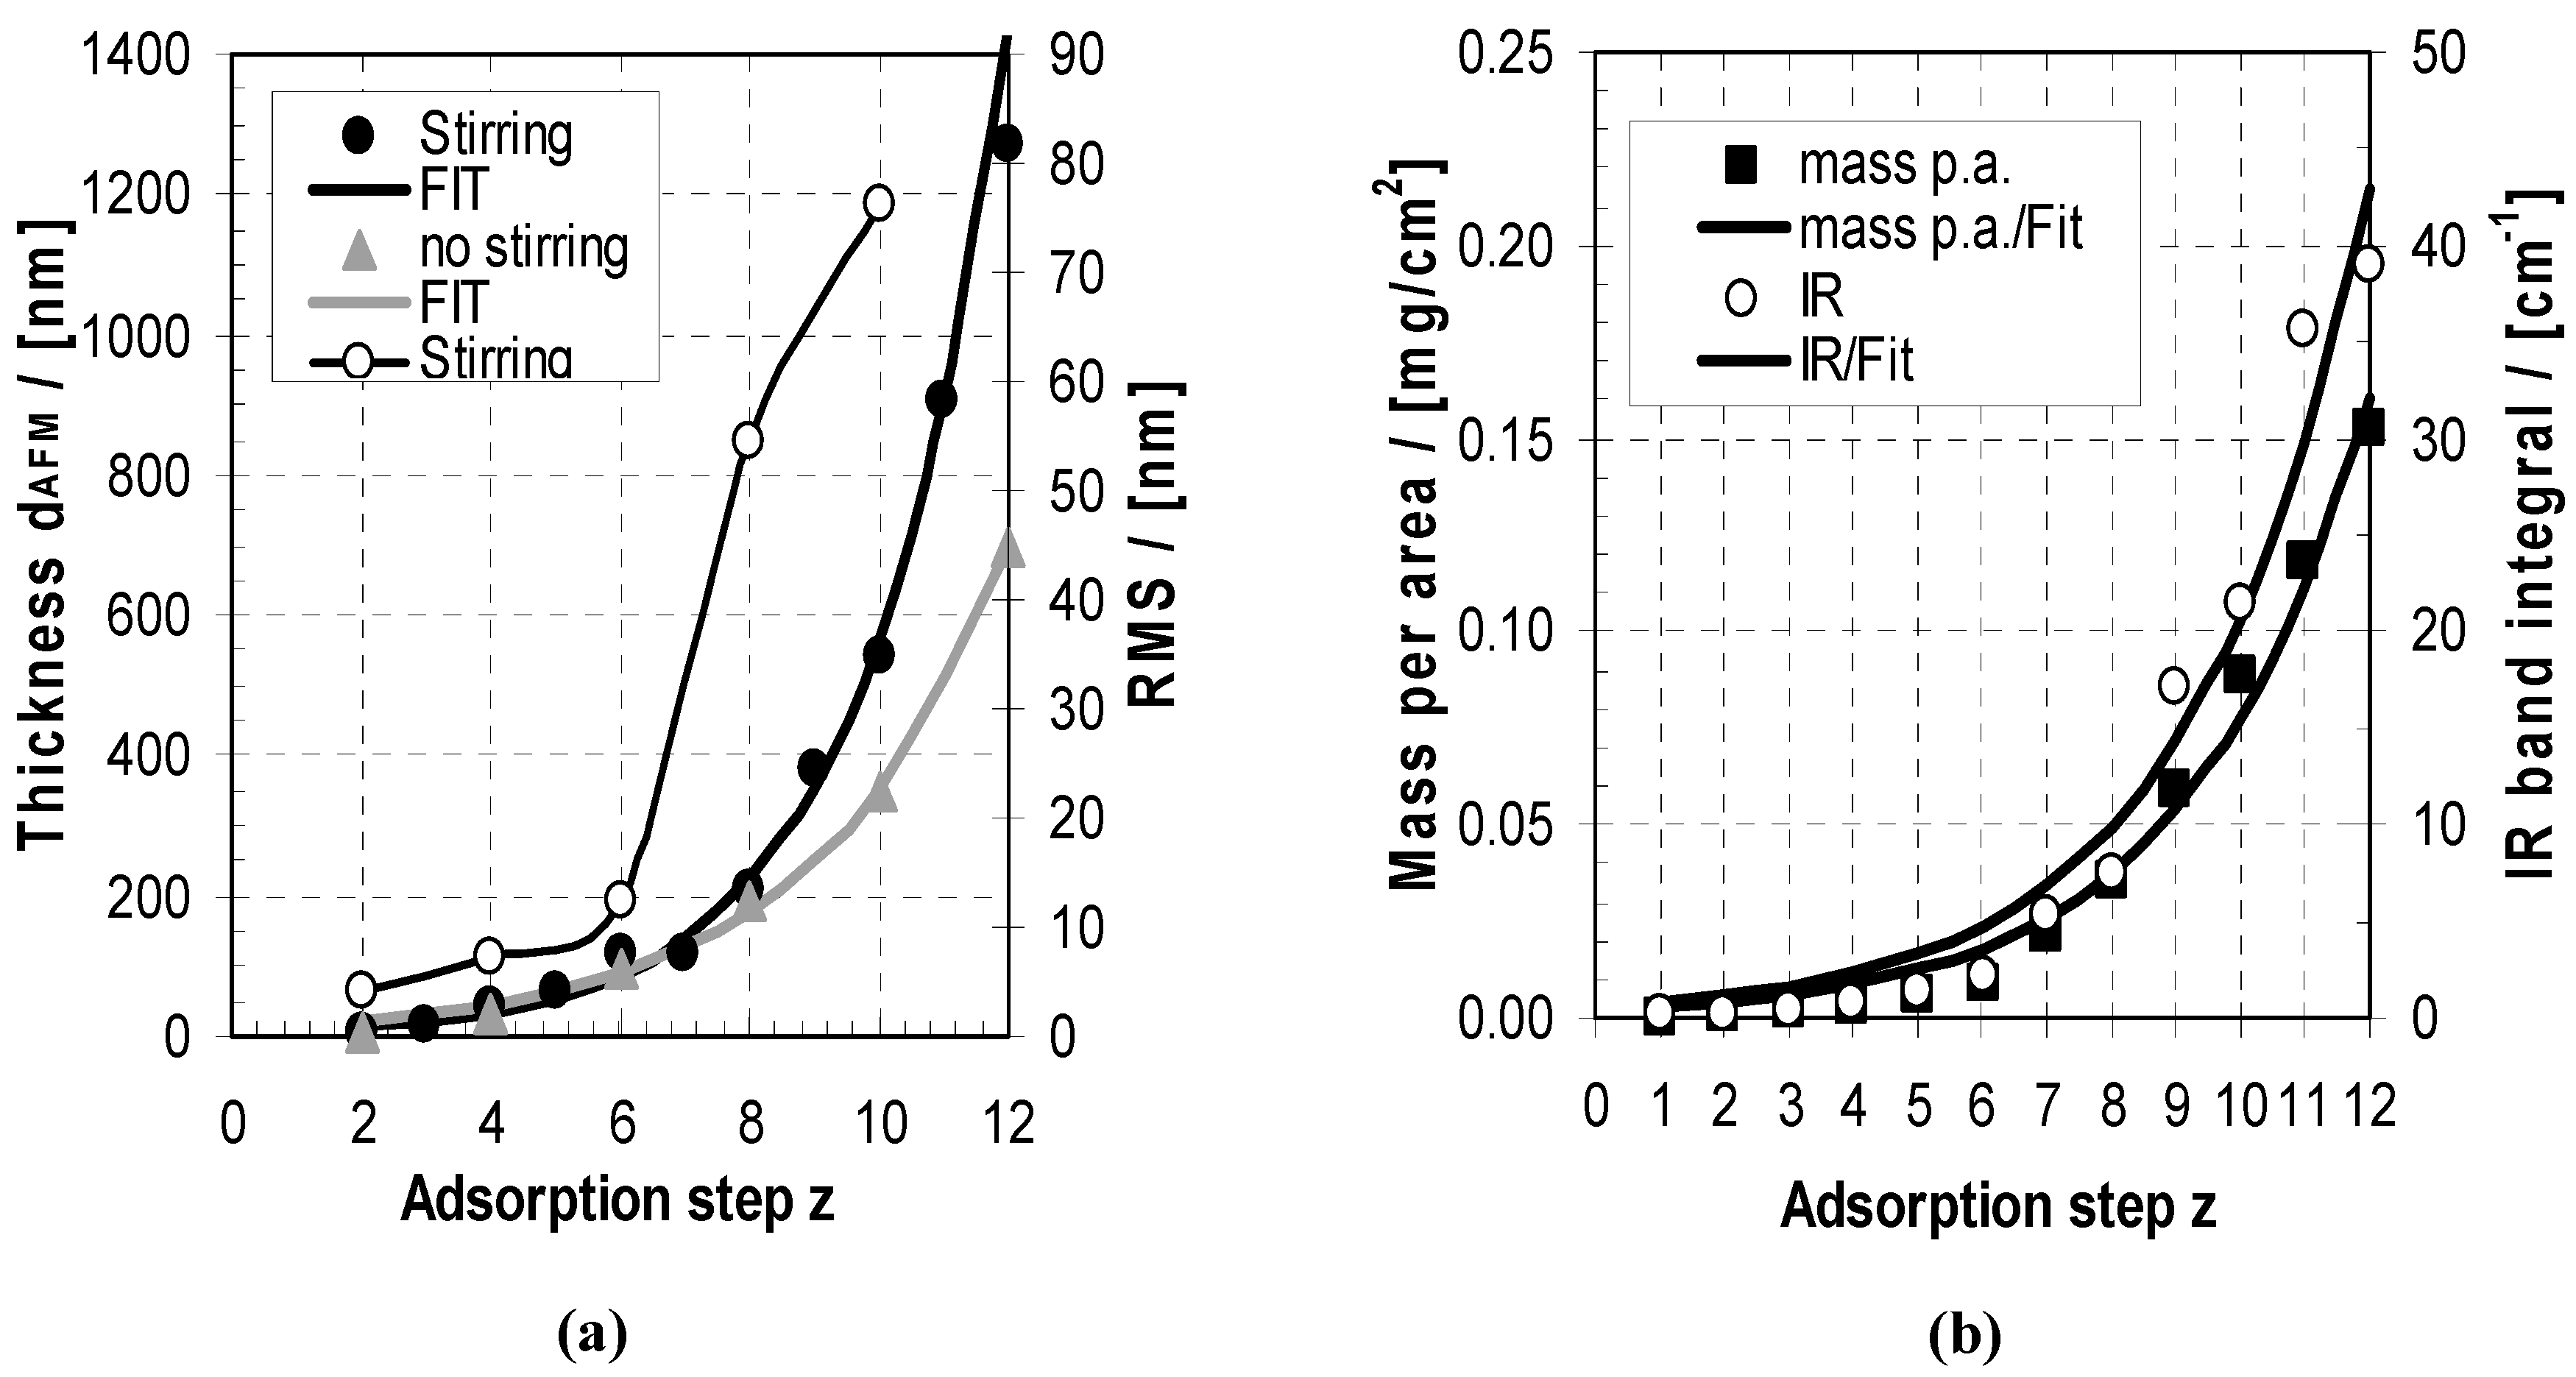
2.2. Deposition and Morphology in Relation to z
2.2.1. Deposition
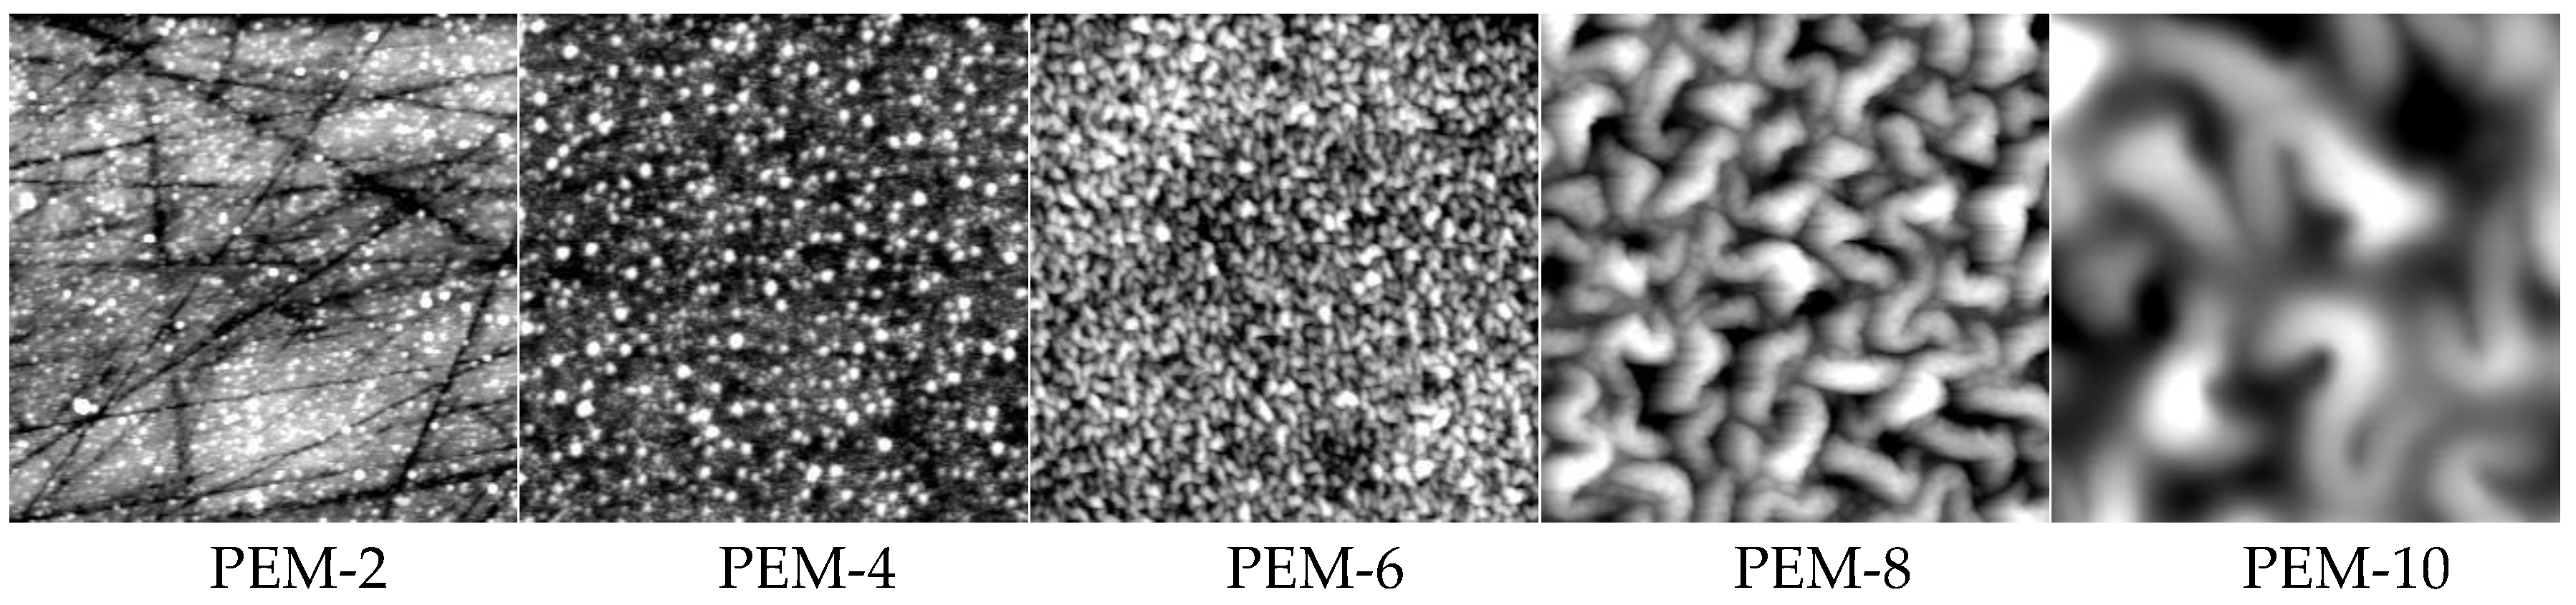
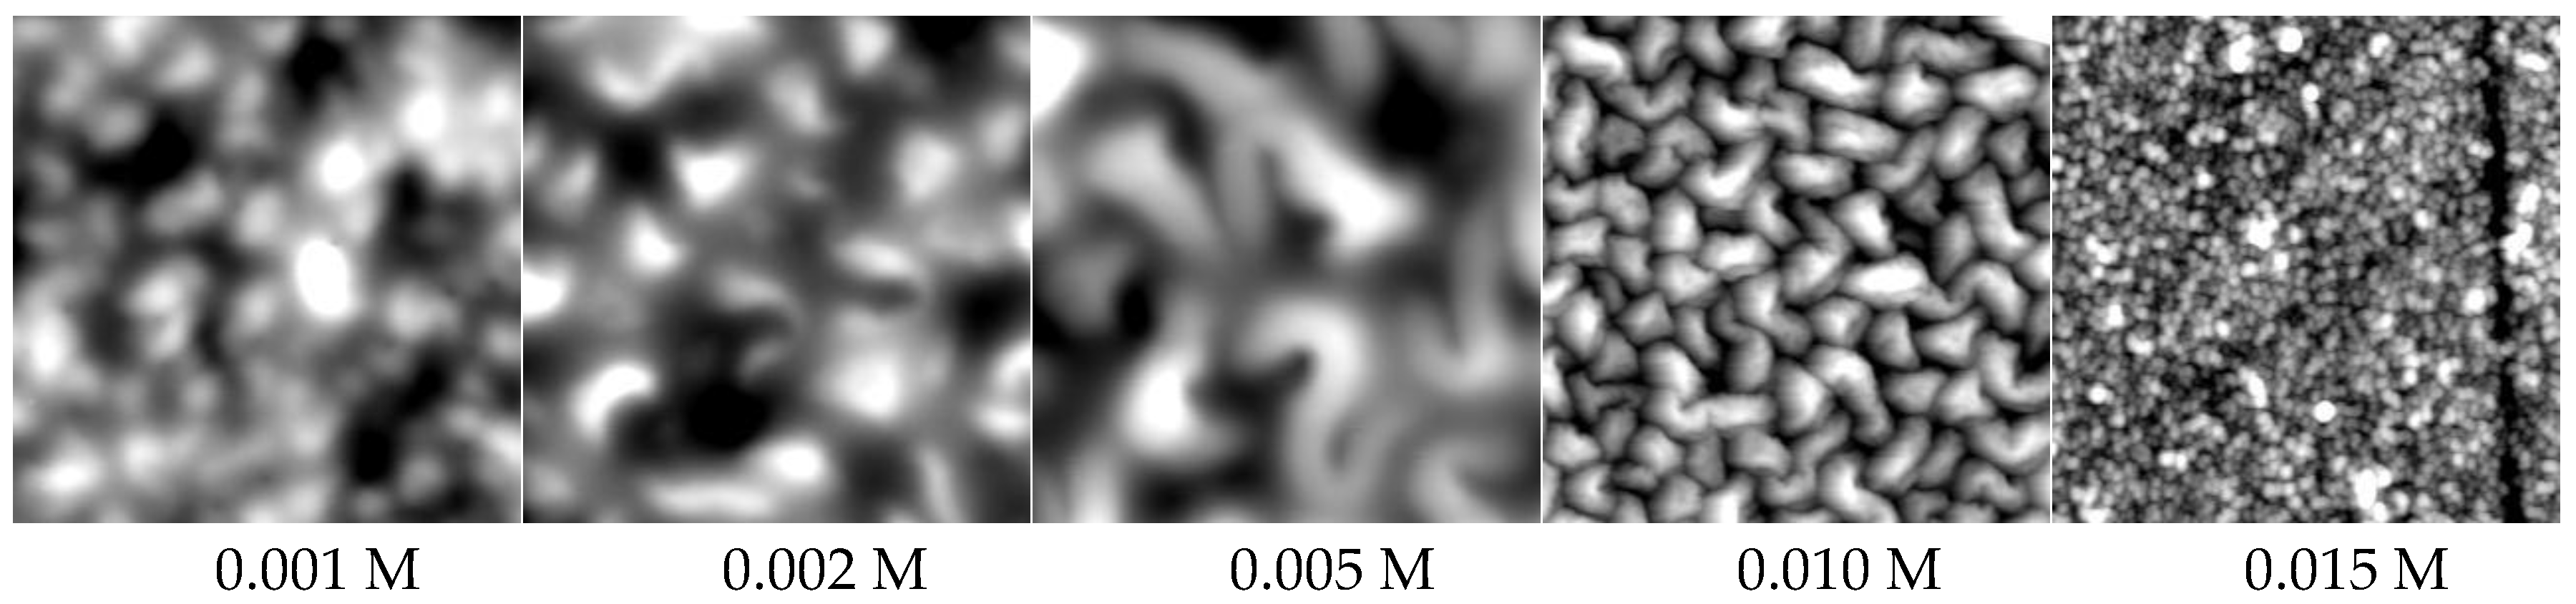
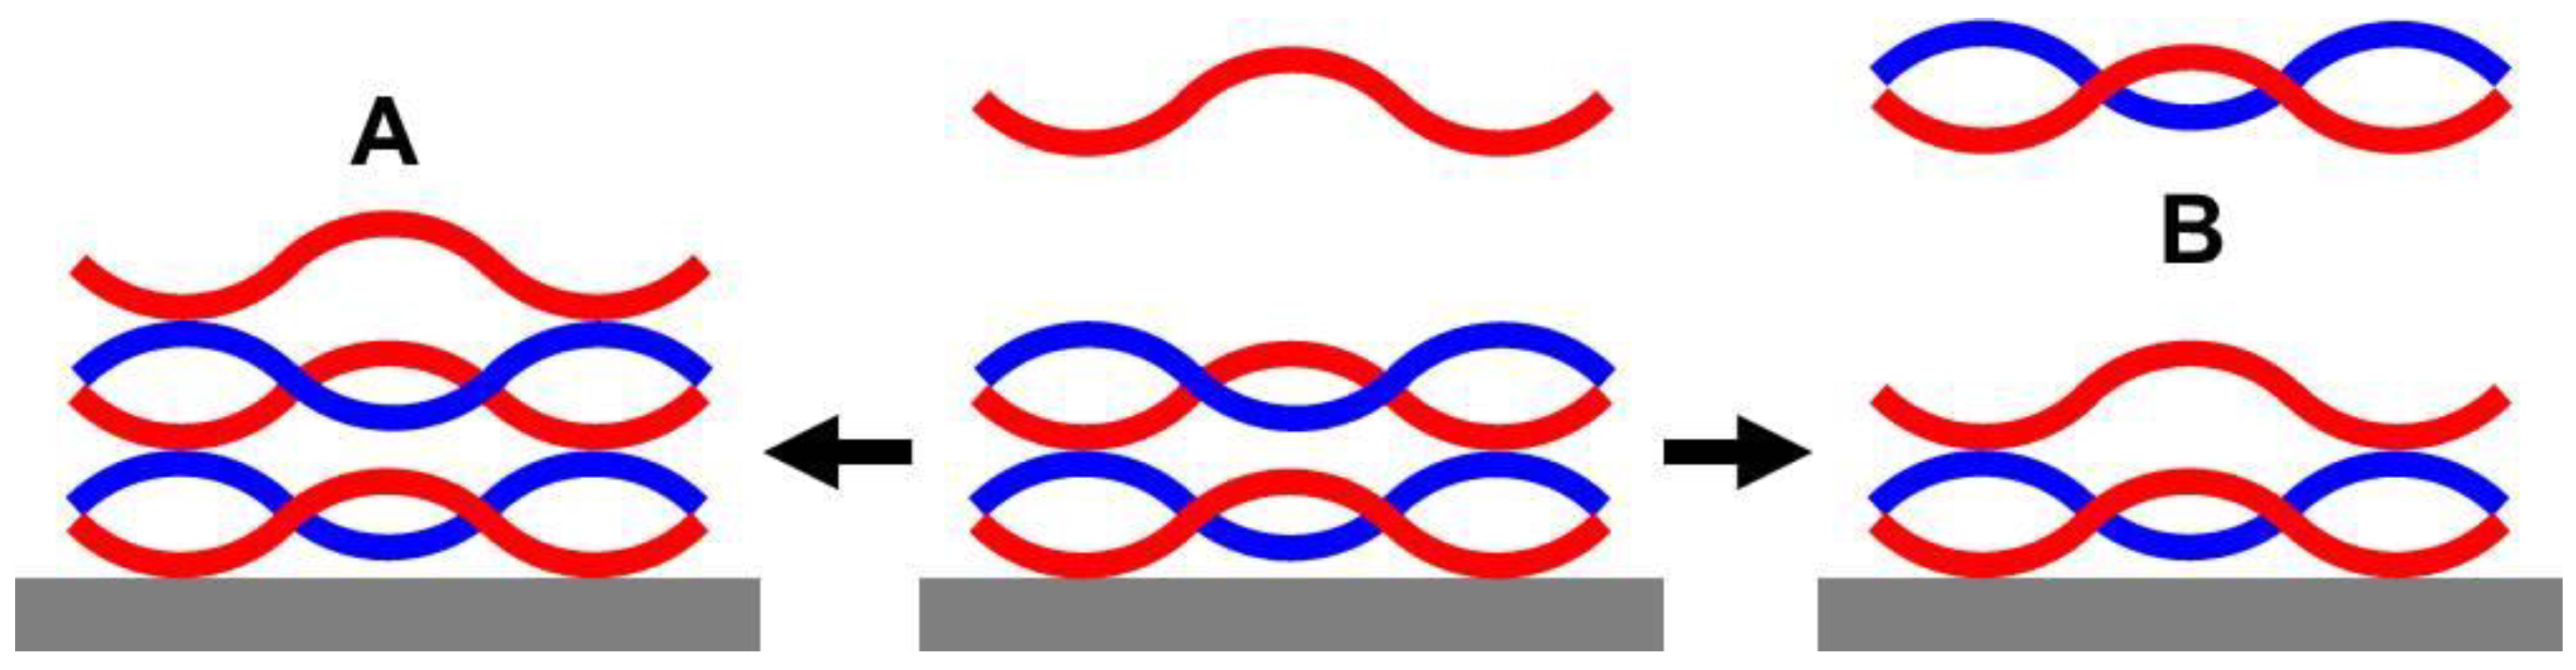
2.2.2. Morphology
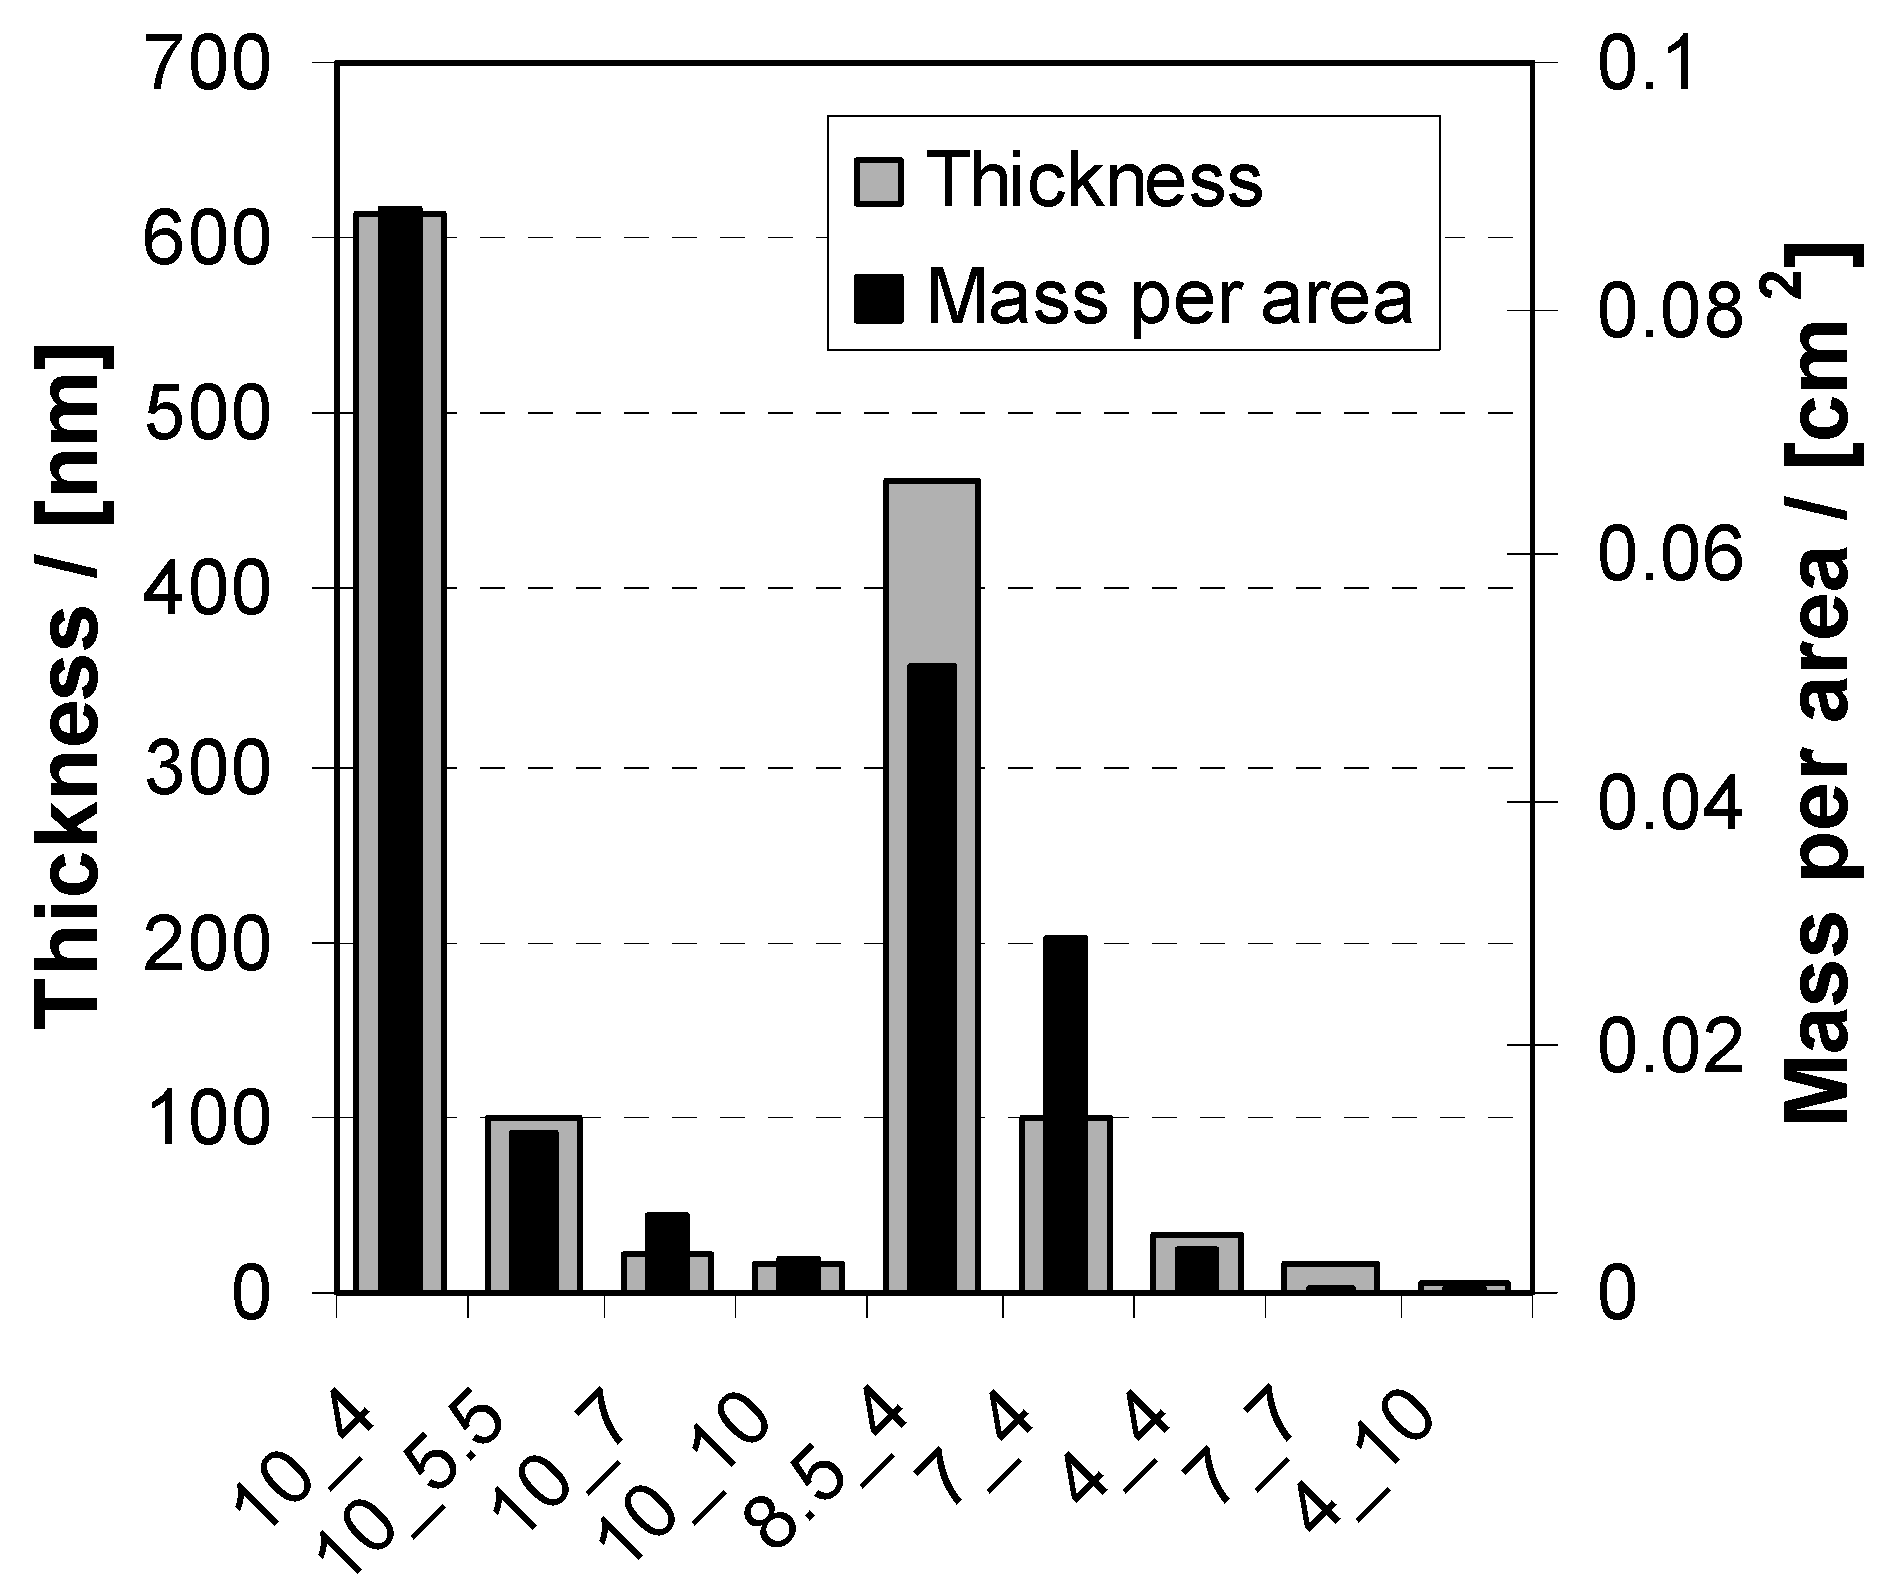
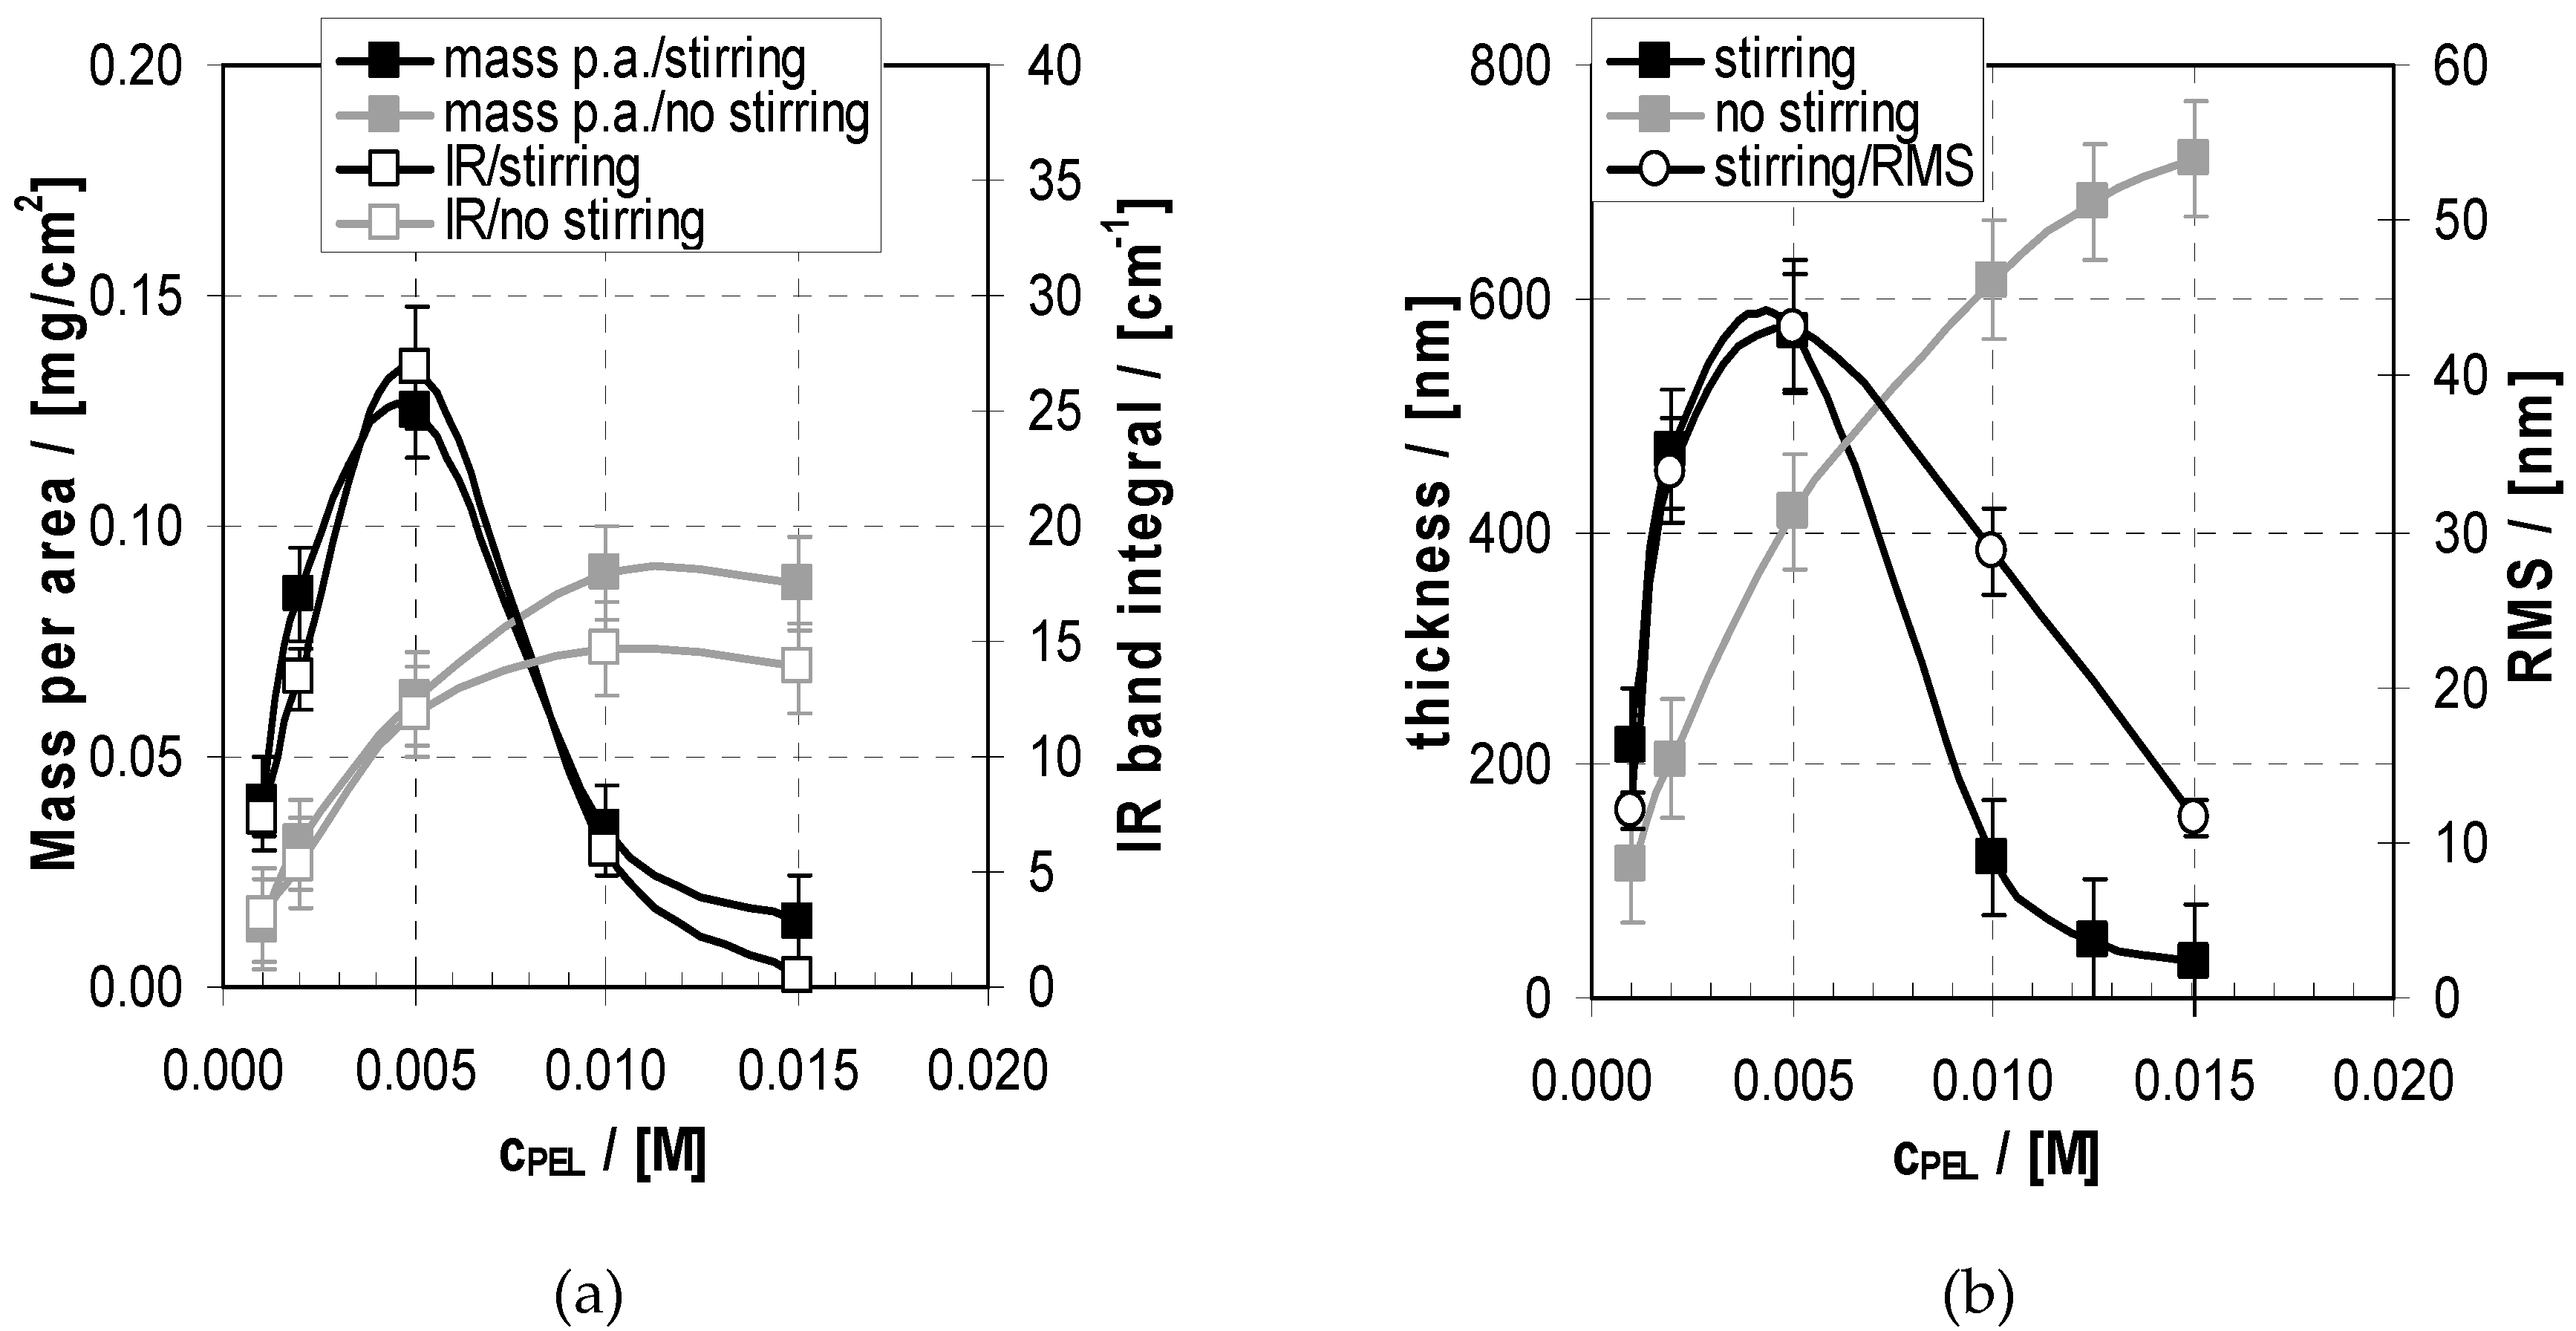
2.3. Deposition and Morphology Data of PEM-10 in Relation to cPEL
2.3.1. Deposition
2.3.2. Morphology
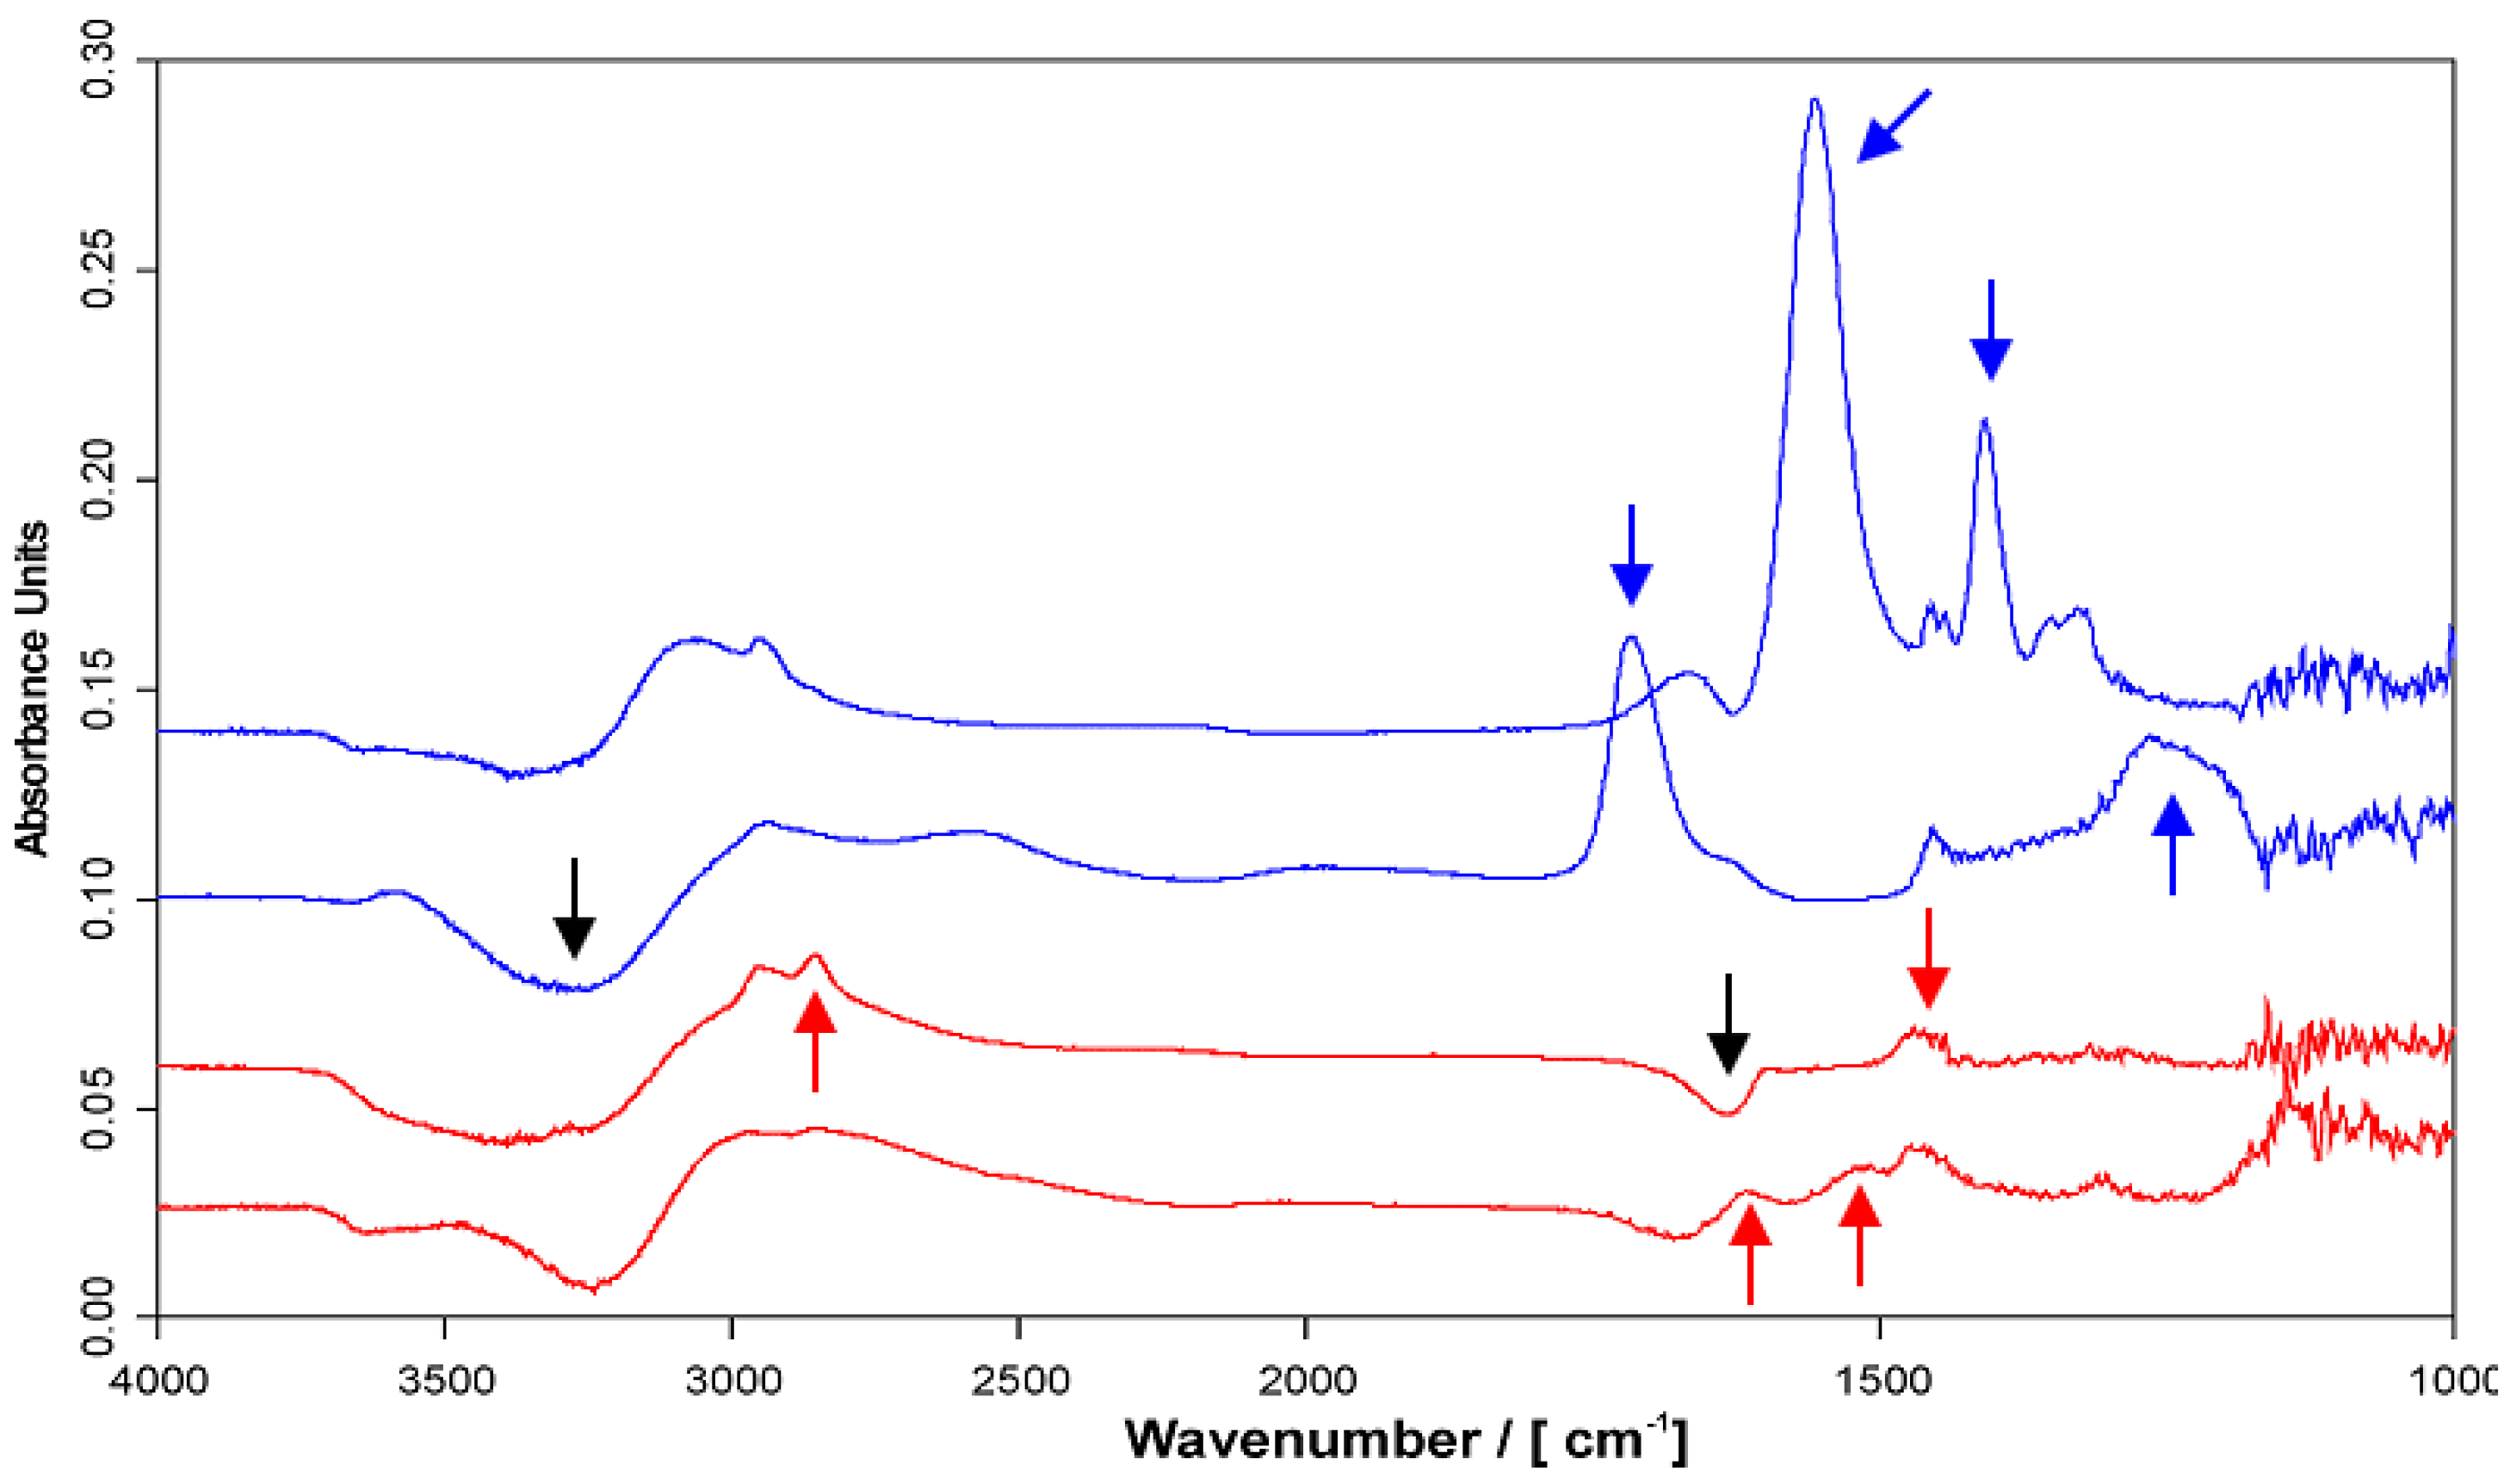
2.4. Chemical Composition of PEMs
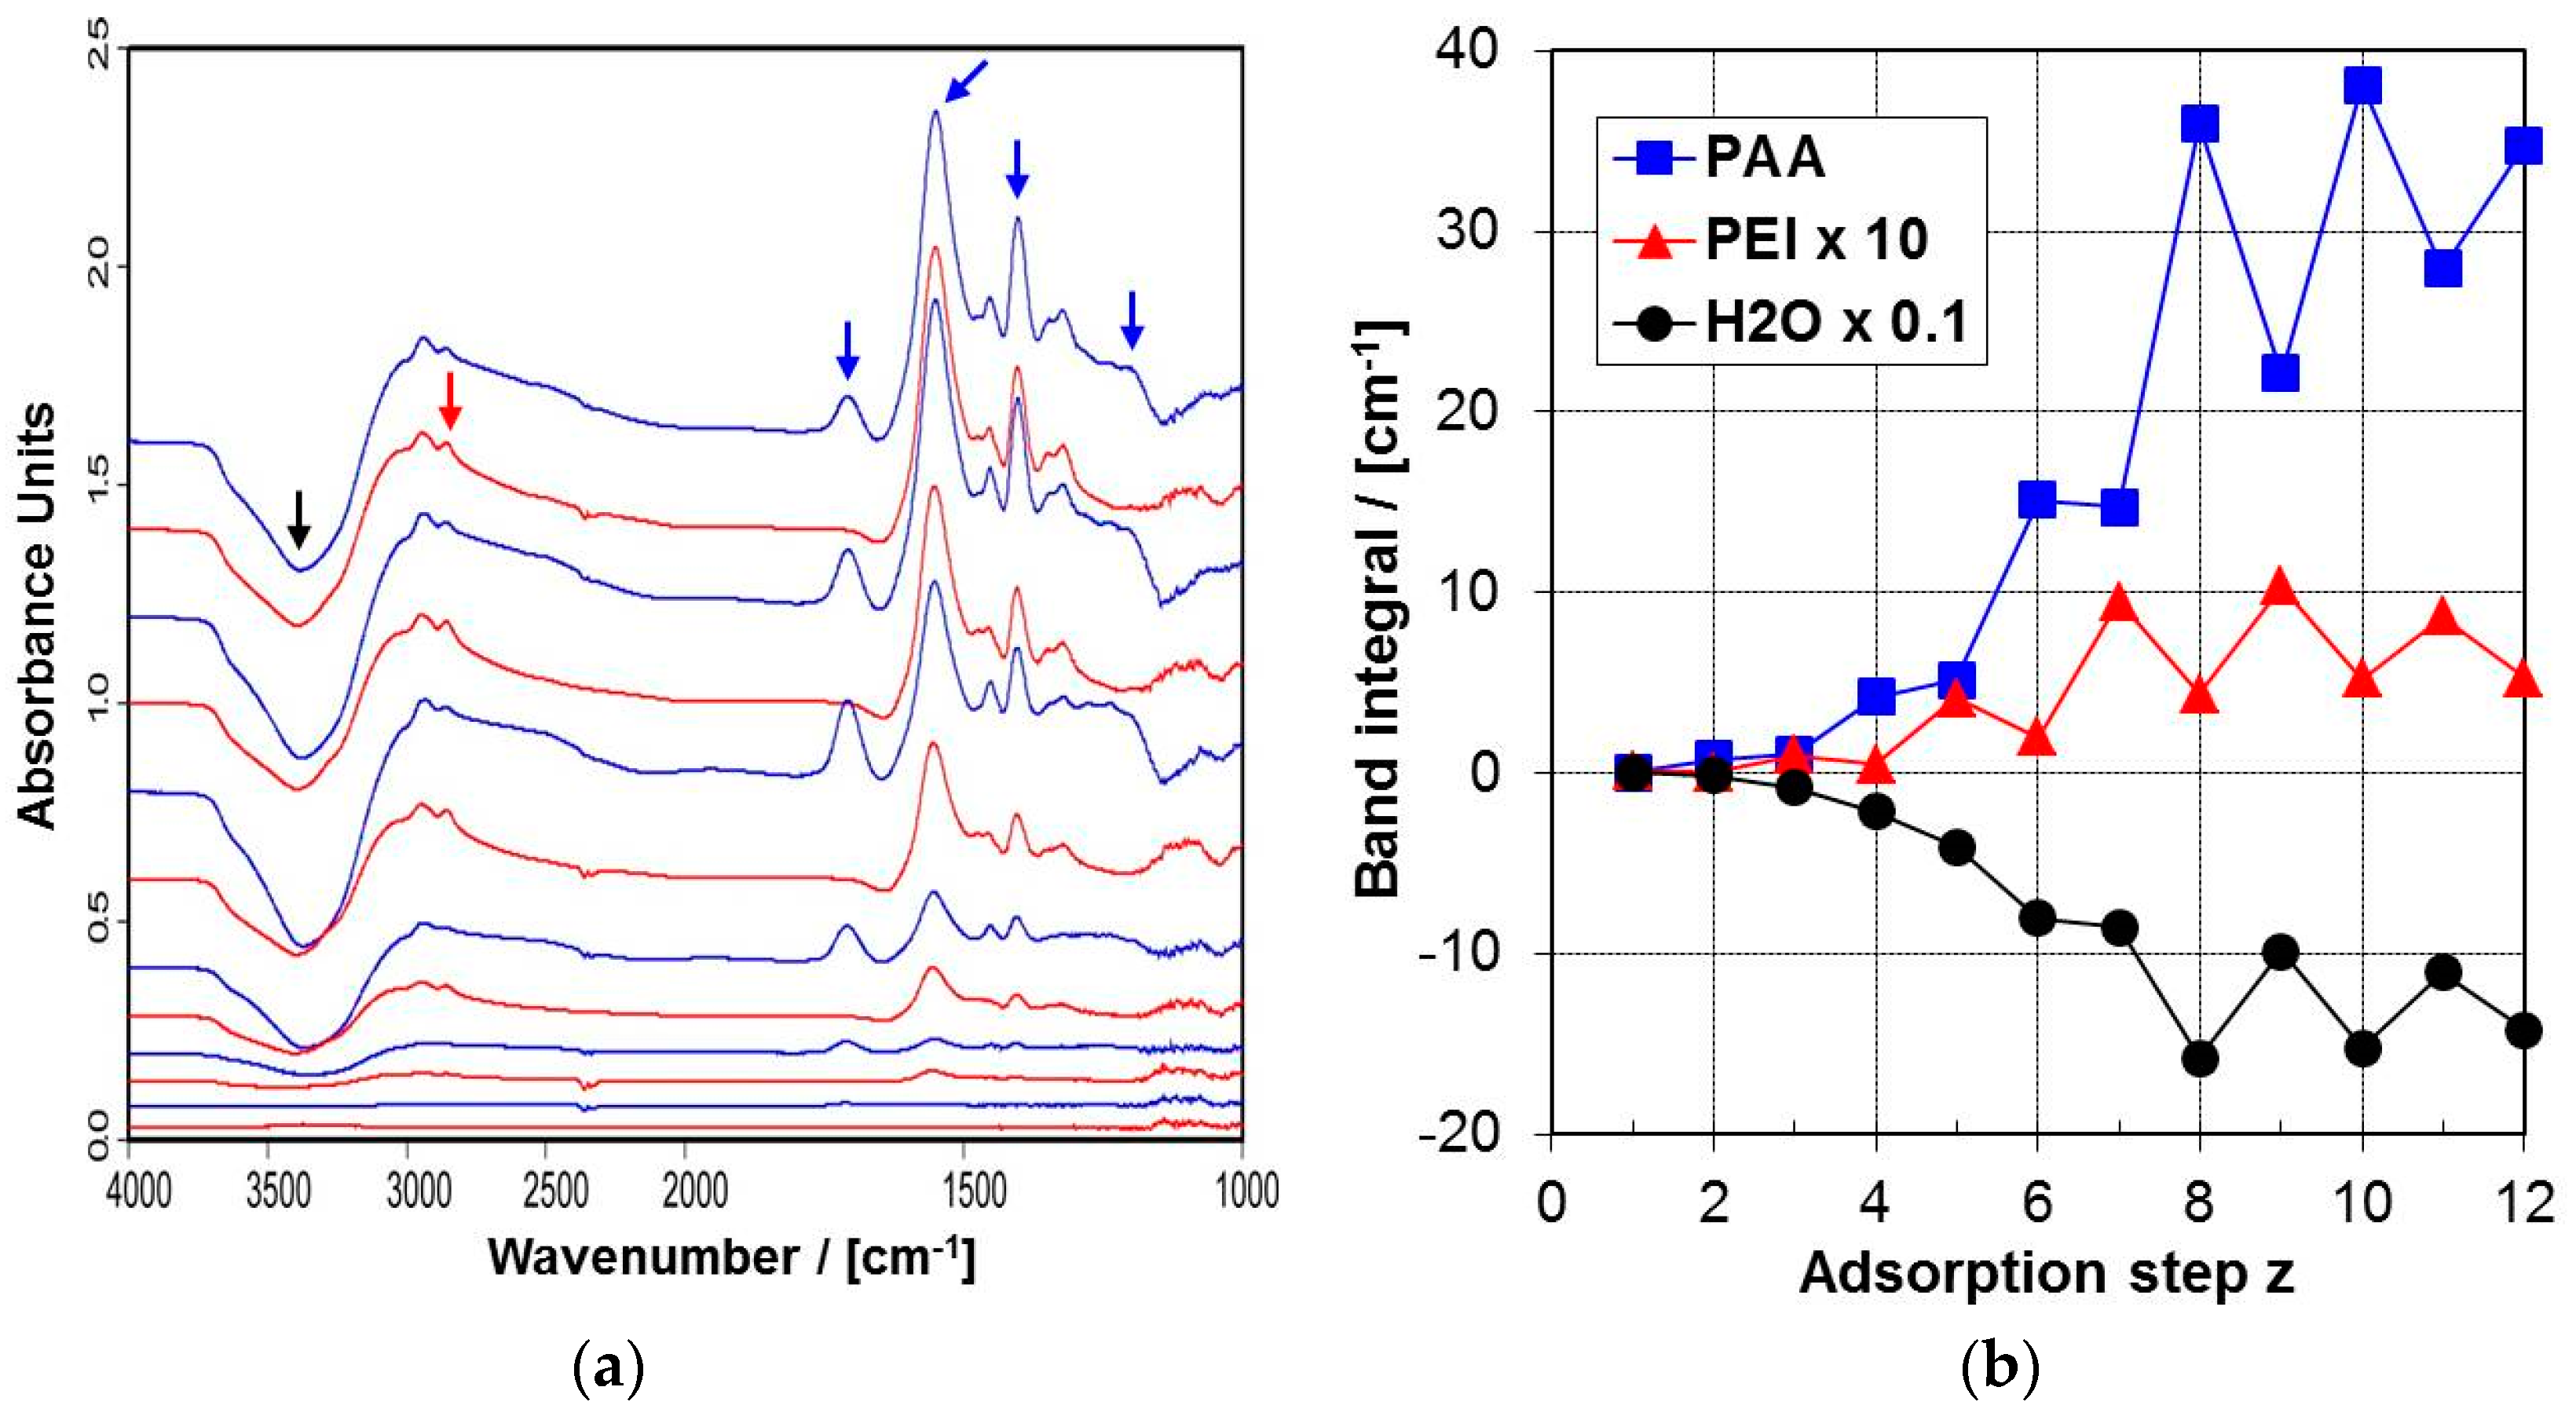
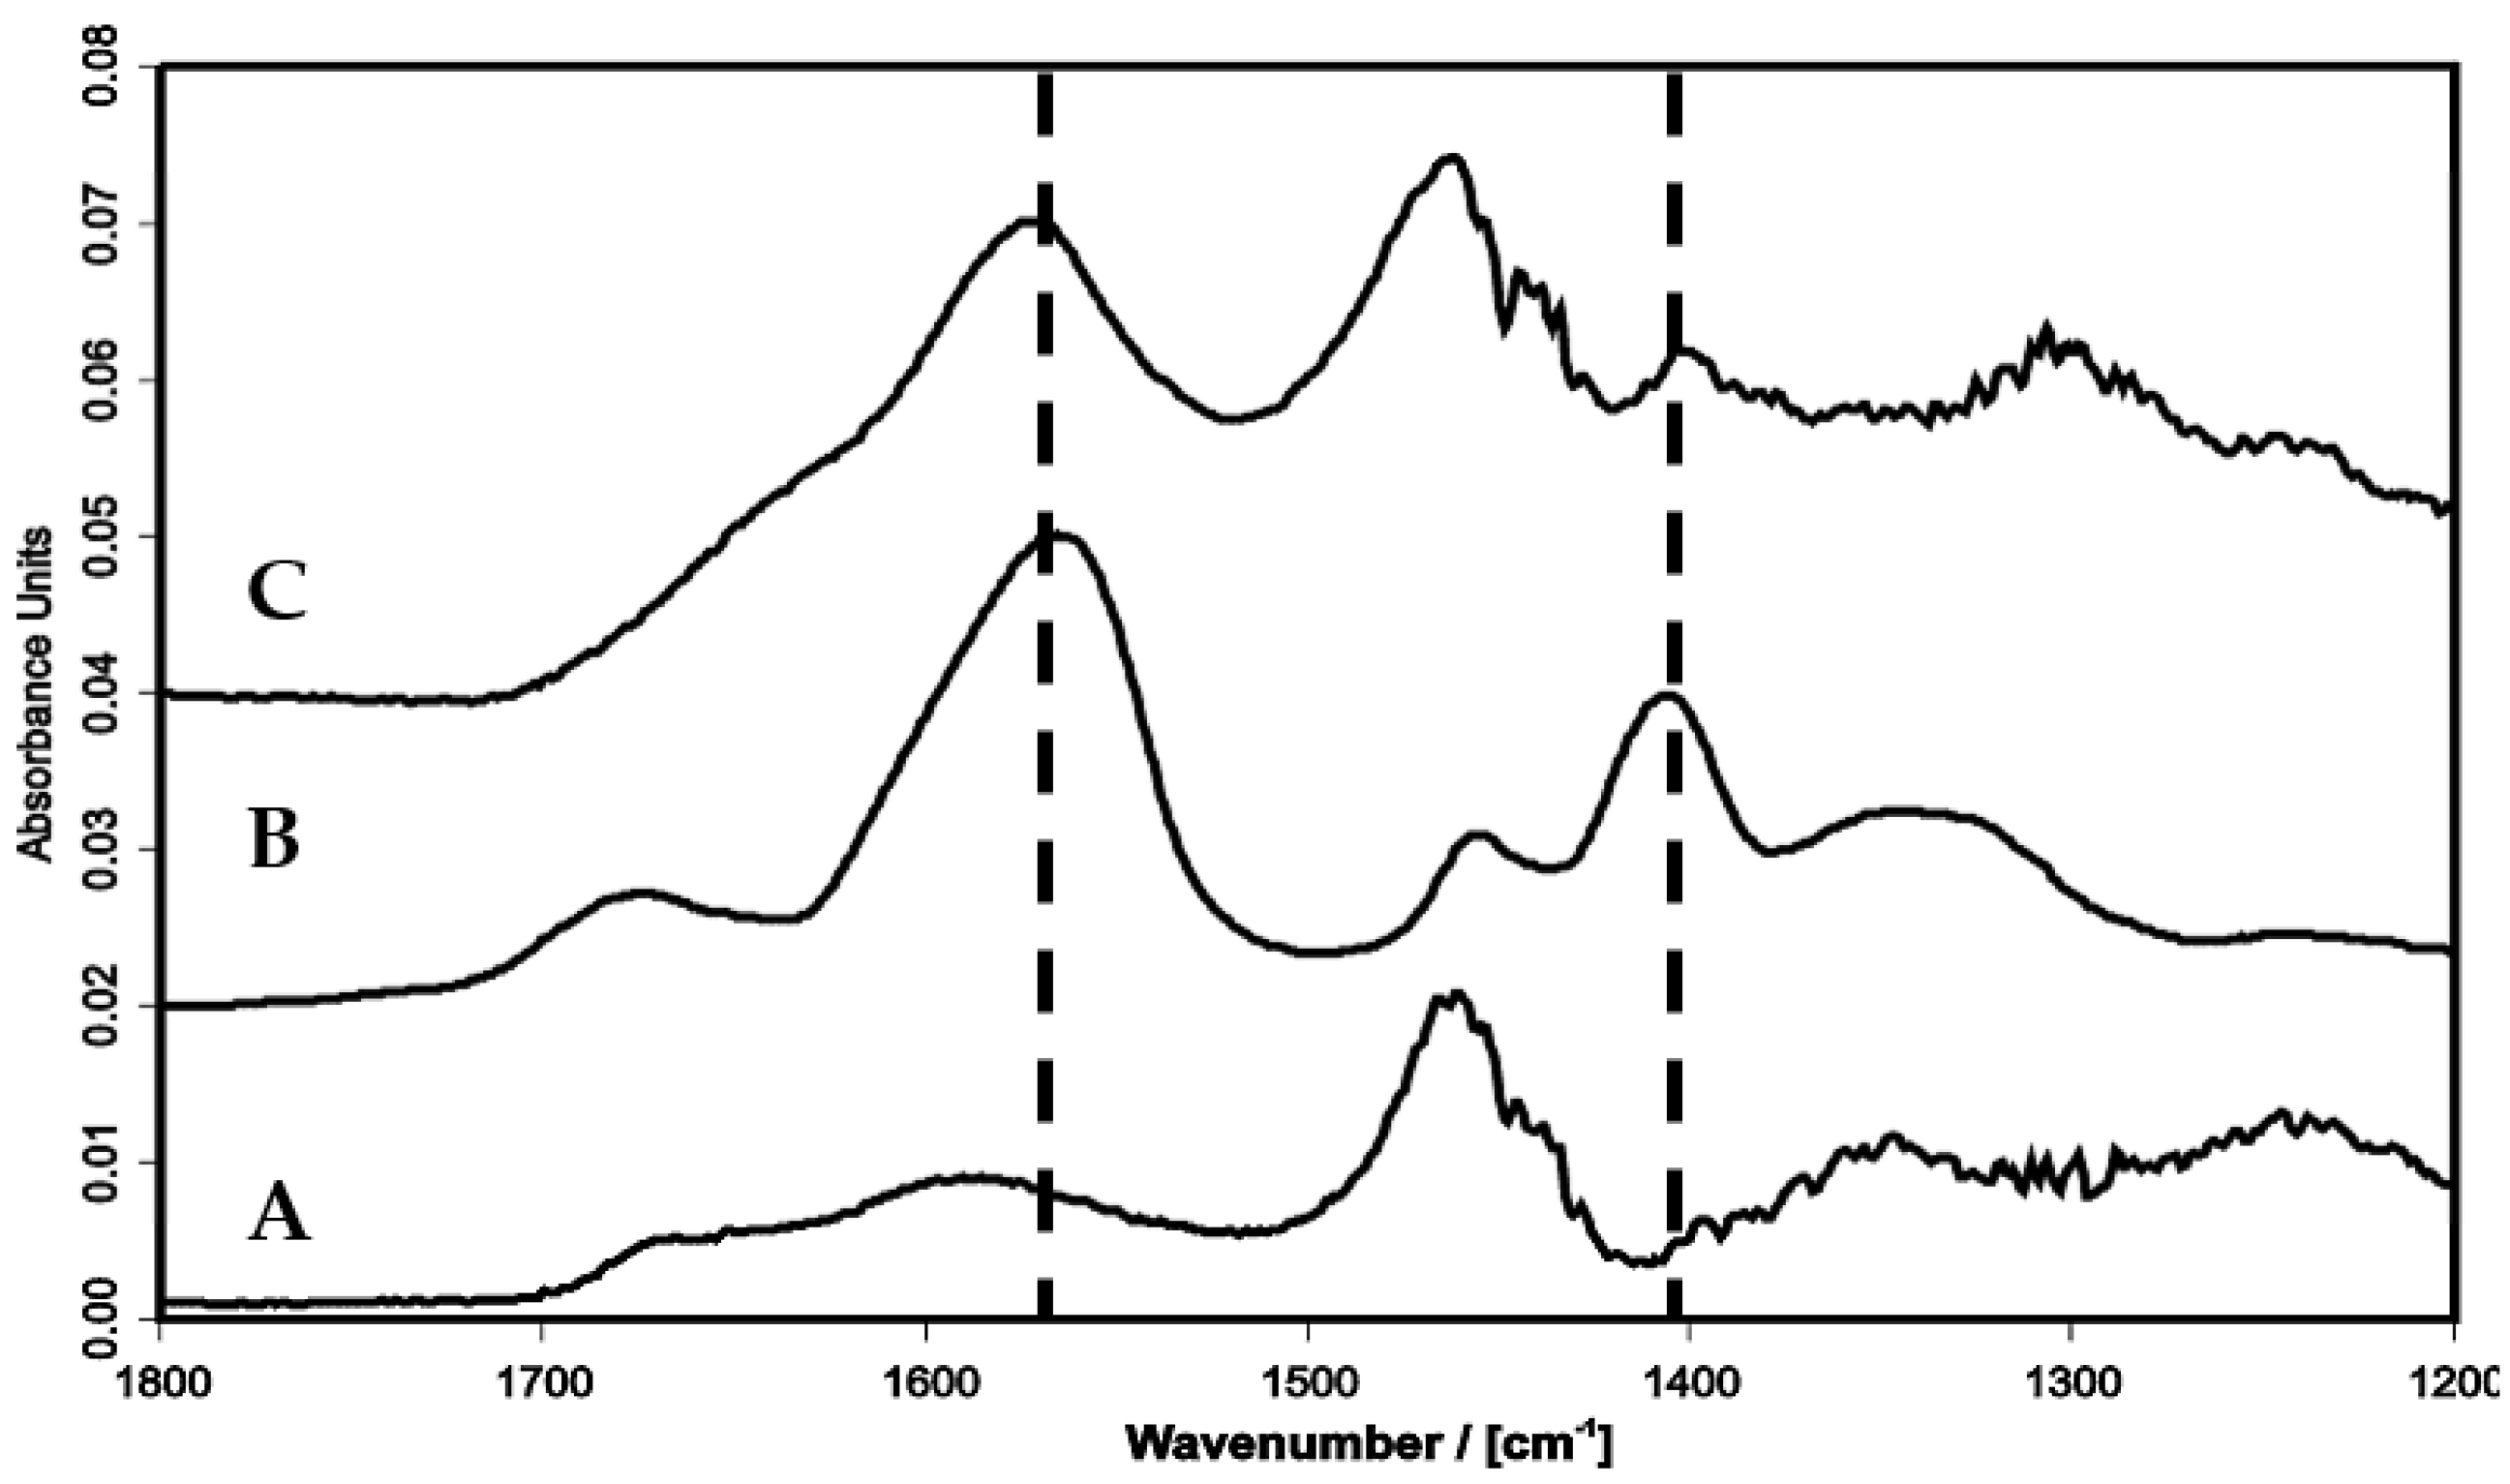
2.4.1. ATR-FTIR Spectra
2.4.2. ATR-FTIR Deposition Data
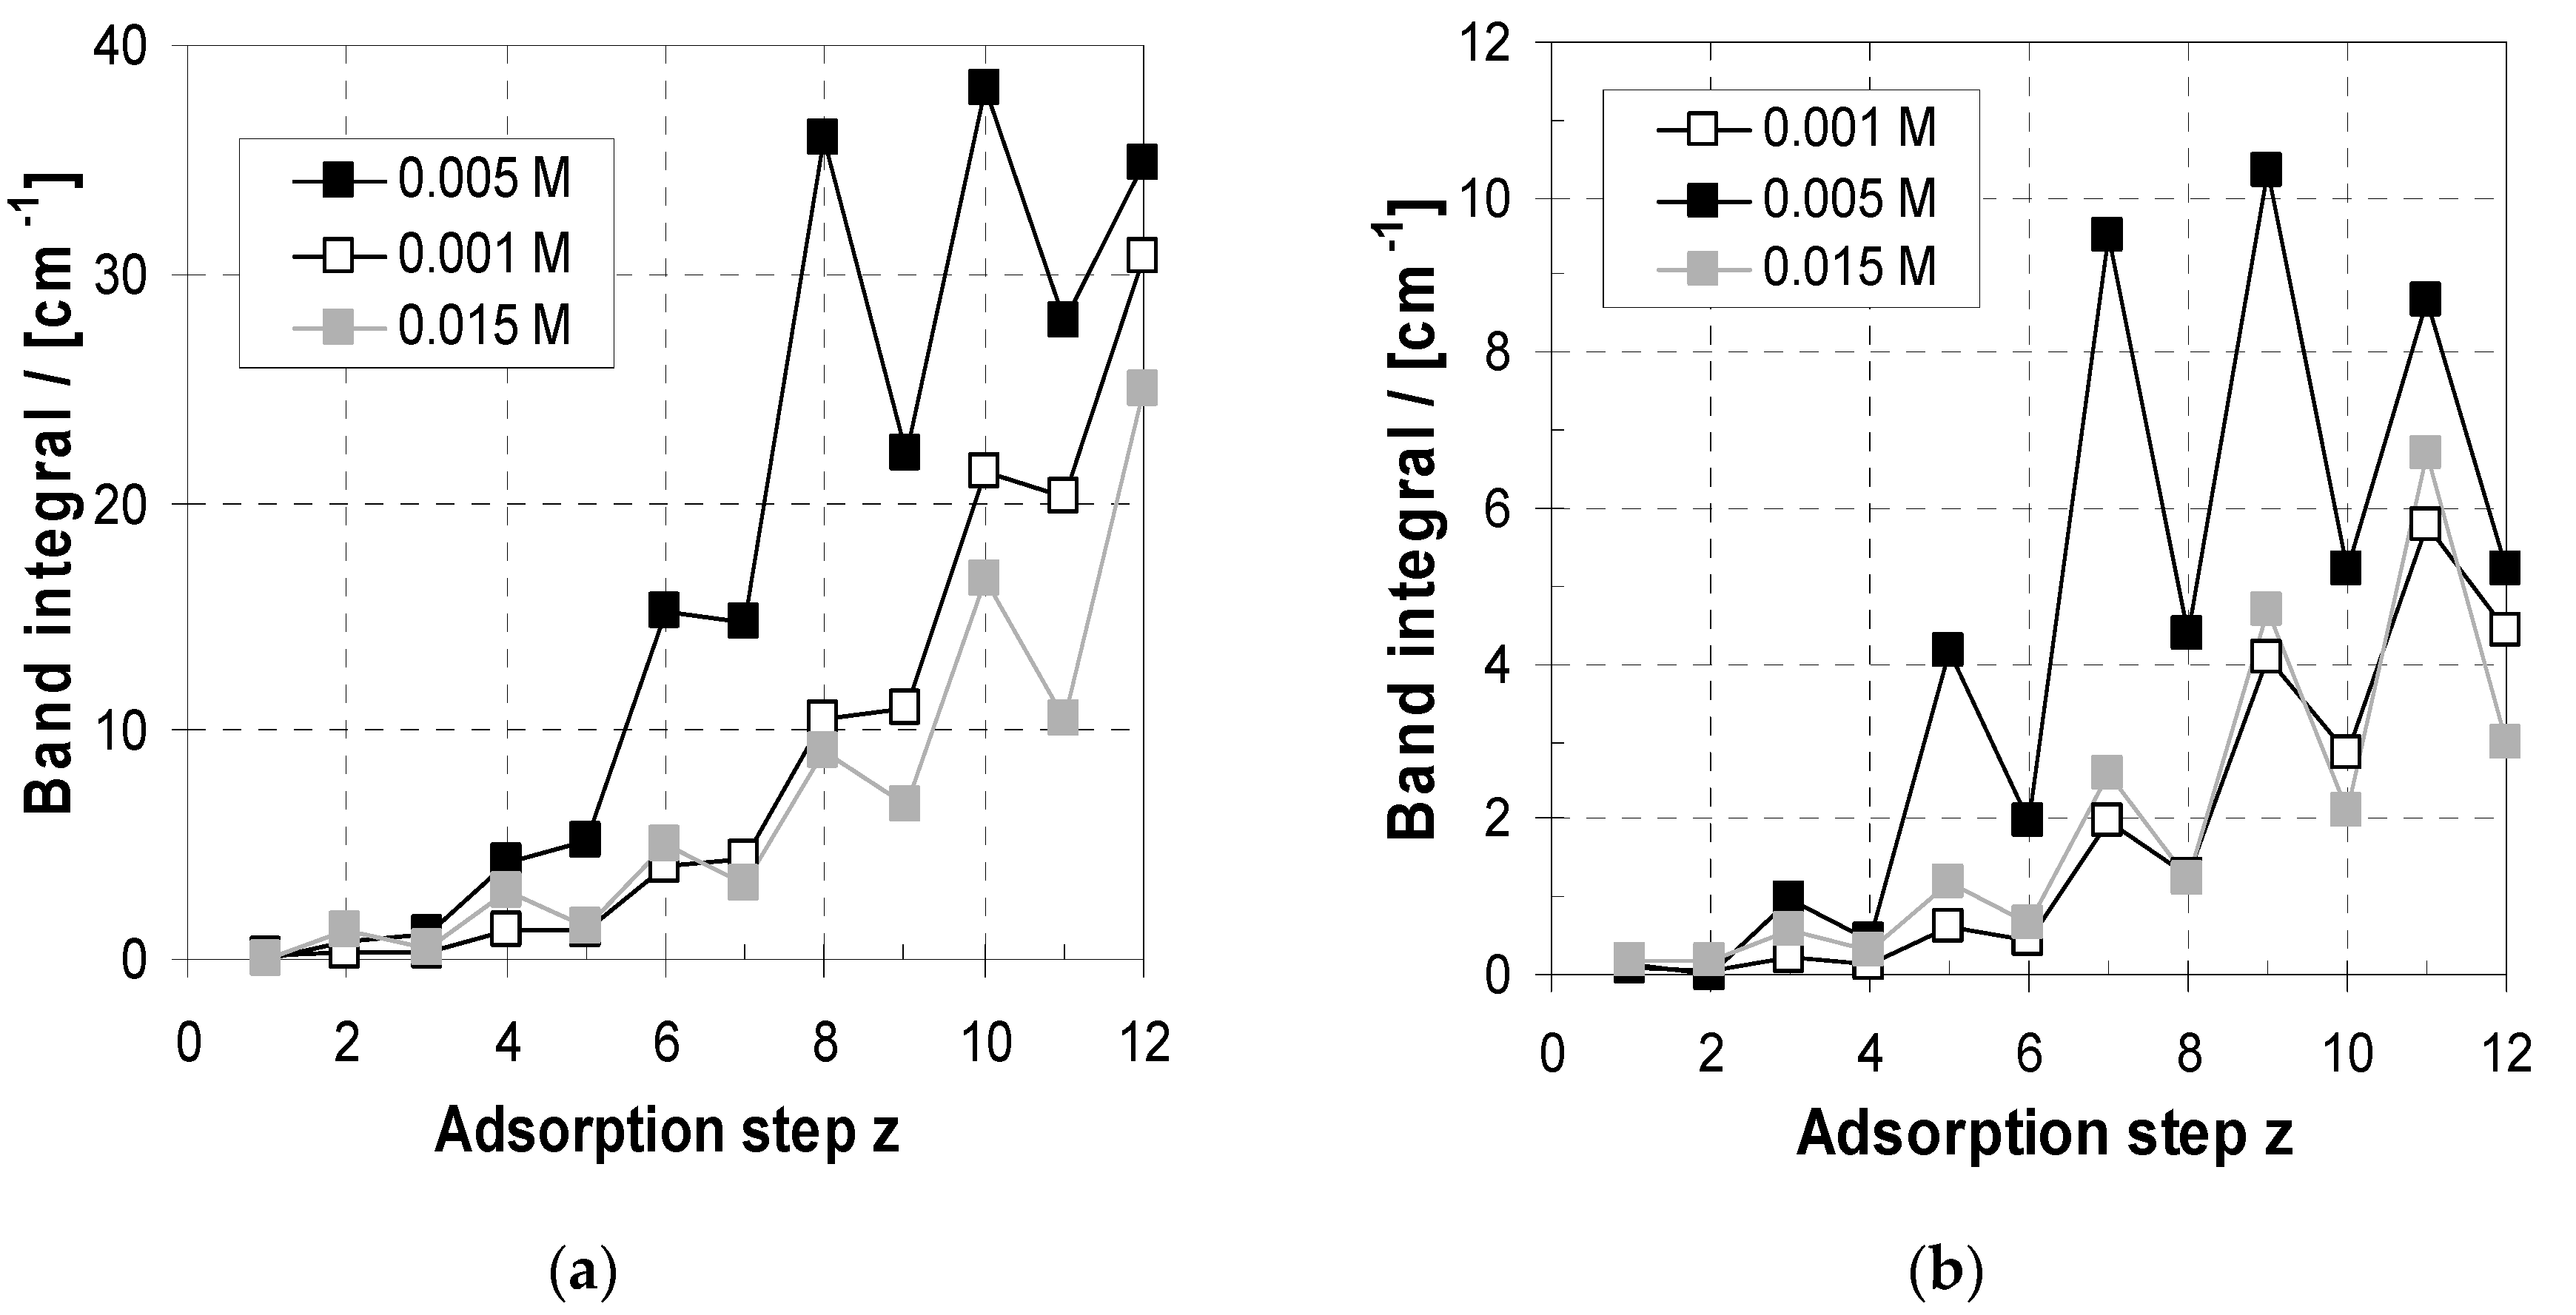
2.4.3. Influence of cPEL on Uptake/Loss Modulation Amplitude
2.4.4. Soluble PEI/PAA Complexes
3. Materials and Methods
3.1. Materials
3.2. PEM Deposition
3.3. Scanning Force Microscopy (SFM)
3.4. In Situ Attenuated Total Reflection Fourier Transform Infrared (ATR-FTIR) Spectroscopy
3.5. Ex Situ ATR-FTIR Spectroscopy
3.6. Transmission-(TRANS)-FTIR Spectroscopy
3.7. Gravimetry
4. Conclusions
Funding
Acknowledgments
Conflicts of Interest
References
- Decher, G.; Hong, J.D.; Schmitt, J. Buildup of ultrathin multilayer films by a self-assembly process: III. Consecutively alternating adsorption of anionic and cationic polyelectrolytes on charged surfaces. Thin Solid Films 1992, 210, 831–835. [Google Scholar] [CrossRef]
- Bertrand, P.; Jonas, A.; Laschewsky, A.; Legras, R. Ultrathin polymer coatings by complexation of polyelectrolytes at interfaces: Suitable materials, structure and properties. Macromol. Rapid Commun. 2000, 21, 319–348. [Google Scholar] [CrossRef]
- Schönhoff, M. Layered polyelectrolyte complexes: Physics of formation and molecular properties. J. Phys. Condens. Matter 2003, 15, 1781. [Google Scholar] [CrossRef]
- Decher, G.; Schlenoff, J.B. (Eds.) Multilayer Thin Films-Sequential Assembly of Nanocomposite Materials; Wiley-VCH: Weinheim, Germany, 2003. [Google Scholar]
- Richardson, J.J.; Cui, J.; Bjornmalm, M.; Braunger, J.A.; Ejima, H.; Caruso, F. Innovation in layer-by-layer assembly. Chem. Rev. 2016, 116, 14828–14867. [Google Scholar] [CrossRef] [PubMed]
- Izumrudov, V.A.; Mussabayev, V.K.; Murzagulov, K.V. Polyelectrolyte multilayers: Preparation and applications. Russ. Chem. Rev. 2018, 87, 192–200. [Google Scholar] [CrossRef]
- Kudaibergenov, S.E.; Tatykhanova, G.; Bakranov, N.; Tursunova, R. Layer-by-Layer Thin Films and Coatings Containing Metal Nanoparticles in Catalysis. Chapter 8. In Thin Film Processes—Artifacts on Surface Phenomena and Technological Facets; Thirumalai, J., Ed.; InTech: London, UK, 2017; pp. 147–164. [Google Scholar]
- Santos, A.C.; Caldas, M.; Pattekari, P.; Ribeiro, C.F.; Ribeiro, A.J.; Lvov, Y.; Veiga, F. LbL Coated Drug-Core Nanoparticles as Versatile Delivery Platforms, Chapter 16. In Design and Development of New Nanocarriers; Grumezescu, A.M., Ed.; Elsevier: Amsterdam, The Netherlands, 2018; pp. 596–637. [Google Scholar]
- Zhao, S.; Caruso, F.; Dähne, L.; Decher, G.; De Geest, B.G.; Fan, J.; Feliu, N.; Gogotsi, Y.; Hammond, P.T.; Hersam, M.C.; et al. The future of layer-by-layer assembly: A tribute to ACS Nano Associate Editor Helmuth Möhwald. ACS Nano 2019. [Google Scholar] [CrossRef] [PubMed]
- Kim, H.; Urban, M.W. Reactions of thrombresistant multilayered thin films on poly(vinylchloride) (PVC) surfaces: A spectroscopic study. Langmuir 1998, 14, 7235–7244. [Google Scholar] [CrossRef]
- Müller, M.; Rieser, T.; Lunkwitz, K.; Berwald, S.; Meier-Haack, J.M.; Jehnichen, D. An in-situ ATR-FTIR study on polyelectrolyte multilayer assemblies on solid surfaces and their susceptibiliy to fouling. Macromol. Rapid Commun. 1998, 19, 333–336. [Google Scholar]
- Elbert, D.L.; Herbert, C.B.; Hubbell, J.A. Thin polymer layers formed by polyelectrolyte multilayer techniques on biological surfaces. Langmuir 1999, 15, 5355–5362. [Google Scholar] [CrossRef]
- Brynda, E.; Houska, M.; Jirouskova, M.; Dyr, J.E. Albumin and heparin multilayer coatings for blood-contacting medical devices. J. Biomed Mater. Res. 2000, 51, 249–257. [Google Scholar] [CrossRef]
- Wu, A.; Yoo, D.; Lee, J.K.; Rubner, M.F. Solid-state light-emitting devices based on the tris-chelated ruthenium (II) complex: 3. High efficiency devices via a layer-by-layer molecular-level blending approach. J. Am. Chem. Soc. 1999, 121, 4883–4891. [Google Scholar] [CrossRef]
- Brynda, E.; Houska, M.; Brandenburg, A.; Wikerstal, A.; Skvor, J. The detection of human β2-microglobulin by grating coupler immunosensor with three dimensional antibody networks. Biosens. Bioelectron. 1999, 14, 363–368. [Google Scholar] [CrossRef]
- Caruso, F.; Furlong, F.N.; Ariga, K.; Ichinose, I.; Kunitake, T. Characterization of polyelectrolyte-protein multilayer films by atomic force microscopy, scanning electron microscopy and Fourier transform infrared reflection-absorption spectroscopy. Langmuir 1998, 14, 4559–4565. [Google Scholar] [CrossRef]
- Van Ackern, F.; Krasemann, L.; Tieke, B. Ultrathin membranes for gas separation and pervaporation prepared upon electrostatic self-assembly of polyelectrolytes. Thin Solid Films 1998, 762, 327–329. [Google Scholar] [CrossRef]
- Lenk, W.; Meier-Haack, J. Polyelectrolyte multilayer membranes for pervaporation separation of aqueous-organic mixtures. Desalination 2002, 148, 11–16. [Google Scholar] [CrossRef]
- Stanton, B.W.; Harris, J.J.; Miller, M.D.; Bruening, M.L. Ultrathin, multilayered polyelectrolyte films as nanofiltration membranes. Langmuir 2003, 19, 7038–7042. [Google Scholar] [CrossRef]
- Abtahi, S.M.; Ilyas, S.; Joannis Cassan, C.; Albasi, C.; de Vos, W.M. Micropollutants removal from secondary-treated municipal wastewater using weak polyelectrolyte multilayer based nanofiltration membranes. J. Membr. Sci. 2018, 548, 654–666. [Google Scholar] [CrossRef]
- Netz, R.R.; Joanny, J.F. Adsorption of semiflexible polyelectrolytes on charged planar surfaces: Charge compensation, charge reversal, and multilayer formation. Macromolecules 1999, 32, 9013–9025. [Google Scholar] [CrossRef]
- Castelnovo, M.; Joanny, J.F. Formation of polyelectrolyte multilayers. Langmuir 2000, 16, 7524–7532. [Google Scholar] [CrossRef]
- Ladam, G.; Schaad, P.; Voegel, J.C.; Schaaf, P.; Decher, G.; Cuisinier, F. In situ determination of the structural properties of initially deposited polyelectrolyte multilayers. Langmuir 2000, 16, 1249–1255. [Google Scholar] [CrossRef]
- Hübsch, E.; Ball, V.; Senger, B.; Decher, G.; Voegel, J.C.; Schaaf, P. Controlling the growth regime of polyelectrolyte multilayer films: Changing from exponential to linear growth by adjusting the composition of polyelectrolyte mixtures. Langmuir 2004, 20, 1980–1985. [Google Scholar] [CrossRef]
- Jourdainne, L.; Arntz, Y.; Senger, B.; Debry, C.; Voegel, J.C.; Schaaf, P.; Lavalle, P. Multiple strata of exponentially growing polyelectrolyte multilayer films. Macromolecules 2007, 40, 316–321. [Google Scholar] [CrossRef]
- Garza, J.M.; Schaaf, P.; Muller, S.; Ball, V.; Stoltz, J.F.; Voegel, J.C.; Lavalle, P. Multicompartment films made of alternate polyelectrolyte multilayers of exponential and linear growth. Langmuir 2004, 20, 7298–7302. [Google Scholar] [CrossRef] [PubMed]
- Porcel, C.; Lavalle, P.; Decher, G.; Senger, B.; Voegel, J.C.; Schaaf, P. Influence of the polyelectrolyte molecular weight on exponentially growing multilayer films in the linear regime. Langmuir 2007, 23, 1898–1904. [Google Scholar] [CrossRef] [PubMed]
- Hoogeveen, N.G.; Cohen-Stuart, M.A.; Fleer, G.J.; Böhmer, M.R. Formation and stability of multilayers of polyelectrolytes. Langmuir 1996, 12, 3675–3681. [Google Scholar] [CrossRef]
- Kovacevic, D.; van der Burgh, S.; de Keizer, A.; Cohen-Stuart, M.A. Kinetics of formation and dissolution of weak polyelectrolyte multilayers: Role of salt and free polyions. Langmuir 2002, 18, 5607–5612. [Google Scholar] [CrossRef]
- McAloney, R.A.; Sinyor, M.; Dudnik, V.; Goh, M.C. Atomic force microscopy studies of salt effects on polyelectrolyte multilayer film morphology. Langmuir 2001, 17, 6655–6663. [Google Scholar] [CrossRef]
- Müller, M.; Rieser, T.; Dubin, P.; Lunkwitz, K. Selective interaction between proteins and the outermost surface of polyelectrolyte multilayers: Influence of the polyanion type, pH and salt. Macromol. Rapid Commun. 2001, 22, 390–395. [Google Scholar] [CrossRef]
- Müller, M.; Rieser, T.; Lunkwitz, K.; Meier Haack, J. Polyelectrolyte complex layers: A promising concept for anti-fouling coatings verified by in-situ ATR-FTIR-spectroscopy. Macromol. Rapid Commun. 1999, 20, 607–611. [Google Scholar] [CrossRef]
- Müller, M.; Keßler, B.; Houbenov, N.; Bohata, K.; Pientka, Z.; Brynda, E. pH dependence and protein selectivity of poly(ethyleneimine)/poly(acrylic acid) multilayers studied by in-situ ATR-FTIR spectroscopy. Biomacromolecules 2006, 7, 1285–1294. [Google Scholar] [CrossRef]
- Müller, M.; Keßler, B.; Ouyang, W. In-situ-ATR-FTIR detection of protein sorption at polyelectrolyte multilayers: Variation of the thickness. Z. Phys. Chem. 2007, 221, 127–138. [Google Scholar]
- Torger, B.; Müller, M. In-situ-ATR-FTIR analysis on the uptake and release of streptomycin from polyelectrolyte complex layers. Spectrochim. Acta A 2013, 104, 546–553. [Google Scholar] [CrossRef] [PubMed]
- Picart, C.; Lavalle, P.; Hubert, P.; Cuisinier, F.J.G.; Decher, G.; Schaaf, P.; Voegel, J.C. Buildup mechanism for poly(l-lysine)/hyaluronic acid films onto a solid surface. Langmuir 2001, 17, 7414–7424. [Google Scholar] [CrossRef]
- Lavalle, P.; Gergely, C.; Cuisinier, F.J.G.; Decher, G.; Schaaf, P.; Voegel, J.C.; Picart, C. Comparison of the structure of polyelectrolyte multilayer films exhibiting a linear and an exponential growth regime: An in situ atomic force microscopy study. Macromolecules 2002, 35, 4458–4465. [Google Scholar] [CrossRef]
- Jourdainne, L.; Lecuyer, S.; Arntz, Y.; Picart, C.; Schaaf, P.; Senger, B.; Voegel, J.C.; Lavalle, P.; Charitat, T. Dynamics of Poly(l-lysine) in Hyaluronic Acid/Poly(l-lysine) Multilayer Films Studied by Fluorescence Recovery after Pattern Photobleaching. Langmuir 2008, 24, 7842–7847. [Google Scholar] [CrossRef] [PubMed]
- Steitz, R.; Jaeger, W.; Klitzing, R.V. Influence of charge density and ionic strength on the multilayer formation of strong polyelectrolytes. Langmuir 2001, 17, 4471–4474. [Google Scholar] [CrossRef]
- Decher, G.; Schmitt, J. Fine-Tuning of the Film Thickness of Ultrathin Multilayer Films Composed of Consecutively Alternating Layers of Anionic and Cationic Polyelectrolytes. In Progress in Colloid and Polymer Science; Springer: Berlin/Heidelberg, Germany, 1992; Volume 89, pp. 160–164. [Google Scholar]
- Arys, X.; Jonas, A.M.; Laguitton, B.; Legras, R.; Wischerhoff, E. Structural studies on thin organic coatings built by repeated adsorption of polyelectrolytes. Prog. Org. Coat. 1998, 34, 108–118. [Google Scholar] [CrossRef]
- Lösche, M.; Schmitt, J.; Decher, G.; Bouwman, W.G.; Kjaer, K. Detailed structure of molecularly thin polyelectrolyte multilayer films on solid substrates as revealed by neutron reflectometry. Macromolecules 1998, 31, 8893–8906. [Google Scholar] [CrossRef]
- Yoo, D.; Shiratori, S.S.; Rubner, M.F. Controlling bilayer composition and surface wettability of sequentially adsorbed multilayers of weak polyelectrolytes. Macromolecules 1998, 31, 4309–4318. [Google Scholar] [CrossRef]
- Shiratori, S.S.; Rubner, M.F. pH-dependent thickness behavior of sequentially adsorbed layers of weak polyelectrolytes. Macromolecules 2000, 33, 4213–4219. [Google Scholar] [CrossRef]
- Ermi, B.D.; Karim, A.; Douglas, J.F. Formation and dissolution of phase-separated structures in ultrathin blend films. J. Polym. Sci. B 1998, 36, 191–200. [Google Scholar] [CrossRef]
- Müller, M. ATR-FTIR Spectroscopy at Polyelectrolyte Multilayer Systems. In Handbook of Polyelectrolytes and Their Applications; Tripathy, S.K., Kumar, J., Nalwa, H.S., Eds.; American Scientific Publishers (ASP): Chicago, IL, USA, 2002; Volume 1, pp. 293–312. [Google Scholar]
- Fringeli, U.P. Encyclopedia of Spectroscopy and Spectrometry; Lindon, J.C., Tranter, G.E., Holmes, J.L., Eds.; Academic Press: New York, NY, USA, 2000; pp. 58–75. [Google Scholar]
- Harrrick, N.J. Internal Reflection Spectroscopy; Harrick Sci. Corp.: Ossining, NY, USA, 1979. [Google Scholar]
- Deacon, G.B.; Phillips, R.J. Relationships between the carbon-oxygen stretching frequencies of carboxylato complexes and the type of carboxylate coordination. Coord. Chem. Rev. 1980, 33, 227–250. [Google Scholar] [CrossRef]
- McCluskey, P.H.; Snyder, R.L.; Condrate, R.A.J. Infrared spectral studies of various metal polyacrylates. Solid State Chem. 1989, 83, 332–339. [Google Scholar] [CrossRef]
- Müller, M.; Paulik, S. In-situ-ATR-FTIR and SFM studies on the influence of adsorption time on deposition and nanostructure of poly(ethyleneimine)/poly(acrylic acid) multilayers. Macromol. Symp. 2008, 265, 77–88. [Google Scholar] [CrossRef]
- Müller, M.; Urban, B.; Schwarz, S. Biorelated polyelectrolyte coatings studied by in-situ attenuated total reflection-Fourier transform infrared spectroscopy: Deposition concepts, wet adhesiveness, and biomedical applications. Langmuir 2018, 34, 8129–8144. [Google Scholar]
Sample Availability: Samples of the compounds PEI and PAA are available from the authors. |


| Wavenumber (cm−1) | Assignment | Component |
|---|---|---|
| 3700–3100 | ν(OH) | H2O |
| 2955 | ν(CH) | PEI |
| 1710 | ν(C=O) | PAA |
| 1643 | δ(OH) | H2O |
| 1552 | νa(COO−) | PAA |
| 1580 | Δ(NH3+) | PEI |
| 1480 1460 | δ(NH3+) δ(CH) | PEI PEI/PAA |
| 1400 | νs(COO−) | PAA |
| 1220 | ν(C–O) | PAA |
© 2019 by the author. Licensee MDPI, Basel, Switzerland. This article is an open access article distributed under the terms and conditions of the Creative Commons Attribution (CC BY) license (http://creativecommons.org/licenses/by/4.0/).
Share and Cite
Müller, M. The Anomalous Influence of Polyelectrolyte Concentration on the Deposition and Nanostructure of Poly(ethyleneimine)/Poly(acrylic acid) Multilayers. Molecules 2019, 24, 2141. https://doi.org/10.3390/molecules24112141
Müller M. The Anomalous Influence of Polyelectrolyte Concentration on the Deposition and Nanostructure of Poly(ethyleneimine)/Poly(acrylic acid) Multilayers. Molecules. 2019; 24(11):2141. https://doi.org/10.3390/molecules24112141
Chicago/Turabian StyleMüller, Martin. 2019. "The Anomalous Influence of Polyelectrolyte Concentration on the Deposition and Nanostructure of Poly(ethyleneimine)/Poly(acrylic acid) Multilayers" Molecules 24, no. 11: 2141. https://doi.org/10.3390/molecules24112141
APA StyleMüller, M. (2019). The Anomalous Influence of Polyelectrolyte Concentration on the Deposition and Nanostructure of Poly(ethyleneimine)/Poly(acrylic acid) Multilayers. Molecules, 24(11), 2141. https://doi.org/10.3390/molecules24112141