Article

Structure, Shift in Redox Potential and Li-Ion Diffusion Behavior in Tavorite LiFe1−xVxPO4F Solid-Solution Cathodes

State Key Laboratory of Advanced Technology for Materials Synthesis and Processing, Wuhan University of Technology, Wuhan 430070, China
*
Author to whom correspondence should be addressed.
Molecules 2019, 24(10), 1893; https://doi.org/10.3390/molecules24101893
Submission received: 17 April 2019 / Revised: 7 May 2019 / Accepted: 13 May 2019 / Published: 16 May 2019
(This article belongs to the Special Issue Advances in Electrochemical Energy Storage Devices)

Abstract

:
Solid-solution Li-ion cathode materials transform through a single-phase reaction thus leading to a long-term structural stability and improved cyclability. In this work, a two- to single-phase Li+-extraction/insertion mechanism is studied through tuning the stoichiometry of transition-metal Fe/V cations to trigger a transition in the chemical reactivity path. Tavorite triclinic-structured LiFe1−xVxPO4F (x = 0, 0.1, 0.3, 0.5, 0.7, 0.9, 1) solid-solution powders were prepared by a facile one-step solid-state method from hydrothermal-synthesized and commercial raw materials. The broad shape of cyclic voltammetry (CV) peaks, sloping charge/discharge profiles and sloping open-circuit voltage (OCV) profiles were observed in LiFe1−xVxPO4F solid-solution cathodes while 0 < x < 1. These confirm strongly a single-phase behavior which is different from the two-phase behavior in the end-members (x = 0 or 1). The electronegativity of M (M = Fe1−xVx) for the redox potential of Fe2+/3+ couple or the M–O4F2 bond length for the V3+/4+ couple plays respectively a dominant role in LiFe1−xVxPO4F solid-solution cathodes.

1. Introduction

Tavorite-structured (P 1 ¯ , triclinic) lithium transition-metal fluorophosphates LiMPO4F (M = Fe, V) with 3D Li+-diffusion channels have been proposed as alternative cathode candidates for Li-ion batteries after the olivine-structured LiFePO4 (with 1D channels) was invented. The ionic conductivity of LiFePO4F (0.6 × 10⁻⁷ S cm−1 [1]) is about two orders of magnitude higher than that of LiFePO4 (~1 × 10⁻⁹ S cm−1 [2]). But the potential of Fe2+/3+ redox couple in the former is lower than the latter (~2.8 [3,4] vs. ~3.5 V [5]). This can be tuned through the inductive effect introduced by the V3+/4+ couple (~4.28 V [6,7]) to form LiFe1−xVxPO4F (0 ≤ x ≤ 1) solid solutions. Here we noticed that the specific capacity of LiVPO4F is almost the same as that of LiFePO4F (151.6 vs. 155.9 mAh g−1), and the specific energy of LiVPO4F [8,9,10,11,12,13,14,15,16,17,18,19,20] is larger than that of LiFePO4F [4,21,22,23] (667 vs. 424 Wh kg−1).
Solid-solution Li-ion cathode materials transform through a single-phase reaction, leading to a long-term structural stability and improved cyclability, while their end-members transform through a two-phase reaction [24,25,26]. LiFePO4F, LiVPO4F and LiVPO4O have homotypic structures. We have reported recently the LiFePO4F–LiVPO4O solid solutions (i.e., LiFe1−xVxPO4F1−δOδ (0 ≤ x ≤ 1; 0 ≤ δ ≤ 0.36)) [26]. Otherwise, there are some publications related to LiVPO4F–LiVPO4O [27,28,29,30,31] and a few to LiFePO4F–LiVPO4F [25,32] solid solutions. Not much information can be collected from the meeting abstract [32]. Huang et al. [25] synthesized LiFe0.5V0.5PO4F solid-solution which showed a single-phase behavior over the lithium composition range of Li1−yFe0.5V0.5PO4F (0 < y < 0.5) with two alternating electrochemical active regions centered at ~2.76 and ~4.3 V.
In this work, LiFe1−xVxPO4F (x = 0, 0.1, 0.3, 0.5, 0.7, 0.9, 1) powders, cathodes and the corresponding Li-ion batteries were prepared and characterized. The object is to study the two- to single-phase Li+-extraction/insertion mechanism through tuning the transition-metal stoichiometry of cations to trigger a transition in the chemical reactivity path.

2. Results

2.1. Phase Structure

Figure 1 shows XRD full patterns of LiFe1−xVxPO4F (0 ≤ x ≤ 1) powders. Tables S1–S7 list Rietveld refined parameters of the corresponding tavorite structures. Table S8 shows comparison of lattice parameters for LiFe1−xVxPO4F (0 ≤ x ≤ 1) samples and the related publications. Figure S1 shows the final observed, calculated and difference profiles of the tavorite-structured LiFePO4F, LiFe0.9V0.1PO4F, LiFe0.7V0.3PO4F, LiFe0.5V0.5PO4F, LiFe0.3V0.7PO4F, LiFe0.1V0.9PO4F and LiVPO4F via Rietveld refinements. Figure S2 shows variations of lattice parameters and unit cell volumes of LiFe1−xVxPO4F (0 ≤ x ≤ 1) solid solutions. Further details of crystal structures may be obtained from the website listed in Appendix A. Under harsh testing conditions, pure LiVPO4F and LiFe0.3V0.7PO4F phases have been attained. There are a few LiFePO4 impurities (~1.7, ~2.4, ~4.1 and 6.3% wt, respectively) when x = 0, 0.1, 0.3 and 0.5, and VPO4 impurity (~7.5% wt) when x = 0.9 in LiFe1−xVxPO4F (0 ≤ x ≤ 1) samples, which will be further discussed in electrochemical measurements (Section 2.4).
Considering the crystal structures are triclinic, the continuous substitutions lead to a versatile change of interplanar crystal spacing. Refinements reveal that solid-solution domains exist without phase separation [25,32]. Lattice parameters (a, b, c, α, β, γ) and unit cell volumes (V) of end-members (x = 0 and 1) agree well with our previous results [4,26,33]. There is only one crystallographic Li site (2i) [7,11] and two independent Fe/V sites (1a and 1c) in the unit cell. The M–O4F2 chains (M = Fe1−xVx) along the b axis constitute an alternation of M1 and M2 centered octahedra which are slightly distorted. The F ligands (2i) act as the bridging ligands. Each oxygen (2i) from the equatorial plane of the octahedron is common to a PO4 tetrahedron bridging the M–O4F2 chains, leading to the formation of a 3D framework. The systematic variations in lattice parameters and unit cell volumes of LiFe1−xVxPO4F (0 < x < 1) samples confirm the formation of homogeneous solid solutions, which originate from substitutions by the V3+ ( r V 3 + = 0.640 Å) for Fe3+ ( r Fe 3 + , HS = 0.645 Å in a high spin (HS) state) with close effective ionic radii while the coordination number (CN) is 6 [3,34,35]. The published unit cell volumes V3) of the related phases are collected as follows: LiFePO4F (173.91(2) [22], 173.67(6) [23], 173.558(6) [4]), LiVPO4F (174.36(2) [11], 174.31 [36], 174.25(1) [30], 174.167(16) [33]) and LiVPO4O (171.018(1) [11], 171.227(2) [37], 171.578(3) [38]). Therefore, the volume deviation (ΔV) between LiFePO4F and LiVPO4F is under 0.47%, much less than that between LiFePO4F and LiVPO4O (under 1.7%). For example, the V value (173.25(1) Å3) of LiFe0.5V0.5PO4F (the only LiFePO4F–LiVPO4F solid-solution reported) is not located between end-members thus against the Vegard’s law [25]. It may be caused by experiment errors because of the small volume deviation. However, the V values of LiFePO4F–LiVPO4O solid solutions are located between end-members [26]. In this work, the V values of the prepared LiFePO4F–LiVPO4F samples are located in a narrow region (0.33–0.85%; Figure S2) due to the close effective ionic radii of Fe3+ (0.645 Å) and V3+ (0.640 Å), indicating the formation of solid solutions.

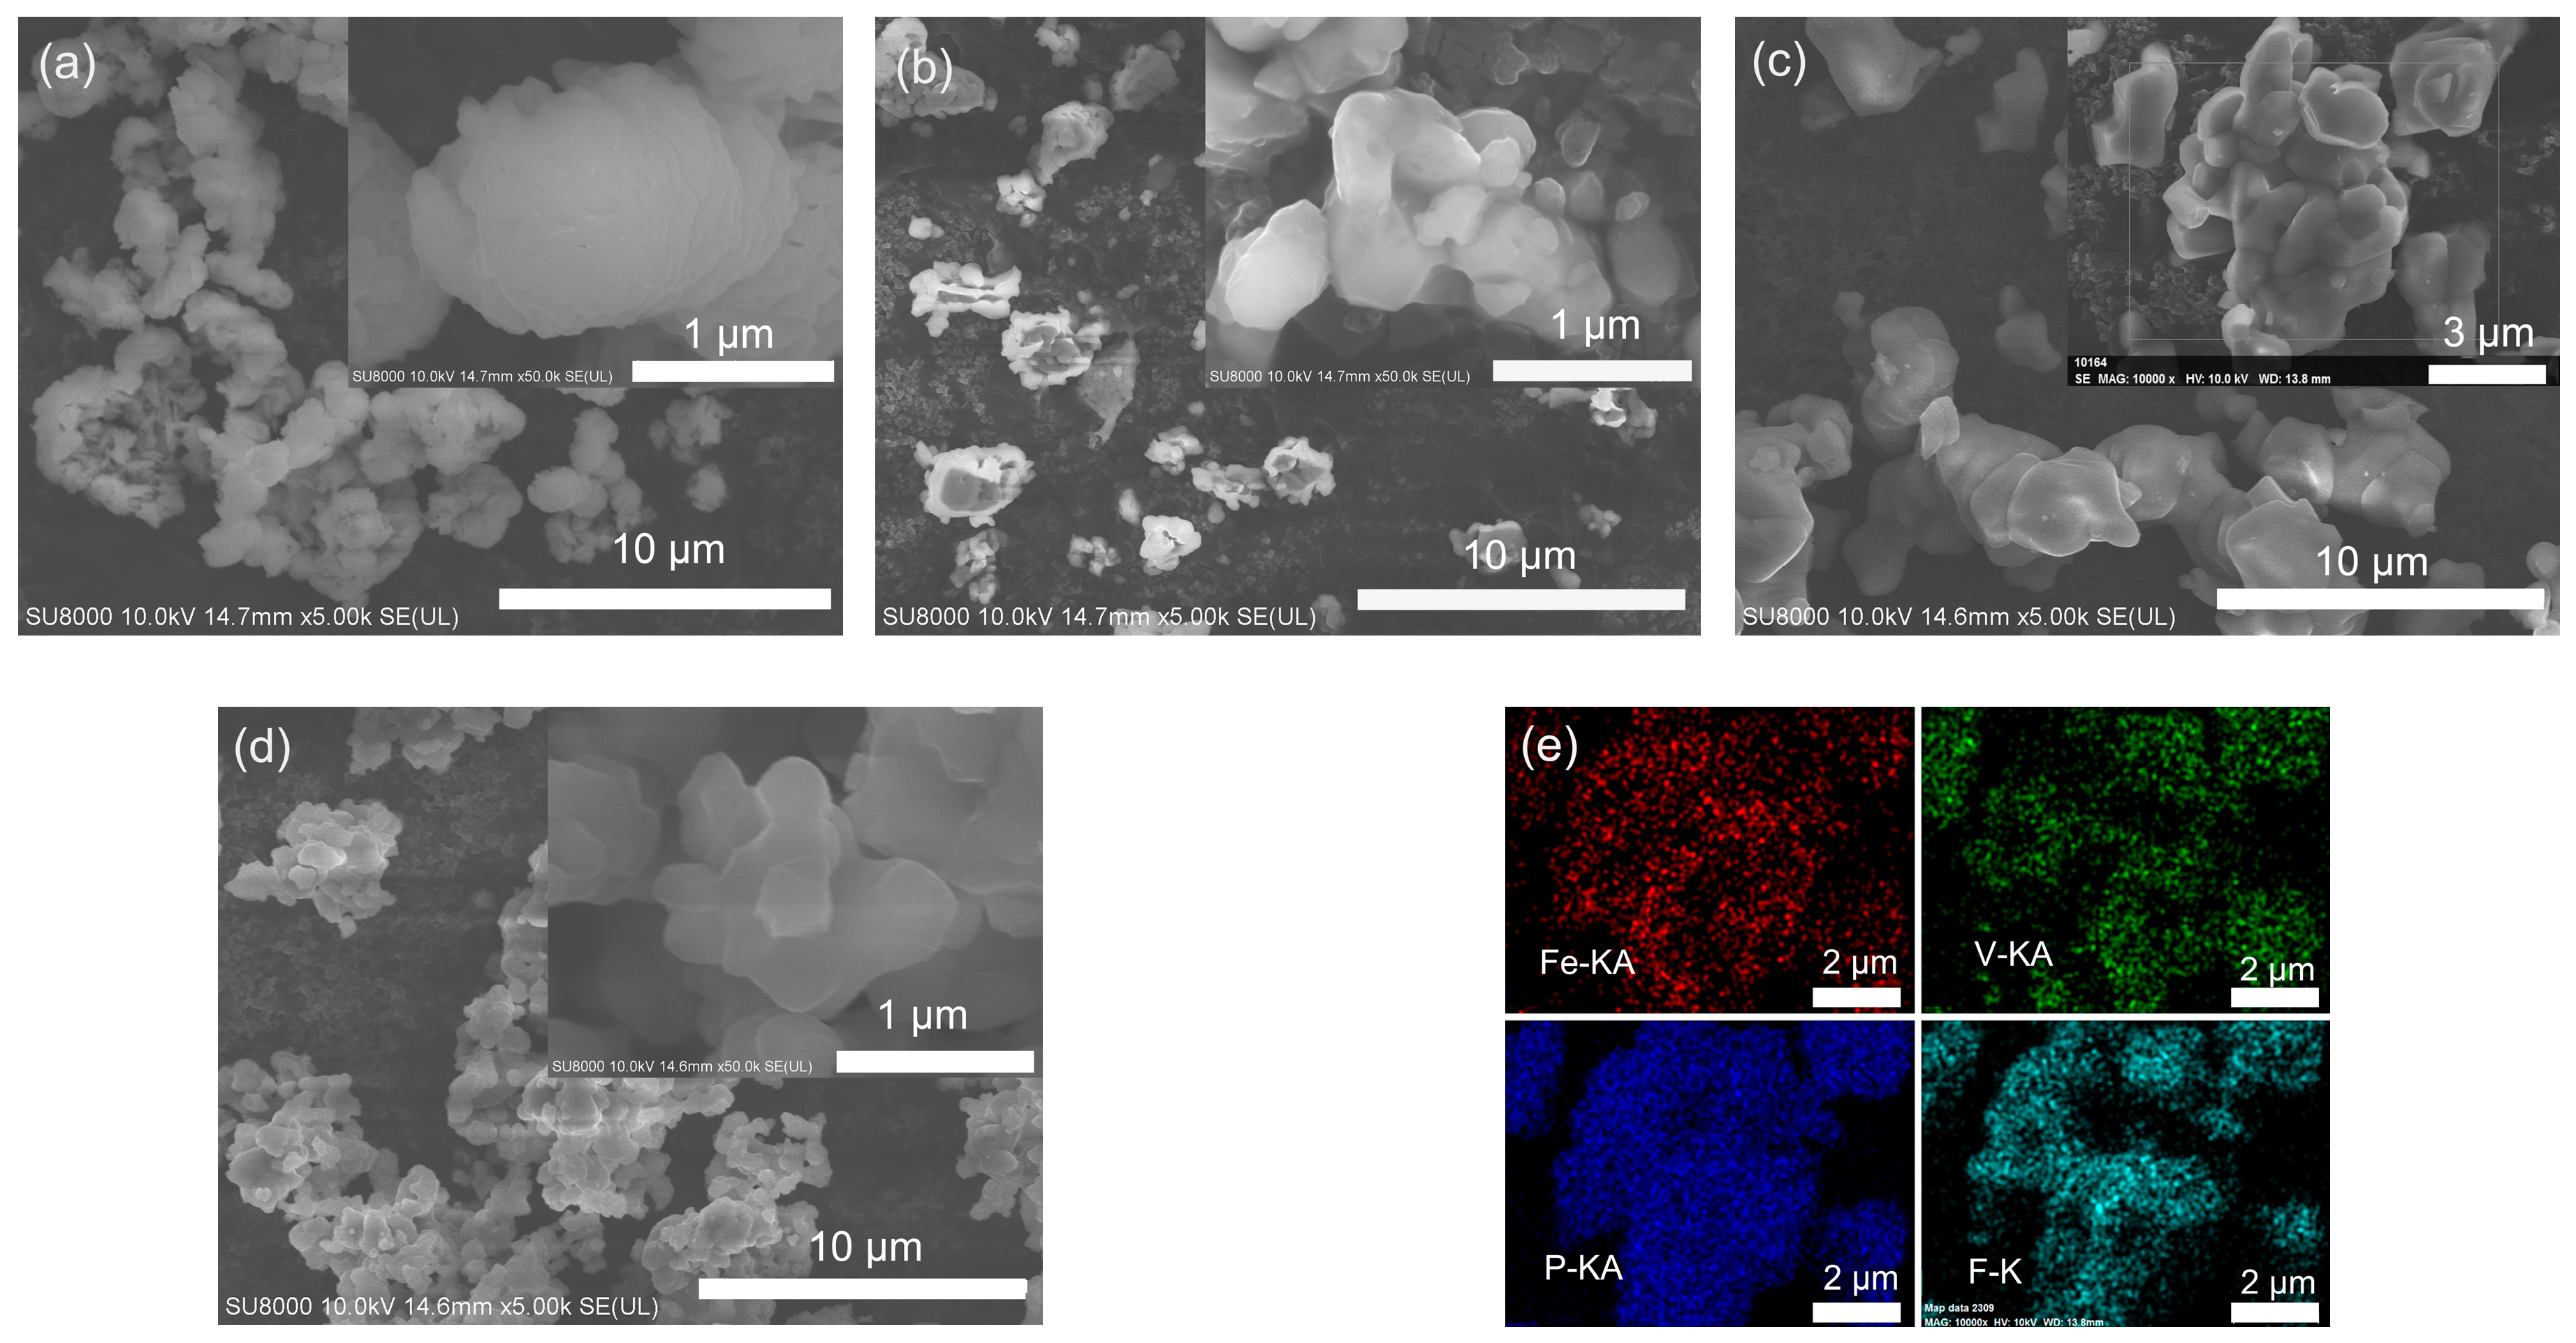
2.2. Powder Microstructure

Figure 2 shows SEM images of FePO4, VPO4, LiFe0.5V0.5PO4F and LiVPO4F, and the energy dispersive spectra (EDS) mapping of LiFe0.5V0.5PO4F.
The particle size is 1–2 μm for FePO4 (Figure 2a), 0.5–1 μm for VPO4 (Figure 2b), 1–2 μm for LiFe0.5V0.5PO4F (Figure 2c) and 0.5–1.5 μm for LiVPO4F (Figure 2d). The EDS test confirms a nearly-nominal proportion (Fe:V:P = 0.46:0.57:1, %mol) and a homogeneous distribution of Fe, V, P and F components in the LiFe0.5V0.5PO4F solid solutions (Figure 2e), indicating that substitutions are successful.

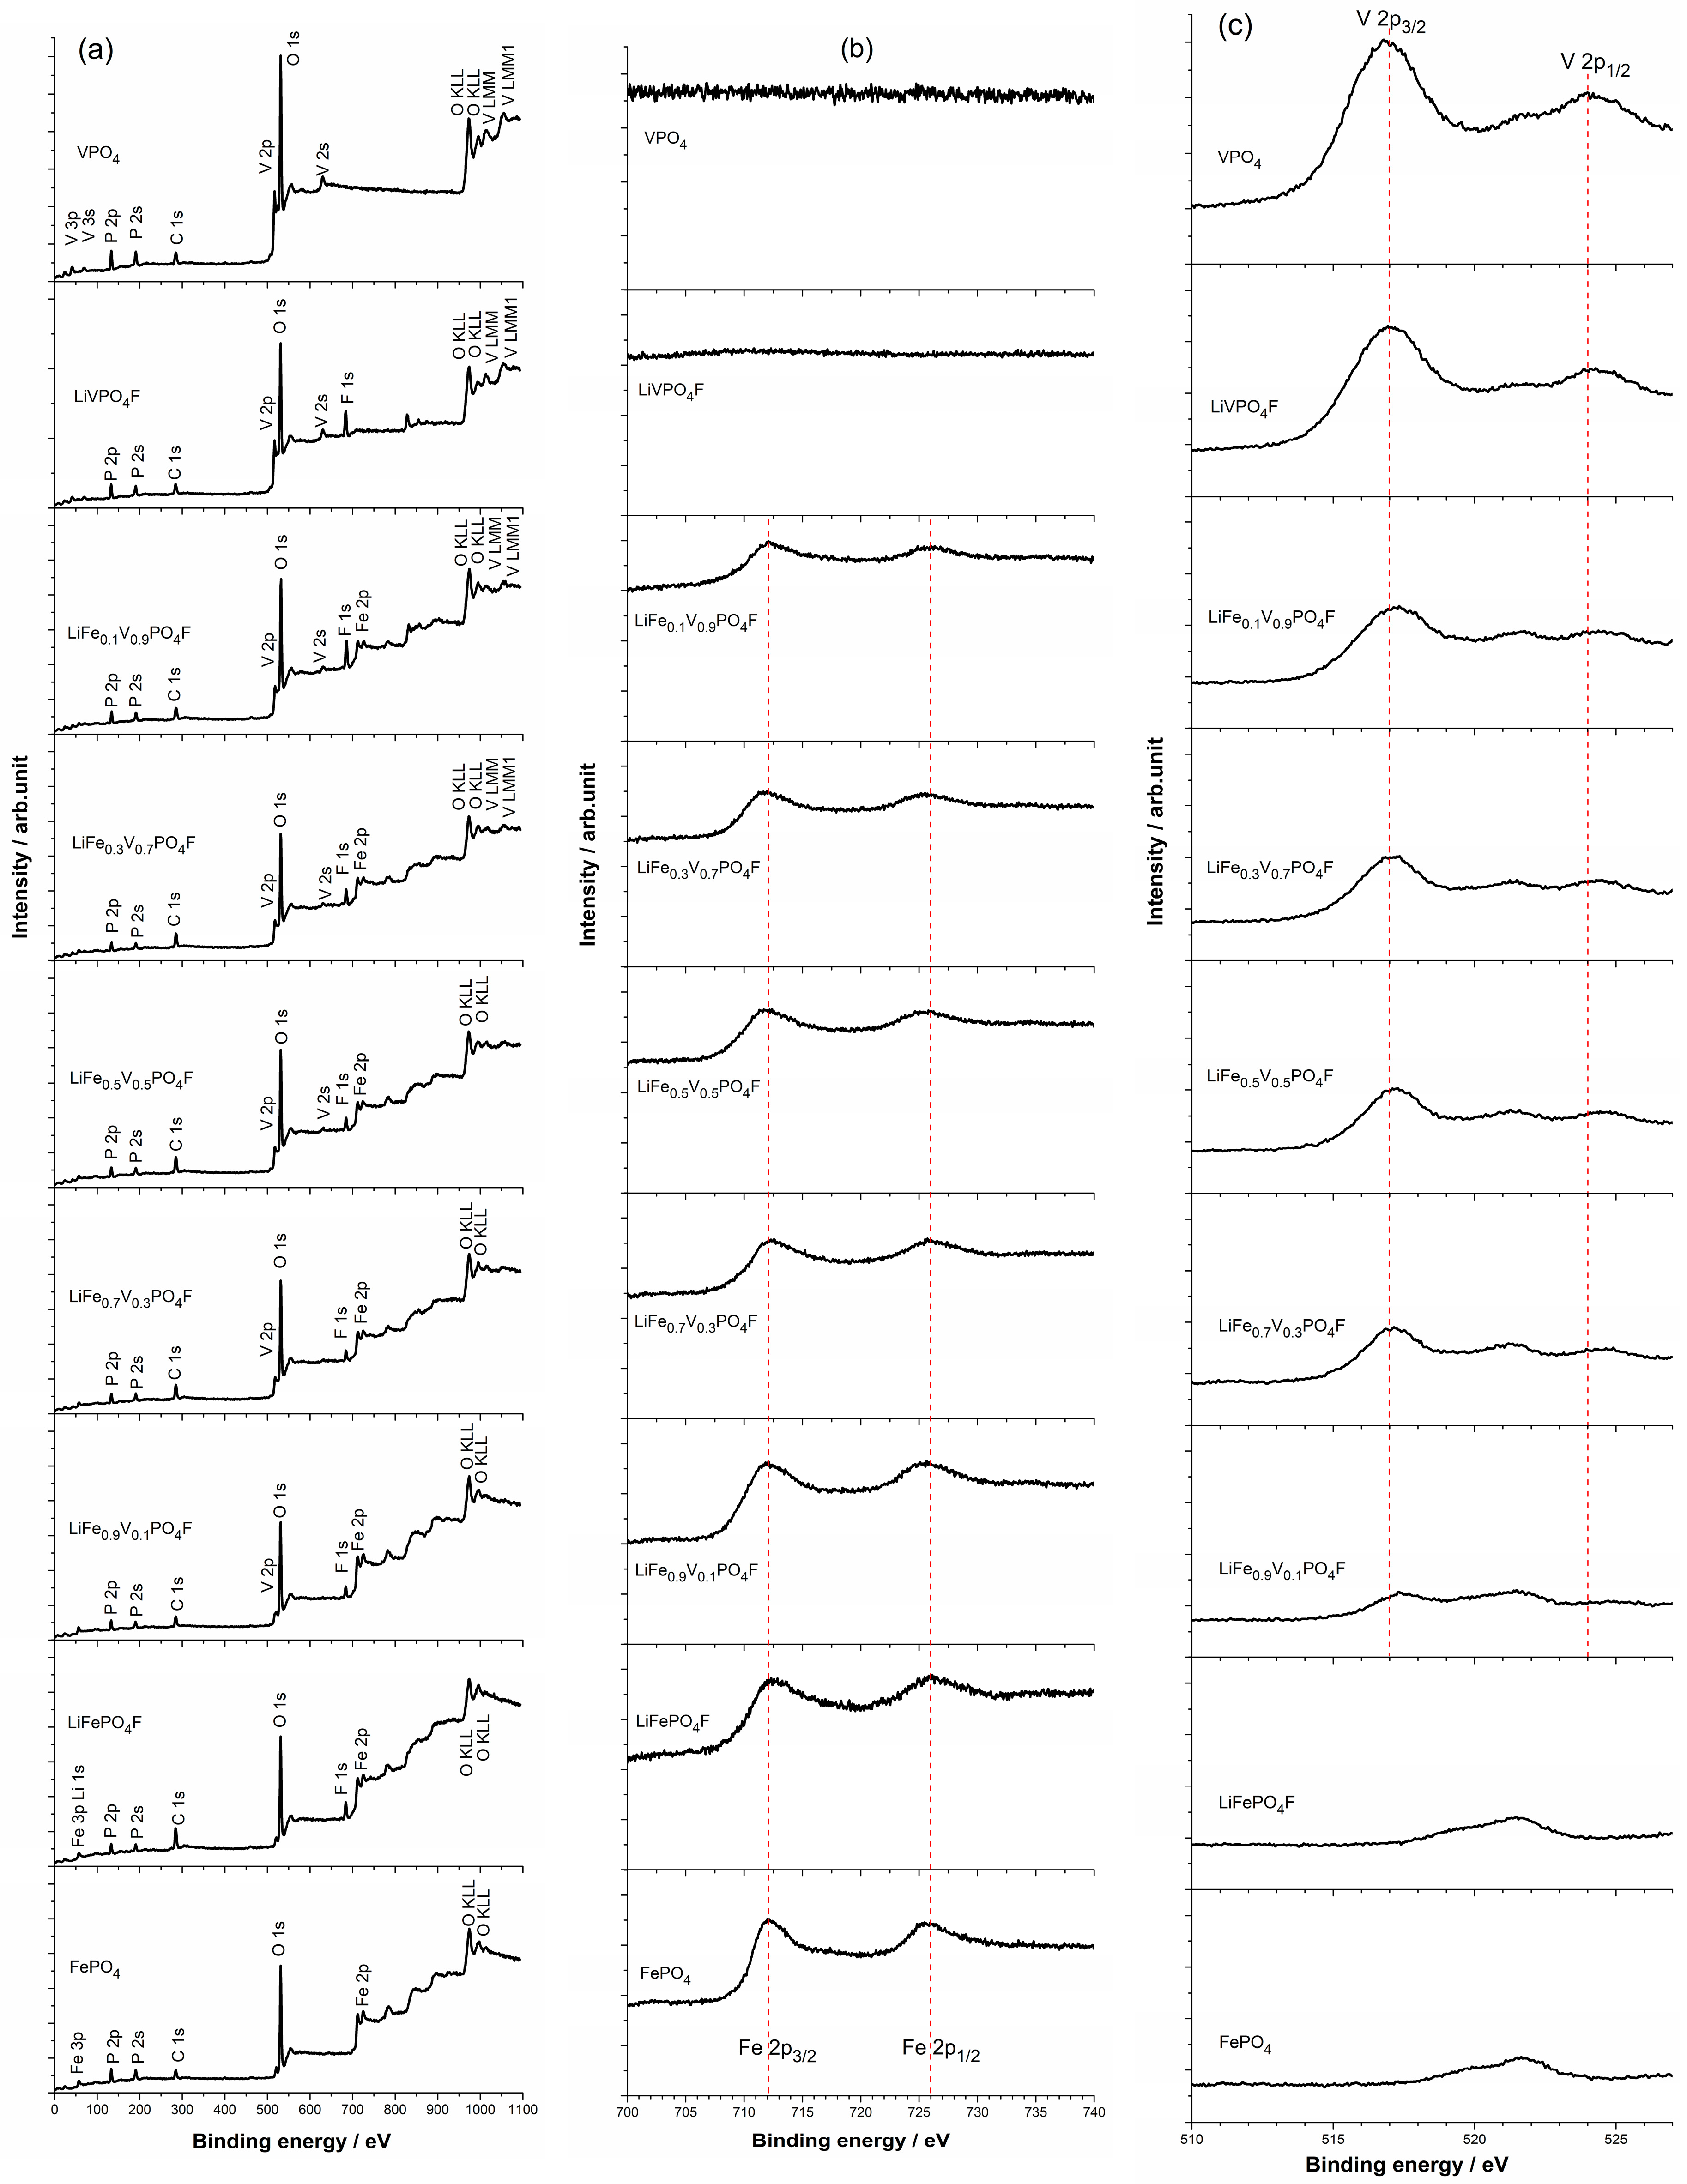
2.3. Valence States of Fe/V Components

The core level X-ray photoelectron spectra (XPS) of FePO4, VPO4 and LiFe1−xVxPO4F (0 ≤ x ≤ 1) powders are shown in Figure 3a. The Fe 2p (or V 2p) spectrum consists of two components (Fe 2p3/2/Fe 2p1/2 or V 2p3/2/V 2p1/2) due to spin-orbit (jj) coupling/splitting (Figure 3b,c) [39,40].
In Figure 3b, main peaks of Fe 2p3/2 and Fe 2p1/2 centered respectively at ~712/726 eV are assigned to the high-spin Fe3+ species with the (3d↑)5(3d↓)0 electronic configuration [41], similar to the reported FePO4 (712.5/726 eV [39,42]). The Fe 2p3/2 peak is narrower and stronger than Fe 2p1/2, and the area of Fe 2p3/2 is greater than that of Fe 2p1/2 because 2p3/2 has the degeneracy of four multiplets while 2p1/2 has only two in jj coupling [40,41]. By contrast, for a high-spin Fe2+ species like LiFePO4 with (3d↑)5(3d↓)1 configuration, main peaks of Fe 2p3/2 and Fe 2p1/2 are centered at 710.5/724 eV, respectively [39,42].
In Figure 3c, main peaks of V 2p3/2 and V 2p1/2 centered respectively at ~517/524 eV are assigned to the V3+ species with the (3d↑)2(3d↓)0 electronic configuration [43], similar to the reported VPO4 (517.3/524.8 eV [44]) and LiVPO4F (517.3/524.7 eV [44]; 517.2/523.0 eV [45]; 517.1/523.4 eV [46]; 517.38/524.81 eV [31]). By contrast, for a V4+ species like LiVPO4O with (3d↑)1(3d↓)0 configuration, main peaks of V 2p3/2 and V 2p1/2 are centered at 518.09/525.38 eV, respectively [31]. It can be concluded then that valence states of Fe and V are +3 in FePO4, VPO4 and LiFe1−xVxPO4F (0 ≤ x ≤ 1) samples.

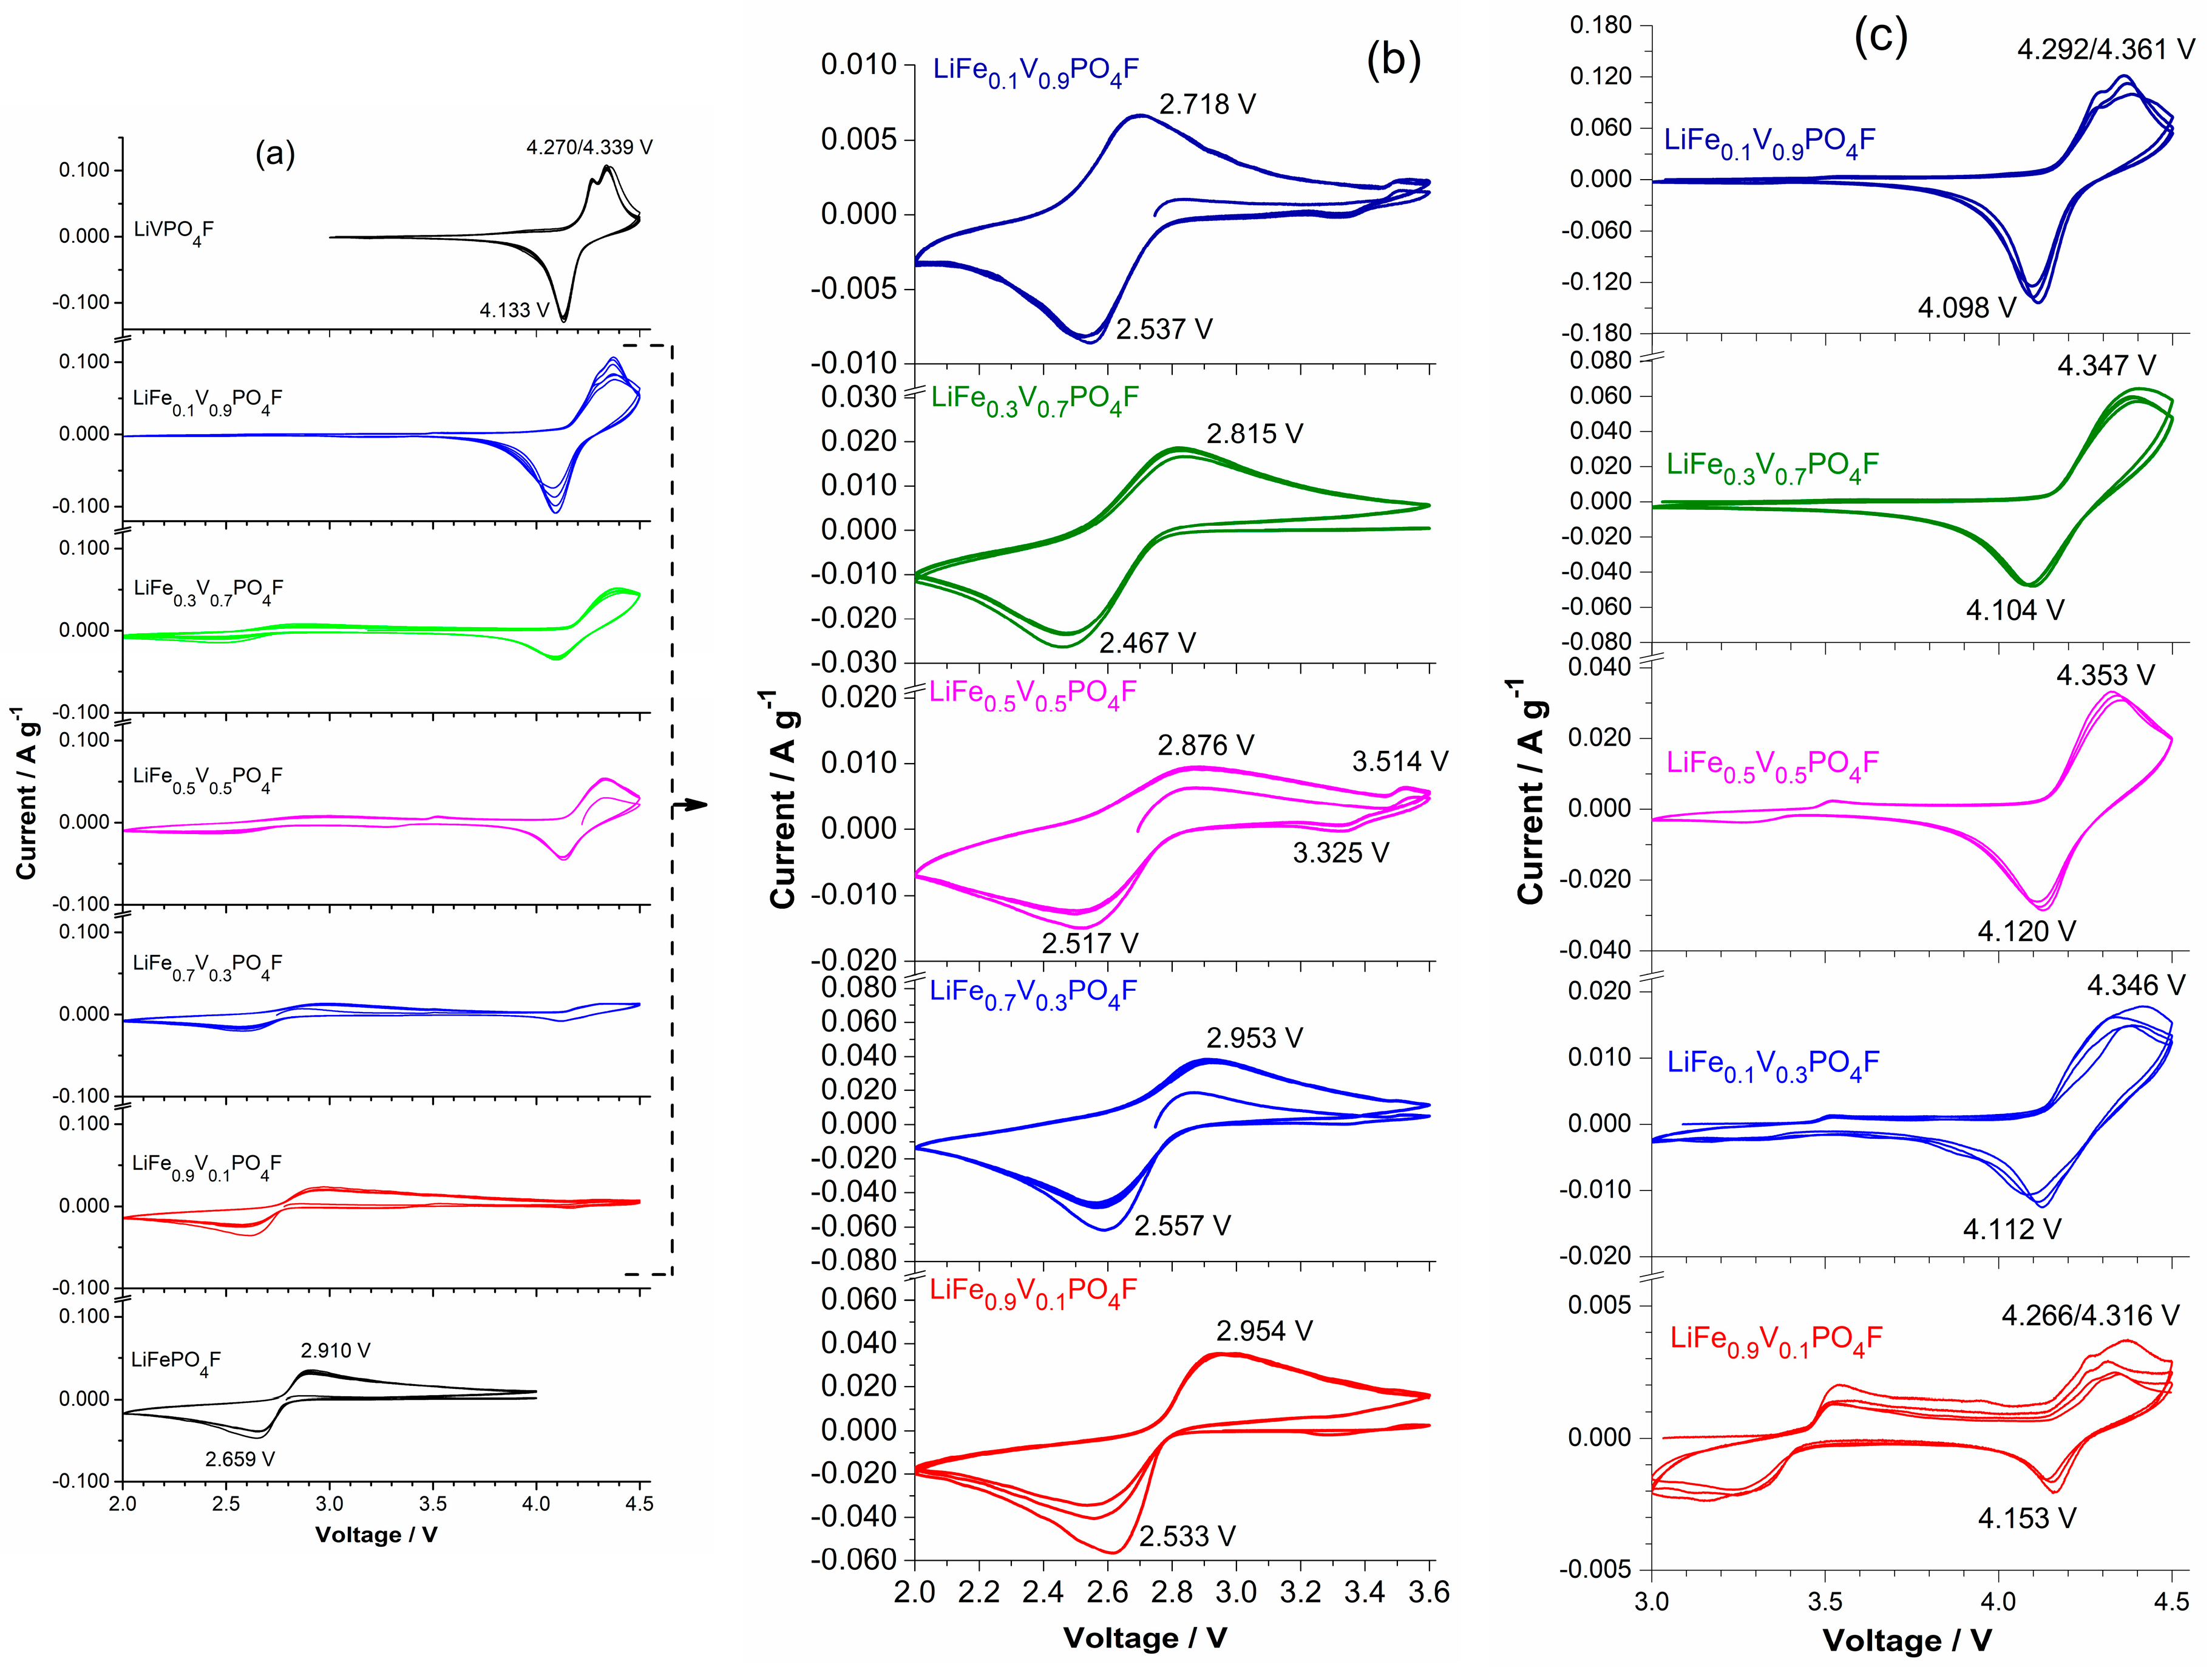
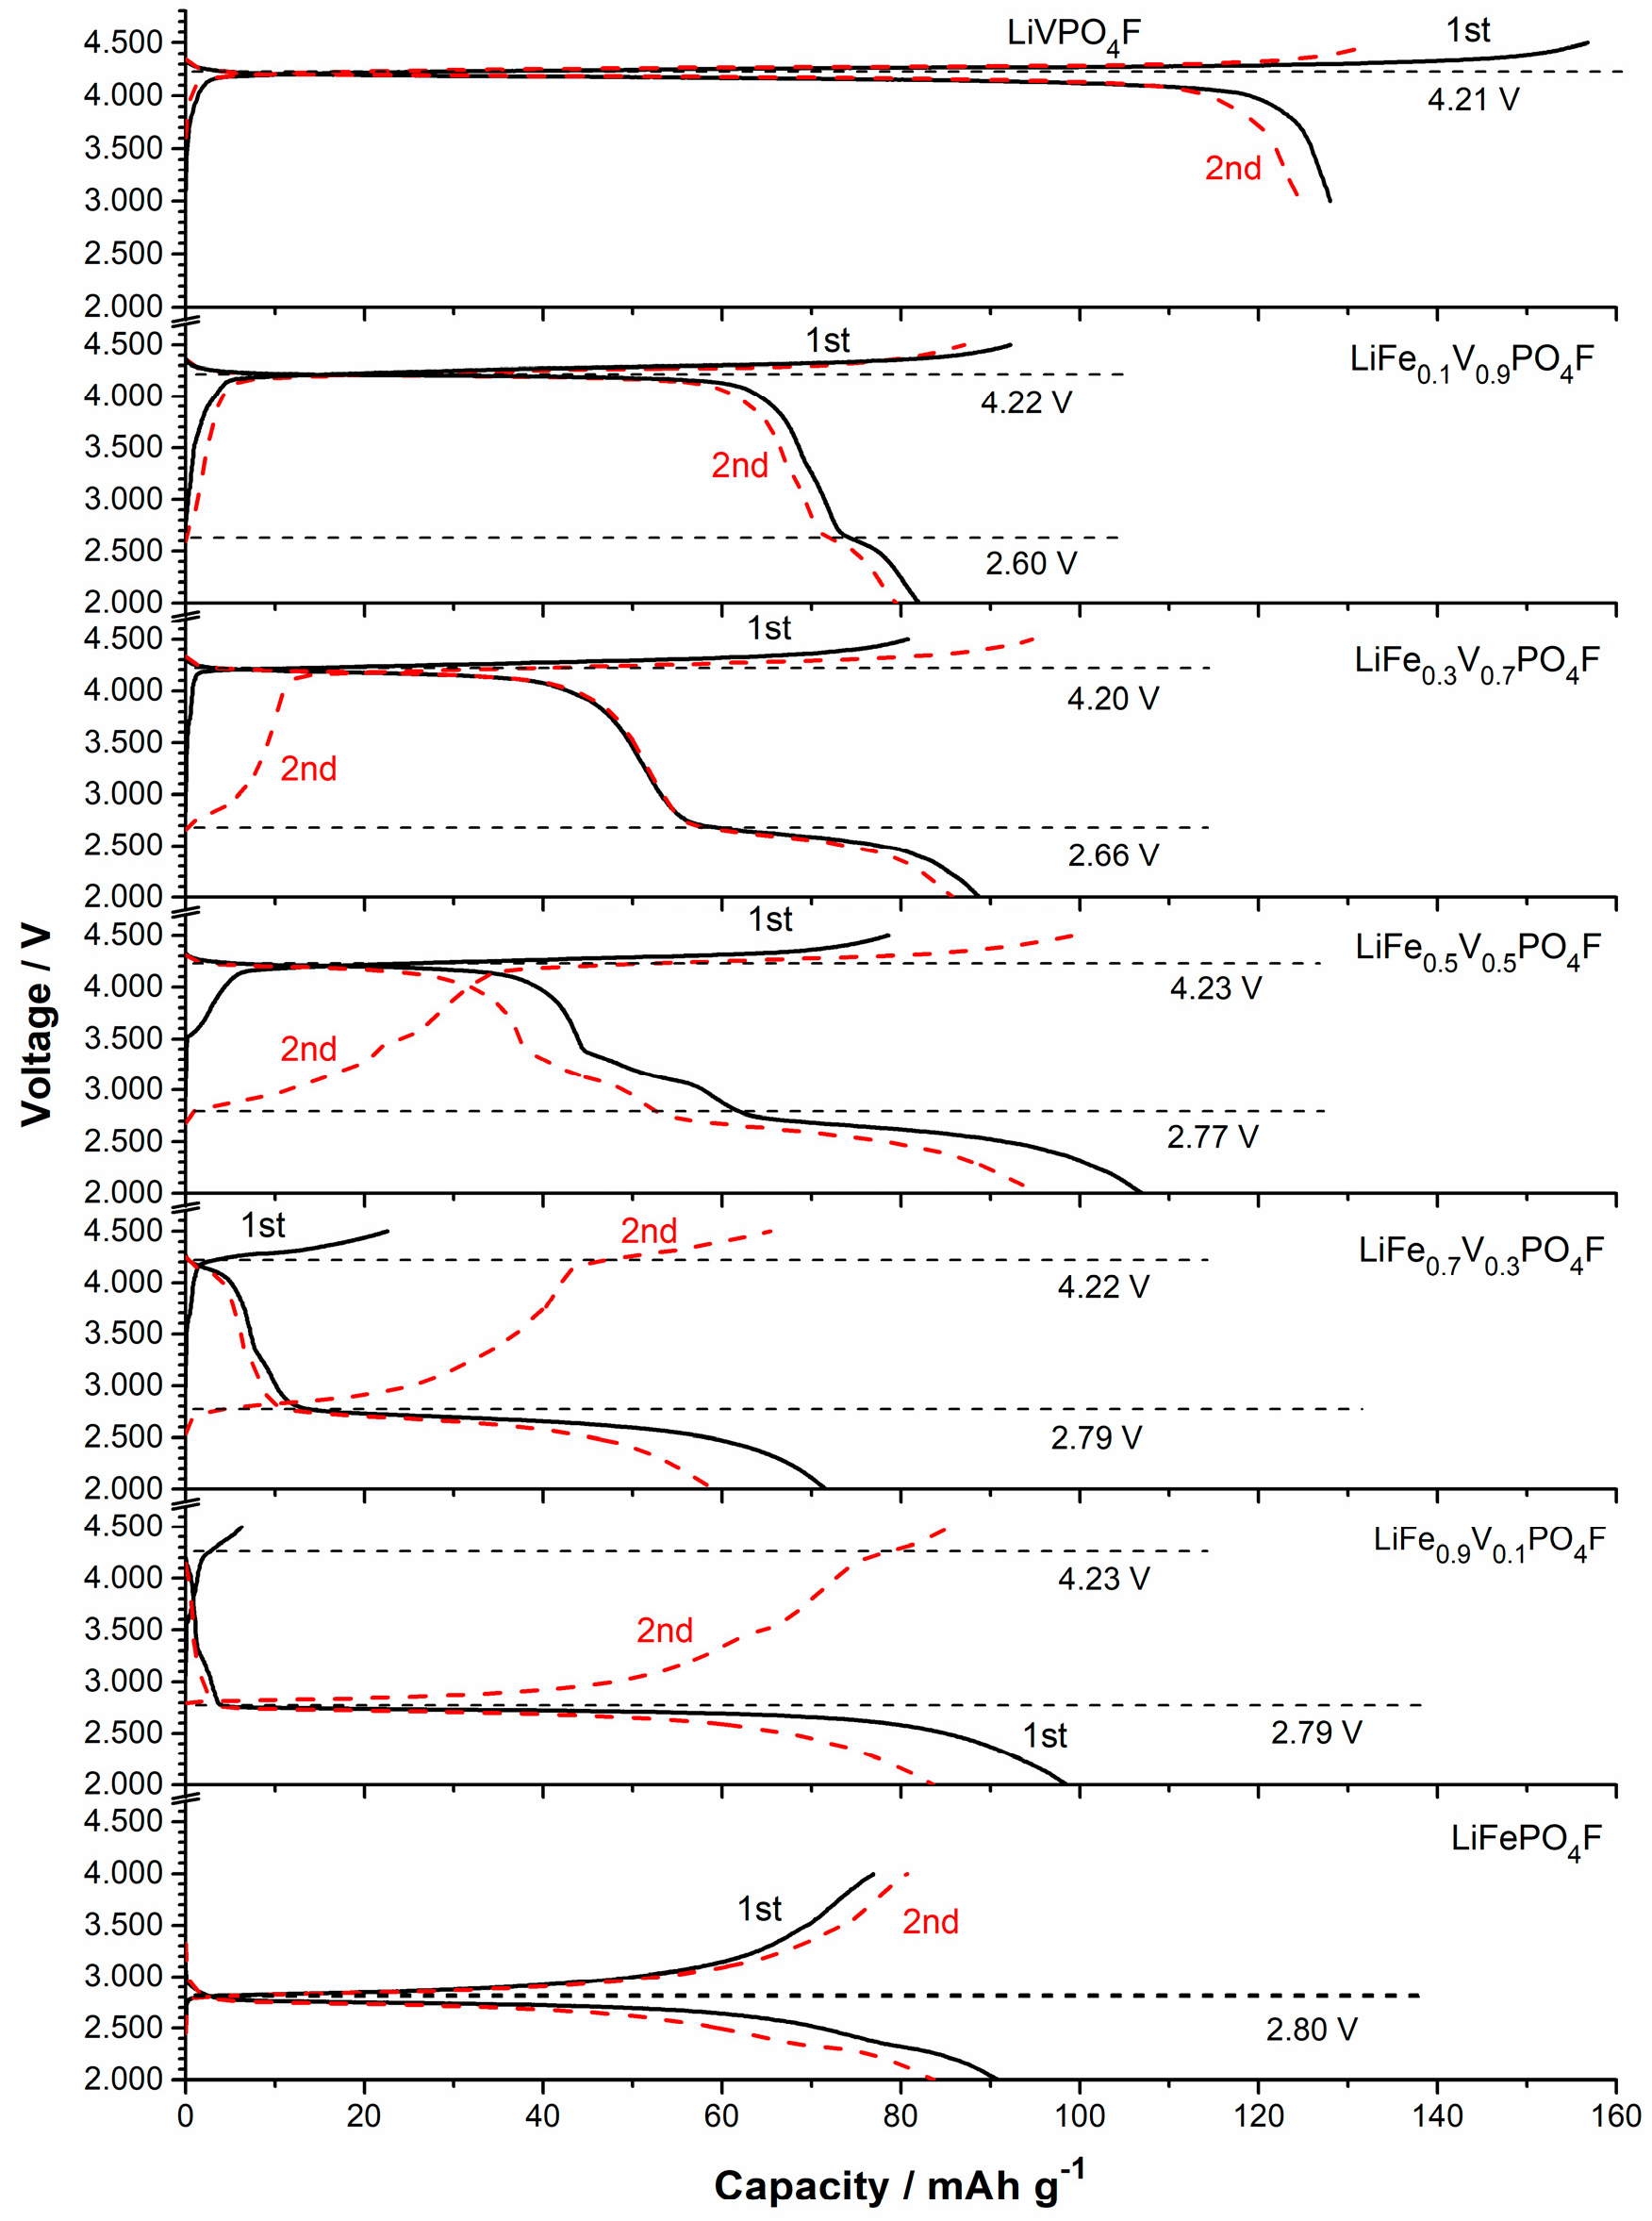
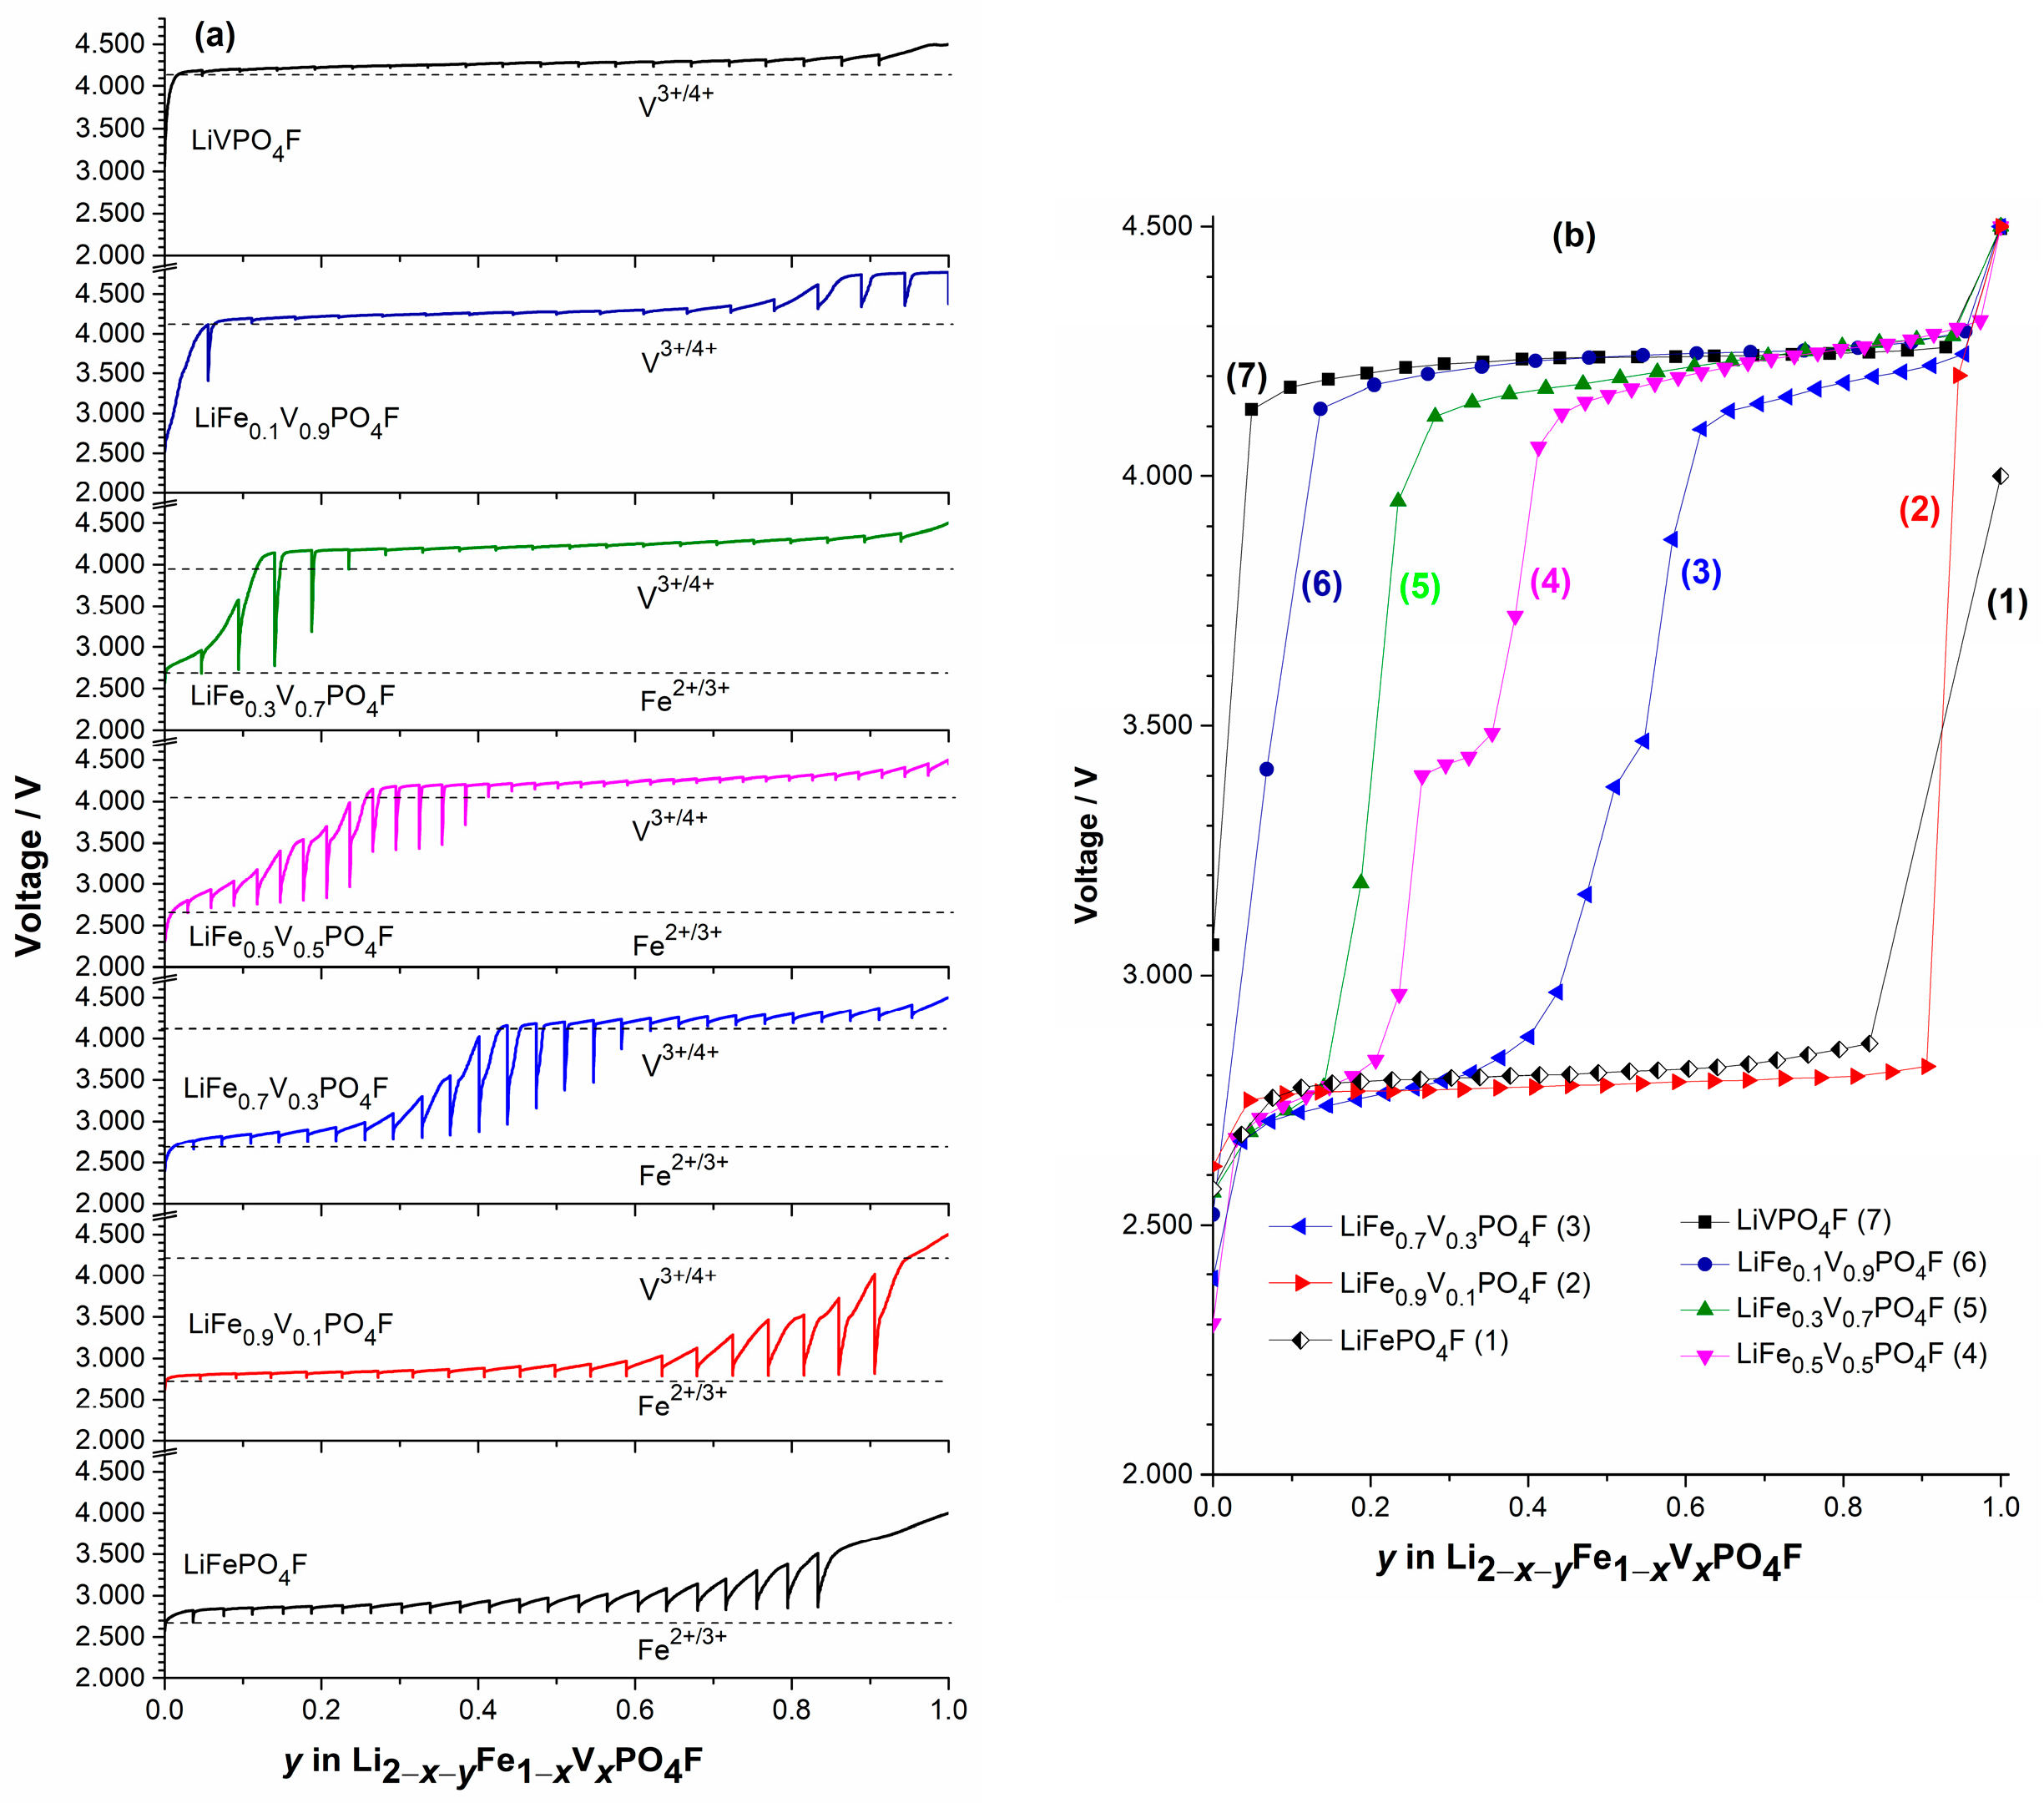
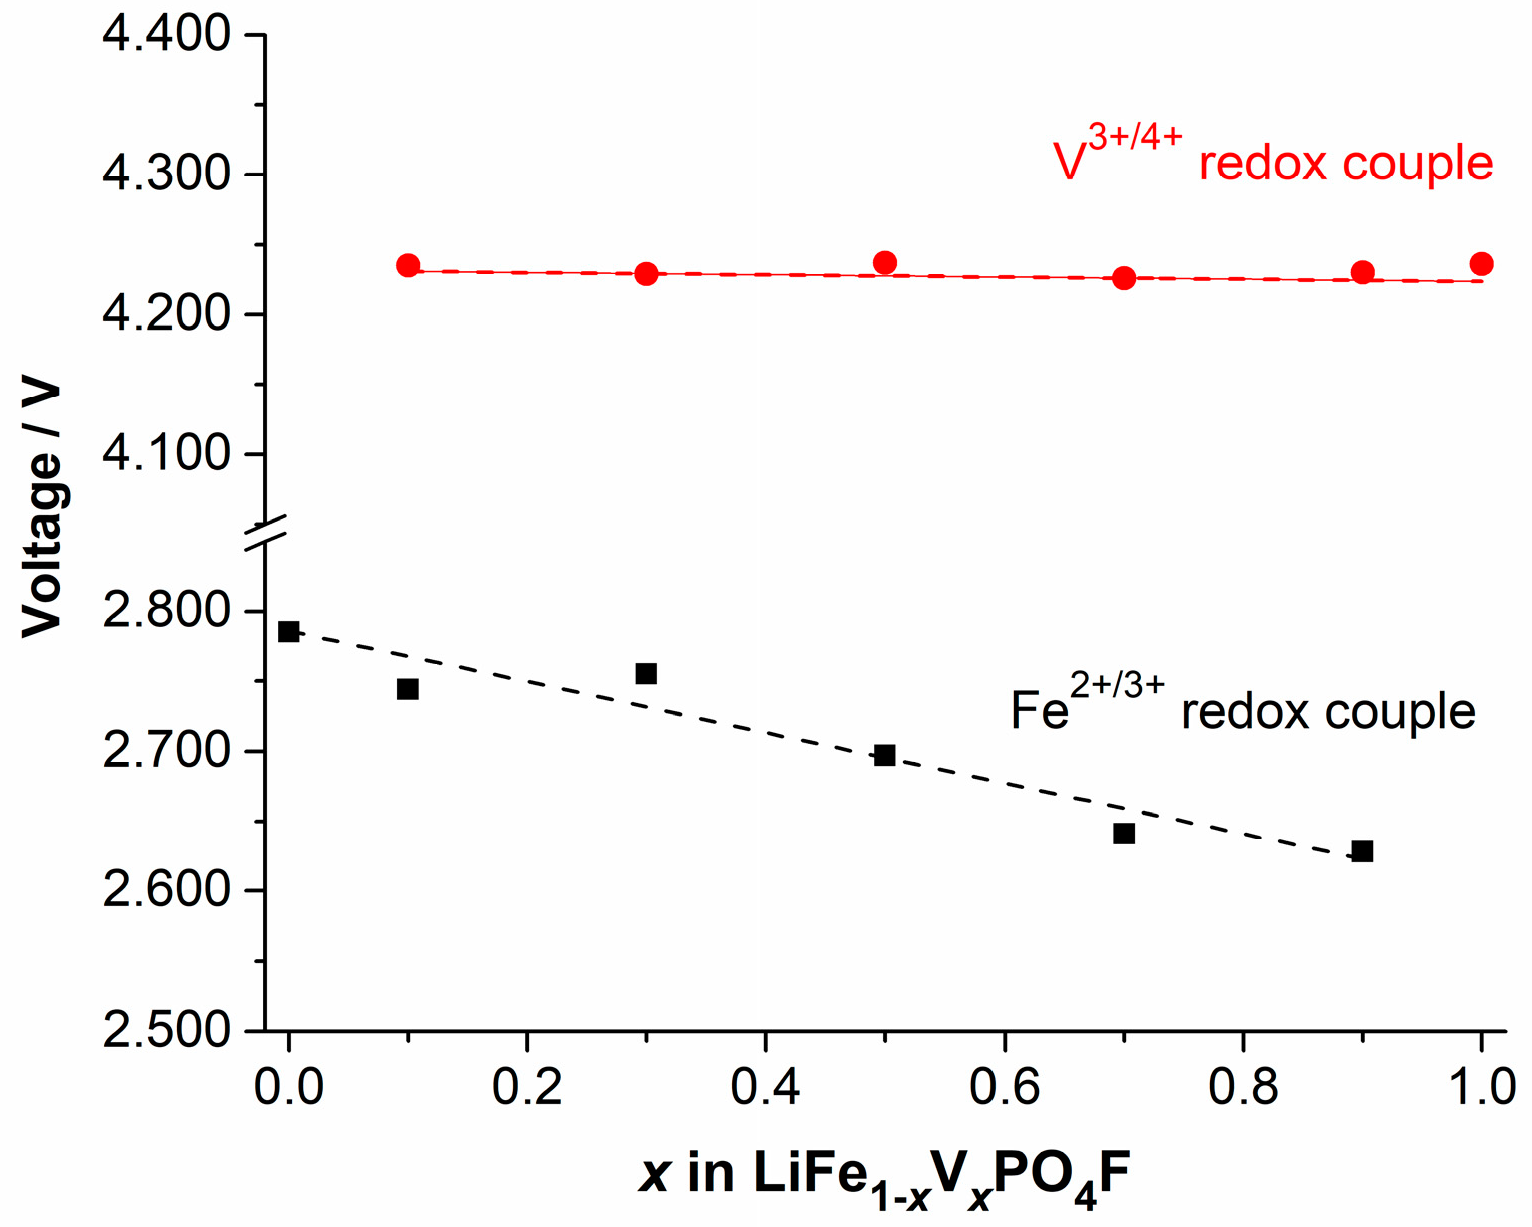
2.4. Shift in Redox Potential

Figure 4 shows cyclic voltammetry (CV) curves of LiFe1−xVxPO4F (x = 0, 0.1, 0.3, 0.5, 0.7, 0.9, 1) cells with the same sweep rate of 0.1 mV s−1 for five cycles. Figure 5 shows CV curves of LiFe0.5V0.5PO4F and LiFe0.3V0.7PO4F cells with different sweep rates of 0.1/0.2/0.3/0.4/0.5 mV s−1 for 15 cycles. Figure 6 shows total reactions in LiFe1−xVxPO4F (0 ≤ x ≤ 1) cells. The CV data of LiFePO4F are consistent with our previous results [4,26] and that of others [1], in which a pair (cathodic/anodic) of redox peaks exist at 2.659/2.910 V assigned to the Fe2+/3+ couple for Li 2 Fe II PO 4 F / LiFe III PO 4 F . The CV data of LiVPO4F are in good agreement with results of the reported differential capacity vs. voltage curves [6,47,48] and CV tests [44,49]. Split anodic peaks at 4.270/4.339 V ascribes to the occurrence of an intermediate phase ( Li 0.67 VPO 4 F , i.e., Li 0.67 V 0.67 III V 0.33 IV PO 4 F ) during oxidation (Li+-extraction), reflecting two energetically inequivalent reactions ( LiV III PO 4 F charge   @   4.270   V Li 0.67 V 0.67 III V 0.33 IV PO 4 F charge   @   4.339   V V IV PO 4 F ). The corresponding structure evolution is: triclinic P 1 ¯ → triclinic P 1 ¯ → monoclinic C2/c [7,11]. A single cathodic peak at 4.133 V characterizes a two-phase Li+-insertion process ( V IV PO 4 F   discharge   @   4.133   V LiV III PO 4 F ). The corresponding structure evolution is: monoclinic C2/c → triclinic P 1 ¯ [6,44,47,48,49].
For LiFe1−xVxPO4F samples (0 < x < 1), there still exists a pair of redox peaks assigned to the Fe2+/3+ couple in which systematic shifts of cathodic/anodic peaks were observed. This will be discussed in detail later. There also exists two anodic peaks (or overlapping peaks while x = 0.3, 0.5 and 0.7) at 4.266–4.361 V similar to LiVPO4F, indicating the occurrence of intermediate phases ( Li 1 0.33 x Fe 1 x III V 0.67 x III V 0.33 x IV PO 4 F , triclinic, P 1 ¯ ) [7,11]. There is a single cathodic peak at 4.126 ± 0.027 V which characterizes a two-phase Li+-insertion process ( Li 1 x Fe 1 x III V x IV PO 4 F discharge   @   4.126   ±   0.027   V LiFe 1 x III V x III PO 4 F ). The corresponding structure evolution is: monoclinic C2/c → triclinic P 1 ¯ . Important to note is the shape of CV peaks. The broad shape of CV peaks for LiFe1−xVxPO4F solid-solution samples while 0 < x < 1, instead of the sharp and narrow peaks as observed in end-members (x = 0 or 1), is indicative of a single-phase solid-solution behavior [7,25]. Otherwise, the pair of redox peaks at ~3.35/3.55 V when x = 0.1, 0.3 and 0.5 are assigned to the Fe2+/3+ couple for LiFePO4 impurity (Figure 4b,c), consistent with the XRD results (Figure 1). Note that the current (A g−1) for Fe2+/3+ couple in LiFePO4 impurity is one order of magnitude smaller than that for Fe2+/3+ couple in LiFe0.9V0.1PO4F sample, indicating that the impurity content is very small while the V-doping amount is low (Figure 4c). The above electrochemical reactions can be summarized as the following:
LiFeV 1 x III V x III PO 4 F   charge   @   ~ 4.3   V Li 1 0.33 x Fe 1 x III V 0.67 x III V 0.33 x IV PO 4 F + 0.33 x Li + + 0.33 x e ,
Li 1 0.33 x Fe 1 x III V 0.67 x III V 0.33 x IV PO 4 F   charge   @   ~ 4.4   V Li 1 x Fe 1 x III V x IV PO 4 F + 0.67 x Li + + 0.67 x e ,
Li 1 x Fe 1 x III V x IV PO 4 F + x Li + + x e   discharge   @   ~ 4.1   V LiFe 1 x III V x III PO 4 F ,
LiFe 1 x III V x III PO 4 F + ( 1 x ) Li + + ( 1 x ) e   discharge   @   2.5 3.0   V   Li 2 x Fe 1 x II V x III PO 4 F ,
Therefore, whether LiFe1−xVxPO4F cells (0 ≤ x ≤ 1) cycled in the range of 2.0–4.5 V charge firstly and discharge subsequently, or vice versa, total reactions can be concluded shown in Figure 6. Now the end-member phases change from LiFePO4F/LiVPO4F to Li 2 x Fe 1 x II V x III PO 4 F / Li 1 x Fe 1 x III V x IV PO 4 F .
When LiFe1−xVxPO4F (x = 0, 0.1, 0.3, 0.5, 0.7, 0.9, 1) cells cycle at 0.1 mV s−1 (Figure 4), or cycle respectively at 0.2, 0.3, 0.4 and 0.5 mV s−1, the cathodic/anodic peaks remain unmoved and peak areas increase, indicating that they have good structural stability and good cyclability (Figure 5). But cathodic/anodic peaks shift during sweep rates changing. When cells cycle from a lower rate to a higher one (0.1 → 0.2 → 0.3 → 0.4 → 0.5 mV s−1), cathodic peaks shift to lower potentials and the corresponding anodic peaks shift to higher potentials. Simultaneously, the potential differences (ΔEp) increase from 0.36 V to 0.47 V for Fe2+/3+ couple and from 0.23 V to 0.44 V for V3+/4+ couple in the LiFe0.5V0.5PO4F cell. Additionally, ΔEp increases from 0.35 V to 0.53 V for Fe2+/3+ couple and from 0.25 V to 0.32 V for V3+/4+ couple in the LiFe0.3V0.7PO4F cell. This is due to electrode kinetics or electrode polarization related to the formation of SEI (solid electrolyte interface) film, side reactions, capacity-fading, etc. Slight differences in shapes of anodic/cathodic peaks are due to cycle reforming [1,4,26,50].
Galvanostatic charge/discharge tests are to understand redox couples and examine the presence of multiple phases. Figure 7 shows the initial and second charge/discharge profiles of LiFe1−xVxPO4F (0 ≤ x ≤ 1) cells at 0.1 C. The galvanostatic tests do not show two separate voltage plateaus on charges around 2.0–4.5 V because of their higher scan rate (0.1 C) than the reported (0.02 C [7,11]), and the lower resolution than CV tests (Figure 4 and Figure 5). A flat plateau at ~2.7 V is assigned to Fe2+/3+ couple and the plateau at ~4.2 V to V3+/4+ couple. The additional redox plateau at ~3.4 V in LiFe0.5V0.5PO4F sample is assigned to Fe2+/3+ couple for LiFePO4 impurity, consistent with the XRD and CV results (Figure 1 and Figure 4). Noteworthy is the Li+-extraction/insertion behavior. In regions of 2.0–3.0 V and 3.0–4.5 V, sloping charge/discharge profiles were observed for all of the LiFe1−xVxPO4F solid-solution samples while 0 < x < 1. This indicates a single-phase behavior [24,25,26,51] which is different from the two-phase behavior for the end-members (x = 0 or 1).

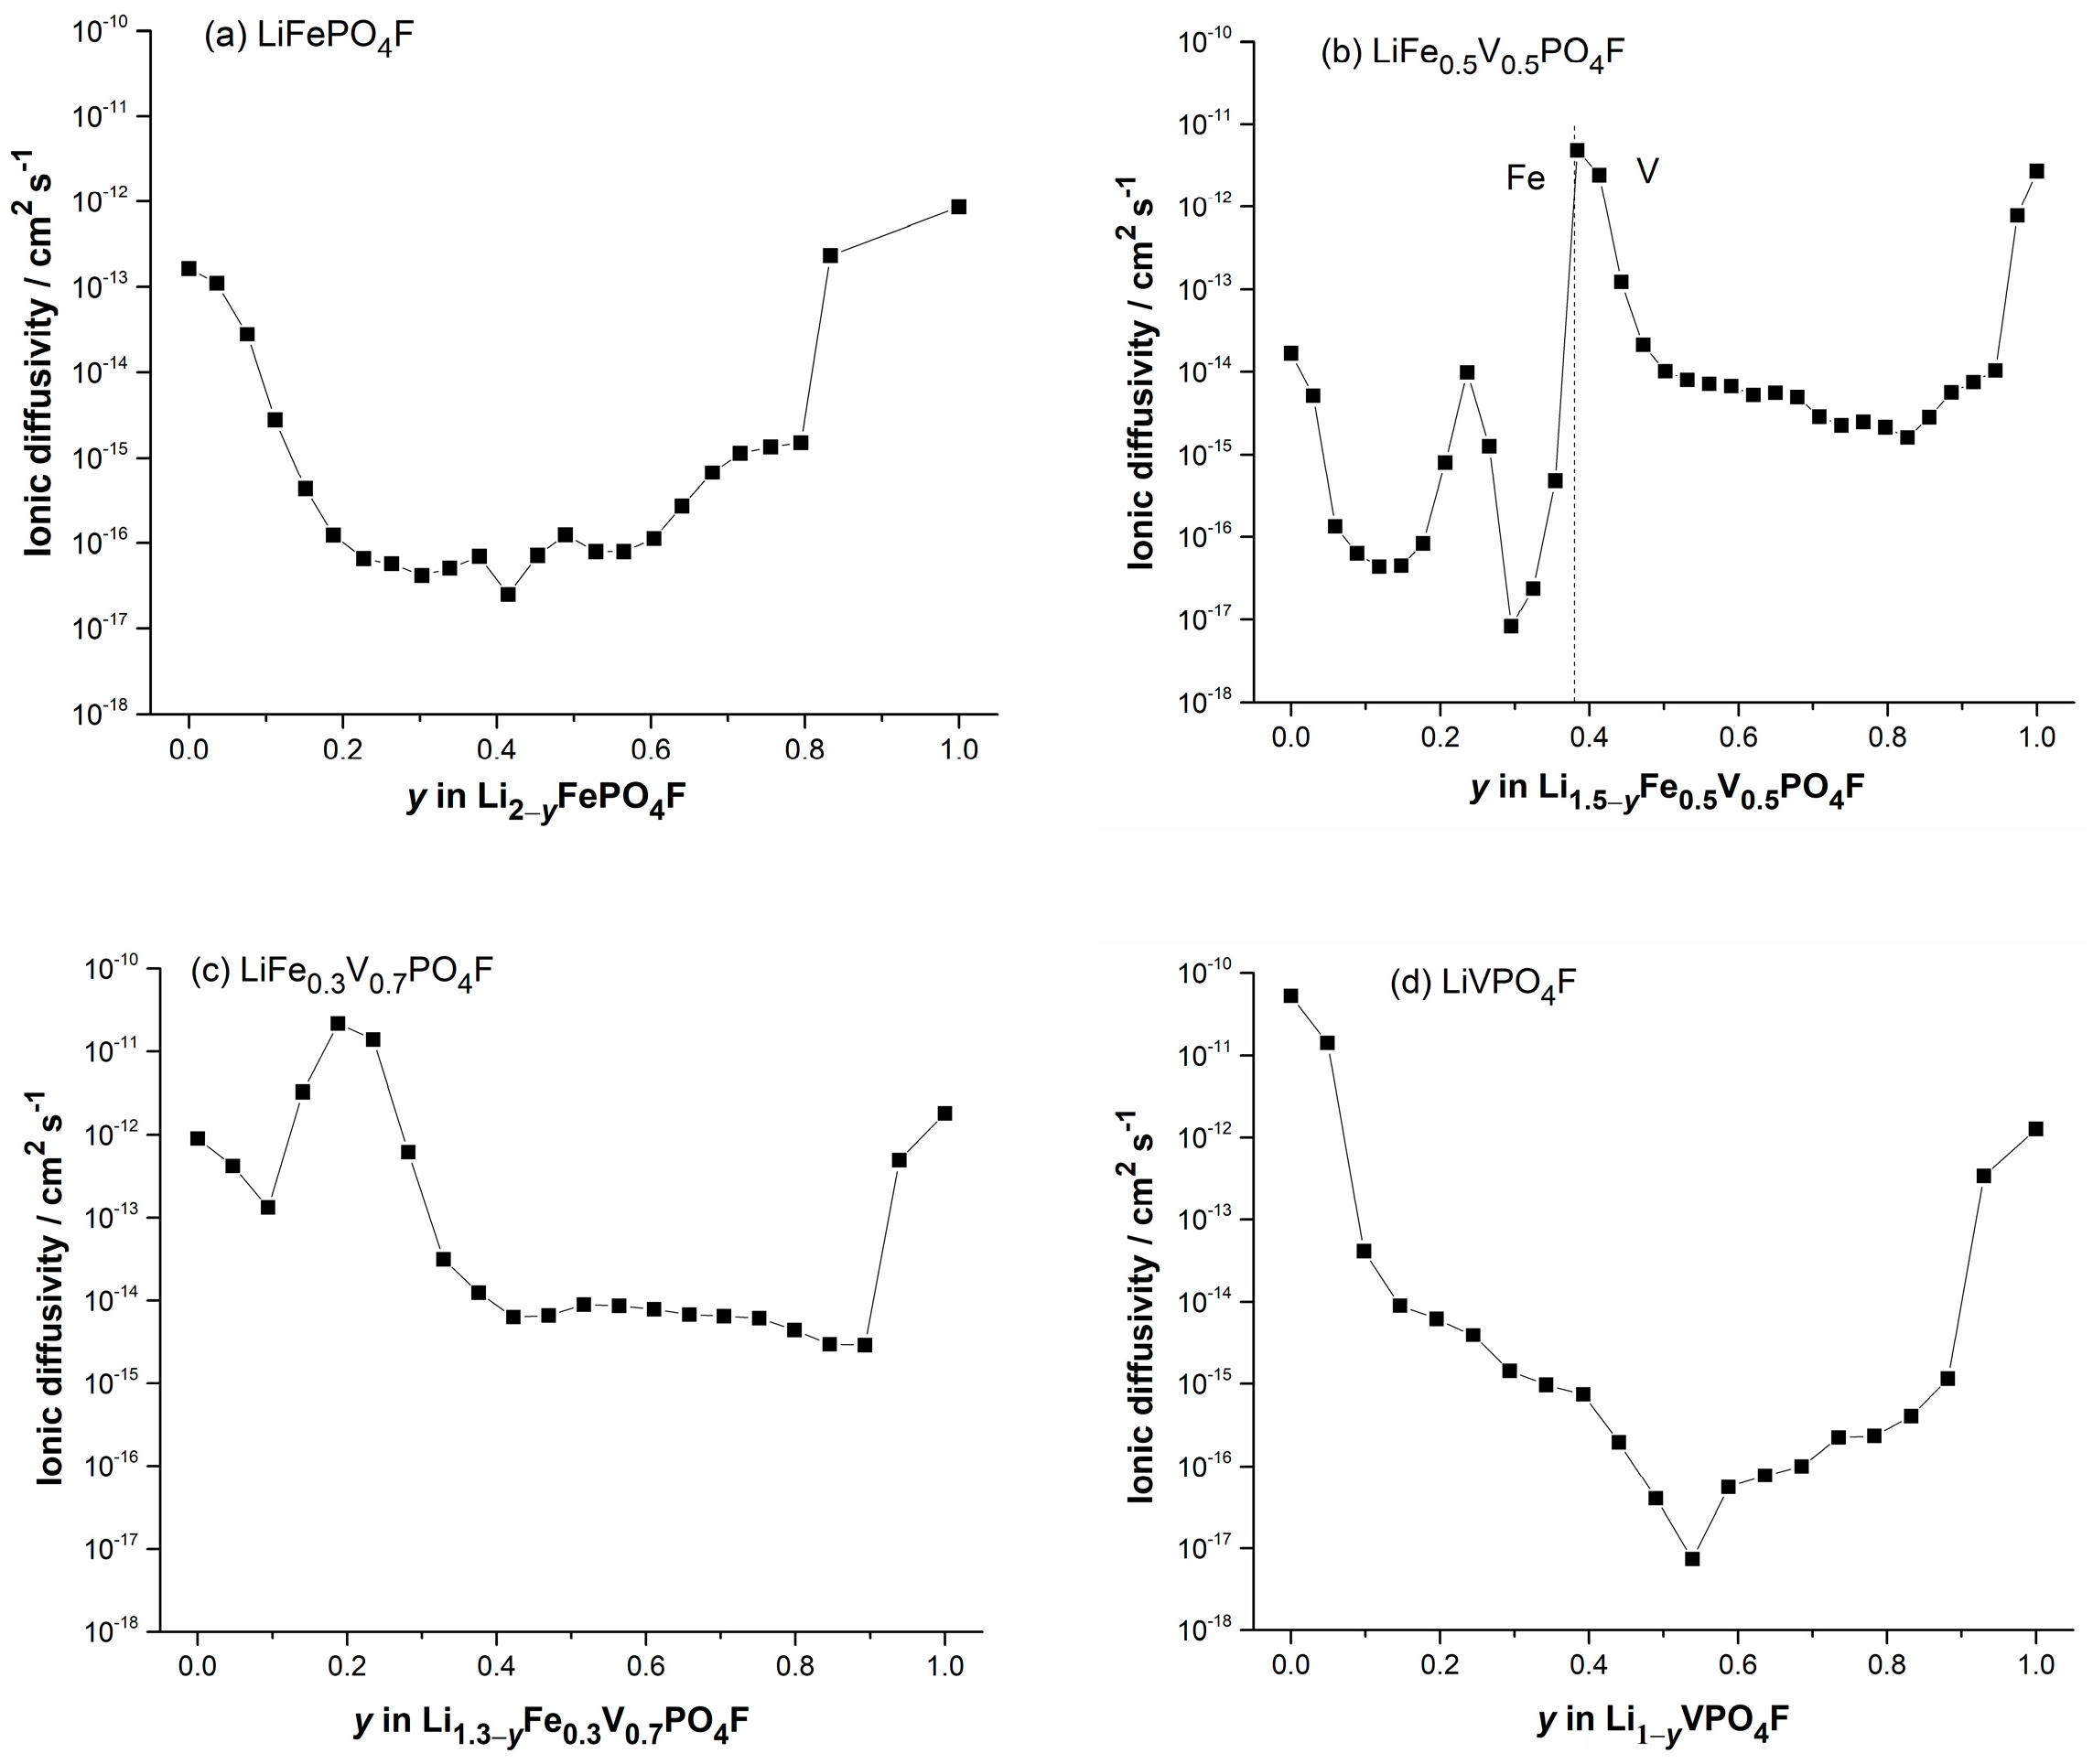
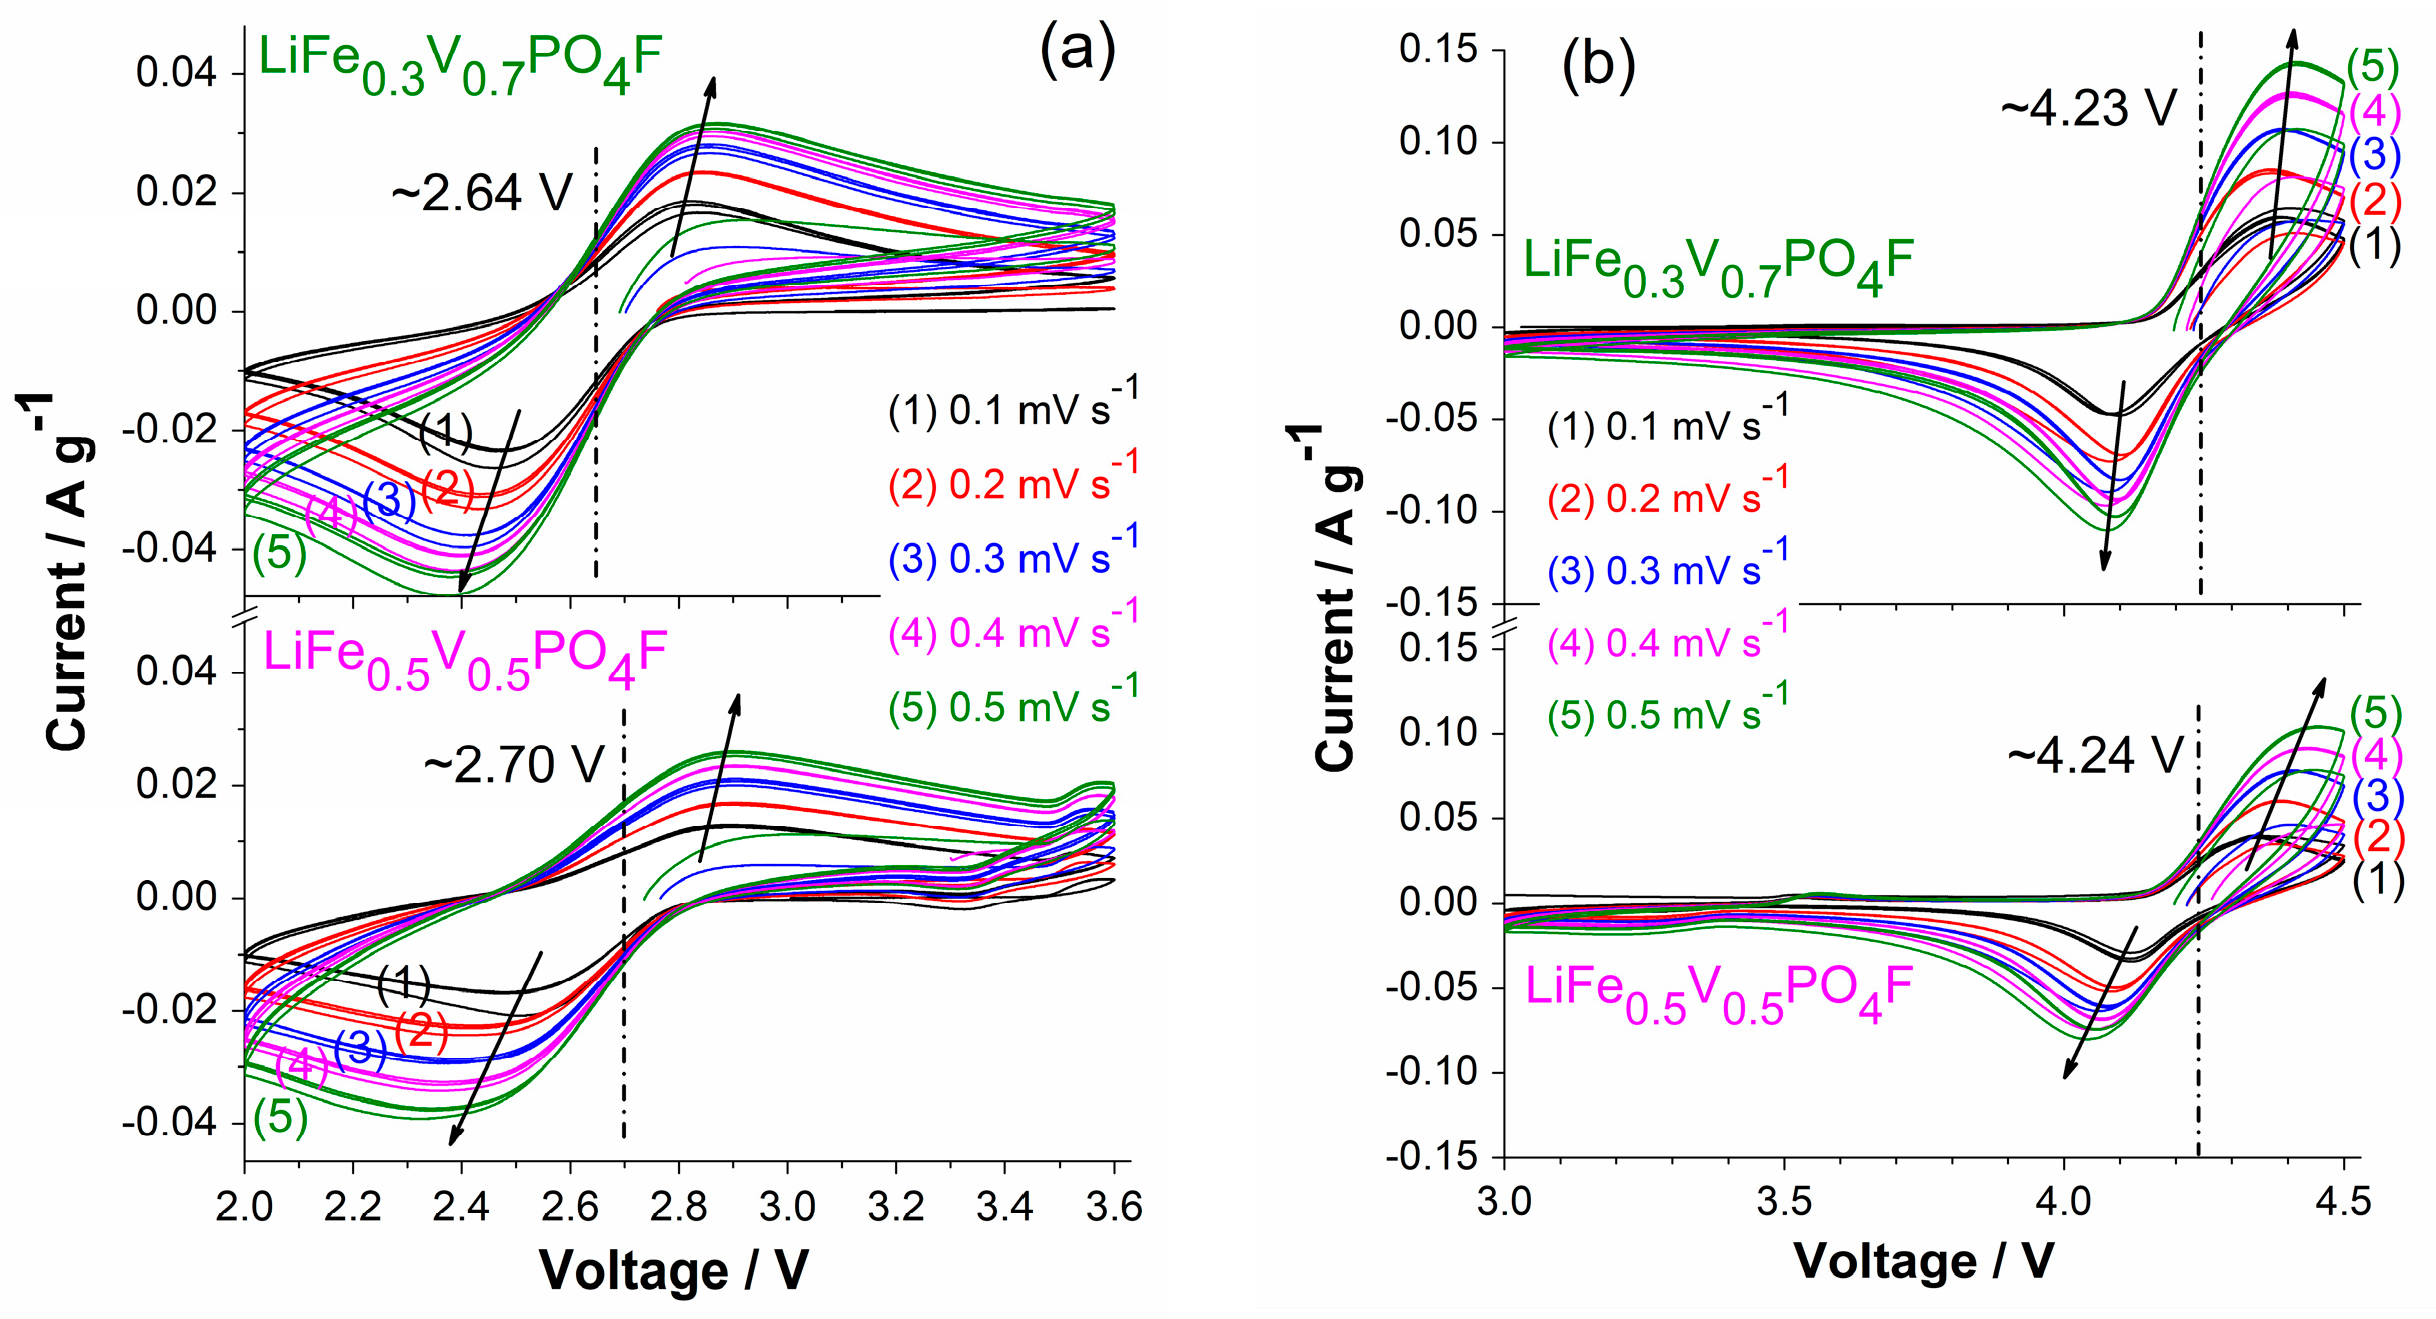
2.5. Li-Ion Diffusion Behavior
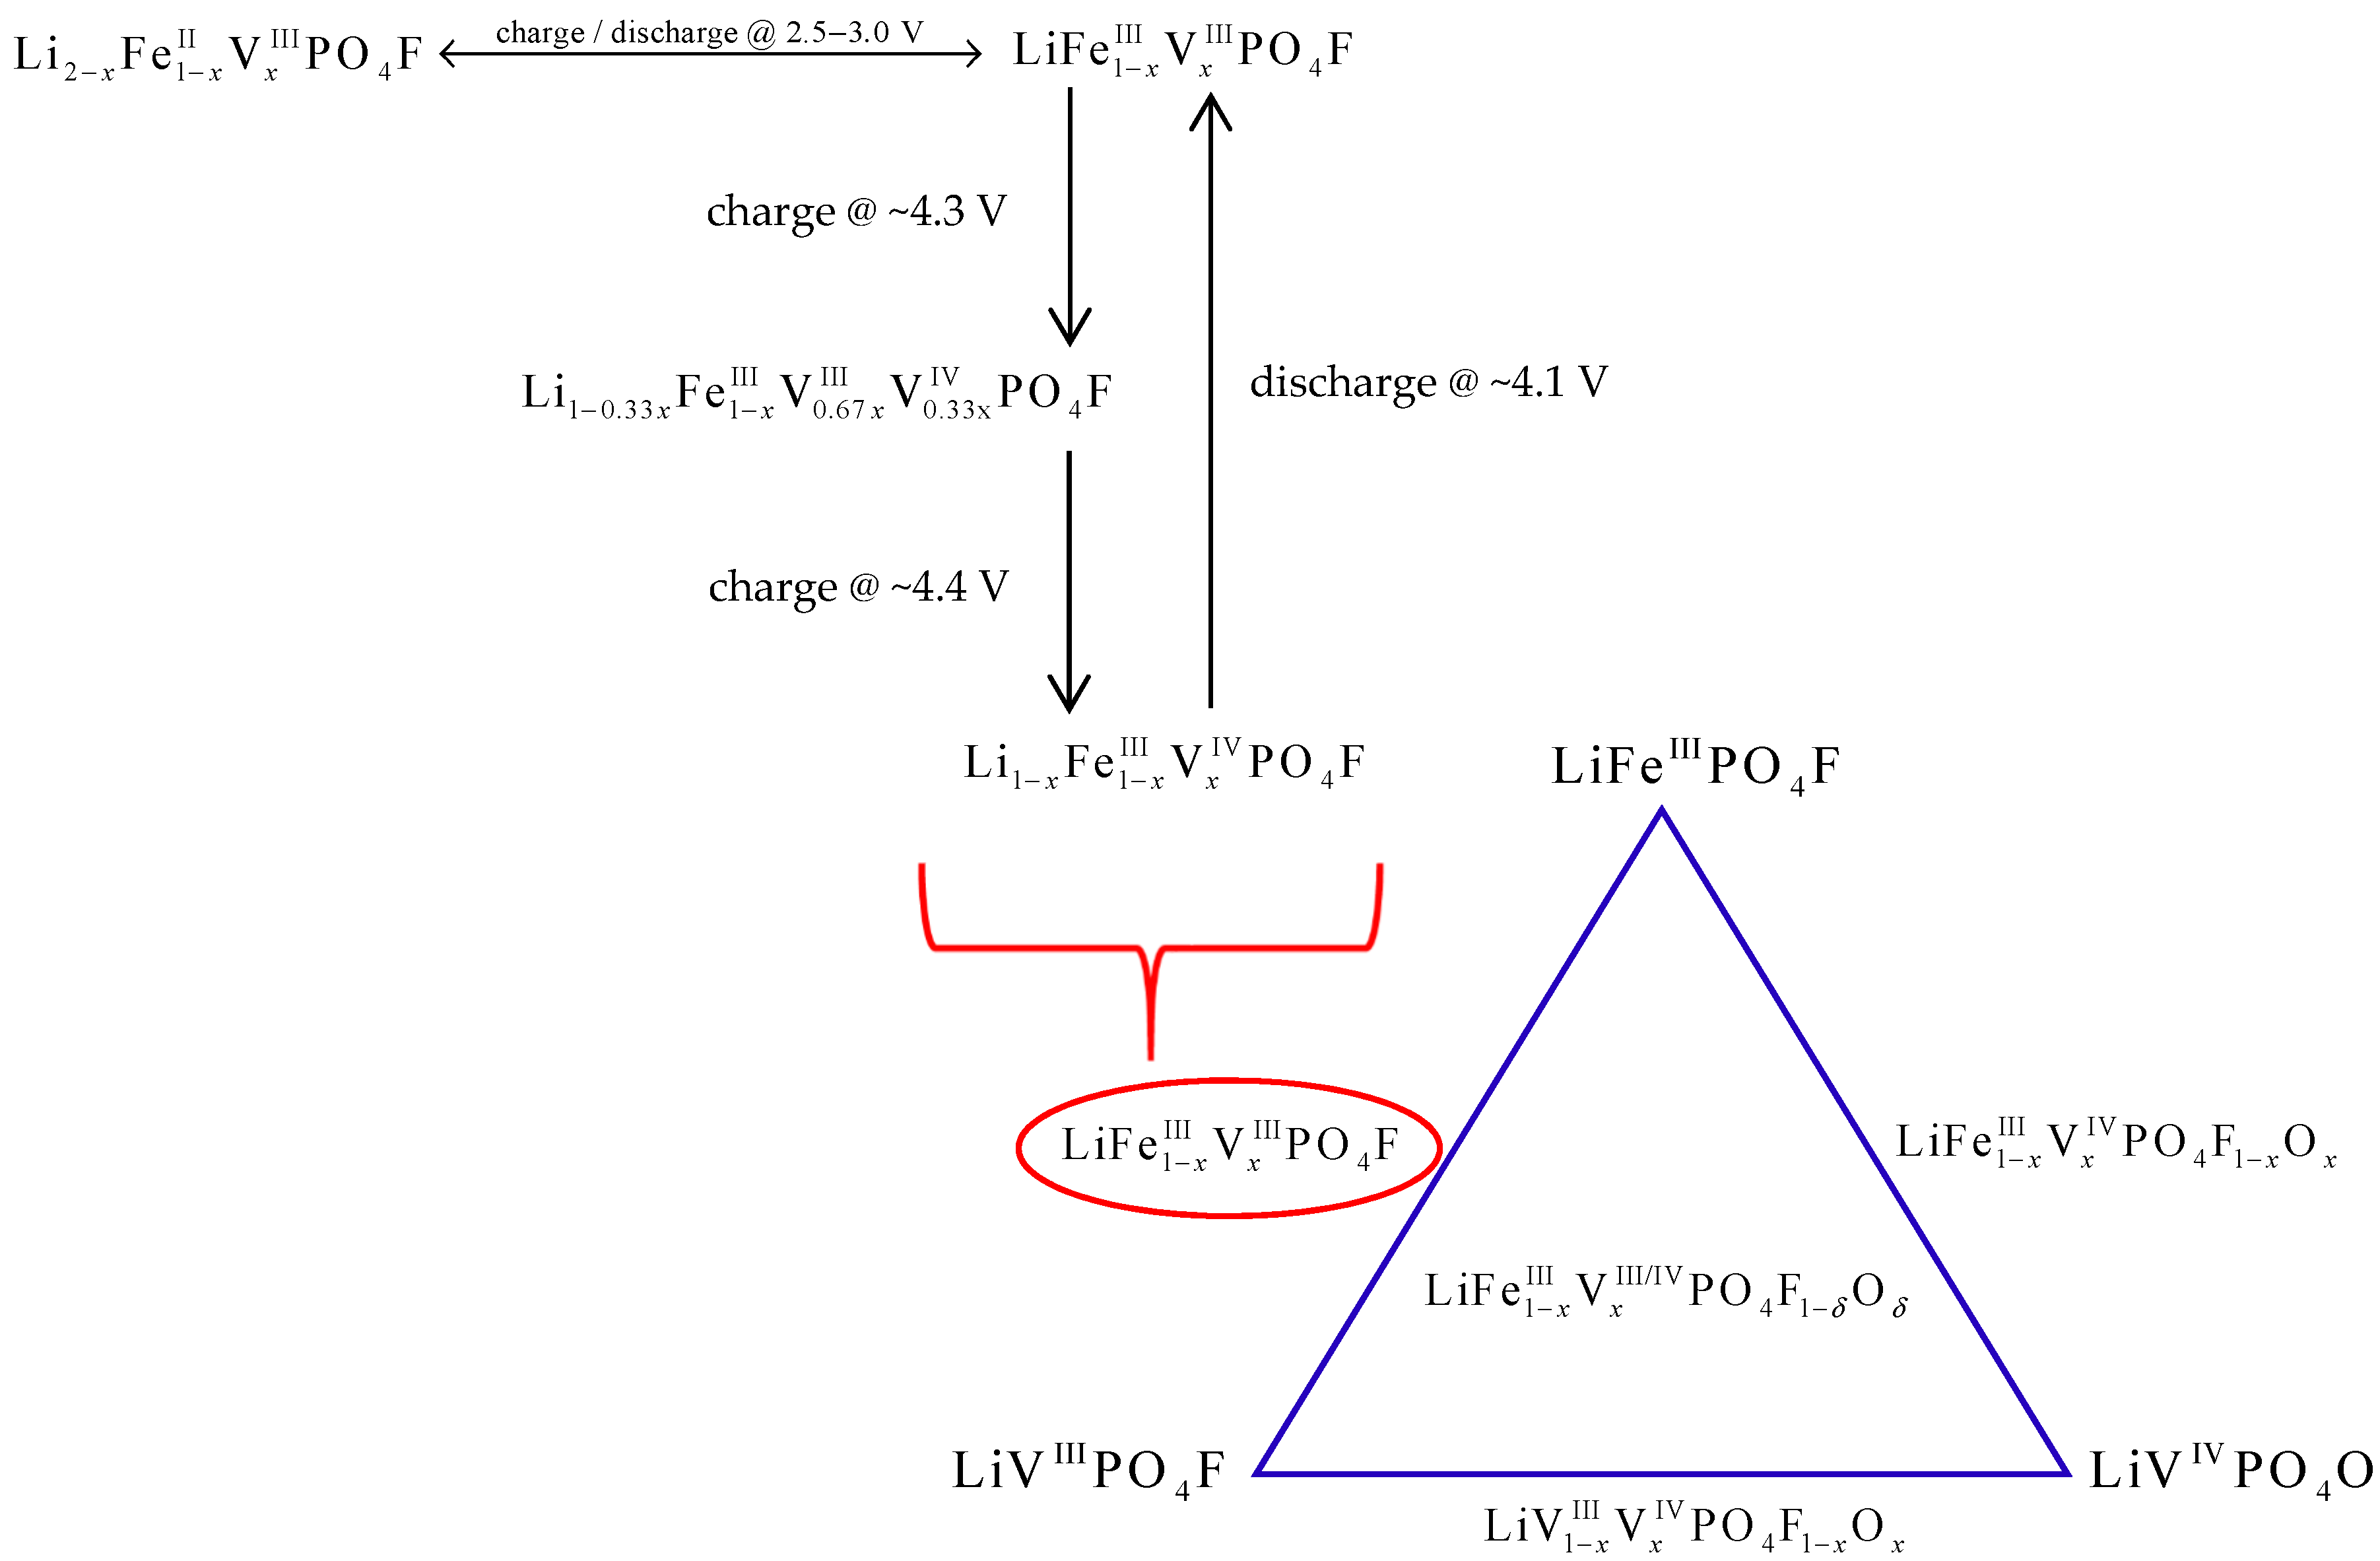
To fully understand the electrochemical reactions occurring during Li+-extraction/insertion process in LiFe1−xVxPO4F (0 ≤ x ≤ 1) cathodes, galvanostatic intermittent titration technique (GITT) measurements were carried out to evaluate the Li-ion diffusion behavior (Figure 8 and Figure 9). Figure S3 shows a scheme for a GITT measurement.
Diffusion coefficient of lithium ions ( D Li + , in cm2 s−1) is calculated based on Equation (5) derived by Weppner et al. [52]:
D Li + = 4 / π ( V M / ( S F ) ) 2 ( I 0 ( δ E s / y ) / ( δ E / δ t 1 / 2 ) ) 2   a t   t < < τ ,
where S is the contact area between the sample and electrolyte (cm2 g−1). In this work, it is calculated from the mean diameter of approximately-spherical grains determined by SEM (Figure 2). The corresponding S values of samples are 8.87 × 10⁴ (LiFePO4F), 1.80 × 10⁴ (LiFe0.5V0.5PO4F), 1.81 × 10⁴ (LiFe0.3V0.7PO4F) and 3.66 × 104 cm2 g−1 (LiVPO4F), respectively. This is a suitable choice since c.f. errors would be introduced from the residual carbon when using the Brunauer–Emmett–Teller (BET) specific surface area, or from the cathode-in-electrolyte system when using the electrode geometric area. Thus, calculation results may cause a big difference on about several orders of magnitude, but the general trend of D Li + will be the same [53,54,55]. VM is the molar volume of sample (cm3 mol−1), F is the Faraday constant (9.64853 × 10⁴ C mol−1), and I0 is the pulse current (A g−1). δ E s / δ y is the slope of quasi-equilibrium open-circuit voltage (OCV) (V) as a function of Li+-extraction content y. δ E / δ t 1 / 2 is the slope of the initial transient voltage change as a function of the square root of time (V s−1/2). The equation is valid for times shorter than the diffusion time τ = ( π d / 2 ) 2 / D Li + , where d is the average diameter of grains [54]. If the arithmetical units of D Li + were in m2 s−1, those of S should be in m2 g−1 and VM in m3 mol−1 simultaneously.
Figure 8 shows the independent (Figure 8a) and overlaid (Figure 8b) curves of voltage as a function of Li+-extraction content y under load and rest by GITT measurements in Li 2 x y Fe 1 x II V x III PO 4 F (0 ≤ x ≤ 1; 0 ≤ y ≤ 1). Here, the nearly flat region indicates the voltage measured during charging (load), while relaxation spikes at a given state of charge (SOC) (i.e., Li+-extraction content y) indicate the change in voltage during relaxation or equilibration. The equilibrium OCVs for Fe2+/3+ couples in LiFePO4F and V3+/4+ couples in LiVPO4F reveal nearly flat potentials on 2.78 V and 4.24 V, respectively. This means a two-phase reaction mechanism. The LiFePO4F sample exhibits higher over-voltage (longer spikes) than the LiVPO4F, indicating its larger polarization and slower equilibration [56]. The OCV profiles of LiFe1−xVxPO4F solid-solution samples (0 < x < 1), especially for those with x = 0.3, 0.5 and 0.7, show a sloping region on going from Fe2+/3+ to V3+/4+ redox couples. This indicates a single-phase reaction mechanism [25,32,56].
Figures S4–S7 show GITT curves of the quasi-equilibrium OCVs as a function of time, or as a function of Li+-extraction content y, plots of the slope of quasi-equilibrium OCVs as a function of Li+-extraction content y ( δ E s / δ y ), and plots of the slope of initial transient voltage change as a function of the square root of time ( δ E / δ t 1 / 2 ), in Li 1 y Fe 1 x III V x III PO 4 F (i.e., Li 2 x y Fe 1 x II V x III PO 4 F with x = 0, 0.5, 0.7, 1). Figure 9 shows plots of diffusion coefficients D Li + obtained by GITT as a function of Li+-extraction content y. They present disordered “W” or “U” shapes for extraction/insertion, similar to those reported [53].
The obtained D Li + values vary from ~10−17 to ~10−12 cm2 s−1 (LiFePO4F), ~10−17 to 10−11 cm2 s−1 (LiFe0.5V0.5PO4F), ~10−15 to ~5 × 10⁻¹¹ cm2 s−1 (LiFe0.3V0.7PO4F) and ~1017 to ~10–10 cm2 s−1 (LiVPO4F), respectively. Each of them has a minimum which was caused by strong attractive interactions between the Li+-extraction/insertion species and the host matrix [54]. As the doped V-content x increases from 0 to 1, the upper-limit value of D Li + increases 1–2 orders of magnitude. If the geometric area of the electrode was used as the contact area (S) [25,55], diffusion coefficients would increase 2–3 orders of magnitude for samples in this work. It indicates that LiFe1−xVxPO4F (0 < x < 1) solid solutions have comparable electrochemical activities with their end-members (x = 0 or 1), while redox potentials can be tuned within a wide range, 2.0–4.5 V, by cation (V for Fe or Fe for V) substitutions. This makes them attractive cathode candidates of high specific-energy Li-ion batteries.

3. Discussion

Figure 10 shows shifts in midpoints of anodic (Li+-extraction) and cathodic (Li+-insertion) peaks for Fe2+/3+ and V3+/4+ couples, exported from Figure 4, as a function of V-content x in LiFe1−xVxPO4F (0 ≤ x ≤ 1). As mentioned in Section 2.4, there exists two anodic peaks assigned to V3+/4+ redox couple when 0 < x ≤ 1, and the separation of anodic peaks is ~0.07 V. For simplicity, one midpoint was calculated from a cathodic peak and its corresponding higher-potential anodic peak. As the V-content x increases, a downward shift in the redox potential of Fe2+/3+ couple was observed. However, there was hardly any shift for V3+/4+ couple. These are different significantly from those in the reported Li M 1 y M y PO 4 (M′, M″ = Mn, Fe, Co), in which potentials increasing of lower potential (LP)-couples is always associated with potentials decreasing of high potential (HP)-couples [56,57,58], compared to potentials of the pristine end-members.
Redox energies of cations can be tuned through the inductive effect introduced by a counter cation substitution [24,25,56,59] in LiFe 1 x III V x III PO 4 F (0 < x < 1) solid-solution cathodes. If the polyanion (PO4F) was fixed, the change in the covalency of M–O4F2 bonds (M = Fe1−xVx) could be caused by the following:
(i) Change in the electronegativity of M: The substitution of a less electronegative (more electropositive) V3+ for Fe3+ is expected to increase the Fe–O4F2 covalency due to the inductive effect (weaker V–O4F2 covalency strengthens the Fe–O4F2 covalency), and raise the Fe2+/3+ redox energy, thereby decreasing the redox potential of Fe2+/3+ couple, in accord with what we observe in Figure 10. Similarly, the substitution of a more electronegative Fe3+ for V3+ would be expected to decrease the V–O4F2 covalency, lower the V3+/4+ redox energy, and increase the redox potential of the V3+/4+ couple [56,57,58]. This is not in accord with what we observe in Figure 10.
(ii) Change in the M–O4F2 bond length: The covalency contraction effect originates from the relative contraction of cation-anion distances in two different isotypic compounds with different electronegativity [35]. As stated before, the V3+ ( r V 3 + = 0.640 Å) and Fe3+ ( r Fe 3 + , HS = 0.645 Å) have close effective ionic radii (CN = 6) [3,34,35]. In a high spin (HS) state, the covalency contraction effect and crystal field effect play collectively a dominant role on the Fe2+ ( r Fe 2 + , HS = 0.780 Å) and Fe3+ ( r Fe 3 + , HS = 0.645 Å), and as a result their radii are close to the V2+ ( r V 2 + = 0.79 Å) and V3+ ( r V 3 + = 0.640 Å), respectively. But in a low spin (LS) state, the covalency contraction effect plays a dominant role on the Fe2+ ( r Fe 2 + , LS = 0.61 Å) and Fe3+ ( r Fe 3 + , LS = 0.55 Å), and as result their radii are smaller than the V2+ ( r V 2 + = 0.79 Å) and V3+ ( r V 3 + = 0.640 Å), respectively [3,34,35]. The substitution of V3+ ( r V 3 + = 0.640 Å) for Fe3+ ( r Fe 3 + , HS = 0.645 Å) with close effective ionic radii does not change the M–O4F2 bond length (therefore it does not change the Fe–O4F2 or V–O4F2 covalency), indicating that redox energies/potentials of Fe2+/3+ and V3+/4+ couples would not change which correlates to the inductive effect [56,57,58]. This identifies with what we observe in Figure 10. We do not support that the Fe3+/4+ couple exists stably in range of 2.0–4.5 V [4,26,60].
Therefore, we can conclude that the electronegativity of M plays a dominant role compared to the M–O4F2 bond length for the redox potential of Fe2+/3+ couple in LiFe 1 x III V x III PO 4 F solid-solution cathodes (M = Fe1−xVx; 0 < x < 1). But for the redox potential of V3+/4+ couple, the M–O4F2 bond length plays a dominant role in controlling the redox energy of cation V.
It is likely there is also a continuous downshift for the Fe2+/3+ couple shown in OCV profiles (Figure 8 and Figure 9) with increasing substitution of V3+ for Fe3+, while there is no shift for the V3+/4+ couple with increasing substitution of Fe3+ for V3+ in LiFe1−xVxPO4F (0 ≤ x ≤ 1), to support results of CV measurements (Figure 4). However, we do not now adopt the idea because all GITT measurements in this work started only from the fully-discharged state. It also needs to start from the fully-charged state ( Li 1 x Fe 1 x III V x IV PO 4 F ) at 4.5 V toward cathodic direction with identical relaxation conditions to confirm the measured OCVs including negligible kinetic effect [57]. Research is underway and will be reported elsewhere.

4. Materials and Methods

The VPO4 powder was pre-synthesized by a hydrothermal route using raw materials of H3PO3 (99% wt, Sinopharm Chem. Reag. Co. Ltd., Shanghai, China), V2O5 (99% wt, Energy Chem. Co. Ltd., Shanghai, China) and H2O. Firstly, H3PO3 was dissolved in H2O, then V2O5 was added to the solution under vigorous stirring. Reagents were placed in an autoclave, heated to 160 °C, dwelled for 6 h and cooled inside to room temperature (RT). Secondly, the intermediate product from the autoclave was dried in a vacuum oven at 80 °C for 4 h and then calcined at 800 °C for 5 h under argon in a tube furnace. The hydrothermal-synthesis process is: H3PO3 + V2O5 + H2O 160   ° C ,   6   h VPO4xH2O 800   ° C ,   5   h ,   Ar VPO4. LiFe1−xVxPO4F (x = 0, 0.1, 0.3, 0.5, 0.7, 0.9, 1) powders were then obtained by mixing the hydrothermal-synthesized VPO4, commercial FePO4 (99% wt, Mianyang Tianming New Energy Technol. Co. Ltd., Mianyang, China) and LiF (99.9% wt, Aladdin Chem. Reag. Co. Ltd., Shanghai, China), followed by pelletizing, calcining at 625 °C for 1.5 h under argon and grinding [4,26,33].
LiFe1−xVxPO4F (x = 0, 0.1, 0.3, 0.5, 0.7, 0.9, 1) electrodes and cells were prepared using the same method as pure LiFePO4F/LiVPO4F ones [4,26,33]. LiFe1−xVxPO4F powders, super P (conductive carbon) and binder (polyvinylidene fluoride, PVDF) were mixed to form a slurry by using N-methyl-pyrrolidone (NMP) as the solvent (LiFe1−xVxPO4F:C:PVDF = 8:1:1, % wt). The aluminum foil casted by the slurry was then vacuum-dried at 120 °C for 12 h, roller-pressed and cut into discs of 15 mm diameter (~1.767 cm2). The loading density of active material was 1.2–3.4 × 10⁻³ g cm–2 approximately. The electrolyte was 1 M LiPF6 dissolved in a mixture of ethylene carbonate (EC) and dimethyl carbonate (DMC) (1:1, % vol). The polypropylene film (Celgard 2400) was used as the separator and lithium foil as the counter and reference electrodes. The lithium-ion rechargeable (LIR) 2025 coin-type cells were assembled in an argon-filled glove box (Etelux Lab2000, Beijing, China).
Elaborative phase determination (8° ≤ 2θ ≤ 100°) was carried out by X-ray powder diffraction (XRD) using CuKα radiation (λα1 = 1.54060 Å, 40 kV, 40 mA) in flat plate θ/2θ geometry at a step size of 0.01943°/step and a scan speed of 0.01203°/s (D8 Adv., Bruker Co. Ltd., Karlsruhe, Germany). Testing conditions included a divergence slit of 1.0 mm, an antiscatter slit of 6.94 mm, a primary soller slit of 2.5°, a second soller slit of 2.5° and a detector slit of 12.21 mm. Structure refinements were performed by the Rietveld method implemented in GSAS/EXIGUI Revision 1251 software [61] using the model Li2i(Fe1,V1)1a(Fe2,V2)1b{P2i[O2i]4}F2i based on the LiFe0.5V0.5PO4F structure [25] which has only one crystallographic lithium site [7,11], contrary to the previous viewpoints [6,36,48]. Valence states of Fe/V components in FePO4, VPO4 and LiFe1−xVxPO4F (0 ≤ x ≤ 1) powders were determined by X-ray photoelectron spectra (XPS) using a Multilab 2000 spectrometer (VG Inc., Waltham, MA, USA) equipped with a focused monochromatized Al Kα X-ray source (hν = 1486.6 eV). All the obtained binding energy (BE) values were calibrated using the photoemission line C 1s at 284.8 eV. The microstructure and compositions of samples were characterized by a field-emission scanning electron microscope (FESEM; SU-8020, Hitachi Ltd., Tokyo, Japan) equipped with an X-ray spectrometer for energy dispersive spectroscopy (Bruker EDS QUANTAX, Karlsruhe, Germany).
To evaluate electrochemical properties of LiFe1−xVxPO4F (0 ≤ x ≤ 1) cathodes, cyclic voltammetry (CV) measurements were carried out at RT with sweep rates of 0.1/0.2/0.3/0.4/0.5 mV s−1, in the range of 2.0–4.5 V (vs. Li/Li+) for Fe2+/3+ and V3+/4+ couples, 2.0–3.6 V for Fe2+/3+ couple and 3.0–4.5 V for V3+/4+ couple, using a CHI660e electrochemical workstation (Shanghai Chenhua Instr. Co. Ltd., Shanghai, China). Galvanostatic charge/discharge tests (0.1 C) were performed at RT, in the range of 2.0−4.5 V for LiFe1−xVxPO4F (0 < x < 1), 2.0–4.0 V for LiFePO4F and 3.0–4.5 V for LiVPO4F, using a CT2001A Land battery testing system (Wuhan Land Electronics Co. Ltd., Wuhan, China). Galvanostatic intermittent titration technique (GITT) measurements started from the fully-discharged state ( Li 2 x Fe 1 x II V x III PO 4 F ) at 2.0 V, which realized after the cell discharged for 24 h at 0.05 C, toward anodic direction with intermittent of 5% state of charge (5% SOC, i.e., 0.05 Li+-extraction). The charging at 0.05 C was followed after 3 h relaxation for equilibrium at each open-circuit voltage (OCV) measuring points. GITT measurements proceeded until reaching the fully-charged state ( Li 1 x Fe 1 x III V x IV PO 4 F ) at 4.5 V.

5. Conclusions

In this work, tavorite triclinic-structured LiFe1−xVxPO4F (x = 0, 0.1, 0.3, 0.5, 0.7, 0.9 and 1) solid-solution powders, the related cathodes and Li-ion batteries were prepared and characterized.
The systematic variations in lattice parameters and unit cell volumes via XRD Rietveld refinements confirm the formation of homogeneous solid solutions, which originate from the substitution of V3+ for Fe3+ with close effective ionic radii. The valence states of Fe3+/V3+ were identified by XPS and a homogeneous distribution of Fe/V/P/F components by SEM/EDS.
A single-phase behavior is confirmed strongly by analyzing the broad shape of cyclic voltammetry (CV) peaks, sloping charge/discharge profiles and sloping open-circuit voltage (OCV) profiles in LiFe1−xVxPO4F solid-solution cathodes. As the vanadium content x increases, a downward shift in the redox potential of Fe2+/3+ couple was observed in CV curves. However, there was hardly any shift for the V3+/4+ couple. The electronegativity of M (M = Fe1−xVx) plays a dominant role compared to the M–O4F2 bond length for the redox potential of Fe2+/3+ couple. Yet for the redox potential of V3+/4+ couple, the M–O4F2 bond length plays a dominant role. The obtained diffusion coefficient of lithium ions ( D Li + ) indicates that LiFe1−xVxPO4F (0 < x < 1) solid solutions have comparable electrochemical activities with their end-members (x = 0 or 1).
The mechanism is involved in redox energies of cations which are tuned within a wide range 2.0–4.5 V in polyanion-type cathodes, through the inductive effect introduced by cation (V for Fe) substitution.

Supplementary Materials

The following are available online at https://www.mdpi.com/1420-3049/24/10/1893/s1, Table S1–S7: Rietveld refined parameters of the tavorite LiFe1−xVxPO4F (x = 0, 0.1, 0.3, 0.5, 0.7, 0.9 and 1) structure. Table S8: Comparison of lattice parameters for LiFe1−xVxPO4F (0 ≤ x ≤ 1) samples and the related publications. Figure S1: The final observed, calculated and difference profiles of the tavorite-structured LiFePO4F, LiFe0.9V0.1PO4F, LiFe0.7V0.3PO4F, LiFe0.5V0.5PO4F, LiFe0.3V0.7PO4F, LiFe0.1V0.9PO4F and LiVPO4F via Rietveld refinements. Figure S2: Variations of lattice parameters (a, b, c, α, β and γ) and unit cell volumes (V) of LiFe1−xVxPO4F (0 ≤ x ≤ 1) solid solutions. Figure S3: Scheme for a GITT measurement. Figures S4–S7: Curves of the quasi-equilibrium OCVs as a function of time by GITT, or as a function of Li+-extraction content y, plots of the slope of quasi-equilibrium OCVs as a function of Li+-extraction content y ( δ E s / δ y ), and plots of the slope of initial transient voltage change as a function of square root of time ( δ E / δ t 1 / 2 ), in Li 1 y Fe 1 x III V x III PO 4 F , i.e., Li 2 x y Fe 1 x II V x III PO 4 F with x = 0, 0.5, 0.7 and 1.

Author Contributions

J.-L.Y. performed experiments and wrote the manuscript. S.-H.F. performed part of the experiments. C.Z., Y.Z., J.W. and Q.L. helped do experiments and revise the manuscript. G.-Q.S. conceived the idea and supervised the project. All authors read and approved the final manuscript.

Funding

This research was funded by the State Key Laboratory of Advanced Technology for Materials Synthesis and Processing, WUT, China (Grant No. 2016-KF-4).

Acknowledgments

The authors gratefully acknowledge J.-H. Liu, D. Chen, B. Li, F.-F. Ma, J.-W. Mao and D.-S. Zhao in our group. Additional thanks to Fan in SCUN, B.-L. Wu in GUT and J.-X. Mi in XMU.

Conflicts of Interest

The authors declare no conflicts of interest.

Appendix A

Further details of crystal structures may be obtained from Cambridge Crystallographic Data Centre (CCDC)/Leibniz Institute for Information Infrastructure (FIZ Karlsruhe) joint deposition and access services (www.ccdc.cam.ac.uk; www.fiz-karlsruhe.de) on quoting the appropriate CSD numbers (G.-Q.S., J.-L.Y., S.-H.F., et al., LiFe0.3V0.7PO4F CSD 1906255 and LiVPO4F CSD 1906256, 28 March 2019).

References

  1. Prabu, M.; Reddy, M.V.; Selvasekarapandian, S.; Subba-Rao, G.V.; Chowdari, B.V.R. Synthesis, impedance and electrochemical studies of lithium iron fluorophosphate, LiFePO4F cathode. Electrochim. Acta 2012, 85, 572–578. [Google Scholar] [CrossRef]
  2. Molenda, J.; Ojczyk, W.; Świerczek, K.; Zajac, W.; Krok, F.; Dygas, J.; Liu, R.S. Diffusional mechanism of deintercalation in LiFe1−yMnyPO4 cathode material. Solid State Ion. 2006, 177, 2617–2624. [Google Scholar] [CrossRef]
  3. Ramzan, M.; Lebegue, S.; Larsson, P.; Ahuja, R. Structural, magnetic, and energetic properties of Na2FePO4F, Li2FePO4F, NaFePO4F, and LiFePO4F from ab initio calculations. J. Appl. Phys. 2009, 106, 043510. [Google Scholar] [CrossRef]
  4. Chen, D.; Shao, G.-Q.; Li, B.; Zhao, G.-G.; Li, J.; Liu, J.-H.; Gao, Z.-S.; Zhang, H.-F. Synthesis, crystal structure and electrochemical properties of LiFePO4F cathode material for Li-ion batteries. Electrochim. Acta 2014, 147, 663–668. [Google Scholar] [CrossRef]
  5. Padhi, A.; Nanjundaswamy, K.; Masquelier, C.; Okada, S.; Goodenough, J. Effect of structure on the Fe3+/Fe2+ redox couple in iron phosphates. J. Electrochem. Soc. 1997, 144, 1609–1613. [Google Scholar] [CrossRef]
  6. Barker, J.; Saidi, M.Y.; Swoyer, J.L. Electrochemical insertion properties of the novel lithium vanadium fluorophosphate, LiVPO4F. J. Electrochem. Soc. 2003, 150, A1394–A1398. [Google Scholar] [CrossRef]
  7. Mba, J.M.A.; Croguennec, L.; Basir, N.I.; Barker, J.; Masquelier, C. Lithium insertion or extraction from/into tavorite-type LiVPO4F: An in situ X-ray diffraction study. J. Electrochem. Soc. 2012, 159, A1171–A1175. [Google Scholar] [CrossRef]
  8. Fan, C.-L.; Wen, Z.; Xiao, R.-F.; Li, Q.-Y.; Gong, Y.; Zeng, T.-T.; Wei, S.; Zhang, X.; Han, S.-C. LiVPO4F/C cathode synthesized by a fast chemical reduction method for lithium-ion batteries. Mater. Lett. 2016, 170, 35–38. [Google Scholar] [CrossRef]
  9. Yang, B.; Yang, L. Silver-coated LiVPO4F composite with improved electrochemical performance as cathode material for lithium-ion batteries. J. Phys. Chem. Solids 2015, 87, 228–232. [Google Scholar] [CrossRef]
  10. Yan, H.; Wu, X.; Li, Y. Preparation and characterization of conducting polyaniline-coated LiVPO4F nanocrystals with core-shell structure and its application in lithium-ion batteries. Electrochim. Acta 2015, 182, 437–444. [Google Scholar] [CrossRef]
  11. Mba, J.M.A.; Masquelier, C.; Suard, E.; Croguennec, L. Synthesis and crystallographic study of homeotypic LiVPO4F and LiVPO4O. Chem. Mater. 2012, 24, 1223–1234. [Google Scholar] [CrossRef]
  12. Li, P.; Wang, P.; Yu, H.; Lin, X.; Shao, L.; Shui, M.; Long, N.; Shu, J. Carbothermal synthesis of LiVPO4F and its structural change in a broad potential range observed by in-situ X-ray diffraction. Ceram. Int. 2015, 41, 10766–10774. [Google Scholar] [CrossRef]
  13. Wang, J.-X.; Wang, Z.-X.; Li, X.-H.; Guo, H.-J.; Wu, X.-W.; Zhang, X.-P.; Xiao, W. xLi3V2(PO4)3 center dot LiVPO4F/C composite cathode materials for lithium ion batteries. Electrochim. Acta 2013, 87, 224–229. [Google Scholar] [CrossRef]
  14. Wang, J.-X.; Li, X.-H.; Wang, Z.-X.; Guo, H.-J.; Zhang, Y.-H.; Xiong, X.-H.; He, Z.-J. Synthesis and characterization of LiVPO4F/C using precursor obtained through a soft chemical route with mechanical activation assist. Electrochim. Acta 2013, 91, 75–81. [Google Scholar] [CrossRef]
  15. Wang, J.; Liu, Z.; Yan, G.; Li, H.; Peng, W.; Li, X.; Song, L.; Shih, K. Improving the electrochemical performance of lithium vanadium fluorophosphate cathode material: Focus on interfacial stability. J. Power Sources 2016, 329, 553–557. [Google Scholar] [CrossRef]
  16. Hu, G.; Gan, Z.; Cao, Y.; Du, K.; Du, Y.; Peng, Z. A three-dimensional LiVPO4F@C/MWCNTs/rGO composite with enhanced performance for high rate Li-ion batteries. Electrochim. Acta 2018, 292, 502–510. [Google Scholar] [CrossRef]
  17. Li, P.; Ma, R.; Lin, X.; Shao, L.; Wu, K.; Shui, M.; Long, N.; Shu, J. Impact of H2O exposure on the structure and electrochemical performance of LiVPO4F cathode material. J. Alloys Compd. 2015, 637, 20–29. [Google Scholar] [CrossRef]
  18. Ma, R.; Shu, J.; Shao, L.; Lin, X.; Wu, K.; Shui, M.; Li, P.; Long, N.; Ren, Y. Determination of lithium ion diffusion behaviors in tavorite LiVPO4F by galvanostatic intermittent titration technique. Ceram. Int. 2014, 40, 15113–15119. [Google Scholar] [CrossRef]
  19. Liu, Z.; Fan, Y.; Peng, W.; Wang, Z.; Guo, H.; Li, X.; Wang, J. Mechanical activation assisted soft chemical synthesis of Na-doped lithium vanadium fluorophosphates with improved lithium storage properties. Ceram. Int. 2015, 41, 4267–4271. [Google Scholar] [CrossRef]
  20. Liu, Z.; Peng, W.; Fan, Y.; Li, X.; Wang, Z.; Guo, H.; Wang, J. One-step facile synthesis of graphene-decorated LiVPO4F/C nanocomposite as cathode for high-performance lithium ion battery. Ceram. Int. 2015, 41, 9188–9192. [Google Scholar] [CrossRef]
  21. Ellis, B.L.; Ramesh, T.N.; Rowanweetaluktuk, W.N.; Ryan, D.H.; Nazar, L.F. Solvothermal synthesis of electroactive lithium iron tavorites and structure of Li2FePO4F. J. Mater. Chem. 2012, 22, 4759–4766. [Google Scholar] [CrossRef]
  22. Recham, N.; Chotard, J.N.; Jumas, J.C.; Laffont, L.; Armand, M.; Tarascon, J.M. Ionothermal synthesis of Li-based fluorophosphates electrodes. Chem. Mater. 2010, 22, 1142–1148. [Google Scholar] [CrossRef]
  23. Ramesh, T.N.; Lee, K.T.; Ellis, B.L.; Nazar, L.F. Tavorite lithium iron fluorophosphate cathode materials: Phase transition and electrochemistry of LiFePO4F-Li2FePO4F. Electrochem. Solid-State Lett. 2010, 13, A43–A47. [Google Scholar] [CrossRef]
  24. Lee, E.; Persson, K.A. Solid-solution Li intercalation as a function of cation order/disorder in the high-voltage LixNi0.5Mn1.5O4 Spinel. Chem. Mater. 2013, 25, 2885–2889. [Google Scholar] [CrossRef]
  25. Huang, Z.-D.; Orikasa, Y.; Masese, T.; Yamamoto, K.; Mori, T.; Minato, T.; Uchimoto, Y. A novel cationic-ordering fluoro-polyanionic cathode LiV0.5Fe0.5PO4F and its single phase Li+ insertion/extraction behaviour. RSC Adv. 2013, 3, 22935–22939. [Google Scholar] [CrossRef]
  26. Fan, S.-H.; Shao, G.-Q.; Zhu, C.; Ma, F.-F.; Mao, J.-W.; Zhang, A.-L.; Xie, G.-Z.; Yan, J.-L.; Zhang, Y. Crystal structure and electrochemical properties of LiFe1−xVxPO4F1−δOδ cathode materials for lithium-ion batteries. Electrochim. Acta 2018, 280, 248–257. [Google Scholar] [CrossRef]
  27. Bamine, T.; Boivin, E.; Boucher, F.; Messinger, R.J.; Salager, E.; Deschamps, M.; Masquelier, C.; Croguennec, L.; Ménétrier, M.; Carlier, D. Understanding local defects in Li-ion battery electrodes through combined DFT/NMR studies: Application to LiVPO4F. J. Phys. Chem. C 2017, 121, 3219–3227. [Google Scholar] [CrossRef]
  28. Kim, M.; Lee, S.; Kang, B. High energy density polyanion electrode material: LiVPO4O1−xFx (x ≈ 0.25) with tavorite structure. Chem. Mater. 2017, 29, 4690–4699. [Google Scholar] [CrossRef]
  29. Boivin, E.; Chotard, J.N.; Ménétrier, M.; Bourgeois, L.; Bamine, T.; Carlier, D.; Fauth, F.; Masquelier, C.; Croguennec, L. Oxidation under air of tavorite LiVPO4F: Influence of vanadyl-type defects on its electrochemical properties. J. Phys. Chem. C 2016, 120, 26187–26198. [Google Scholar] [CrossRef]
  30. Onoda, M.; Ishibashi, T. Phase transition and spin dynamics of the LiVPO4F insertion electrode with the S = 1 linear chain and the development of F–O mixed system. J. Phys. Soc. Jpn. 2015, 84, 044802. [Google Scholar] [CrossRef]
  31. Ma, R.; Shao, L.; Wu, K.; Shui, M.; Wang, D.; Long, N.; Ren, Y.; Shu, J. Effects of oxidation on structure and performance of LiVPO4F as cathode material for lithium-ion batteries. J. Power Sources 2014, 248, 874–885. [Google Scholar] [CrossRef]
  32. Channu, V.S.R.; Thanedar, S. LiVxFeyPO4F nanostructure cathodes for lithium ion batteries. In Proceedings of the 230th ECS Meeting, Honolulu, HI, USA, 2–7 October 2016; Abstract MA2016–02, 402. The Electrochemical Society: Pennington, NJ, USA, 2016. [Google Scholar]
  33. Li, B. Preparation and Electrochemical Properties of LiVPO4F Cathode Material for Li-ion Batteries. Master’s Thesis, Wuhan University of Technology, Wuhan, China, 2012. [Google Scholar]
  34. Ahrens, L.H. The use of ionization potentials Part 1. Ionic radii of the elements. Geochim. Cosmochim. Acta 1952, 2, 155–169. [Google Scholar] [CrossRef]
  35. Shannon, R.D. Revised effective ionic radii and systematic studies of interatomic distances in halides and chaleogenides. Acta Cryst. 1976, A32, 751–767. [Google Scholar] [CrossRef]
  36. Ellis, B.L.; Ramesh, T.N.; Davis, L.J.M.; Goward, G.R.; Nazar, L.F. Structure and electrochemistry of two-electron redox couples in lithium metal fluorophosphates based on the tavorite structure. Chem. Mater. 2011, 23, 5138–5148. [Google Scholar] [CrossRef]
  37. Yang, Y.; Fang, H.; Zheng, J.; Li, L.; Li, G.; Yan, G. Towards the understanding of poor electrochemical activity of triclinic LiVOPO4: Experimental characterization and theoretical investigations. Solid State Sci. 2008, 10, 1292–1298. [Google Scholar] [CrossRef]
  38. Lavrov, A.V.; Nikolaev, V.P.; Sadikov, G.G.; Poraikoshits, M.A. Synthesis and crystal structure of mixed lithium vanadyl orthophosphate. Doklady Akademii Nauk SSSR 1982, 266, 343–346. [Google Scholar]
  39. Castro, L.; Dedryvère, R.; El Khalifi, M.; Lippens, P.E.; Bréger, J.; Tessier, C.; Gonbeau, D. The spin-polarized electronic structure of LiFePO4 and FePO4 evidenced by in-lab XPS. J. Phys. Chem. C 2010, 114, 17995–18000. [Google Scholar] [CrossRef]
  40. Yamashita, T.; Hayes, P. Analysis of XPS spectra of Fe2+ and Fe3+ ions in oxide materials. Appl. Surf. Sci. 2008, 254, 2441–2449. [Google Scholar] [CrossRef]
  41. Grosvenor, A.P.; Kobe, B.A.; Biesinger, M.C.; McIntyre, N.S. Investigation of multiplet splitting of Fe 2p XPS spectra and bonding in iron compounds. Surf. Interface Anal. 2004, 36, 1564–1574. [Google Scholar] [CrossRef]
  42. Dedryvère, R.; Maccario, M.; Croguennec, L.; Le Cras, F.; Delmas, C.; Gonbeau, D. X-ray photoelectron spectroscopy investigations of carbon-coated LixFePO4 materials. Chem. Mater. 2008, 20, 7164–7170. [Google Scholar] [CrossRef]
  43. Biesinger, M.C.; Lau, L.W.M.; Gerson, A.R.; Smart, R.S.C. Resolving surface chemical states in XPS analysis of first row transition metals, oxides and hydroxides: Sc, Ti, V., Cu and Zn. Appl. Surf. Sci. 2010, 257, 887–898. [Google Scholar] [CrossRef]
  44. Zhang, B.; Han, Y.-D.; Zheng, J.-C.; Shen, C.; Ming, L.; Zhang, J.-F. A novel lithium vanadium fluorophosphate nanosheet with uniform carbon coating as a cathode material for lithium-ion batteries. J. Power Sources 2014, 264, 123–127. [Google Scholar] [CrossRef]
  45. Zheng, J.-C.; Zhang, B.; Yang, Z.-H. Novel synthesis of LiVPO4F cathode material by chemical lithiation and postannealing. J. Power Sources 2012, 202, 380–383. [Google Scholar] [CrossRef]
  46. Reddy, M.V.; Rao, G.V.S.; Chowdari, B.V.R. Long-term cycling studies on 4V-cathode, lithium vanadium fluorophosphate. J. Power Sources 2010, 195, 5768–5774. [Google Scholar] [CrossRef]
  47. Barker, J.; Gover, R.K.B.; Burns, P.; Bryan, A.; Saidi, M.Y.; Swoyer, J.L. Structural and electrochemical properties of lithium vanadium fluorophosphate, LiVPO4F. J. Power Sources 2005, 146, 516–520. [Google Scholar] [CrossRef]
  48. Barker, J.; Saidi, M.Y.; Swoyer, J.L. A comparative investigation of the Li insertion properties of the novel fluorophosphate phases, NaVPO4F and LiVPO4F. J. Electrochem. Soc. 2004, 151, A1670–A1677. [Google Scholar] [CrossRef]
  49. Yang, C.-Y.; Ji, X.; Fan, X.-L.; Gao, T.; Suo, L.-M.; Wang, F.; Sun, W.; Chen, J.; Chen, L.; Han, F.-D.; et al. Flexible aqueous Li-ion battery with high energy and power densities. Adv. Mater. 2017, 29, 1701972. [Google Scholar] [CrossRef] [PubMed]
  50. Wu, B.; Yang, X.; Jiang, X.; Zhang, Y.; Wang, X. Synchronous tailoring surface structure and chemical composition of Li-rich-layered oxide for high-energy lithium-ion batteries. Adv. Funct. Mater. 2018, 28, 1803392. [Google Scholar] [CrossRef]
  51. Ellis, B.L.; Nazar, L.F. Anion-induced solid solution electrochemical behavior in iron tavorite phosphates. Chem. Mater. 2012, 24, 966–968. [Google Scholar] [CrossRef]
  52. Weppner, W.; Huggins, R.A. Electrochemical investigation of the chemical diffusion, partial ionic conductivities, and other kinetic parameters in Li3Sb and Li3Bi. J. Solid State Chem. 1977, 22, 297–308. [Google Scholar] [CrossRef]
  53. Xiao, P.-F.; Lai, M.-O.; Lu, L. Transport and electrochemical properties of high potential tavorite LiVPO4F. Solid State Ion. 2013, 242, 10–19. [Google Scholar] [CrossRef]
  54. Prosini, P.P.; Lisi, M.; Zane, D.; Pasquali, M. Determination of the chemical diffusion coefficient of lithium in LiFePO4. Solid State Ion. 2002, 148, 45–51. [Google Scholar] [CrossRef]
  55. Tang, K.; Yu, X.; Sun, J.; Li, H.; Huang, X. Kinetic analysis on LiFePO4 thin films by CV, GITT, and EIS. Electrochim. Acta 2011, 56, 4869–4875. [Google Scholar] [CrossRef]
  56. Muraliganth, T.; Manthiram, A. Understanding the shifts in the redox potentials of olivine LiM1−yMyPO4 (M = Fe, Mn, Co, and Mg) solid solution cathodes. J. Phys. Chem. C 2010, 114, 15530–15540. [Google Scholar] [CrossRef]
  57. Kobayashi, G.; Yamada, A.; Nishimura, S.I.; Kanno, R.; Kobayashi, Y.; Seki, S.; Ohno, Y.; Miyashiro, H. Shift of redox potential and kinetics in Lix(MnyFe1−y)PO4. J. Power Sources 2009, 189, 397–401. [Google Scholar] [CrossRef]
  58. Yamada, A.; Takei, Y.; Koizumi, H.; Sonoyama, N.; Kanno, R.; Itoh, K.; Yonemura, M.; Kamiyama, T. Electrochemical, magnetic, and structural investigation of the Lix(MnyFe1−y)PO4 olivine phases. Chem. Mater. 2006, 18, 804–813. [Google Scholar] [CrossRef]
  59. Melot, B.C.; Tarascon, J.M. Design and preparation of materials for advanced electrochemical storage. Acc. Chem. Res. 2013, 46, 1226–1238. [Google Scholar] [CrossRef] [PubMed]
  60. Girish, H.N.; Shao, G.-Q. Advances in high-capacity Li2MSiO4 (M = Mn, Fe, Co, Ni, …) cathode materials for lithium-ion batteries. RSC Adv. 2015, 5, 98666–98686. [Google Scholar] [CrossRef]
  61. Larson, A.C.; Von Dreele, R.B.; General Structure Analysis System (GSAS). Report LAUR 86–748; Los Alamos National Laboratory: Los Alamos, NM, USA, 2004; pp. 86–748.
Sample Availability: Samples of the compounds VPO4, LiFe1−xVxPO4F (x = 0, 0.3, 1) are available from the authors.
Figure 1. XRD full patterns of LiFe1−xVxPO4F (0 ≤ x ≤ 1) powders.
Molecules 24 01893 g001
Figure 2. SEM images of FePO4 (a), VPO4 (b), LiFe0.5V0.5PO4F (c) and LiVPO4F (d), and the EDS mapping of LiFe0.5V0.5PO4F (e) from the inset in Figure 2c.
Molecules 24 01893 g002
Figure 3. X-ray photoelectron spectra (XPS) of FePO4, VPO4 and LiFe1−xVxPO4F (0 ≤ x ≤ 1) powders (a). Binding energy regions of the Fe 2p (b) and V 2p (c) show spin-orbit splitting of 2p3/2 and 2p1/2, respectively.
Molecules 24 01893 g003
Figure 4. Cyclic voltammetry (CV) curves of LiFe1−xVxPO4F (x = 0, 0.1, 0.3, 0.5, 0.7, 0.9, 1) cells with the same sweep rate of 0.1 mV s−1 for five cycles in the range of 2.0–4.5 V (a), 2.0–3.6 V (b) and 3.0–4.5 V (c). With the exception of the starting half cycle, all of peak positions are from the second cycle.
Molecules 24 01893 g004
Figure 5. CV curves of LiFe0.5V0.5PO4F and LiFe0.3V0.7PO4F cells with different sweep rates of 0.1/0.2/0.3/0.4/0.5 mV s−1 for 15 cycles in the range of 2.0–3.6 V (a) and 3.0–4.5 V (b).
Molecules 24 01893 g005
Figure 6. Total reactions in LiFe1−xVxPO4F (0 ≤ x ≤ 1) cells.
Molecules 24 01893 g006
Figure 7. The initial and second charge/discharge profiles of LiFe1−xVxPO4F (x = 0, 0.1, 0.3, 0.5, 0.7, 0.9, 1) cells at 0.1 C.
Molecules 24 01893 g007
Figure 8. The independent (a) and overlaid (b) curves of voltage as a function of Li+-extraction content y under load and rest by galvanostatic intermittent titration technique (GITT) measurements in Li 2 x y Fe 1 x II V x III PO 4 F (0 ≤ x ≤ 1; 0 ≤ y ≤ 1).
Molecules 24 01893 g008
Figure 9. Plots of diffusion coefficients obtained by GITT as a function of Li+-extraction content y in Li 2 x y Fe 1 x II V x III PO 4 F (0 ≤ y ≤ 1) with x = 0 (a), x = 0.5 (b), x = 0.7 (c) and x = 1 (d).
Molecules 24 01893 g009
Figure 10. Shifts in midpoints of anodic (Li+-extraction) and cathodic (Li+-insertion) peaks for Fe2+/3+ and V3+/4+ couples, exported from Figure 4, as a function of V-content x in LiFe1−xVxPO4F (0 ≤ x ≤ 1).
Molecules 24 01893 g010

