Influence of Bovine Serum Albumin-Flavonoid Interaction on the Antioxidant Activity of Dietary Flavonoids: New Evidence from Electrochemical Quantification


Abstract
1. Introduction
2. Results and Discussion
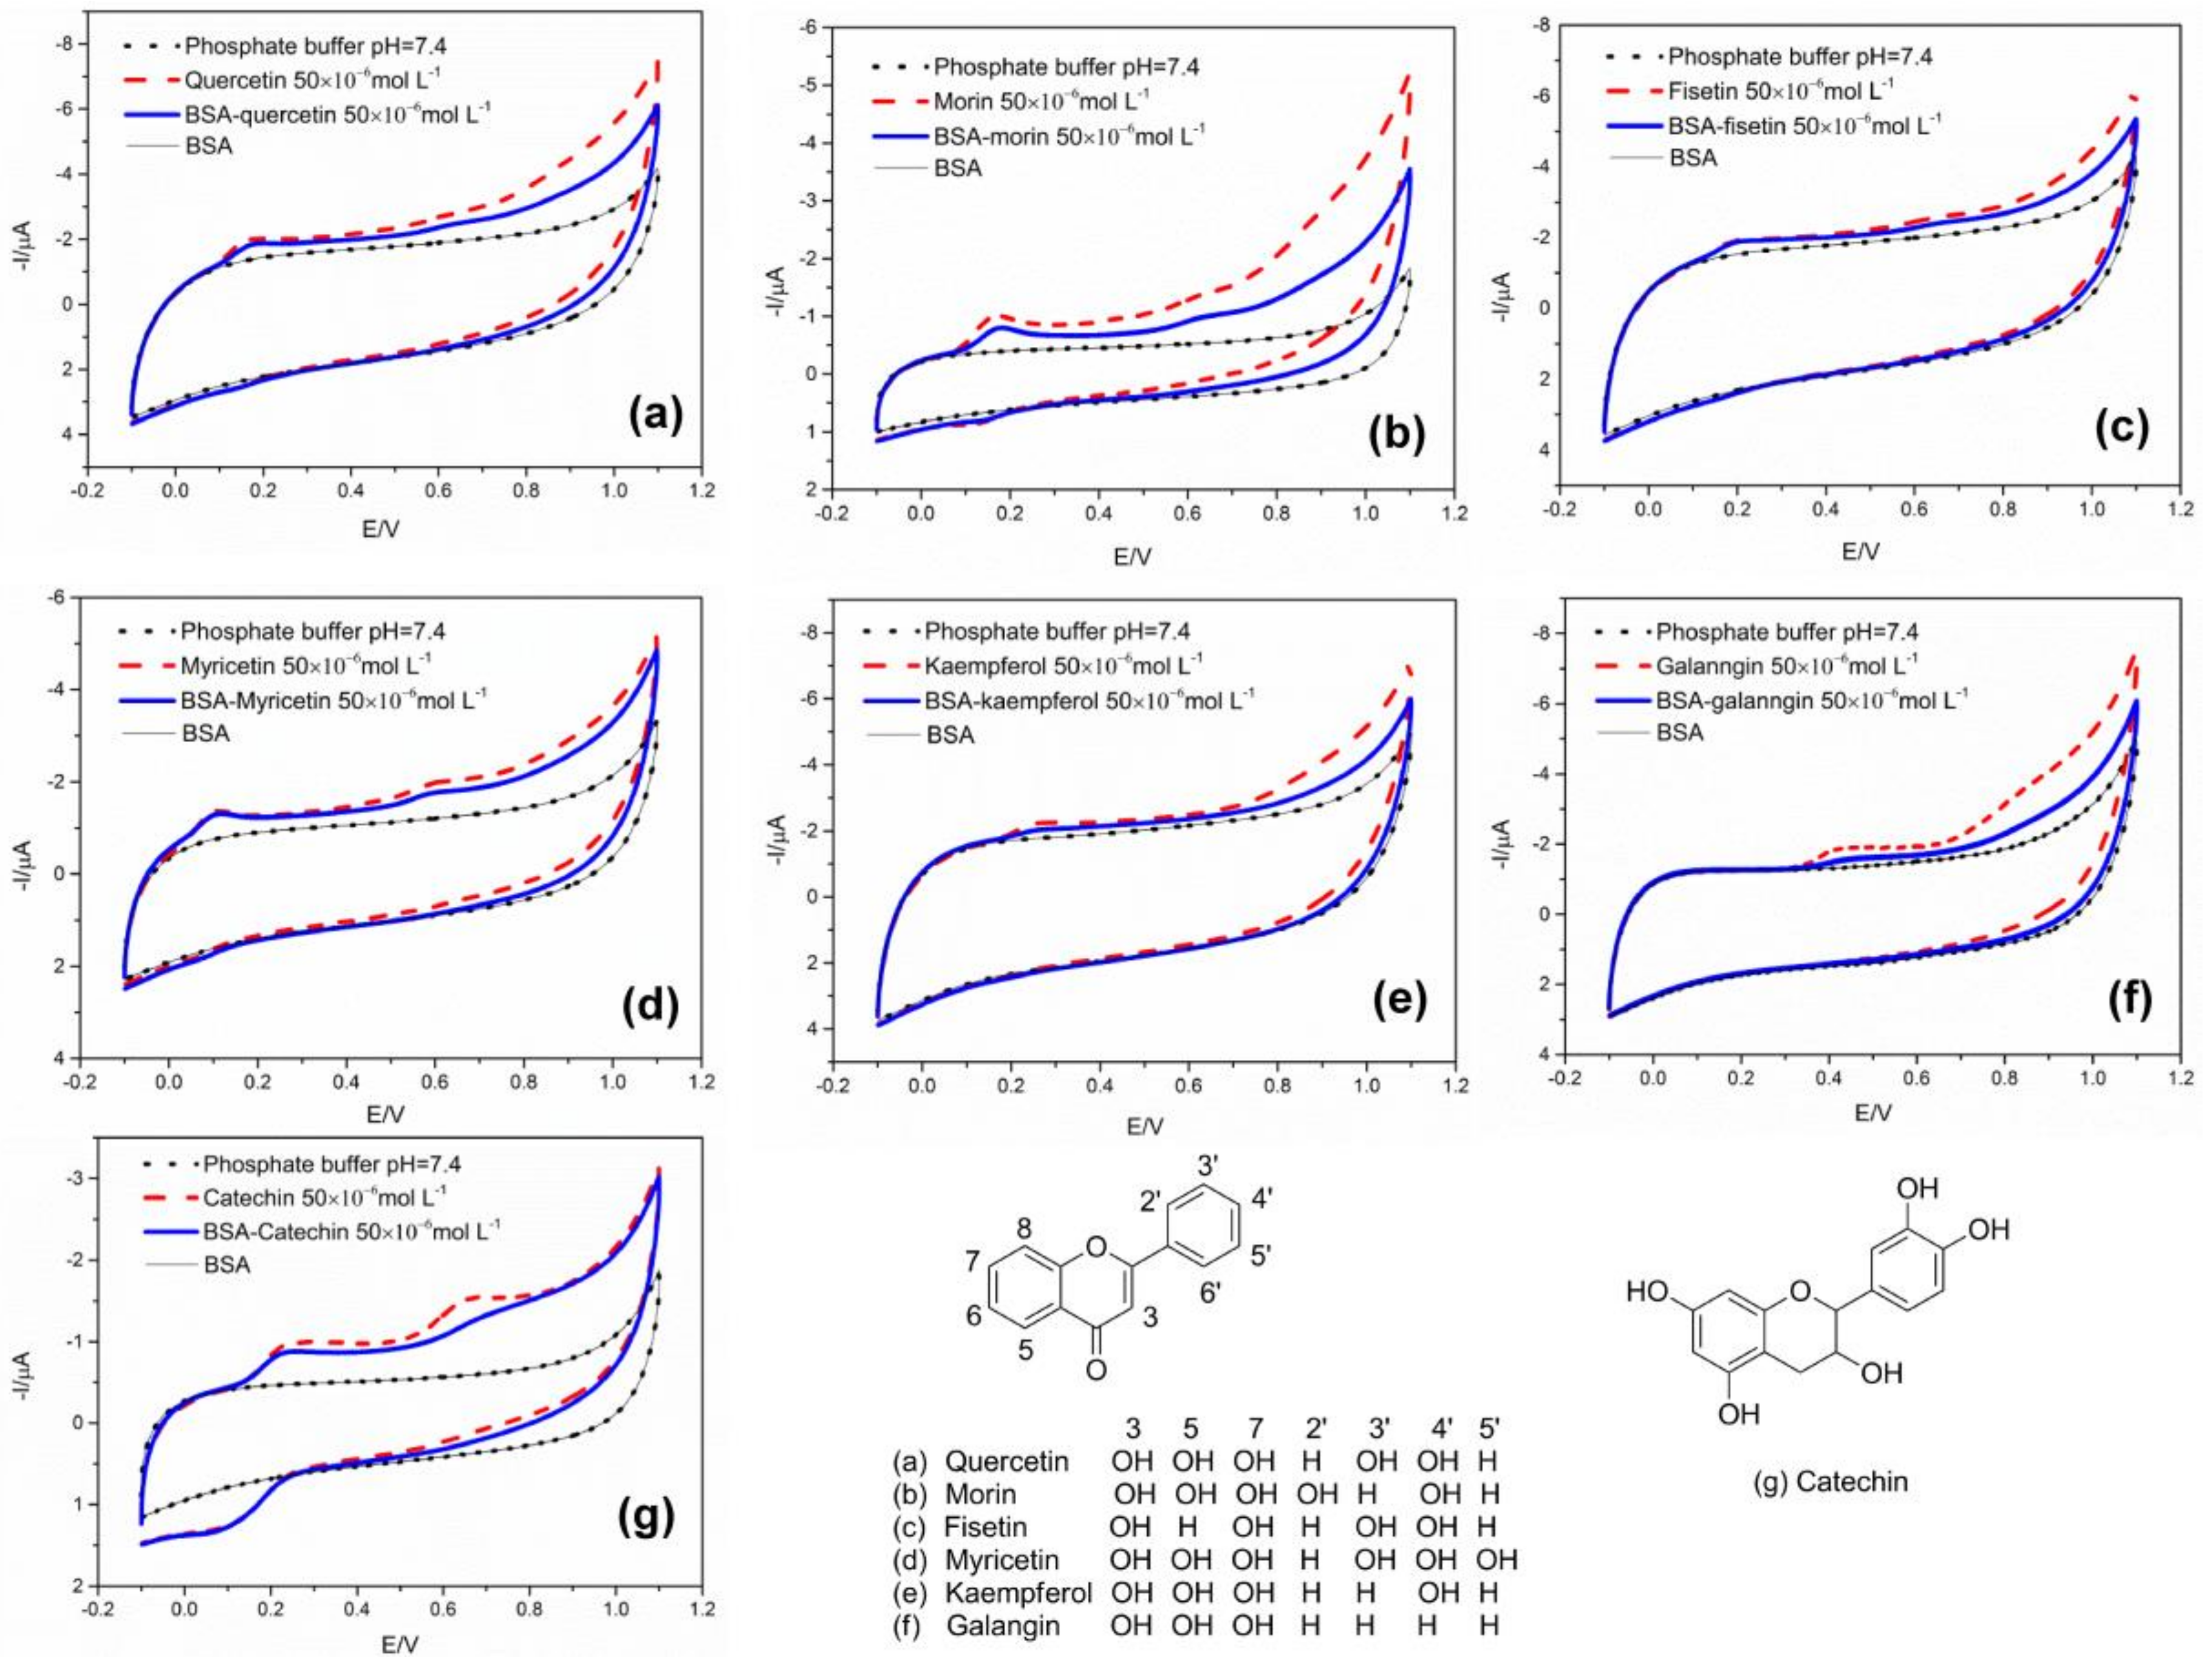
2.1. CV Assay
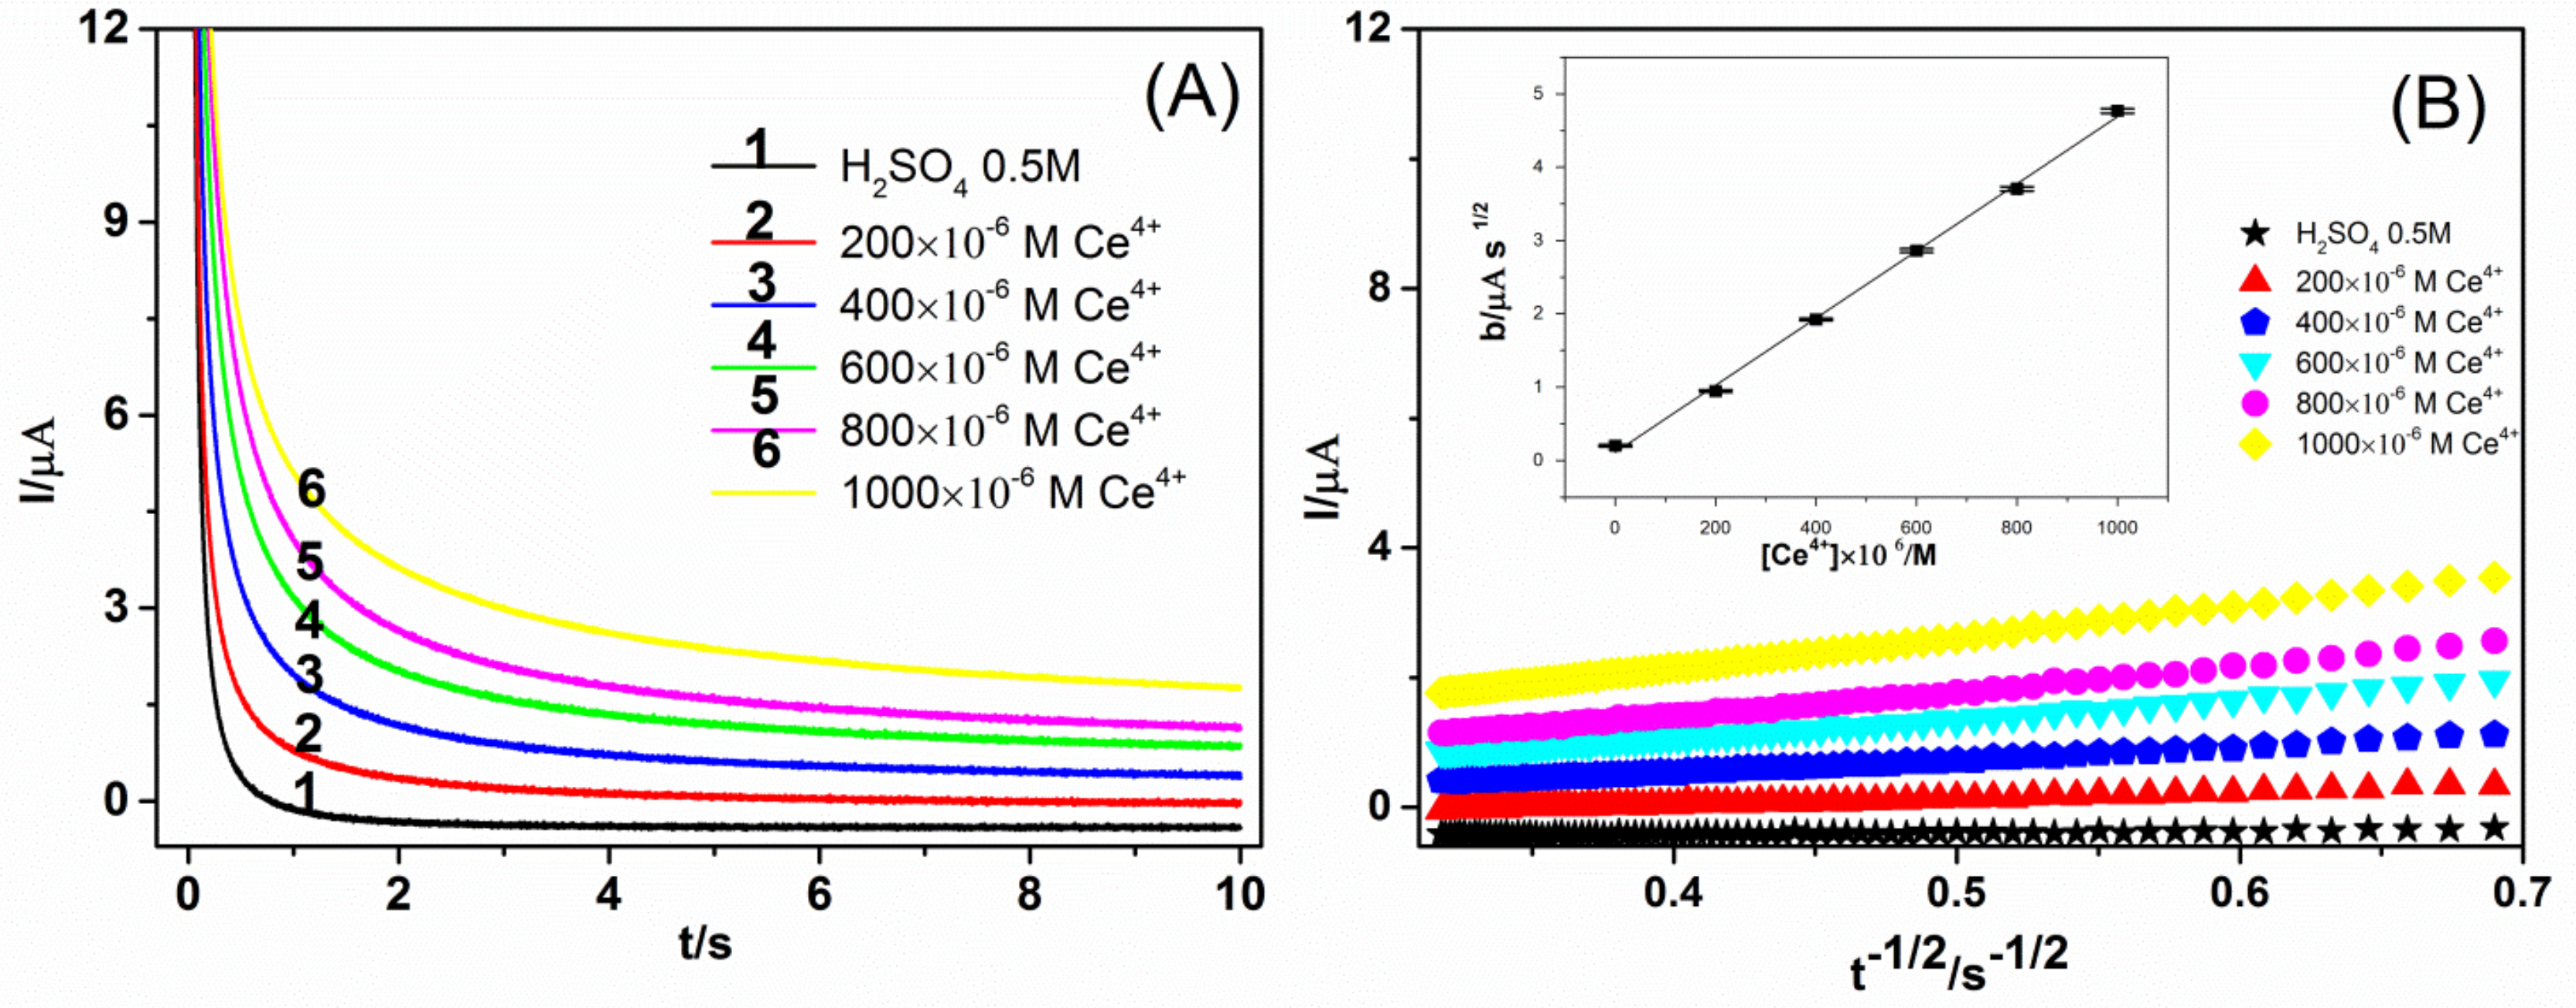
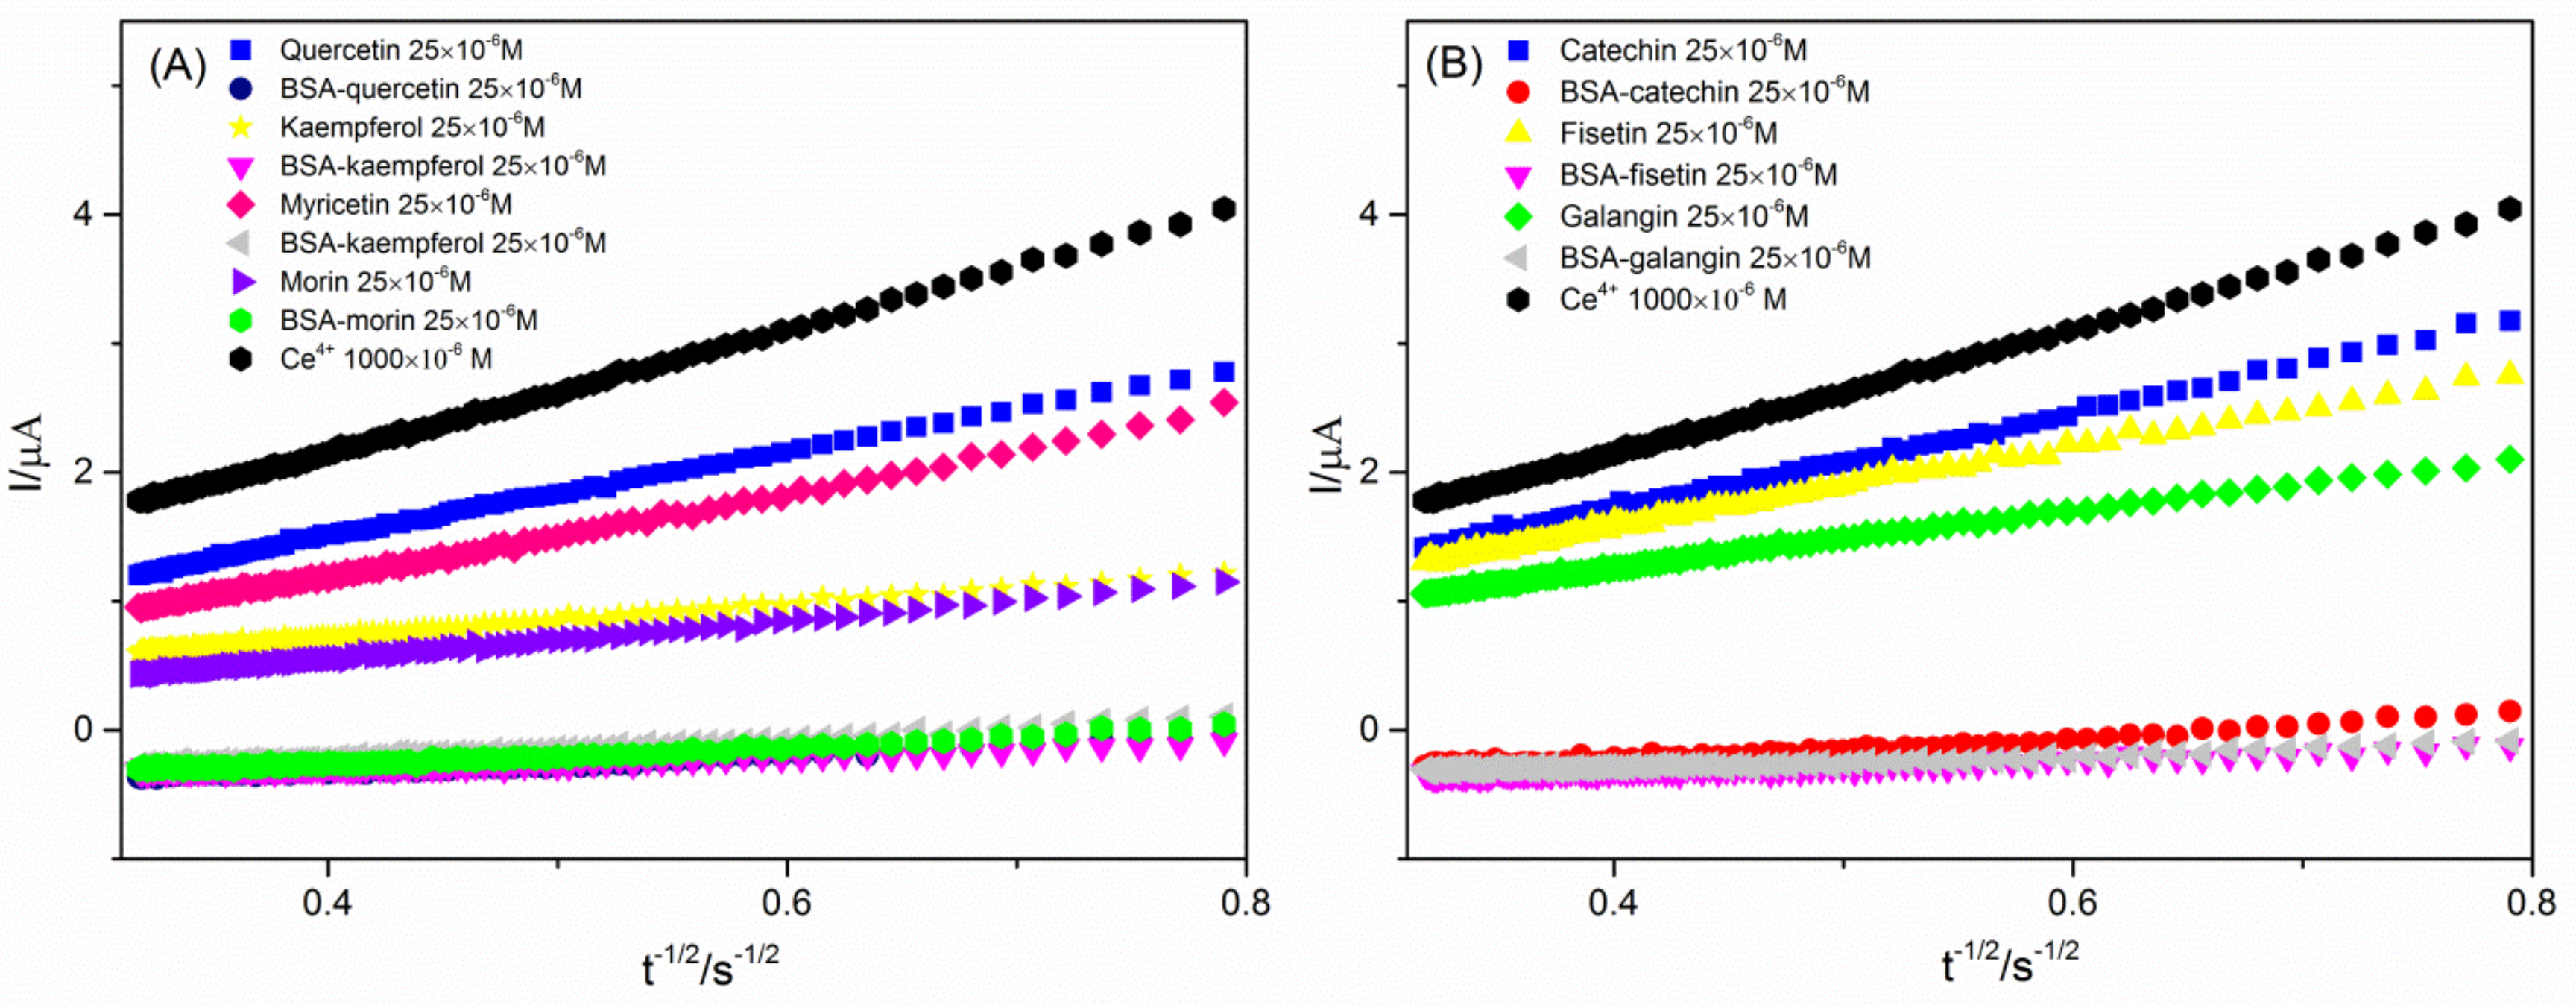
2.2. CRAC Assay
2.3. Comparison of CRAC Assay and Spectrophotometric Assay
3. Materials and Methods
3.1. Chemicals and Reagents
3.2. Apparatus
3.3. Spectrophotometric Assays
3.4. Electrochemical Assays
4. Conclusions
Author Contributions
Acknowledgments
Conflicts of Interest
References
- Han, R.-M.; Zhang, J.-P.; Skibsted, L.H. Reaction Dynamics of Flavonoids and Carotenoids as Antioxidants. Molecules 2012, 17, 2140–2160. [Google Scholar] [CrossRef] [PubMed]
- Xiao, J. Dietary flavonoid aglycones and their glycosides: Which show better biological significance? Crit. Rev. Food Sci. Nutr. 2017, 57, 1874–1905. [Google Scholar] [CrossRef] [PubMed]
- Chen, L.; Teng, H.; Xie, Z.; Cao, H.; Cheang, W.S.; Skalicka-Woniak, K.; Georgiev, M.I.; Xiao, J. Modifications of dietary flavonoids towards improved bioactivity: An update on structure–activity relationship. Crit. Rev. Food Sci. Nutr. 2018, 58, 513–527. [Google Scholar] [CrossRef] [PubMed]
- Xiao, J.B.; Huo, J.L.; Yang, F.; Chen, X.Q. Noncovalent Interaction of Dietary Polyphenols with Bovine Hemoglobin in Vitro: Molecular Structure/Property–Affinity Relationship Aspects. J. Agric. Food Chem. 2011, 59, 8484–8490. [Google Scholar] [CrossRef] [PubMed]
- Zhang, Y.; Shi, S.; Chen, X.; Zhang, W.; Huang, K.; Peng, M. Investigation on the Interaction between Ilaprazole and Bovine Serum Albumin without or with Different C-Ring Flavonoids from the Viewpoint of Food–Drug Interference. J. Agric. Food Chem. 2011, 59, 8499–8506. [Google Scholar] [CrossRef] [PubMed]
- Xiao, J.; Suzuki, M.; Jiang, X.; Chen, X.; Yamamoto, K.; Ren, F.; Xu, M. Influence of B-Ring Hydroxylation on Interactions of Flavonols with Bovine Serum Albumin. J. Agric. Food Chem. 2008, 56, 2350–2356. [Google Scholar] [CrossRef] [PubMed]
- Xiao, J.; Kai, G. A Review of Dietary Polyphenol-Plasma Protein Interactions: Characterization, Influence on the Bioactivity, and Structure-Affinity Relationship. Crit. Rev. Food Sci. Nutr. 2012, 52, 85–101. [Google Scholar] [CrossRef]
- Tang, X.; Tang, P.; Liu, L. Molecular Structure–Affinity Relationship of Flavonoids in Lotus Leaf (Nelumbo nucifera Gaertn.) on Binding to Human Serum Albumin and Bovine Serum Albumin by Spectroscopic Method. Molecules 2017, 22, 1036. [Google Scholar] [CrossRef]
- Tang, F.; Xie, Y.; Cao, H.; Yang, H.; Chen, X.; Xiao, J. Fetal bovine serum influences the stability and bioactivity of resveratrol analogues: A polyphenol-protein interaction approach. Food Chem. 2017, 219, 321–328. [Google Scholar] [CrossRef]
- Liu, E.H.; Qi, L.-W.; Li, P. Structural Relationship and Binding Mechanisms of Five Flavonoids with Bovine Serum Albumin. Molecules 2010, 15, 9092–9103. [Google Scholar] [CrossRef]
- Arts, M.J.; Haenen, G.R.; Voss, H.P.; Bast, A. Masking of antioxidant capacity by the interaction of flavonoids with protein. Food Chem. Toxicol. 2001, 39, 787–791. [Google Scholar] [CrossRef]
- Cao, H.; Xie, Y.; Chen, X. Type 2 diabetes diminishes the benefits of dietary antioxidants: Evidence from the different free radical scavenging potential. Food Chem. 2015, 186, 106–112. [Google Scholar] [CrossRef] [PubMed]
- Zou, D.; Xie, A. Influence of polyphenol-plasma protein interaction on the antioxidant properties of polyphenols. Curr. Drug Metab. 2013, 14, 451–455. [Google Scholar] [CrossRef] [PubMed]
- Apak, R.; Özyürek, M.; Güçlü, K.; Çapanoğlu, E. Antioxidant Activity/Capacity Measurement. 1. Classification, Physicochemical Principles, Mechanisms, and Electron Transfer (ET)-Based Assays. J. Agric. Food. Chem. 2016, 64, 997–1027. [Google Scholar] [CrossRef] [PubMed]
- Apak, R.; Özyürek, M.; Güçlü, K.; Çapanoğlu, E. Antioxidant Activity/Capacity Measurement. 3. Reactive Oxygen and Nitrogen Species (ROS/RNS) Scavenging Assays, Oxidative Stress Biomarkers, and Chromatographic/Chemometric Assays. J. Agric. Food. Chem. 2016, 64, 1046–1070. [Google Scholar] [CrossRef] [PubMed]
- Hoyos-Arbeláez, J.; Vázquez, M.; Contreras-Calderón, J. Electrochemical methods as a tool for determining the antioxidant capacity of food and beverages: A review. Food Chem. 2017, 221, 1371–1381. [Google Scholar] [CrossRef]
- Ferreira, R.D.Q.; Avaca, L.A. Electrochemical Determination of the Antioxidant Capacity: The Ceric Reducing/Antioxidant Capacity (CRAC) Assay. Electroanalysis 2008, 20, 1323–1329. [Google Scholar] [CrossRef]
- Porfírio, D.A.; Ferreira, R.D.Q.; Malagutti, A.R.; Valle, E.M.A. Electrochemical study of the increased antioxidant capacity of flavonoids through complexation with iron(II) ions. Electrochim. Acta 2014, 141, 33–38. [Google Scholar] [CrossRef]
- Ferreira, R.D.Q.; Greco, S.J.; Delarmelina, M.; Weber, K.C. Electrochemical quantification of the structure/antioxidant activity relationship of flavonoids. Electrochim. Acta 2015, 163, 161–166. [Google Scholar] [CrossRef]
- Abou Samra, M.; Chedea, V.S.; Economou, A.; Calokerinos, A.; Kefalas, P. Antioxidant/prooxidant properties of model phenolic compounds: Part I. Studies on equimolar mixtures by chemiluminescence and cyclic voltammetry. Food Chem. 2011, 125, 622–629. [Google Scholar] [CrossRef]
- Firuzi, O.; Lacanna, A.; Petrucci, R.; Marrosu, G.; Saso, L. Evaluation of the antioxidant activity of flavonoids by “ferric reducing antioxidant power” assay and cyclic voltammetry. Biochim. Biophys. Acta Gen. Subj. 2005, 1721, 174–184. [Google Scholar] [CrossRef] [PubMed]
- He, J.-B.; Yuan, S.-J.; Du, J.-Q.; Hu, X.-R.; Wang, Y. Voltammetric and spectral characterization of two flavonols for assay-dependent antioxidant capacity. Bioelectrochemistry 2009, 75, 110–116. [Google Scholar] [CrossRef] [PubMed]
- Cao, H.; Shi, Y.; Chen, X. Advances on the Interaction between Tea Catechins and Plasma Proteins: Structure- Affinity Relationship, Influence on Antioxidant Activity, and Molecular Docking Aspects. Curr. Drug Metab. 2013, 14, 446–450. [Google Scholar] [CrossRef]
- Zhang, Q.; Zhang, J.; Shen, J.; Silva, A.; Dennis, D.A.; Barrow, C.J. A Simple 96-Well Microplate Method for Estimation of Total Polyphenol Content in Seaweeds. J. Appl. Phycol. 2006, 18, 445–450. [Google Scholar] [CrossRef]
- Ling, L.T.; Palanisamy, U.D.; Cheng, H.M. Prooxidant/Antioxidant Ratio (ProAntidex) as a Better Index of Net Free Radical Scavenging Potential. Molecules 2010, 15, 7884–7892. [Google Scholar] [CrossRef] [PubMed]
Sample Availability: Samples are not available. |


| Antioxidant | b (μA s1/2) | CRACvalue × 106 ([Ce3+]/mol L−1) | TE |
|---|---|---|---|
| Quercetin | 3.34 ± 0.11 | 294.76 ± 24.02 | 2.01 |
| BSA-quercetin | 0.65 ± 0.08 | 126.54 ± 17.47 | 0.86 |
| Morin | 1.49 ± 0.18 | 698.69 ± 39.30 | 4.78 |
| BSA-morin | 0.66 ± 0.08 | 124.35 ± 17.47 | 0.85 |
| Fisetin | 3.11 ± 0.38 | 344.98 ± 83.00 | 2.36 |
| BSA-fisetin | 0.43 ± 0.06 | 174.57 ± 13.10 | 1.19 |
| Myricetin | 3.19 ± 0.09 | 327.51 ± 19.65 | 2.24 |
| BSA-myricetin | 0.78 ± 0.10 | 98.15 ± 22.49 | 0.67 |
| Kaempferol | 1.28 ± 0.16 | 744.51 ± 34.93 | 5.09 |
| BSA-kaempferol | 0.41 ± 0.05 | 178.94 ± 10.91 | 1.22 |
| Galangin | 2.23 ± 0.27 | 537.12 ± 58.95 | 3.67 |
| BSA-galangin | 0.43 ± 0.05 | 174.57 ± 22.49 | 1.19 |
| Catechin | 3.47 ± 0.05 | 266.38 ± 10.92 | 1.82 |
| BSA-catechin | 0.83 ± 0.10 | 88.23 ± 10.92 | 0.60 |
| Trolox | 4.02 ± 0.05 | 146.29 ± 10.91 | 1.00 |
| DPPH IC50 (μmol L−1) | TEDPPH | FRAP Value (μmol L−1 FeSO4·7H2O) | TEFRAP | |
|---|---|---|---|---|
| Quercetin | 9.61 ± 0.86 | 4.58 | 131.24 ± 4.50 | 1.20 |
| BSA-quercetin | 9.16 ± 0.46 | 4.81 | 123.57 ± 10.43 | 1.13 |
| Morin | 128.04 ± 5.37 | 1.17 | ||
| BSA-morin | 152.74 ± 8.74 | 1.39 | ||
| Fisetin | 10.33 ± 0.52 | 4.26 | 130.01 ± 3.13 | 1.19 |
| BSA-fisetin | 9.26 ± 0.44 | 4.75 | 121.45 ± 26.36 | 1.11 |
| Myricetin | 10.48 ± 0.44 | 4.20 | 123.60 ± 4.73 | 1.13 |
| BSA-myricetin | 12.45 ± 0.55 | 3.54 | 127.58 ± 4.85 | 1.16 |
| Kaempferol | 33.54 ± 8.79 | 1.31 | 90.77 ± 3.43 | 0.82 |
| BSA-kaempferol | 40.77 ± 2.20 | 1.08 | 119.71 ± 8.32 | 1.09 |
| Galangin | 39.64 ± 3.26 | 0.36 | ||
| BSA-galangin | 53.87 ± 10.25 | 0.49 | ||
| Catechin | 29.30 ± 6.34 | 1.50 | 91.98 ± 3.00 | 0.84 |
| BSA-catechin | 12.50 ± 0.44 | 3.52 | 122.31 ± 5.86 | 1.12 |
| Trolox | 44.02 ± 3.63 | 1.00 | 109.61 ± 2.91 | 1 |
| ΔT%CRAC | ΔT%DPPH | ΔT%FRAP | |
|---|---|---|---|
| Quercetin | −57.2 | 5.0 | −5.8 |
| Morin | −82.2 | - | 18.8 |
| Fisetin | −52.5 | 11.5 | −6.7 |
| Myricetin | −70.1 | −15.7 | 2.7 |
| Kaempferol | −76.0 | −17.6 | 32.9 |
| Galangin | −67.6 | - | 36.1 |
| Catechin | −67.0 | 134.7 | 33.3 |
© 2018 by the authors. Licensee MDPI, Basel, Switzerland. This article is an open access article distributed under the terms and conditions of the Creative Commons Attribution (CC BY) license (http://creativecommons.org/licenses/by/4.0/).
Share and Cite
Geng, R.; Ma, L.; Liu, L.; Xie, Y. Influence of Bovine Serum Albumin-Flavonoid Interaction on the Antioxidant Activity of Dietary Flavonoids: New Evidence from Electrochemical Quantification. Molecules 2019, 24, 70. https://doi.org/10.3390/molecules24010070
Geng R, Ma L, Liu L, Xie Y. Influence of Bovine Serum Albumin-Flavonoid Interaction on the Antioxidant Activity of Dietary Flavonoids: New Evidence from Electrochemical Quantification. Molecules. 2019; 24(1):70. https://doi.org/10.3390/molecules24010070
Chicago/Turabian StyleGeng, Rui, Lei Ma, Liangliang Liu, and Yixi Xie. 2019. "Influence of Bovine Serum Albumin-Flavonoid Interaction on the Antioxidant Activity of Dietary Flavonoids: New Evidence from Electrochemical Quantification" Molecules 24, no. 1: 70. https://doi.org/10.3390/molecules24010070
APA StyleGeng, R., Ma, L., Liu, L., & Xie, Y. (2019). Influence of Bovine Serum Albumin-Flavonoid Interaction on the Antioxidant Activity of Dietary Flavonoids: New Evidence from Electrochemical Quantification. Molecules, 24(1), 70. https://doi.org/10.3390/molecules24010070