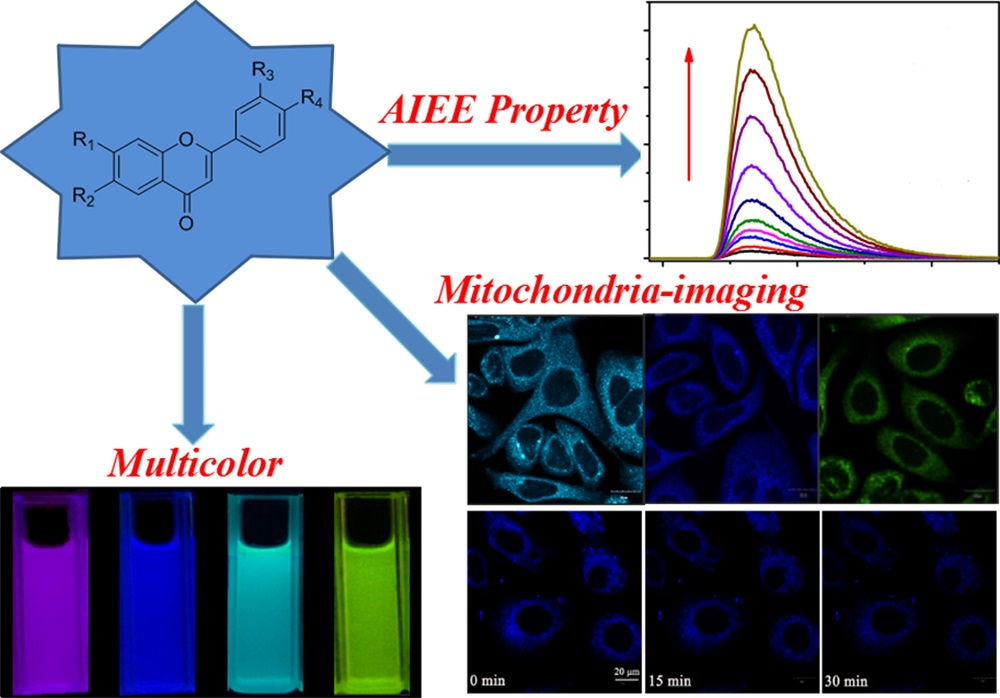
Rational Design for Multicolor Flavone-Based Fluorophores with Aggregation-Induced Emission Enhancement Characteristics and Applications in Mitochondria-Imaging


Abstract

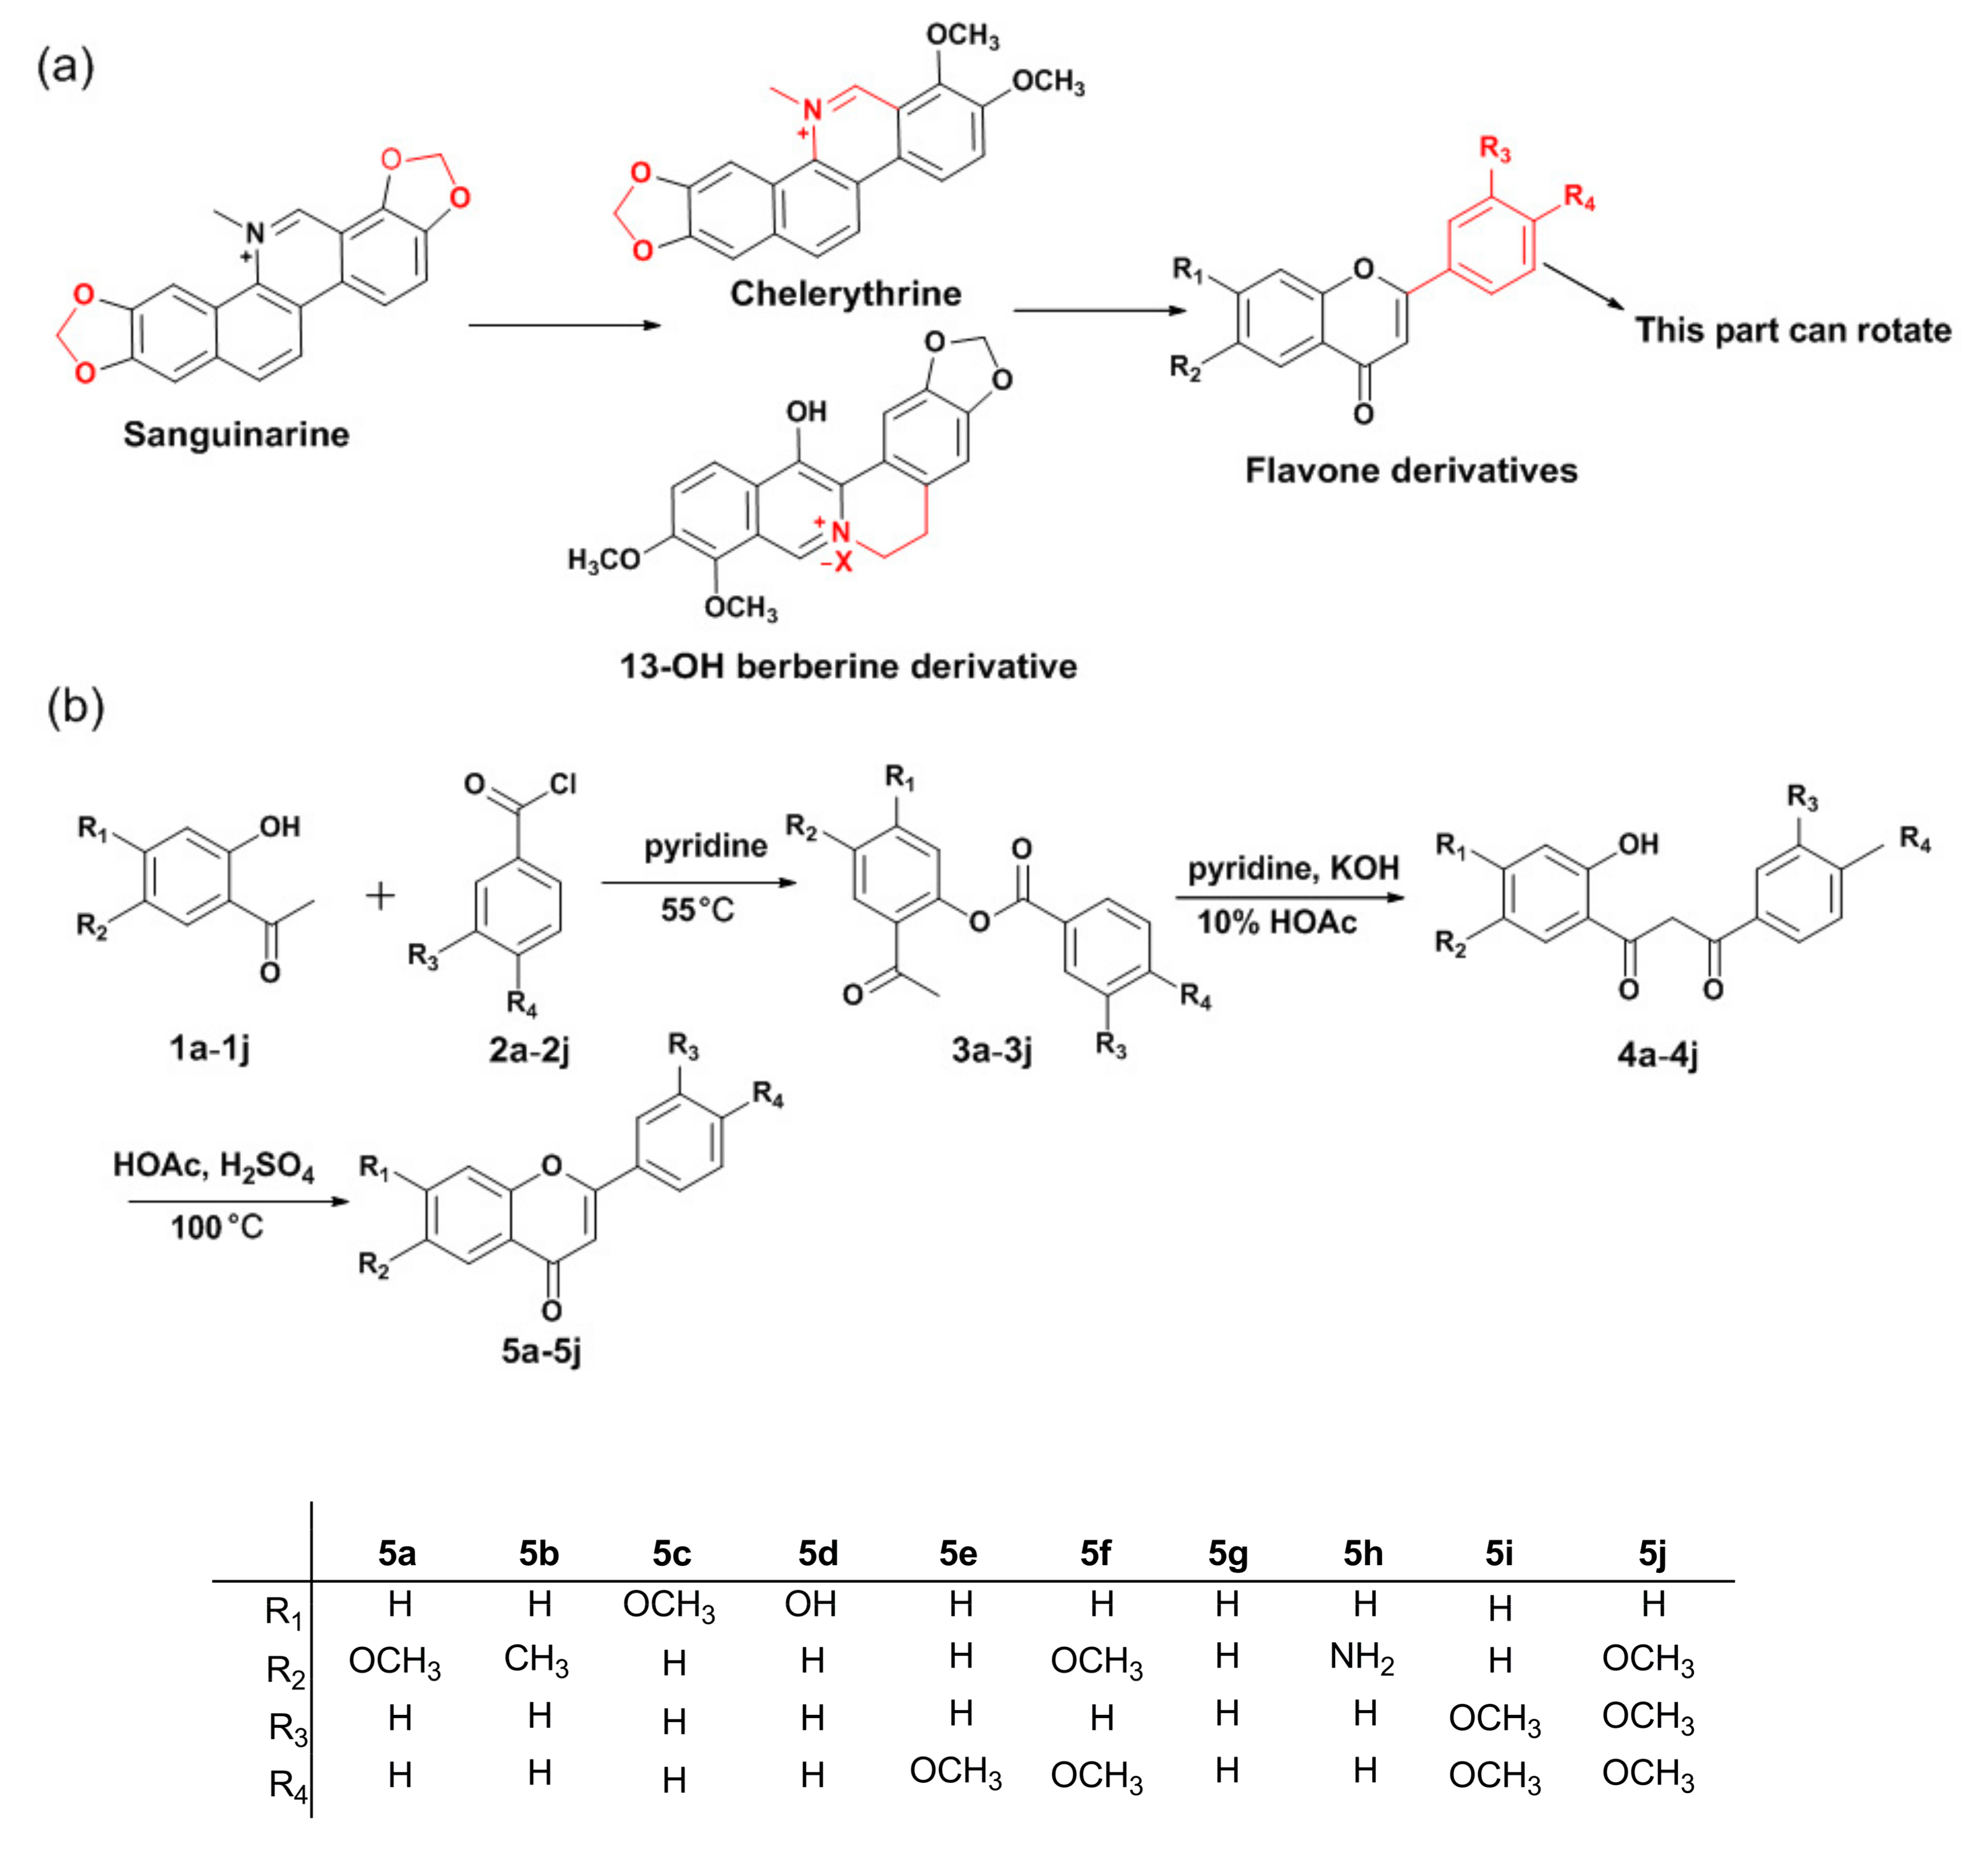
1. Introduction
2. Results and Discussion
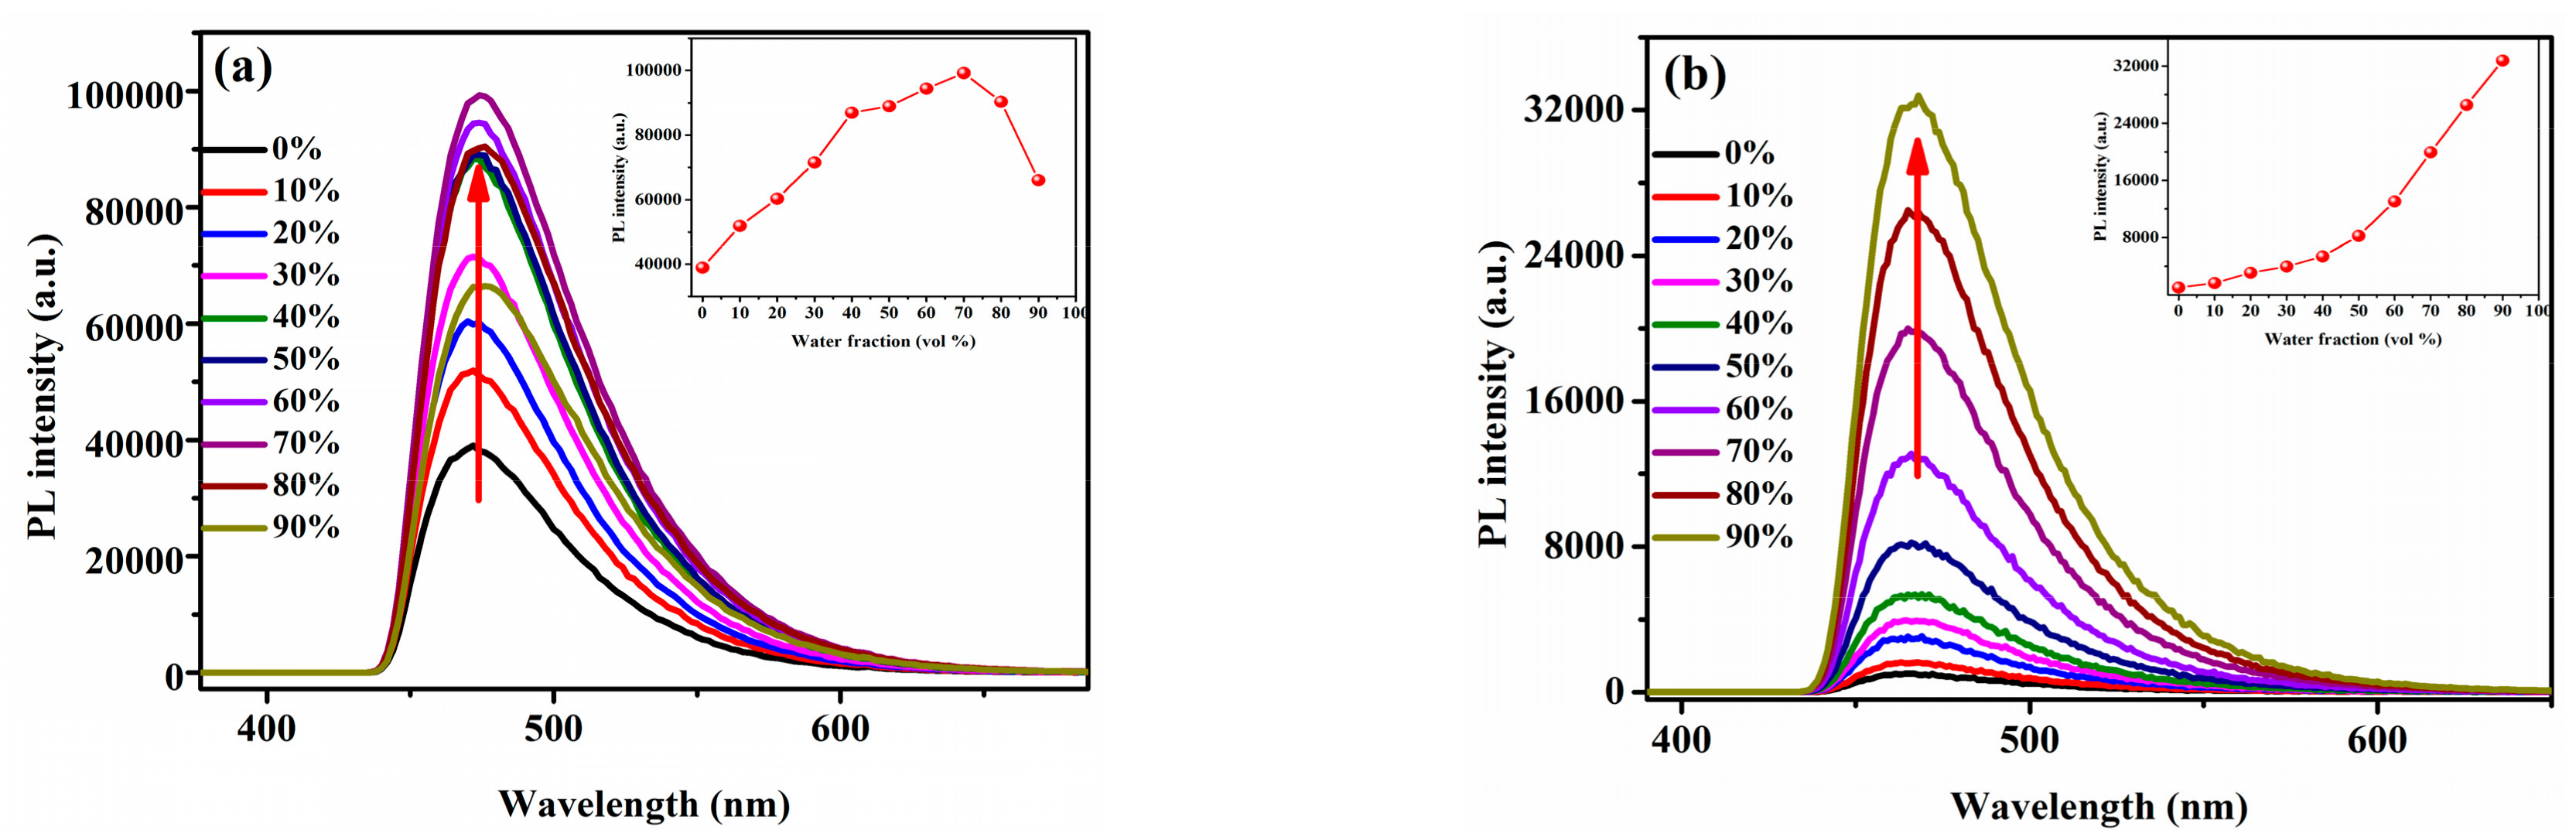
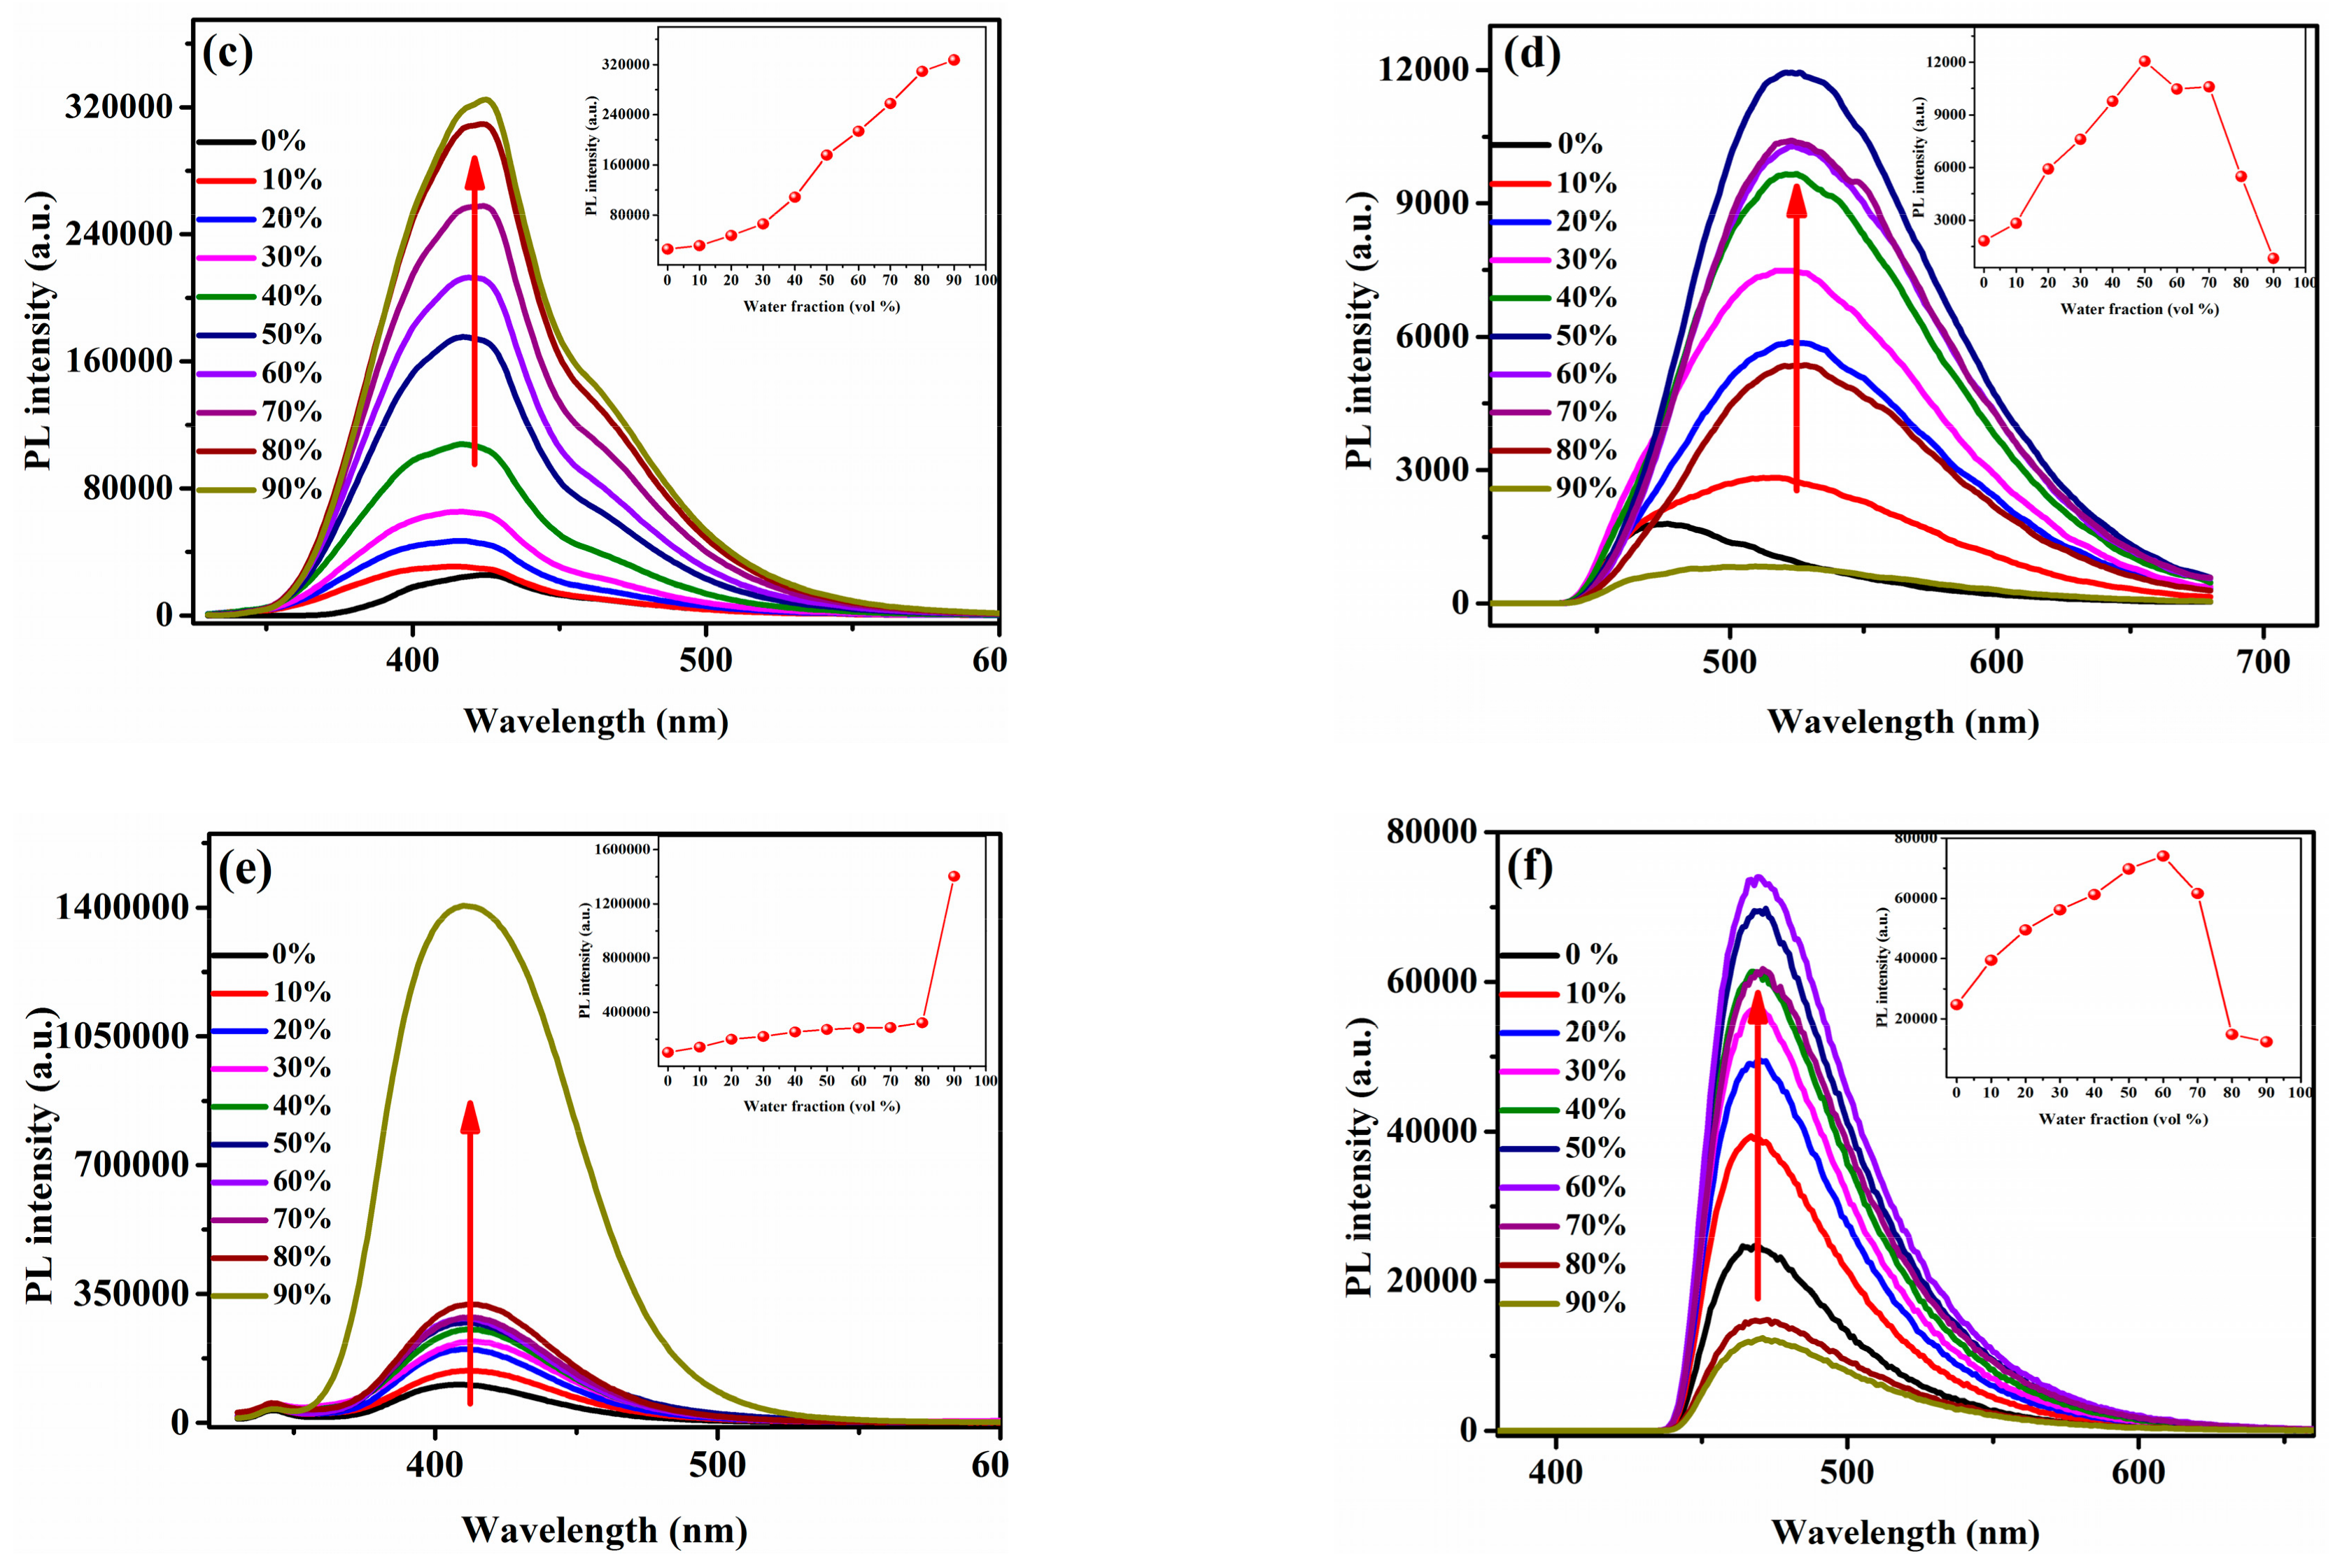
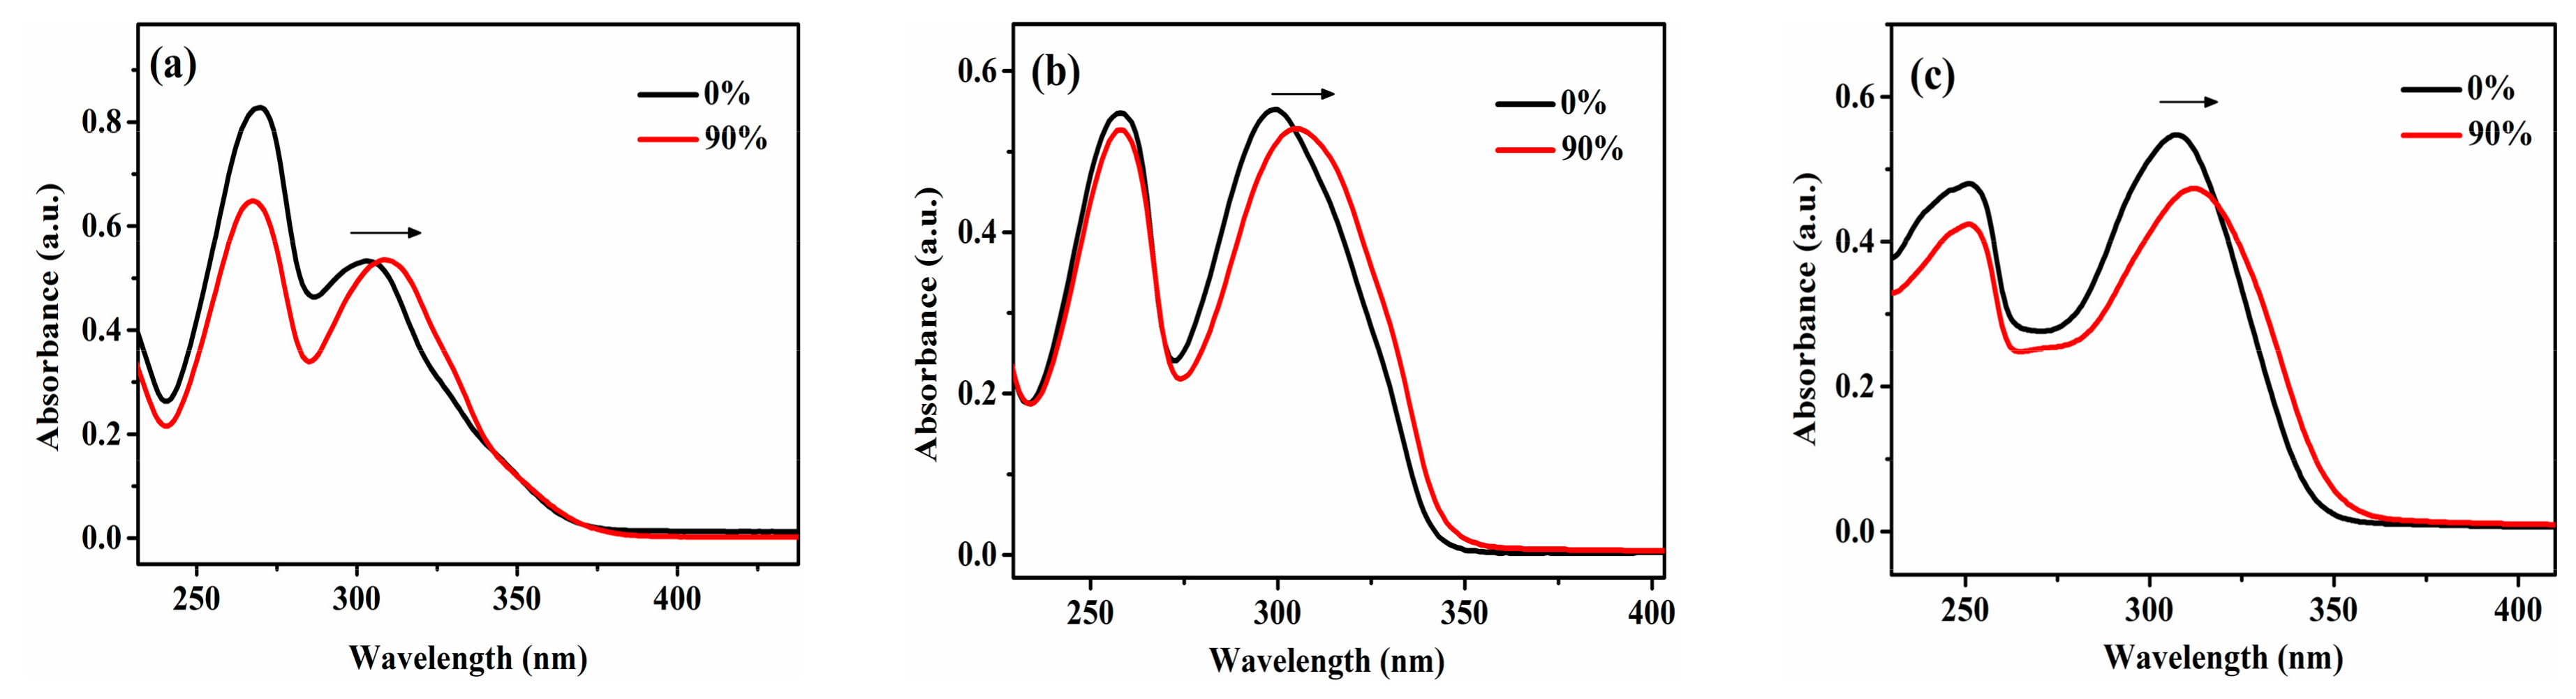
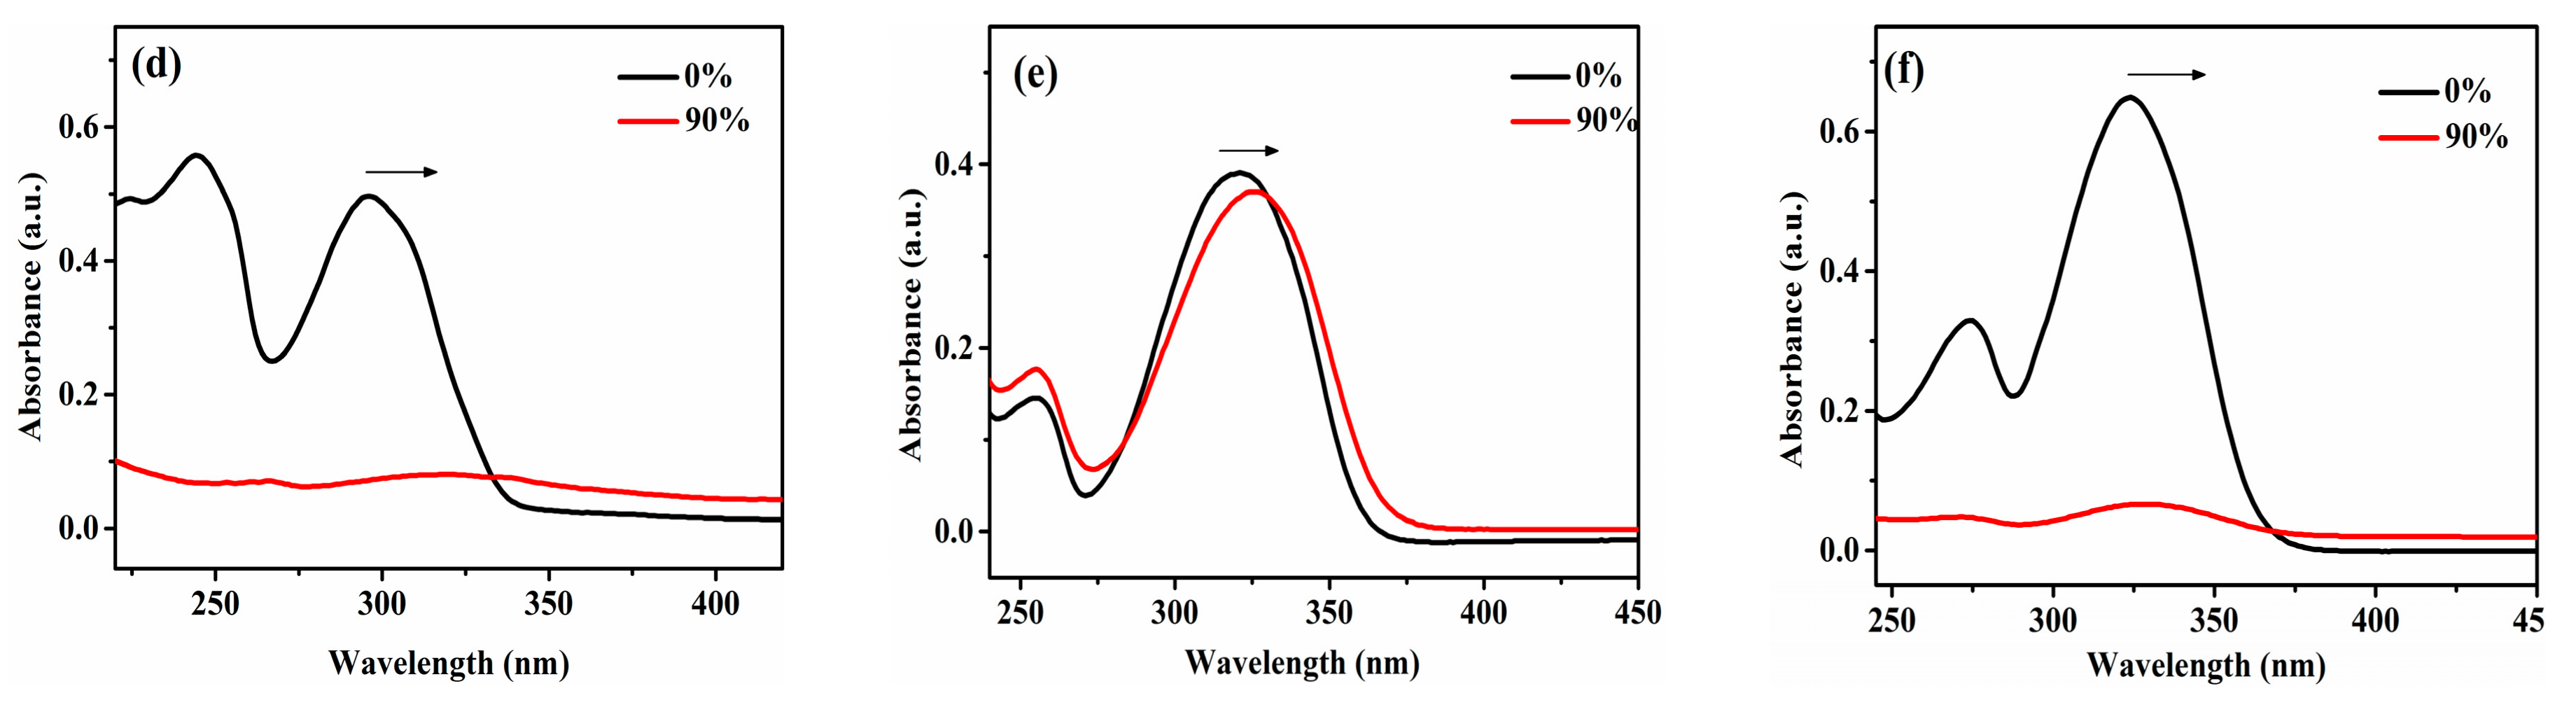
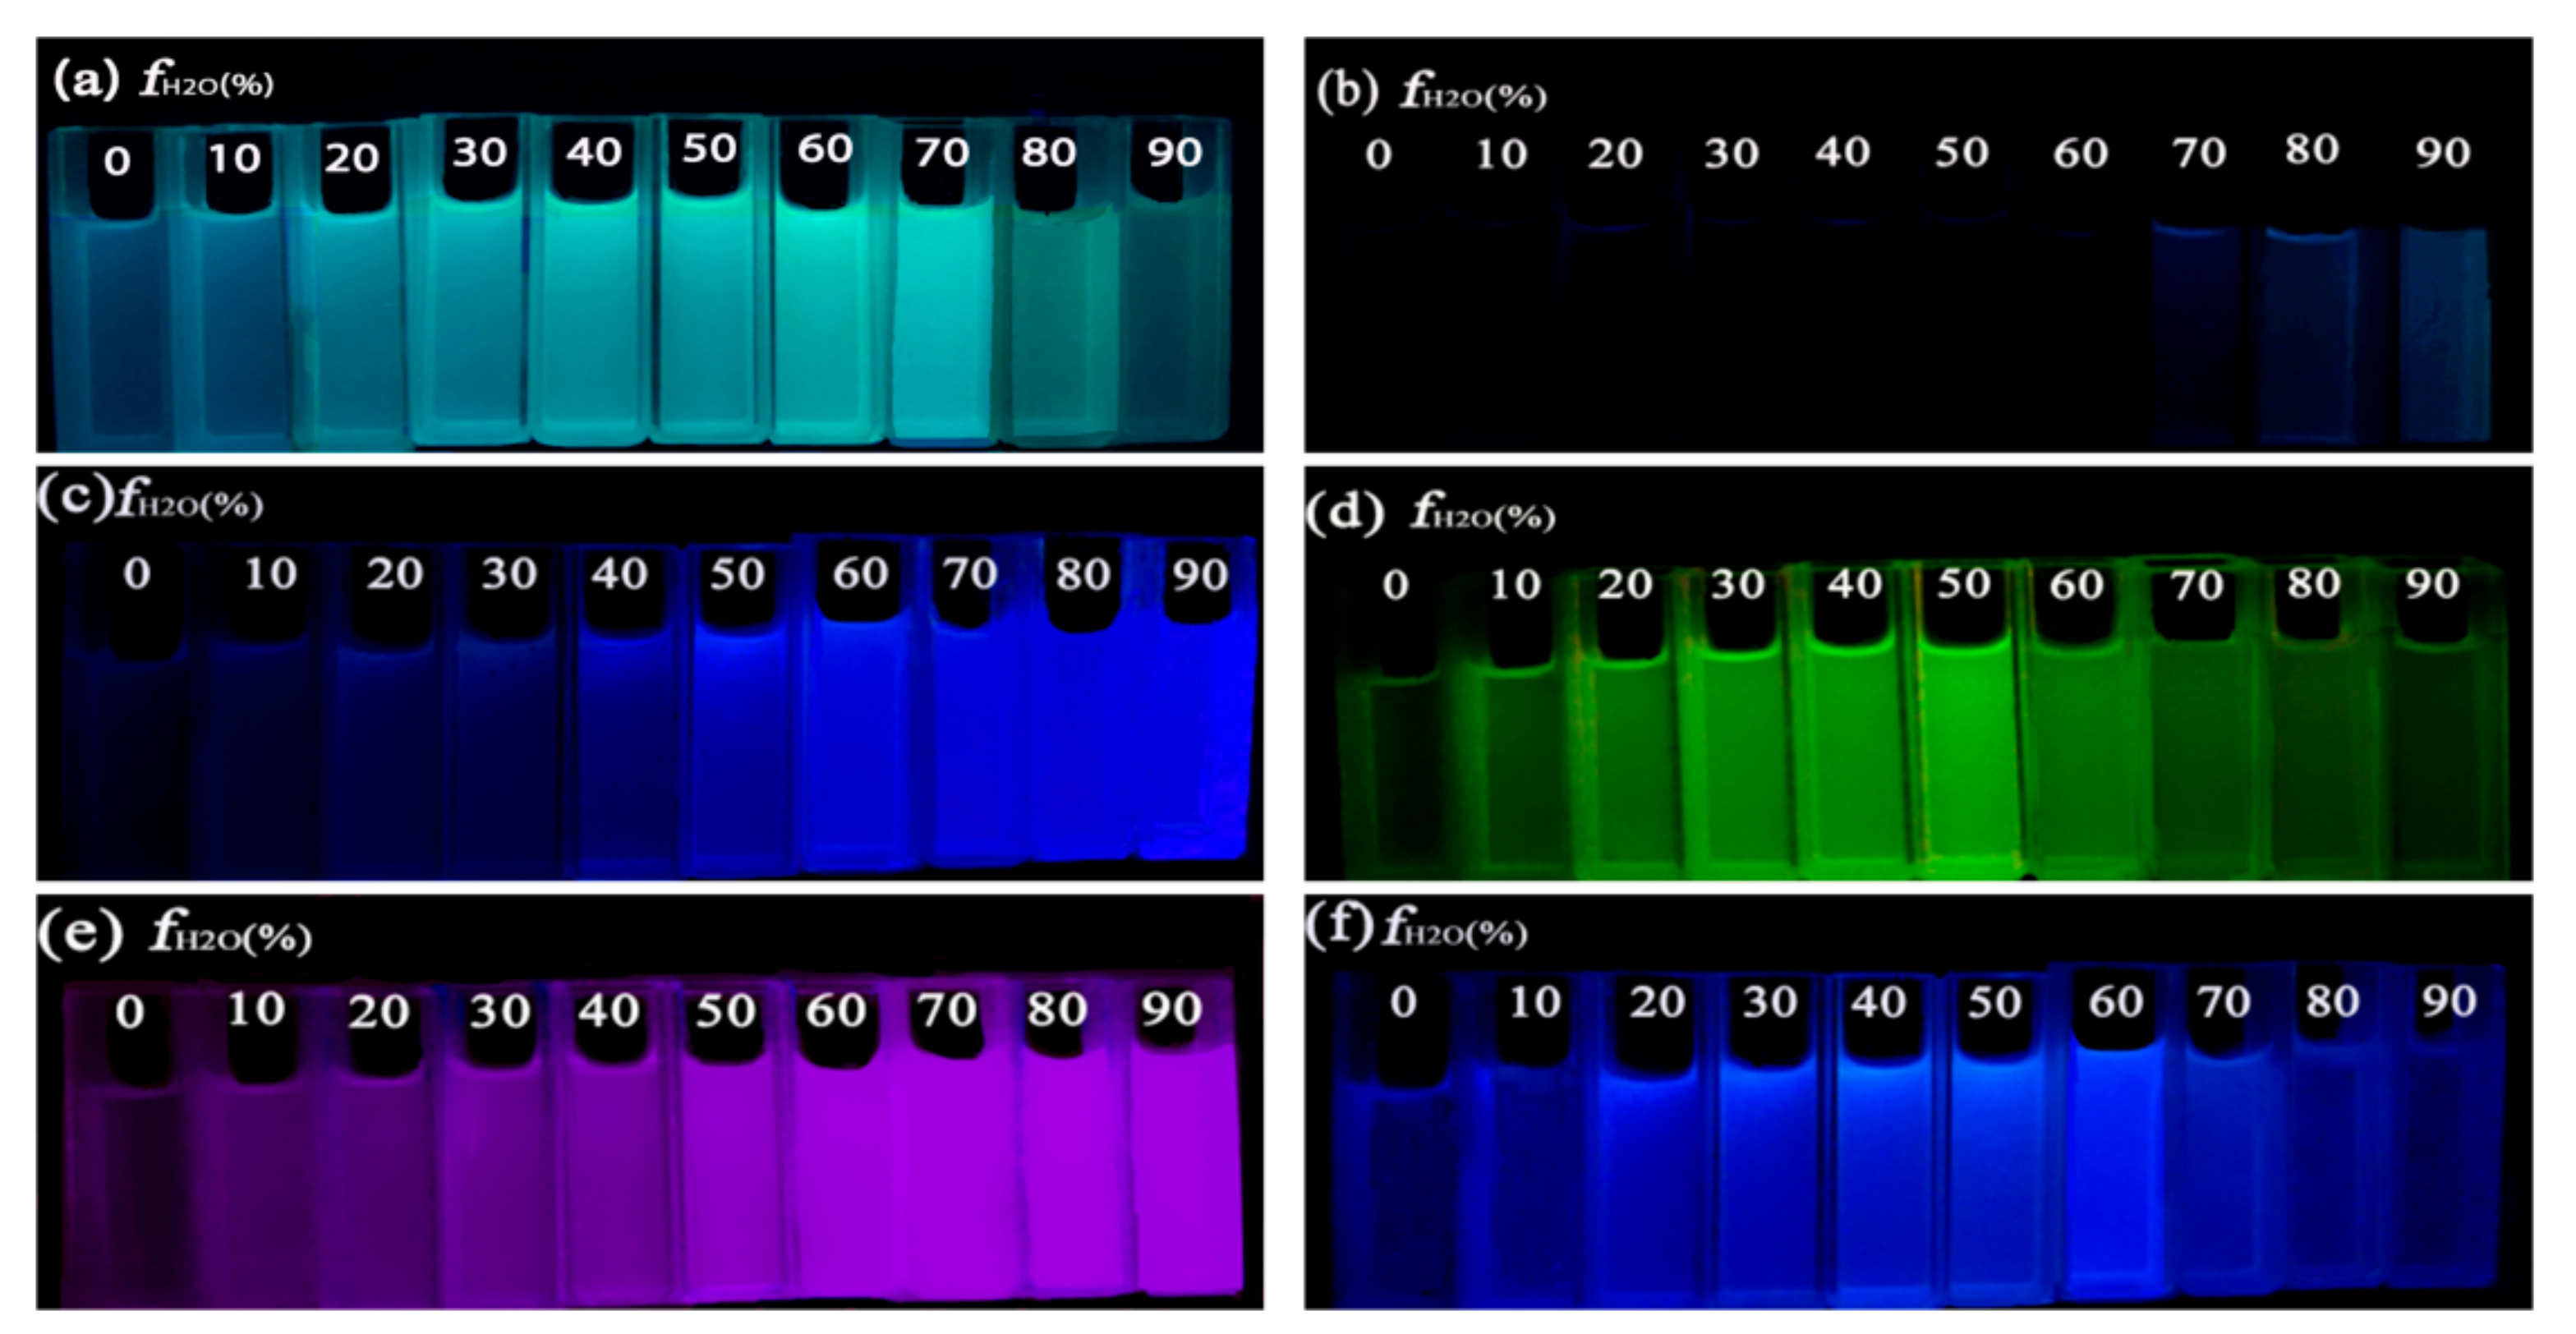
2.1. Optical Properties and Aggregation-Induced Emission Enhancement Property
2.2. Electronic Structure
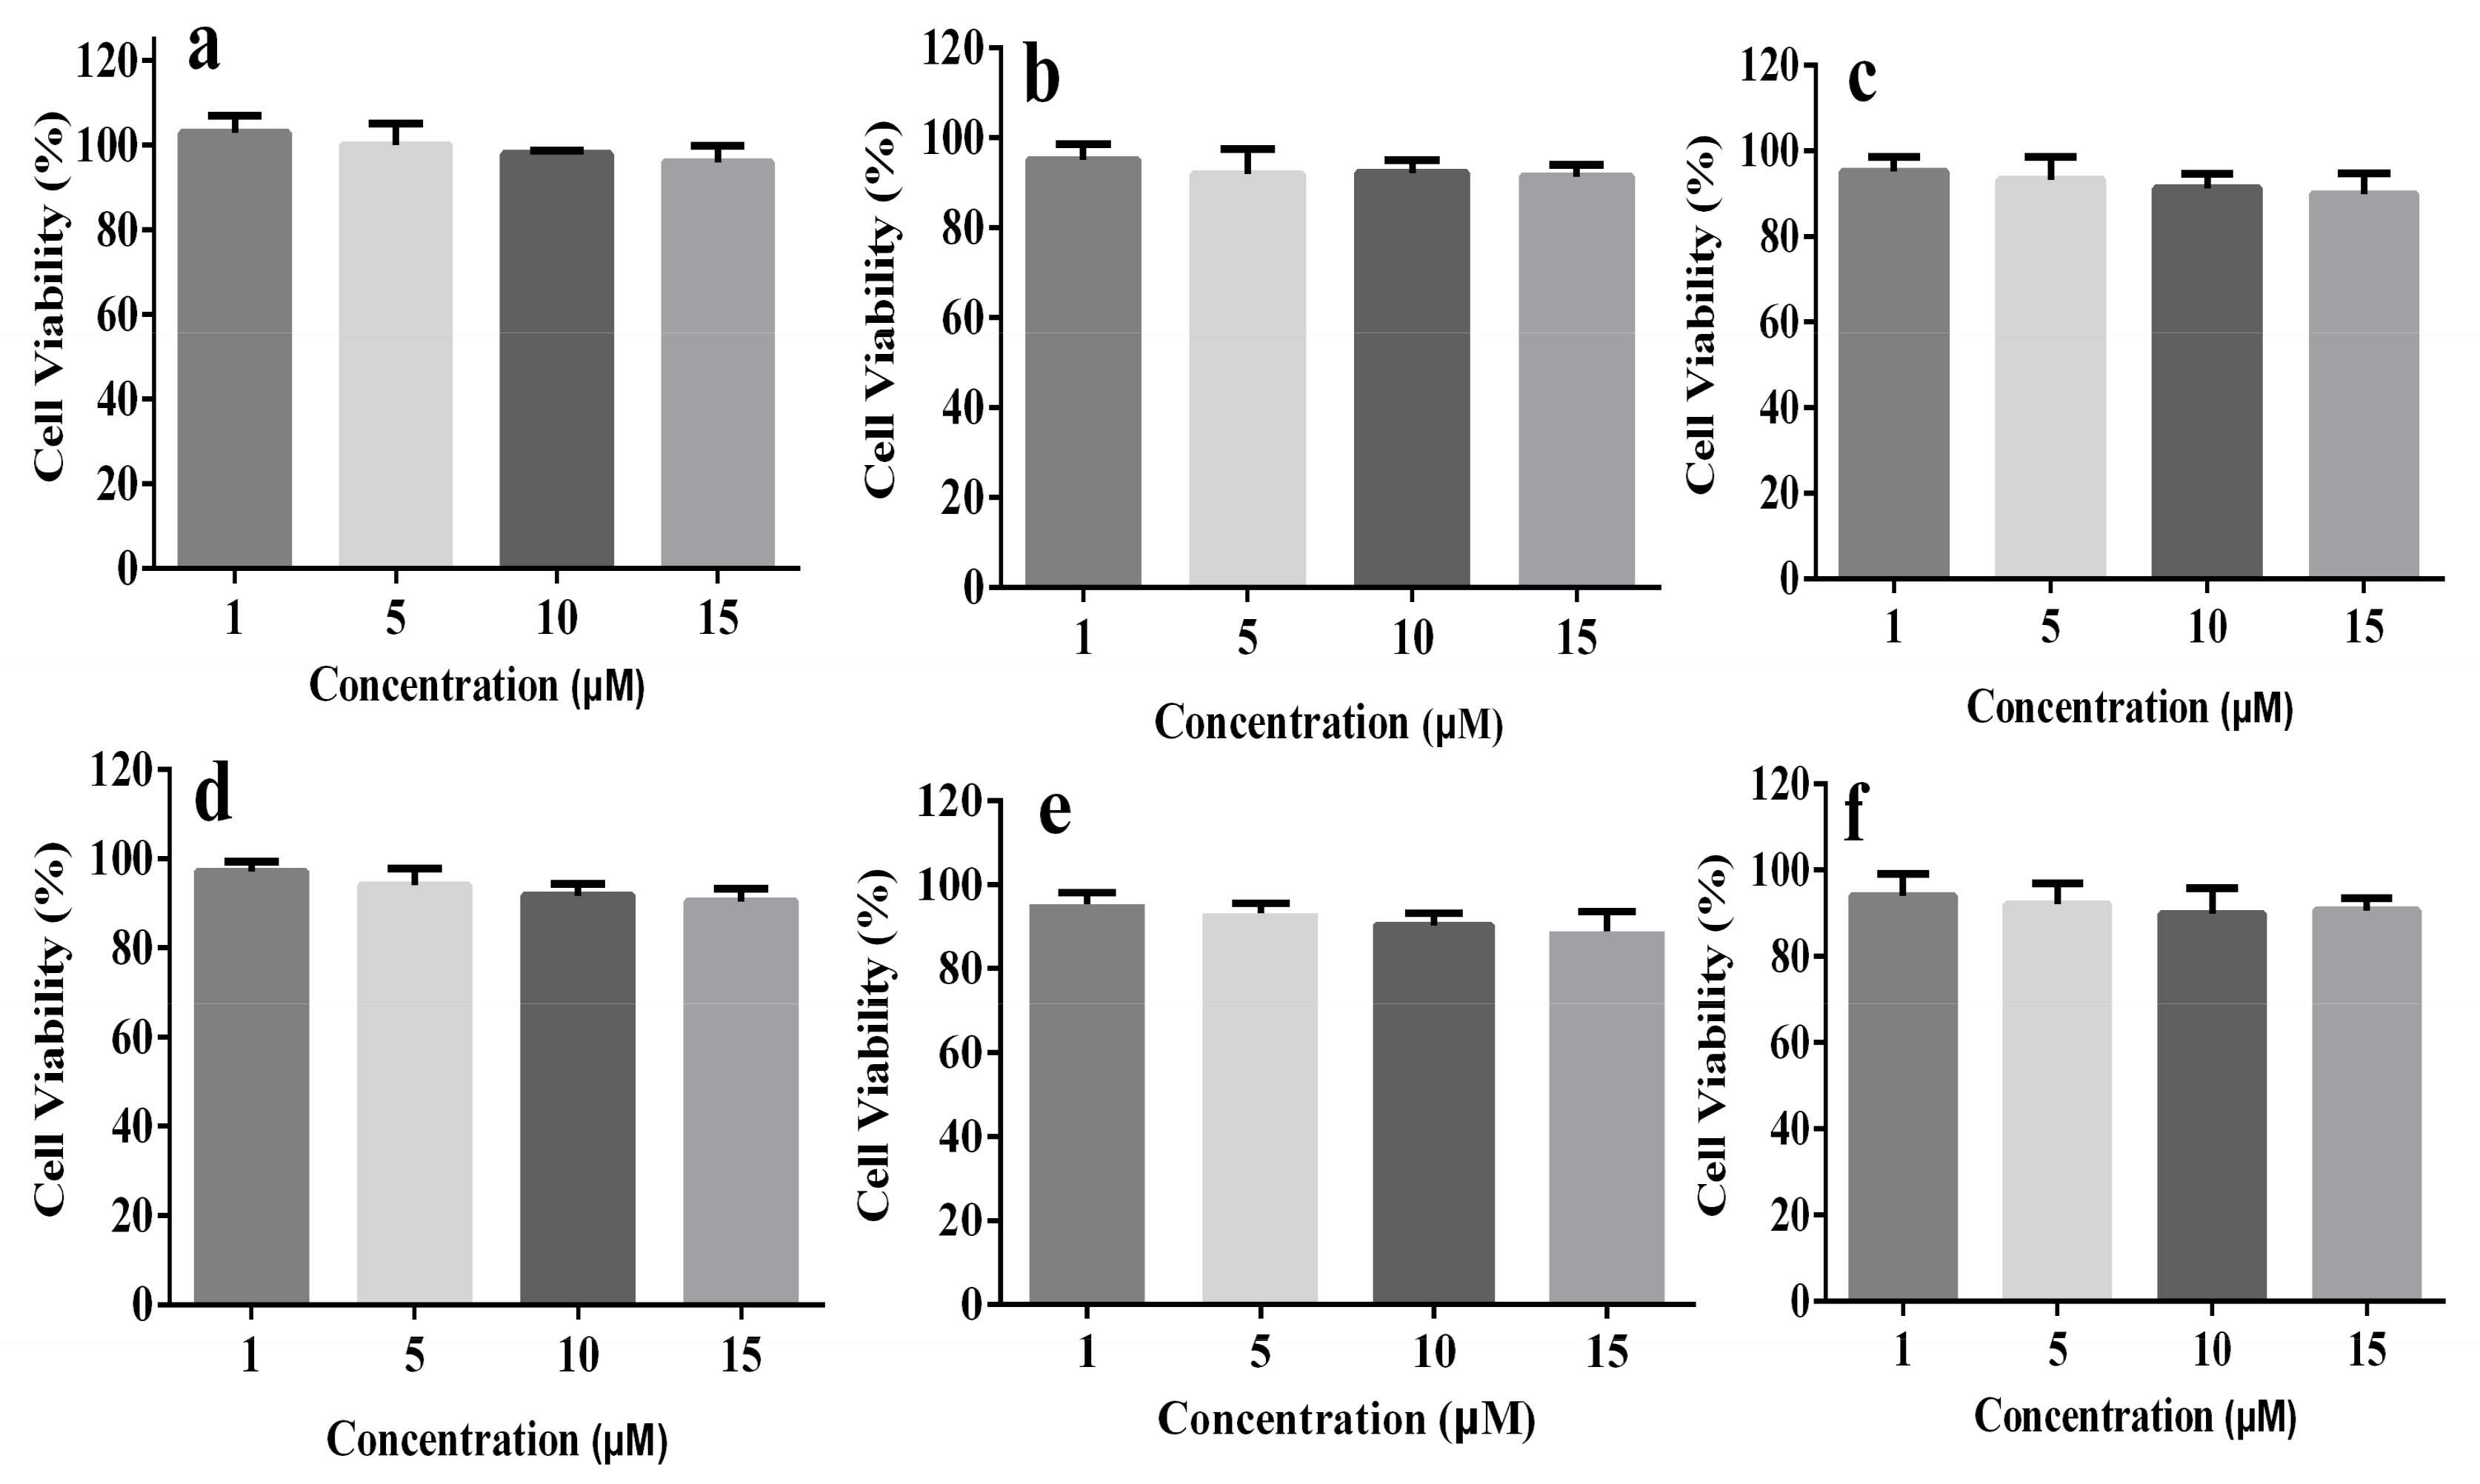
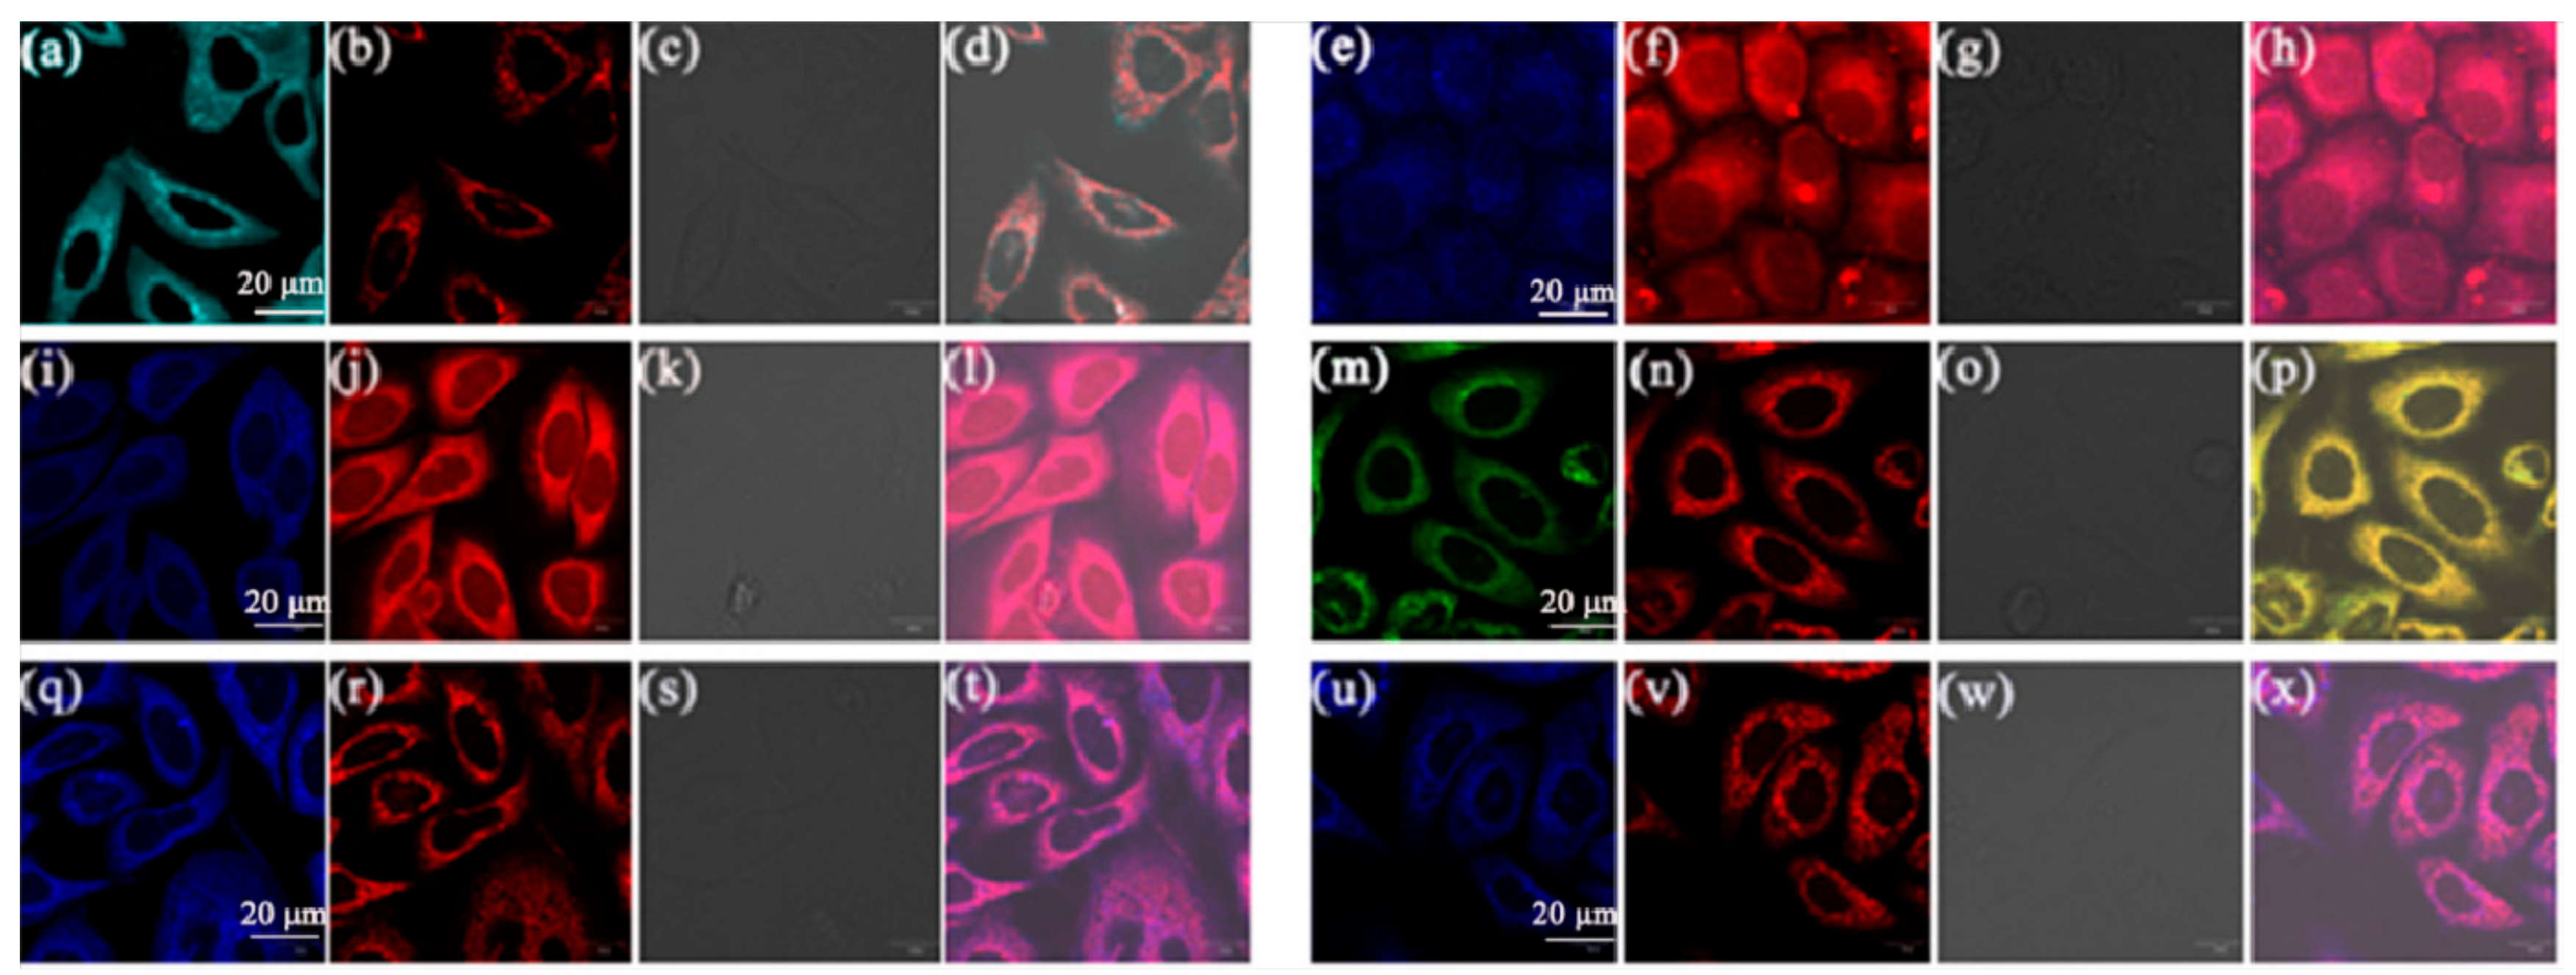
2.3. Fluorescence Imaging in Living Cells and Cell Viability Assay
2.4. Mitochondrial Imaging
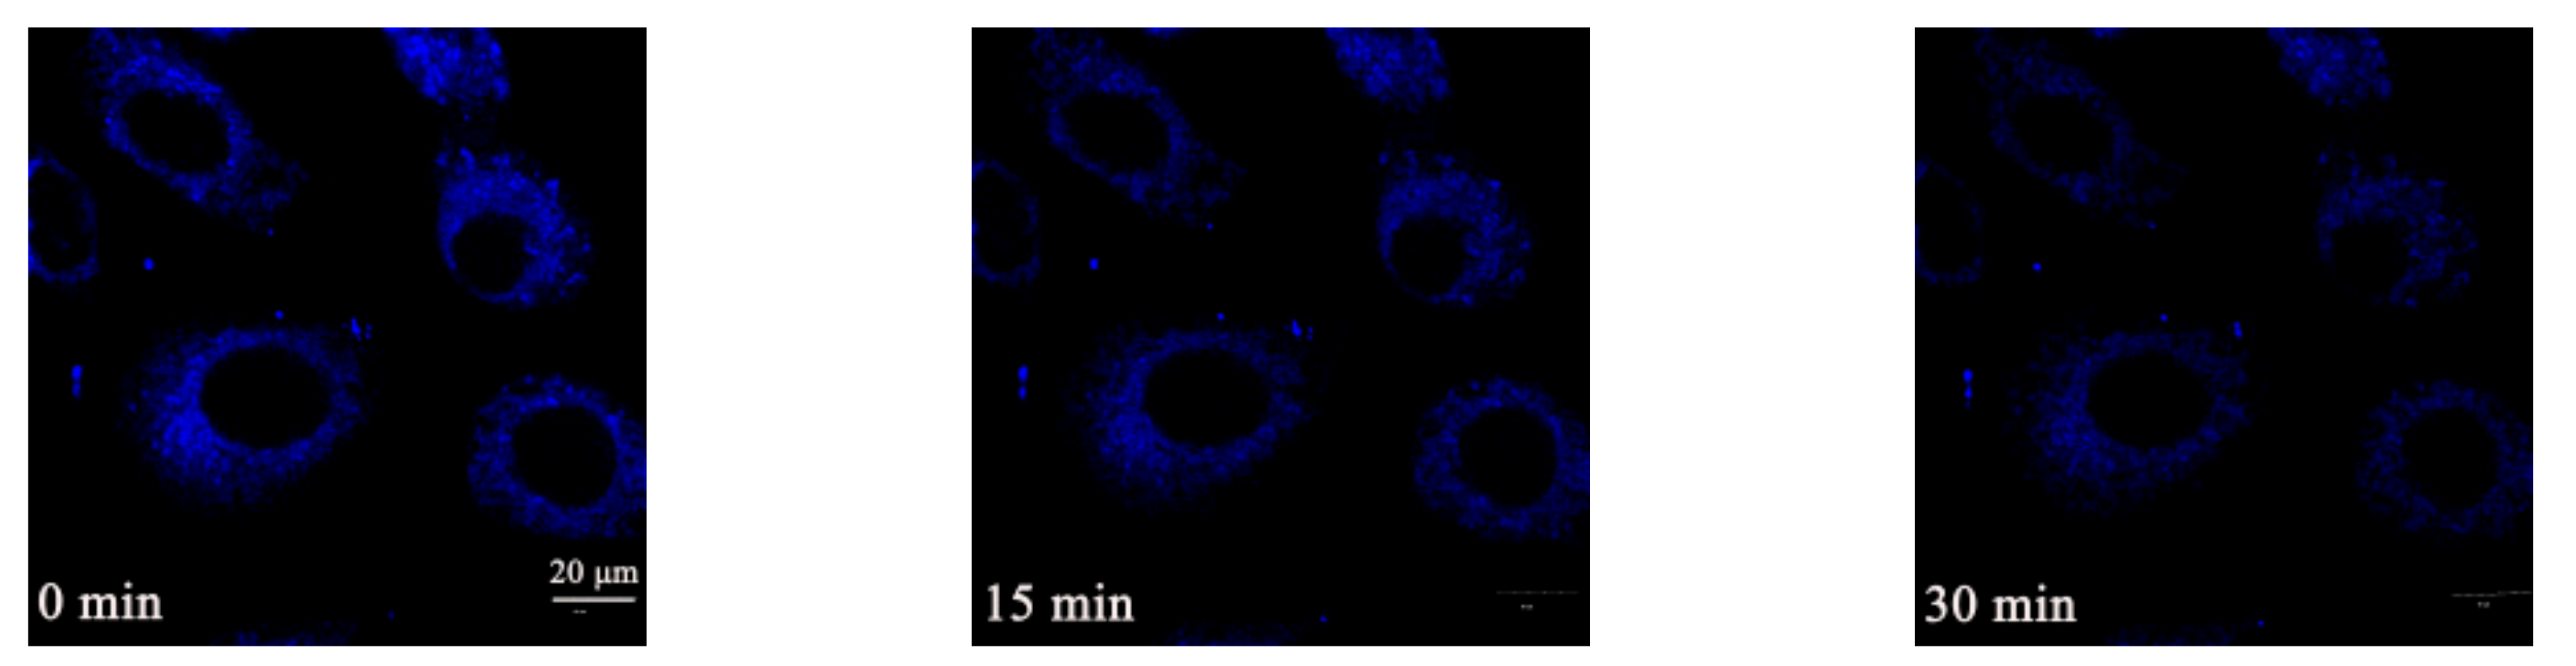
2.5. Mitochondrial Morphological Change
3. Materials and Methods
3.1. Materials and Instruments
3.2. Synthesis of Flavone Derivatives
3.2.1. Synthesis of Compounds 3a–j
3.2.2. Synthesis of Compounds 4a–j
3.2.3. Synthesis of Compounds 5a–j
3.3. Preparation for UV–Vis Spectra, Pl Spectra and SEM Measurements
3.4. Preparation for Ethylene Glycol (EG) Measurement
3.5. Theoretical Calculations
3.6. Cell Viability Evaluation
3.7. Cell Imaging
4. Conclusions
Supplementary Materials
Author Contributions
Funding
Conflicts of Interest
References
- Li, X.; Jiang, M.; Lam, J.W.; Tang, B.; Qu, Y.J. Mitochondrial Imaging with Combined Fluorescence and Stimulated Raman Scattering Microscopy Using a Probe of the Aggregation-Induced Emission Characteristic. J. Am. Chem. Soc. 2017, 139, 17022–17030. [Google Scholar] [CrossRef] [PubMed]
- Sreedharan, S.; Gill, M.R.; Garcia, E.; Saeed, H.K.; Robinson, D.; Byrne, A.; Cadby, A.; Keyes, T.E.; Smythe, C.; Pellett, P.; et al. Multimodal Super-Resolution Optical Microscopy Using a Transition-Metal-Based Probe Provides Unprecedented Capabilities for Imaging Both Nuclear Chromatin and Mitochondria. J. Am. Chem. Soc. 2017, 139, 15907–15913. [Google Scholar] [CrossRef] [PubMed]
- Xu, S.; Wu, W.; Cai, X.; Zhang, C.; Yuan, Y.; Liang, J.; Feng, G.; Manghnani, P.; Liu, B. Highly Efficient Photosensitizers with Aggregation-Induced Emission Characteristics Obtained through Precise Molecular Design. Chem. Commun. 2017, 53, 8727–8730. [Google Scholar] [CrossRef] [PubMed]
- Li, K.; Ding, D.; Huo, D.; Pu, K.; Thao, N.N.; Hu, Y.; Li, Z.; Liu, B. Conjugated Polymer Based Nanoparticles as Dual-Modal Probes for Targeted In Vivo Fluorescence and Magnetic Resonance Imaging. Adv. Funct. Mater. 2012, 22, 3107–3115. [Google Scholar] [CrossRef]
- Zhang, C.; Feng, G.; Xu, S.; Zhu, Z.; Lu, X.; Wu, J.; Liu, B. Structure-Dependent cis/trans Isomerization of Tetraphenylethene Derivatives: Consequences for Aggregation-Induced Emission. Angew. Chem. Int. Ed. 2016, 55, 6192–6196. [Google Scholar] [CrossRef] [PubMed]
- Luo, J.; Xi, Z.; Lam, J.W.; Cheng, L.; Tang, B.; Chen, H.; Qiu, C.; Kwok, H.S.; Zhan, X.; Liu, Y.; et al. Aggregation-Induced Emission of 1-methyl-1,2,3,4,5-pentaphenylsilole. Chem. Commun. 2001, 18, 1740–1741. [Google Scholar] [CrossRef]
- Nishiuchi, T.; Tanaka, K.; Kuwatani, Y.; Sung, J.; Nishinaga, T.; Kim, D.; Iyoda, M. Solvent-Induced Crystalline-State Emission and Multichromism of a Bent π-Surface System Composed of Dibenzocyclooctatetraene Units. Chem. Eur. J. 2013, 19, 4110–4116. [Google Scholar] [CrossRef] [PubMed]
- Zhao, Z.; Lam, J.W.; Chan, C.Y.; Chen, S.; Liu, J.; Lu, P.; Rodriguez, M.; Maldonado, J.L.; Ramos-Ortiz, G.; Sung, H.H.; et al. Stereoselective synthesis, efficient light emission, and high bipolar charge mobility of chiasmatic luminogens. Adv. Mater. 2011, 23, 5430–5435. [Google Scholar] [CrossRef] [PubMed]
- Lu, H.; Xu, B.; Dong, Y.; Chen, F.; Li, Y.; Li, Z.; He, J.; Li, H.; Tian, W. Novel fluorescent pH sensors and a biological probe based on anthracene derivatives with aggregation-induced emission characteristics. Langmuir 2010, 26, 6838–6844. [Google Scholar] [CrossRef] [PubMed]
- Mei, J.; Hong, Y.; Lam, J.W.; Qin, A.; Tang, Y.; Tang, B. Aggregation-Induced Emission: The Whole Is More Brilliant than the Parts. Adv. Mater. 2014, 26, 5429–5479. [Google Scholar] [CrossRef] [PubMed]
- Leung, N.L.; Xie, N.; Yuan, W.; Liu, Y.; Wu, Q.; Peng, Q.; Miao, Q.; Lam, J.W.; Tang, B. Restriction of Intramolecular Motions: The General Mechanism behind Aggregation-Induced Emission. Chem. Eur. J. 2014, 20, 15349–15353. [Google Scholar] [CrossRef] [PubMed]
- Zhao, E.; Lam, J.W.; Hong, Y.; Liu, J.; Peng, Q.; Hao, J.; Sung, H.H.; Williams, I.D.; Tang, B. How Do Substituents Affect Silole Emission? J. Mater. Chem. C 2013, 1, 5661–5668. [Google Scholar] [CrossRef]
- Jiang, G.; Zeng, G.; Zhu, W.; Li, Y.; Dong, X.; Zhang, G.; Fan, X.; Wang, J.; Wu, Y.; Tang, B. A selective and light-up fluorescent probe for β-galactosidase activity detection and imaging in living cells based on an AIE tetraphenylethylene derivative. Chem. Commun. 2017, 53, 4505–4508. [Google Scholar] [CrossRef] [PubMed]
- Chowdhury, A.; Howlader, P.; Mukherjee, P.S. Aggregation-Induced Emission of Platinum(II) Metallacycles and Their Ability to Detect Nitroaromatics. Chem. Eur. J. 2016, 22, 7468–7478. [Google Scholar] [CrossRef] [PubMed]
- Zhang, C.; Jin, S.; Yang, K.; Xue, X.; Li, Z.; Jiang, Y.; Chen, W.; Dai, L.; Zou, G.; Liang, X. Cell membrane tracker based on restriction of intramolecular rotation. ACS Appl. Mater. Interfaces 2014, 6, 8971–8975. [Google Scholar] [CrossRef] [PubMed]
- Jiang, G.; Wang, J.; Yang, Y.; Zhang, G.; Liu, Y.; Lin, H.; Zhang, G.; Li, Y.; Fan, X. Fluorescent turn-on sensing of bacterial lipopolysaccharide in artificial urine sample with sensitivity down to nanomolar by tetraphenylethylene based aggregation induced emission molecule. Biosens. Bioelectron. 2016, 85, 62–67. [Google Scholar] [CrossRef] [PubMed]
- Lei, Y.; Liu, L.; Tang, X.; Yang, D.; Yang, X.; He, F. Sanguinarine and chelerythrine: Two natural products for mitochondria-imaging with aggregation-induced emission enhancement and pH-sensitive characteristics. RSC Adv. 2018, 8, 3919–3927. [Google Scholar] [CrossRef]
- Thompson, R.B. Fluorescence Sensors and Biosensors; CRC: Boca Raton, FL, USA, 2005; pp. 1–416. [Google Scholar]
- Zhang, L.; Liu, W.; Huang, X.; Zhang, G.; Wang, X.; Wang, Z.; Zhang, D.; Jiang, X. Old is new again: A chemical probe for targeting mitochondria and monitoring mitochondrial membrane potential in cells. Analyst 2015, 140, 5849–5854. [Google Scholar] [CrossRef] [PubMed]
- Hu, R.; Leung, N.L.; Tang, B. AIE Macromolecules: Syntheses, Structures and Functionalities. Chem. Soc. Rev. 2014, 43, 4494–4562. [Google Scholar] [CrossRef] [PubMed]
- Masahito, H.; Yoshie, H. Direct observation of the reversible unwinding of a single DNA molecule caused by the intercalation of ethidium bromide. Nucleic Acids Res. 2007, 35, 1–7. [Google Scholar]
- Björn, O.; Patrick, M.; Per, A.; Michael, F.; Fabrizio, G.; Gunnar, G.; Constanze, H.; Maurice, D.L.; Par, M.; Giovanni, M.; et al. Impact of Stereospecific Intramolecular Hydrogen Bonding on Cell Permeability and Physicochemical Properties. J. Med. Chem. 2014, 57, 2746–2754. [Google Scholar]
- Tang, X.; Zhang, J.; Liu, L.; Yang, D.; Wang, H.; He, F. Synthesis of 13-substituted derivatives of berberine:Aggregation-induced emission enhancement and pH sensitive property. J. Photochem. Photobiol. A 2017, 337, 71–81. [Google Scholar] [CrossRef]
- Jiang, W.; Luo, T.; Li, S.; Zhou, Y.; Shen, X.; He, F. Quercetin Protects against Okadaic Acid-Induced Injury via MAPK and PI3K/Akt/GSK3β Signaling Pathways in HT22 Hippocampal Neurons. PLoS ONE 2016. [Google Scholar] [CrossRef] [PubMed]
- Li, J.; Nahyun, K.; Yerin, J.; Songyi, L.; Gyoungmi, K.; Juyoung, Y. Aggregation-Induced Fluorescence Probe for Monitoring Membrane Potential Changes in Mitochondria. ACS Appl. Mater. Interfaces 2018, 10, 12150–12154. [Google Scholar] [CrossRef] [PubMed]
- Ding, D.; Goh, C.; Feng, G.; Zhao, Z.; Liu, J.; Liu, R.; Tomczak, N.; Geng, J.; Tang, B.; Ng, L.G.; et al. Ultrabright Organic Dots with Aggregation-Induced Emission Characteristics for Real-Time Two-Photon Intravital Vasculature Imaging. Adv. Mater. 2013, 25, 6083–6088. [Google Scholar] [CrossRef] [PubMed]
- Ding, D.; Li, K.; Liu, B.; Tang, B. Bioprobes Based on AIE Fluorogens. Acc. Chem. Res. 2013, 46, 2441–2453. [Google Scholar] [CrossRef] [PubMed]
- Hong, Y.; Lam, J.W.; Tang, B. Aggregation-Induced Emission. Chem. Soc. Rev. 2011, 40, 5361–5388. [Google Scholar] [CrossRef] [PubMed]
- Yuan, Y.; Kwok, R.T.; Tang, B.; Liu, B. Targeted Theranostic Platinum (IV) Prodrug with a Built-in Aggregation-Induced Emission Light-Up Apoptosis Sensor for Noninvasive Early Evaluation of its Therapeutic Responses in Situ. J. Am. Chem. Soc. 2014, 136, 2546–2554. [Google Scholar] [CrossRef] [PubMed]
- Hu, F.; Huang, Y.; Zhang, G.; Zhao, R.; Yang, H.; Zhang, D. Targeted Bioimaging and Photodynamic Therapy of Cancer Cells with an Activatable Red Fluorescent Bioprobe. Anal. Chem. 2014, 86, 7987–7995. [Google Scholar] [CrossRef] [PubMed]
- Zhang, S.; Qin, A.; Sun, J.; Tang, B. Mechanism study of aggregation-induced emission. Prog. Chem. 2011, 23, 623–636. [Google Scholar]
- Ghodbane, A.; D’Alterio, S.; Saffon, N.; McClenaghan, N.D.; Scarpantonio, L.; Jolinat, P.; Fery-Forgues, S. Facile access to highly fluorescent nanofibers and microcrystals via reprecipitation of 2-phenyl-benzoxazole derivatives. Langmuir 2012, 28, 855–863. [Google Scholar] [CrossRef] [PubMed]
- Dong, J.; Solntsev, K.M.; Tolbert, L.M. Activation and tuning of green fluorescent protein chromophore emission by alkyl substituent-mediated crystal packing. J. Am. Chem. Soc. 2009, 131, 662–670. [Google Scholar] [CrossRef] [PubMed]
- Li, K.; Zhu, Z.; Cai, P.; Liu, R.; Tomczak, N.; Ding, D.; Liu, J.; Qin, W.; Zhao, Z.; Hu, Y.; et al. Organic Dots with Aggregation-Induced Emission (AIE dots) Characteristics for Dual-Color Cell Tracing. Chem. Mater. 2013, 25, 4181–4187. [Google Scholar] [CrossRef]
- Gu, X.; Yao, J.; Zhang, G.; Zhang, C.; Yan, Y.; Zhao, Y.; Zhang, D. New Electron-Donor/Acceptor-Substituted Tetraphenylethylenes: Aggregation-Induced Emission with Tunable Emission Color and Optical-Waveguide Behavior. Chem. Asian J. 2013, 8, 2362–2369. [Google Scholar] [CrossRef] [PubMed]
- Zhao, N.; Chen, S.; Hong, Y.; Tang, B. A red emitting mitochondria-targeted AIE probe as an indicator for membrane potential and mouse sperm activity. Chem. Commun. 2015, 51, 13599–13602. [Google Scholar] [CrossRef] [PubMed]
- Chris, W.T.; Hong, Y.; Chen, S.; Zhao, E.; Jacky, W.Y.; Tang, B. A Photostable AIE Luminogen for Specific Mitochondrial Imaging and Tracking. J. Am. Chem. Soc. 2013, 135, 62–65. [Google Scholar]
- Lim, M.L.; Minamikawa, T.; Nagley, P. The protonophore CCCP induces mitochondrial permeability transition without cytochrome c release in human osteosarcoma cells. FEBS Lett. 2001, 503, 69–74. [Google Scholar] [CrossRef]
- Yao, N.; Song, A.; Wang, X.; Seth, D.; Kit, S.L. Synthesis of Flavonoid Analogues as Scaffolds for Natural Product-Based Combinatorial Libraries. J. Comb. Chem. 2007, 9, 668–676. [Google Scholar] [CrossRef] [PubMed]
- Cotelle, N.; Bernier, J.L.; Henichart, J.P.; Catteau, J.P.; Gaydou, E.; Wallet, J.C. Scavenger and antioxidant properties of ten synthetic flavones. Free Radic. Biol. Med. 1992, 13, 211–219. [Google Scholar] [CrossRef]
- Chen, J.; Wu, W. Fluorescent Polymeric Micelles with Aggregation-Induced Emission Properties for Monitoring the Encapsulation of Doxorubicin. Macromol. Biosci. 2013, 13, 623–632. [Google Scholar] [CrossRef] [PubMed]
- Xue, X.; Zhao, Y.; Dai, L.; Zhang, X.; Hao, X.; Zhang, C.; Huo, S.; Liu, J.; Liu, C.; Kumar, A.; et al. Spatiotemporal Drug Release Visualized through a Drug Delivery System with Tunable Aggregation-Induced Emission. Adv. Mater. 2014, 26, 712–717. [Google Scholar] [CrossRef] [PubMed]
- Li, Z.; Dong, Y.; Mi, B.; Tang, Y.; Häussler, M.; Tong, H.; Dong, Y.; Lam, J.W.; Ren, Y.; Sung, H.H.; et al. Structure Control of the Photoluminescence of Silole Regioisomers and Their Utility as Sensitive Regiodiscriminating Chemosensors and Efficient Electroluminescent Materials. J. Phys. Chem. B 2005, 109, 10061–10066. [Google Scholar] [CrossRef] [PubMed]
Sample Availability: Samples of the compounds 5a–5j are available from the authors. |


| Compound | Solvents | Quantum Yields (ФF) | Time/ns |
|---|---|---|---|
| CH3OH | 0.16 | 3.15 | |
| 5a | CH3OH/H2O (3:7) | 0.23 | 3.22 |
| CH3OH/H2O (1:9) | 0.19 | 3.19 | |
| CH3OH | 0.03 | 2.15 | |
| 5b | CH3OH/H2O (5:5) | 0.09 | 2.32 |
| CH3OH/H2O (1:9) | 0.15 | 3.10 | |
| CH3OH | 0.14 | 2.97 | |
| 5c | CH3OH/H2O (5:5) | 0.22 | 3.29 |
| CH3OH/H2O (1:9) | 0.28 | 3.34 | |
| CH3OH | 0.05 | 2.18 | |
| 5d | CH3OH/H2O (5:5) | 0.10 | 2.68 |
| CH3OH/H2O (1:9) | 0.02 | 1.67 | |
| CH3OH | 0.20 | 3.26 | |
| 5e | CH3OH/H2O (5:5) | 0.27 | 3.31 |
| CH3OH/H2O (1:9) | 0.32 | 3.40 | |
| CH3OH | 0.13 | 2.83 | |
| 5f | CH3OH/H2O (4:6) | 0.18 | 3.16 |
| CH3OH/H2O (1:9) | 0.12 | 2.79 |
© 2018 by the authors. Licensee MDPI, Basel, Switzerland. This article is an open access article distributed under the terms and conditions of the Creative Commons Attribution (CC BY) license (http://creativecommons.org/licenses/by/4.0/).
Share and Cite
Liu, L.; Lei, Y.; Zhang, J.; Li, N.; Zhang, F.; Wang, H.; He, F. Rational Design for Multicolor Flavone-Based Fluorophores with Aggregation-Induced Emission Enhancement Characteristics and Applications in Mitochondria-Imaging. Molecules 2018, 23, 2290. https://doi.org/10.3390/molecules23092290
Liu L, Lei Y, Zhang J, Li N, Zhang F, Wang H, He F. Rational Design for Multicolor Flavone-Based Fluorophores with Aggregation-Induced Emission Enhancement Characteristics and Applications in Mitochondria-Imaging. Molecules. 2018; 23(9):2290. https://doi.org/10.3390/molecules23092290
Chicago/Turabian StyleLiu, Liyan, Yaohui Lei, Jianhui Zhang, Na Li, Fan Zhang, Huaqiao Wang, and Feng He. 2018. "Rational Design for Multicolor Flavone-Based Fluorophores with Aggregation-Induced Emission Enhancement Characteristics and Applications in Mitochondria-Imaging" Molecules 23, no. 9: 2290. https://doi.org/10.3390/molecules23092290
APA StyleLiu, L., Lei, Y., Zhang, J., Li, N., Zhang, F., Wang, H., & He, F. (2018). Rational Design for Multicolor Flavone-Based Fluorophores with Aggregation-Induced Emission Enhancement Characteristics and Applications in Mitochondria-Imaging. Molecules, 23(9), 2290. https://doi.org/10.3390/molecules23092290