Abstract
Aurantii fructus (AF) is a traditional Chinese medicine that has been used to improve gastrointestinal motility disorders for over a thousand years, but there is no exhaustive identification of the basic chemical components and comprehensive quality control of this herb. In this study, high-performance liquid chromatography coupled with quadrupole time of flight mass spectrometry (HPLC-Q-TOF-MS) and gas chromatography coupled mass spectrometry (GC-MS) were employed to identify the basic chemical compounds, and high-performance liquid chromatography (HPLC) was developed to determine the major biochemical markers from AF extract. There were 104 compounds belonging to eight structure types, including 13 amino acids or peptides, seven alkaloids, 18 flavanones, 14 flavones, 15 polymethoxyflavonoids, six triterpenoids, nine coumarins, and 18 volatile oils, as well as four other compounds that were systematically identified as the basic components from AF, and among them, 41 compounds were reported for the first time. Twelve bioactive ingredients were chosen as the benchmark markers to evaluate the quality of AF. The analysis was completed with a gradient elution at a flow rate of 0.7 mL/min within 55 min. This efficient method was validated showing good linearity, precision, stability, repeatability and recovery. Furthermore, the method was successfully applied to the simultaneous determination of 12 chemical markers in different samples of AF. This study could be applied to the identification of multiple bioactive substances and improve the quality control of AF.
1. Introduction
Aurantii fructus (AF) is the dried and immature fruit of Citrus aurantium L. and its cultivars. It plays important roles in traditional Chinese medicine (TCM) and is a functional food that has been intensively applied to treat stagnation of dyspepsia, improve gastrointestinal motility dysfunction, and alleviate chest pain in traditional therapies [1,2]. There is a general consensus that the pharmacological effects of herbal medicines are significantly correlated with the chemical composition and the contents of bioactive compounds in herbs. The current research shows that the main bioactive constituents in AF are mainly flavonoids [2,3,4], alkaloids [1,4,5], coumarins [6,7], and volatile oils [1,8]. Modern pharmacological studies have shown these compounds to exhibit various activities, e.g., anti-inflammatory [9,10], anti-oxidation [10,11], regulation of gastrointestinal and prevention of cardiovascular disease [12,13], and they are considered to be the major bioactive constituents in AF. Plenty of clinical investigations have shown that the main pharmacological ingredients of AF are flavonoids, such as flavanones and polymethoxyflavonoids (PMFs), that mainly focus on regulating gastrointestinal dysmotility [12,14,15].
The chemical compounds from AF have been qualitatively or quantitatively analyzed via ultraviolet spectrophotometry (UV), thin layer chromatography (TLC), gas chromatography (GC), high performance liquid chromatography (HPLC), gas chromatograph-mass spectrometry (GC-MS), liquid chromatography mass spectrometry (LC-MS), infra-red spectrum (IR), and nuclear magnetic resonance (NMR) [1,2,7,16,17]. However, due to the complexity of the structural types of the basic chemical constituents of TCM, these methods have certain deficiencies in the analysis of the basic components, and there are incomplete reports for a comprehensive investigation on the constituents of AF. In particular, some ingredients are found in low sensitivity and trace amounts of the above methods often lead to insufficient and defective analysis. High-performance liquid chromatography quadrupole time-of-flight mass spectrometry (HPLC-Q-TOF-MS) is an efficient method with high sensitivity, high precision, high resolution, fast information acquisition, and has been employed to analyze complicated profiles of citrus plants in recent years [6,18,19]. Therefore, the detailed chemical constituents of AF extract can be identified systematically using the HPLC-Q-TOF-MS method. Alternatively, volatile components with low content can be identified by GC-MS technique.
TCM plays a clinical therapeutic role by applying multiple constituent works on multiple targets within the body [20], but only two flavanones (naringin, neohesperidin) are defined as the evaluated markers of quality control for AF in the Chinese Pharmacopoeia [21]. Due to the comprehensive pharmacological effects of TCM, the evaluated standards of quality control for TCM should be carefully considered and established based on multiple pharmacodynamic substances in the future.
The aim of this study is to establish a new comprehensive analysis method for gaining insight into the exhaustive chemical profiles of AF using HPLC-Q-TOF-MS combined with GC-MS. Then, in consideration of the major pharmacological effects of AF, the typical bioactive ingredients were successfully screened as the markers of quality control from the complicated compounds of AF based on the analytical data from mass spectrometry. Then, a simple and effective method for simultaneous determination of bioactive markers was established by high performance liquid chromatography (HPLC), and AF samples from different regions were evaluated. To the best of our knowledge, this is the first attempt to improve qualitative and quantitative methods for the analysis and determination of bioactive ingredients in AF with efficient procedures [22]. These results supply complete chemical components for further research and improve the practical application of the consistency evaluation and quality control of AF samples from different habitats. In addition, they provide comprehensive references for the research and development of AF to be used as a traditional medicine and functional food.
2. Results and Discussion
2.1. Identification and Analysis of Active Constituents in Ethanol Extract of AF
As many as 86 compounds were identified as the main constituents from AF by ESI-Q-TOF-MS in the positive and negative ion mode, and the total ion chromatogram was analyzed based on the standards, fragmentation patterns, literature and the ChemSpider database (Figure 1). The retention time and mass spectrometry information of each chemical constituent of AF were detected as shown in Table 1. Eighty-six compounds in the ethanol extract of AF were accurately identified or preliminarily assigned. These compounds included 13 amino acids or peptides, seven alkaloids, 18 flavanones, 14 flavones, 15 polymethoxyflavonoids, six triterpenoids, nine coumarins, and four other compounds. The structures of these compounds were drawn and classified by ChemBio Draw Ultra 14.0, as shown in Figure S1. Thirty-seven of these compounds were reported in AF for the first time.
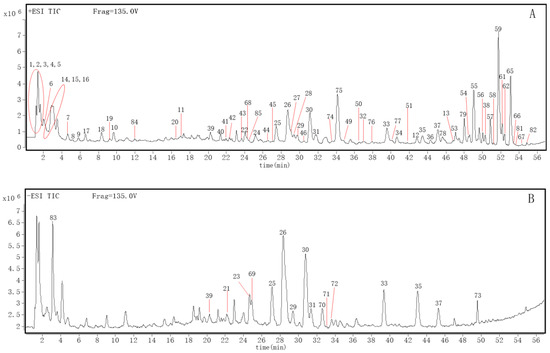
Figure 1.
Total ion chromatography of ethanol extract from Aurantii fructus in positive (A) and negative (B) ion modes.

Table 1.
Identification of constituents from Aurantii fructus by the high-performance liquid chromatography quadrupole time-of-flight mass spectrometry method in positive and negative ion modes.
2.1.1. Amino Acids and Polypeptides
Amino acids are important nutrients needed by the human body and are major primary metabolites of citrus plants [23], as well as the basic substrates in the biosynthesis of secondary metabolites of many plants. Although various free amino acids can be detected in different species of citrus, such as lemon, orange and other fruits [23,24], at present there is still no reports on the amino acid composition of AF. Owing to the low content and larger polarity of amino acids, it was difficult to obtain their MS2 spectra. However, based on the high resolution and accuracy of Q-TOF-MS and the accuracy of the measured molecular weight in the MS data, multiple types of amino acids were found in AF.
Compound 1 displayed a protonated molecule at m/z 147.1130 [M + H]+ with the molecular formula C6H14N2O2. From the MS data (Table 1), compound 1 corresponds to lysine, which was isolated previously from citrus fruits [23]. Compound 2 showed a protonated molecule at m/z 147.0748 [M + H]+ with the molecular formula C5H10N2O3. Compound 2 was presumed tentatively as glutamine [23]. By use of the same method and mass spectrometer formula prediction software (absolute error ˂5 ppm), combined with literature references, compounds 3, 4, 5, 6, 7, 8, 9, 10 and 11 can be identified tentatively as histidine [23], arginine [23,24], proline [23,24], valine [23], isoleucine [23], leucine [23], tyrosine [23], phenylalanine, and tryptophan [23], respectively (Table 1). In addition, two polypeptides were found in AF. Compound 12 displayed a protonated molecule at m/z 728.3966 [M + H]+ with the molecular formula C36H53N7O9, and corresponded to citrusin III [25,26,27], isolated previously from citrus plants. Compound 13 showed a protonated molecule at m/z 704.3978 [M + H]+ with the molecular formula C34H53N7O9, which is consistent with the literature, and presumed as citrusin I [26,27]. These 13 compounds were reported in AF for the first time.
2.1.2. Alkaloids
Compound 17 displayed a protonated molecule at m/z 168.1016 [M + H]+ with the molecular formula C9H13NO2, and MS/MS fragmentation showed peaks at m/z 150.0853 [M + H]+. The fragmentation pattern of compound 17 agreed with synephrine [28,29], and it was unambiguously identified by comparison with the standard. Compound 18 showed a protonated molecule at m/z 152.1071 [M + H]+ with the molecular formula C9H13NO, which is consistent with the literature, and presumed to be N-methyltyramine [28,29]. Compound 19 displayed a protonated molecule at m/z 268.1027 [M + H]+ with the molecular formula C10H13N5O4, which is consistent with the literature, and presumed to be adenosine [30]. Compound 20 showed a protonated molecule at m/z 196.0970 [M + H]+ with the molecular formula C10H13NO3, which is consistent with the literature, and presumed to be N-acetylnorsynephrine [29]. In addition, other alkaloids (absolute error ˂5 ppm) were analyzed in this experiment. The protonated molecules of compounds 14, 15 and 16 were m/z 138.0549 [M + H]+, m/z 130.0865 [M + H]+, and m/z 144.1022 [M + H]+, respectively. Due to the high solution of Q-TOF-MS, these compounds were preliminarily assigned to aminobenzoic acid, pipecolic acid, and piperidine acetic acid, respectively. These three compounds were reported in AF for the first time.
2.1.3. Flavonones
Flavonones are considered to be the most important compounds obtained from AF. As many as 18 flavonones were identified by ESI-Q-TOF-MS in this study (Table 1), and among these flavonones, compounds 22, 24, 25, 26, 29, 30, 33, 35, 37 were unambiguously identified as eriodictyol-7-O-rutinoside (eriocitrin) [1,2], eriodictyol-7-O-neohesperidoside (neoeriocitrin) [2,31], naringenin-7-O-rutinoside (narirutin) [1,2,31], naringenin-7-O-neohesperidoside (naringin) [2,30,31], hesperetin-7-O-rutinoside (hesperidin) [2,30,31], hesperetin-7-O-neohesperidoside (neohesperidin) [1,2,31], isosakuranetin-7-O-neohesperidoside (poncirin) [1,2], naringenin [2], and hesperetin [2], respectively, by comparison of the retention time, absorption wavelengths, and m/z values with the reference standards and the literature.
The remaining compounds could be tentatively assigned by comparing the accurate mass data (absolute value of error <5 ppm), the formula predictor software, the fragmentation patterns, and the literature data (Table 1). For example, in the negative mode, compounds 21 and 23 had m/z 741.2261 [M − H]– and m/z 449.1101 [M − H]–, respectively, and the chemical formula were C33H42O19 and C21H22O11, respectively. They were presumed to be naringenin-7-O-triglycoside [2,31] and eriodictol-7-O-glucoside [32] according to literature. In the positive mode, Compounds 27, 31 and 34 had m/z 435.1286 [M + H]+ with the molecular formula C21H20O10, m/z 465.1381 [M + H]+ with the molecular formula C22H24O11, and m/z 449.1432 [M + H]+ with the molecular formula C22H24O10, respectively. Their parent nucleus were m/z 273.0751 [M + H]+, m/z 303.0861 [M + H]+, m/z 287.0898 [M + H]+, respectively, suggesting that they contained glucoside (162 Da). According to the fragmentation patterns of naringin (26), neohesperidin (30) and poncirin (33), compounds 27, 31 and 34 were tentatively identified as naringenin-7-O-glucoside [33], hesperetin-7-O-glucoside [33], and isosakuranetin-7-O-glucoside (isosakuranin) [34], respectively (Table 1). Similarly, compounds 32 and 38 were presumed to be eriodictyol [35] and isosakuranetin [35]. Compound 28 displayed protonated and deprotonated molecules at m/z 755.2392 [M + H]+ and m/z 753.2233 [M − H]–, respectively, with the molecular formula C34H42O19. It was assigned tentatively to brutieridin [28,36]. Compound 36 showed protonated and deprotonated molecules at m/z 725.2285 [M + H]+ and m/z 723.2127 [M − H]–, respectively, with molecular formula C33H40O18. It was assigned tentatively to melitidin [28,36]. Among them, naringenin, hesperetin, eriodictyol and isosakuranetin were identified as the basic nucleus, and flavonones in AF were deduced to be generated based on these nuclei. Compounds 23, 28, 34 and 36 were reported in AF for the first time.
2.1.4. Flavones
A total of 14 flavones were identified or preliminarily assigned in the study. Compound 39 was accurately identified as quercetin-3-O-rutinoside (rutin) [2] by a reference standard and mass spectrometry. Compounds 40 and 51 displayed protonated molecules at m/z 595.1663 [M + H]+ with molecular formula C27H30O15 and at m/z 697.1964 [M + H]+ with molecular formula C31H36O18, were assigned to isovitexin-7-O-glucoside (saponarin) [31,32], and isovitexin-7-O-xylocoside-2″-O-arabi-noside [31], respectively. Compounds 43, 46 and 50 contained protonated molecules at m/z 741.2213 [M + H]+, m/z 579.1704 [M + H]+ and m/z 579.1706 [M + H]+, respectively. With the same MS2 fragment ion at m/z 271 [M + H]+ for these three compounds, it was identified to be apigenin (52) [35] as a nucleus structure according to the literature data. In positive ion mode, it was presumed that the two compounds contained rutinoside or neohesperidoside because of the low weight of 308 Da, and the abundance of the protonated molecule at m/z 271 [M + H]+ in compound 46 was lower than compound 50. Based on the above information and literature reports [2,27], it was speculated that compounds 46 and 50 were apigenin-7-O-rutinoside (isorhoifolin) [28] and apigenin-7-O-neohesperidoside (rhoifolin) [28], and compound 43 was preliminarily assigned to apigenin-7-O-rutinoside-4′-O-glucoside (isorhoifolin-4′-O-glucoside) [37]. Compounds 41 and 42 contained the same protonated molecules at m/z 625 [M + H]+ with the molecular formula C28H32O16, and were presumed to be isomers of diosmetin-6,8-di-C-glucoside [28] according to the literature. Compounds 44, 47, 48 contained a same MS2 ion fragment of m/z 301 [M + H]+, and their protonated molecules were at m/z 463.1240 [M + H]+, m/z 609.1802 [M + H]+, and m/z 609.1807 [M + H]+, respectively. According to the previous fragmentation patterns combined with literature reports, these four compounds were speculated to be diosmetin-7-O-glucoside, diosmetin-7-O-rutinoside (diosmin) [28], and diosmetin-7-O-neohesperidoside (neodiosmin) [28], respectively. Compound 45 was tentatively assigned to luteolin-7-O-rutinoside (veronicastroside) [36,37]. Compound 49 displayed protonated molecules at m/z 667.1886 [M + H]+ with molecular formula C30H34O17, and it was speculated to be diosmetin-7-O-(6″-O-acetyl) neohesperidoside according to the MS data (Table 1). The compounds 42, 43, 44, 45, 49, 51 were reported in AF for the first time.
2.1.5. Polymethoxyflavonoids
Polymethoxyflavonoids (PMFs) are based on the core aglycone structure that is modified by different numbers and/or positions of methoxyl/hydroxyl substituents [18]. The molecular weights of PMFs can be calculated in advance by adding n × 30 and/or n × 16 according to the basic flavone structure at 222 Da. Then, the chemical formula and the corresponding molecular weight of every possible PMF isomer can be designated, which is very helpful in speculating the structures of PMFs in the complex extracts of AF.
In the study, PMFs were analyzed in the positive ion mode due to the ideal protonated effect for these compounds. Compounds 59 and 65 were identified undisputed as 5,6,7,8,3′,4′-hexamethoxyflavone (nobiletin) [2,4] and 5,6,7,8,4′-pentamethoxyflavone (tangeretin) [2,4], respectively, based on the standard substances, retention times, accurate molecular weight and fragmentation patterns. Generally, these compounds tend to lose nCH3· and produce the ion fragment [M + H − n × 15]+, and on this basis, the molecular weights that are easy to lose include CH4 (16 Da), H2O (18 Da), CO (28 Da), CH4 + CH3 (31 Da), H2O + CH3·(33 Da), CO + CH3 (43 Da), CO2 (44 Da), H2O + CO (44 Da) and CO + H2O + CH3 (59 Da) [18,38]. For example, tangeretin contained the protonated molecules at m/z 373 [M + H]+ with molecular formula C28H32O16. In addition, prominent ions at m/z 358.1000 [M + H-CH3]+, m/z 343.0722 [M + H-2CH3]+, m/z 325.0655 [M + H-2CH3-H2O]+, and m/z 297.0697 [M + H-2CH3-H2O-CO]+ show a loss of 15 Da, 30 Da, 48 Da, and 76 Da, respectively.
According to the fragmentation patterns of PMFs, the literature, and the MS data (Table 1), 3-hydroxy-5,7,8-trimethoxyflavone (53) [18], 5-hydroxy-6,7,3′,4′-tetramethoxyflavone (54) [2,39], 5-hydroxy-6,7,3′,4′,5′-pentamethoxyflavone (55) [2,18], 5,7,8,3′,4′-pentamethoxyflavone (56) (isosinensetin) [2,18], 5,6,7,3′,4′-pentamethoxyflavone(57) (sinensetin), 5-hydroxy-6,7,8,3′,4′-pentamethoxyflavone(58) [18,39], 3,5,6,7,8,3′,4′-heptamethoxyflavone (60) [2,18], 5,6,7,4′-tetramethoxyflavone (61), 5-hydroxy-3,6,7,8,3′,4′-hexamethoxyflavone (62) [18], 5-hydroxy-3,6,7,8-tetramethoxyflavone (63) [18], 5,7,8,4′-tetramethoxyflavone (64) [18,39], 3-hydroxy-5,6,7,8,3′,4′-hexamethoxyflavone (66) (natsudaidai) [7,39], and 5-hydroxy-6,7,8,4′-tetramethoxyflavone (67) [7,39], were identified or assigned tentatively. Compounds 53, 55, 62 and 63 were reported in AF for the first time.
2.1.6. Triterpenoids
Triterpenoids, especially limonoids, are often reported in citrus plants. Studies have shown that they have good anti-tumor activity, and have antifeedant activity to insects [40]. A total of six triterpenoids were identified or speculated in AF by Q-TOF-MS analysis. Compound 68 was identified certainly as limonin [41] by comparing with a reference substance, the retention time and the precise molecular weight. Compound 73 was speculated to be an isomer of limonin [41] due to the same protonated molecule at m/z 471 [M + H]+ with the molecular formula C26H30O8. Compound 69 showed a deprotonated molecule at m/z 649.2482 [M − H]− with chemical formula C32H42O14, which was consistent with the literature, and presumed to be limonin-17-β-d-glucoside [41,42]. Similarly, Compound 70 displayed a deprotonated molecule at m/z 693.2753 [M − H]− with the chemical formula C34H46O15, and it can be presumed to be nominin-17-β-d-glucoside [42]. Compounds 71 and 72 were assigned tentatively to obacunoic acid-17-β-d-glucoside [42] and nomilinic acid-17-β-d-glucoside [41,42], respectively. Compounds 70, 71 and 73 were reported in AF for the first time.
2.1.7. Coumarins
A sum of nine compounds was identified or tentatively speculated as coumarins in the study. Compounds 76 and 82 were identified accurately as xanthotoxol [32,43] and auraptene [32], respectively, based on retention times, accurate molecular weights and comparison with reference substances. Compound 74 was preliminarily deduced as phellopterin [32,43] at a deprotonated molecule of m/z 301.1065 [M + H]+ with the chemical formula C17H16O5. Compound 75 and 80 contained the same deprotonated molecule (m/z 261 [M + H]+) with the chemical formula (C17H16O5), and they were identified tentatively as meranzin [44] and isomeranzin [36], respectively. Similarly, compounds 77, 78, 79 and 81 were tentatively identified as oxypeucedanin [6,32,43], scopoletin [34], epoxybergamottin [6,43], and osthol [6,32,43], respectively, based on MS information and literature data. Compounds 75, 78 were reported in AF for the first time.
2.1.8. Other Compounds
Compound 83 showed a deprotonated molecule at m/z 191.0188 [M − H]− with chemical formula C6H8O7, and was identified as citric acid [4,30], which commonly exists in citrus plants. Compound 84 displayed a protonated molecule at m/z 127.0388 [M + H]+ and MS2 ions at m/z 109.0289 [M + H]+, and was tentatively deduced to be 5-hydroxymethyl furfual [37]. Compound 85 showed a protonated molecule at m/z 481.1680 [M + H]+ with the chemical formula C23H28O11, and was assigned to paeoniflorin [31]. Compound 86 displayed a protonated molecule at m/z 625.2100 [M + H]+ with the chemical formula C29H36O15, and was tentatively deduced as magnoloside A [30]. Compound 84 and 85 were reported in AF for the first time.
2.2. Analysis of the Constituents of Volatile Oils Obtained from AF
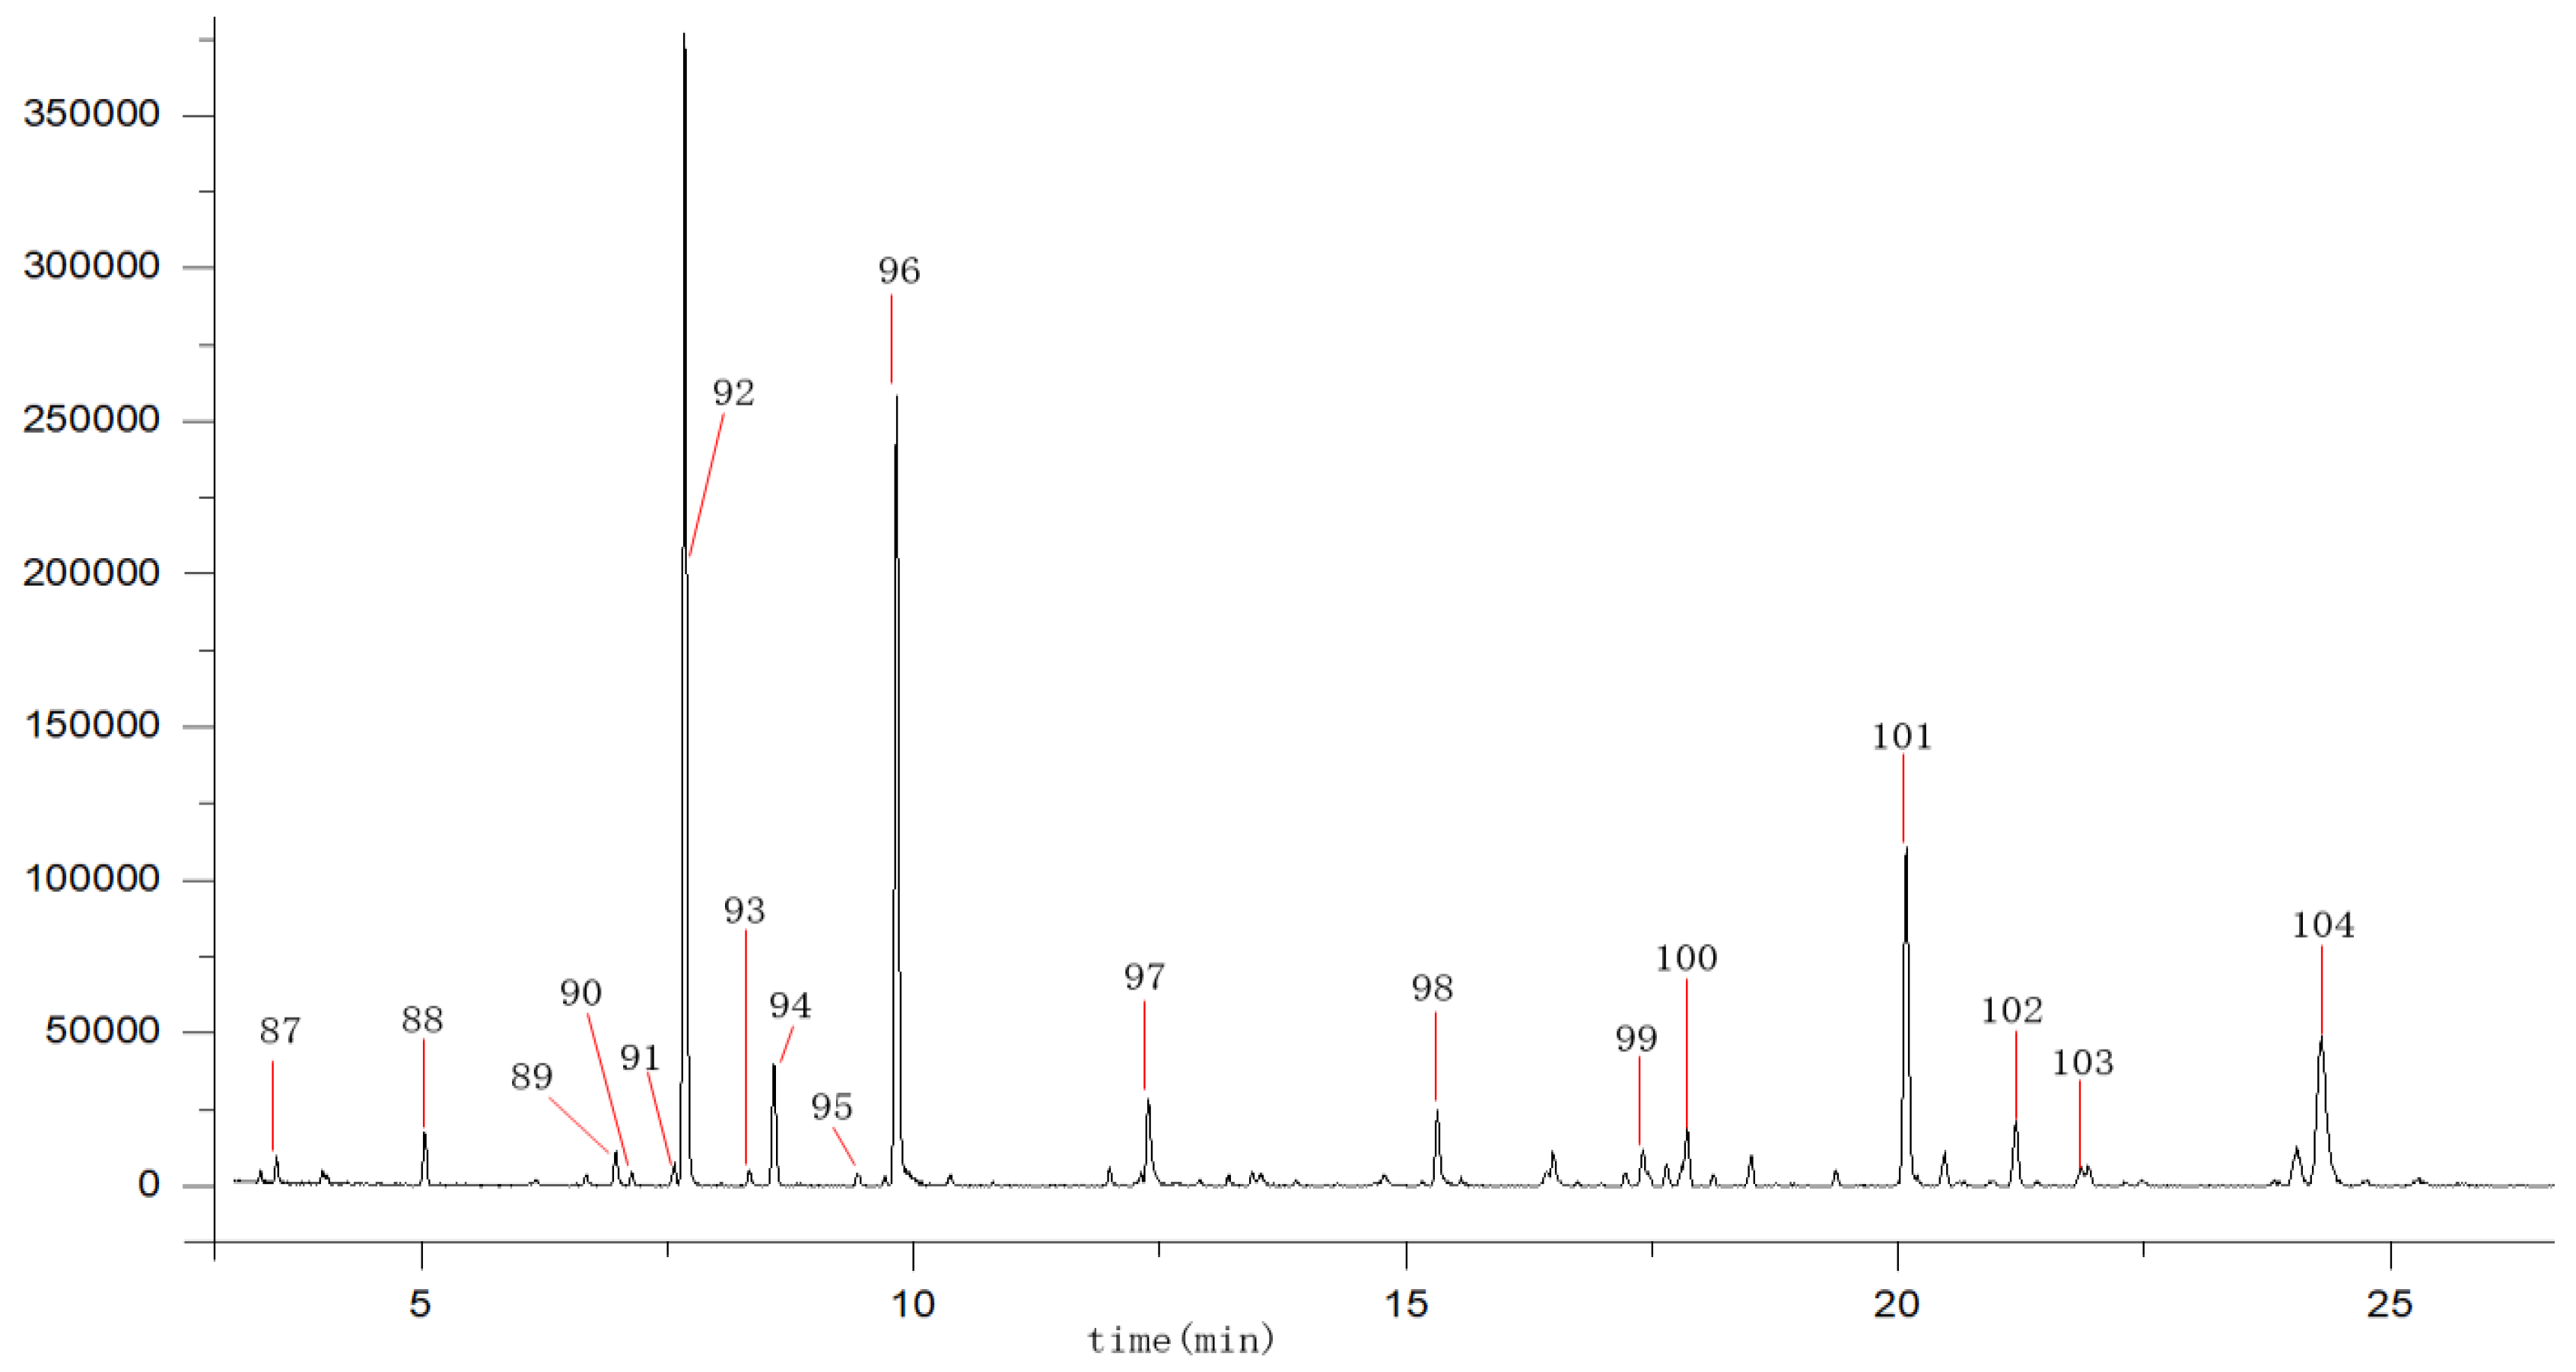
The volatile components of AF were extracted by supercritical fluid extraction technology (SFE), which is widely used in the extraction of low-pole components with the advantages of low energy consumption, no pollution, high extraction rate and good product purity. Separation of particular volatile components was carried out by means of the optimal GC-MS method, as shown in Figure 2. Then, the AF volatiles were identified by the comparison of their mass spectra with those recorded in the National Institute of Standards and Technology mass spectral library (NIST05a.L). A total of 18 volatile compounds [1,8] were identified, as shown in Table 2. The structures of these compounds were drawn as shown in Figure S2.
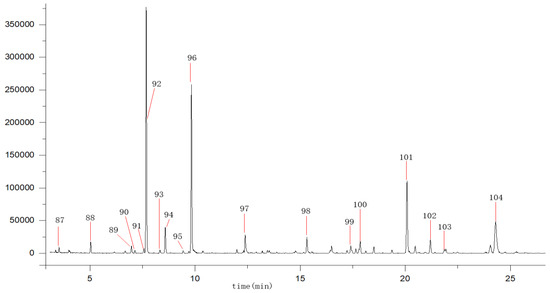
Figure 2.
Total ion chromatgraphy of the volatile oils from Aurantii fructus.
Table 2.
Identification of 18 aromatic constituents from Aurantii fructus by the GC-MS method.
The data in Table 2 illustrate the relative amount of each component detected in the AF volatiles (calculated with their relative peak areas). d-limonene (92) and linalool (96) were identified as the main aromatic components. In additional, volatile constituents such as (−)-α-pinene (88), α-Phellandrene (89), 3-carene (90), Ocimene (93), 4-carene (94) Cyclohexene (95), and terpineol (97) were commonly found in AF by comparing literature data [1,8]. Four volatile constituents included thymol (98), copaene (100), 1.6-cyclodecadiene (101) and (+)-aromadendrene (103), which were identified in AF for the first time.
2.3. Selection of the Quantitative Chemical Markers from AF
The effective constituents obtained from AF are complex and various, according to a previous qualitative study. For the selection of quantitative chemical markers, four main principles are followed [45]. First, they are components absorbed in vivo. Generally, the components absorbed in vivo are considered as potential directly effective materials with therapeutic effects. Second, the quantitative markers should also exhibit the same or similar activity as indicative of the TCM. Third, in consideration of the quality control of TCM, quantitative markers should be found from different individual samples in the TCM. Another important point is that the quantitative markers of different samples should be taken into account to ensure the improvement of practicality, based on the Chinese Pharmacopoeia (2015 edition).
In previous studies, flavanones such as naringenin, naringin, narirutin, neohesperidin, hesperidin, neoeriocitrin and poncirin were identified as the main bioactive components absorbed in rat plasma after oral administration of AF extract [5,46,47]. Moreover, PMFs, such as nobiletin and tangeretin, were also absorbed as constituents, because they were found in rat plasma [16,46]. Many investigations have explored that the main pharmacological effects of these flavonoids, and mainly focus on regulating gastrointestinal dysmotility [12,14,15], which was consistent with the traditional clinic application of AF. These compounds were easily detected from different samples of AF, but only naringin and neohesperidin are defined as the chemical markers in the Chinese Pharmacopoeia (2015 edition). Hence, the quality control for AF should be comprehensively considered and established based on multiple pharmacodynamic substances. Except for naringin and neohesperidin, ten other components (eriocitrin, neoeriocitrin, narirutin, hesperidin, poncirin, naringenin, hesperetin, nobiletin, tangeretin, auraptene) were selected as quantitative chemical markers in order to establish a comprehensive quality control for AF.
2.3.1. Optimization of Chromatographic Conditions
Due to the variety and complexity of the constituents in AF, it is necessary to establish a chromatographic separation method with specificity for the analysis of all the chemical markers. Therefore, several experimental parameters that influence the separation performance of the proposed HPLC method were investigated and optimized in the study.
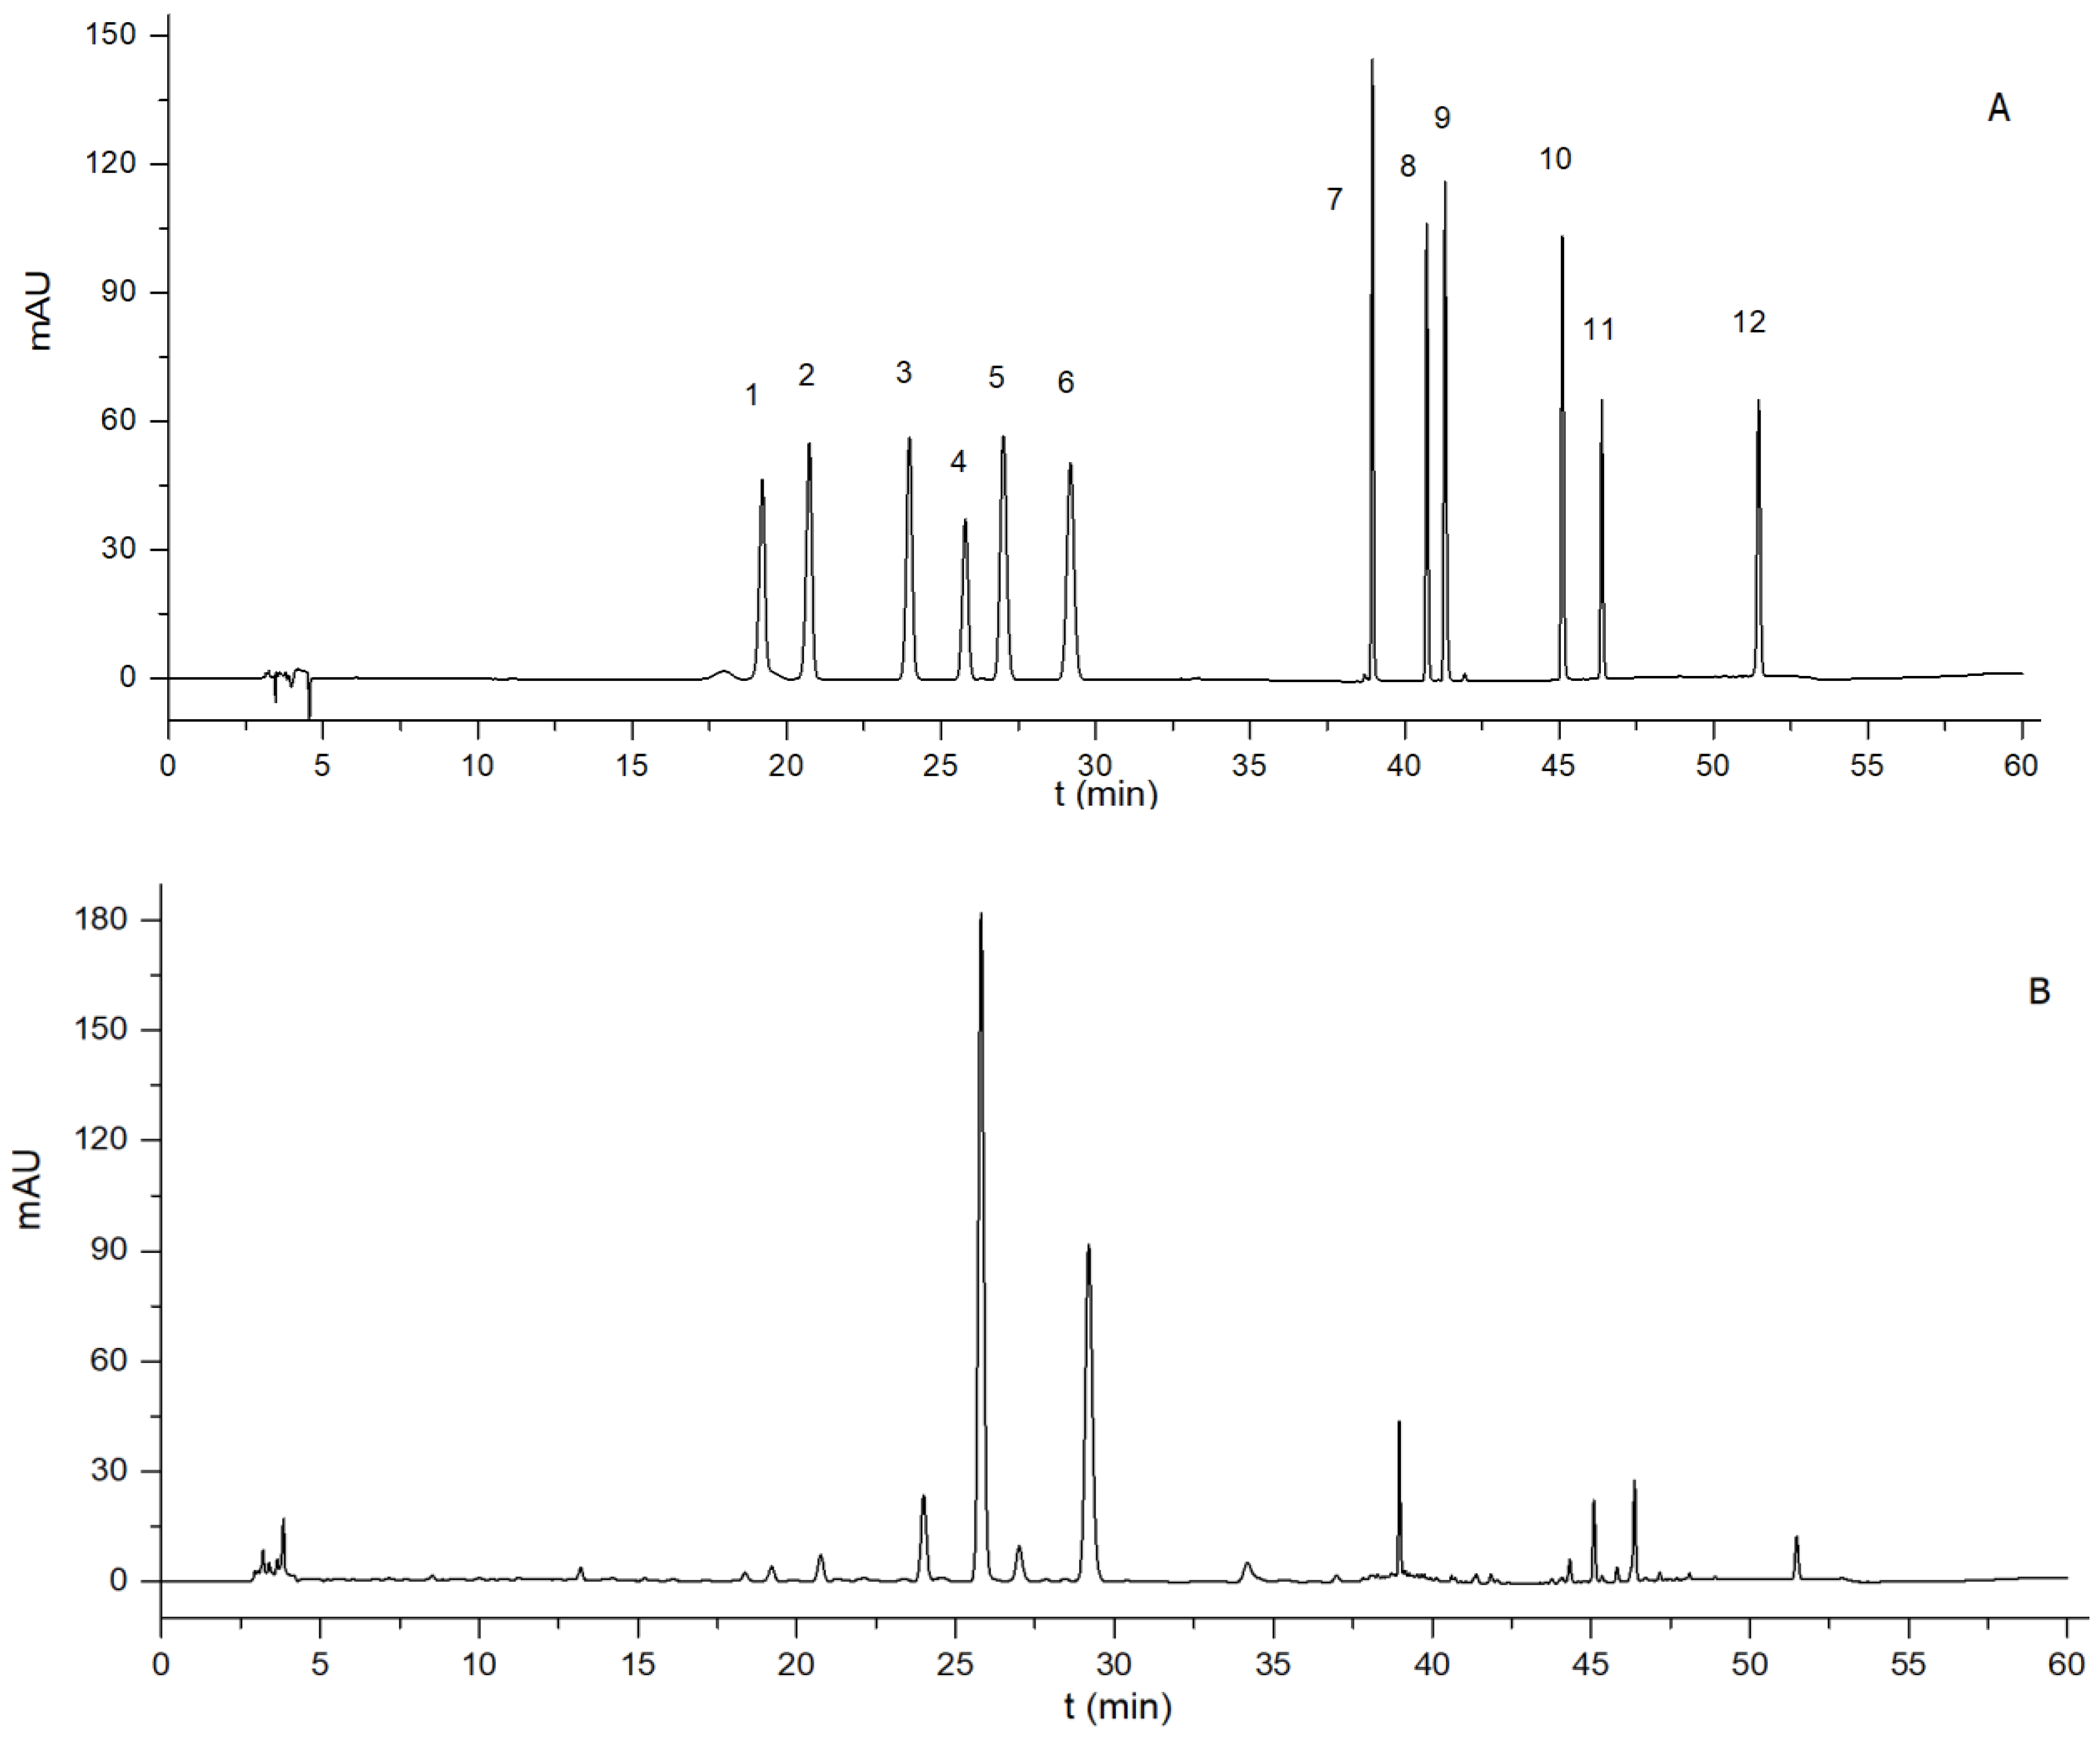
For example, acetonitrile-water was selected as the mobile phase, due to its better separation of peaks compared with methanol-water in this study, and formic acid was added in the mobile phase to improve the tail behavior of the flavonoids. Full-wavelength scanning was performed during the analysis of AF because of the difference in maximum absorption wavelength of these compounds. The main absorption wavelengths of these markers are 273 nm, 284 nm, and 325 nm, respectively. According to the analysis of preliminary experiments, the final wavelength was set to 284 nm, which exhibited good detection of these chemical markers. Moreover, the flow rate of the mobile phase, column temperature and injection volume were also optimized via pre-experience at an efficient level, and the solvents saved. These markers were well separated and directly determined, as shown in Figure 3, which was conducive to the HPLC quantitative analysis of AF.
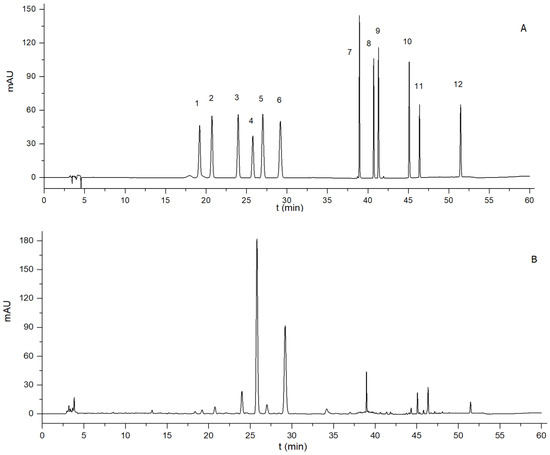
Figure 3.
HPLC chromatograms of 12 chemical markers (A) and an Aurantii fructus sample (B). (1. eriocitrin, 2. neoeriocitrin, 3. narirutin, 4. naringin, 5. hesperidin, 6. neohesperidin, 7. poncirin, 8. naringenin, 9. hesperetin, 10. nobiletin, 11. tangeretin, 12. auraptene).
2.3.2. Methodological Verification
Calibration and verification of analytical methods are very important for quality assurance (QA) and quality control (QC) in practical applications. The feasibility of the chromatographic method for determining these bioactive markers should be evaluated via methodological verification including linearity, the limits of detection (LOD) and quantification (LOQ), precision, stability, repeatability and recovery. The analysis was performed by HPLC, and the linearity, precision, accuracy, recovery of each bioactive marker, and the stability of this method were analyzed as listed in Table 3.
Table 3.
Linearity, LOD, LOQ, precision, repeatability, stability and recovery of the 12 chemical markers.
The high-correlation coefficient values (r > 0.9995) obtained indicated that there were good linear correlations between the concentrations of the relative standard deviations (RSDs) of investigated compounds and their peak areas within the test concentrations, and the obtained LODs and LOQs were less than 0.21 μg/mL and 0.67 μg/mL, respectively. The precision, repeatability, and stability for each compound was less than 1.97%, 3.50%, and 3.38%, respectively. In addition, the developed method showed good recoveries at a range of 98.35%–102.95%. The results indicated that the HPLC method was efficient, accurate, and sensitive for quantitative determination of the major chemical markers in AF.
2.3.3. Quantitative Determination of the Chemical Markers in AF
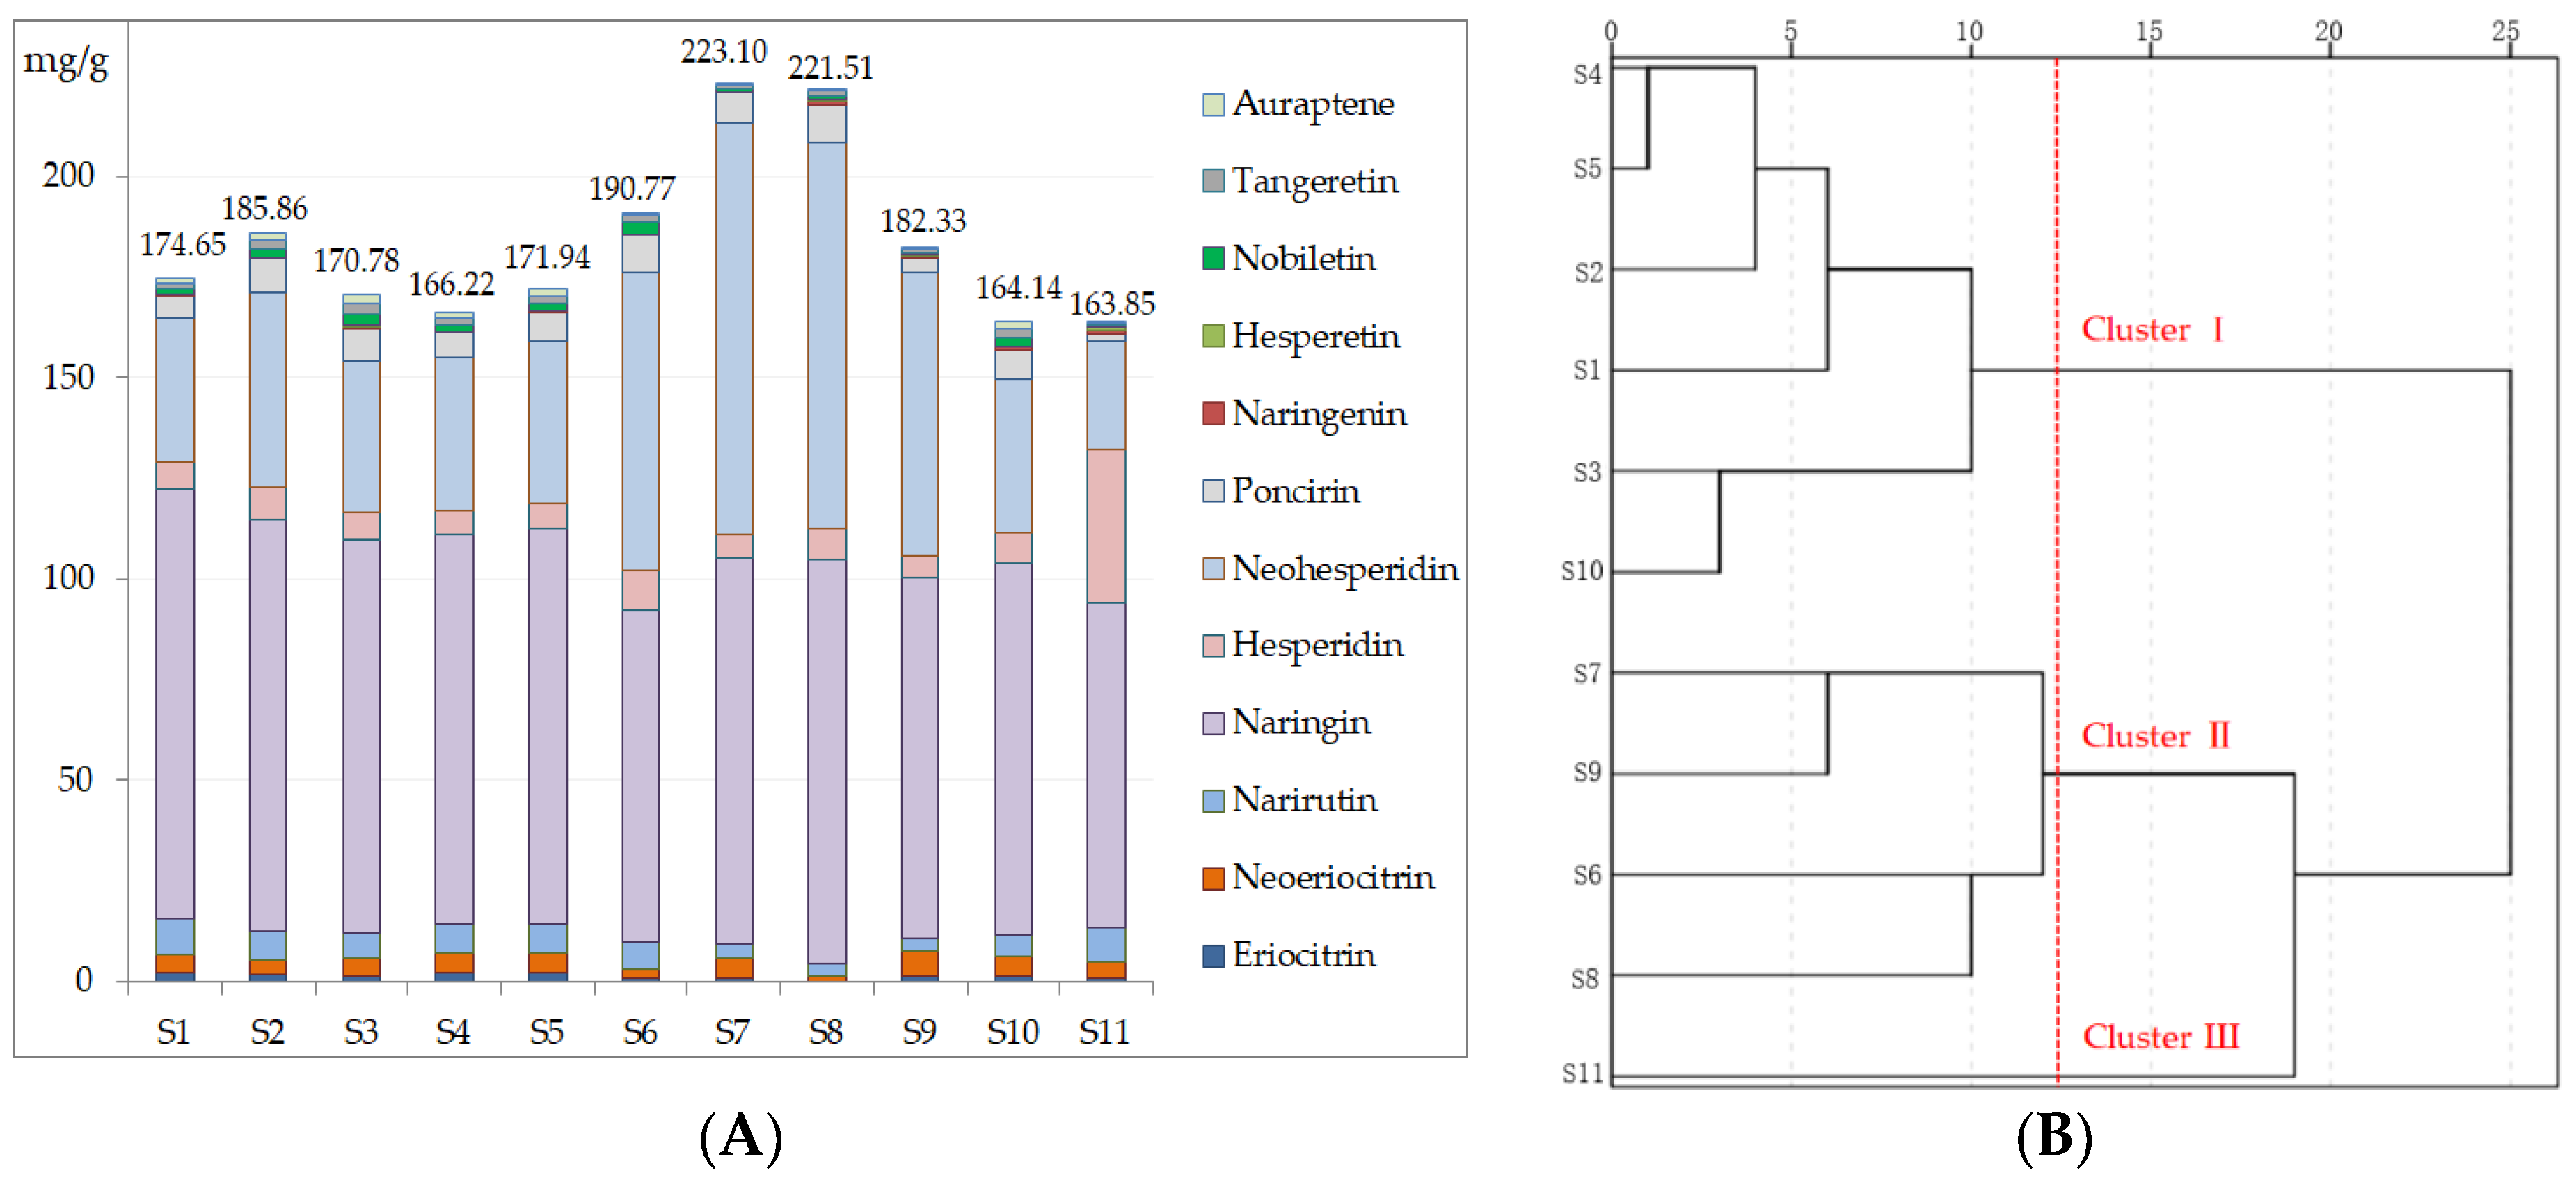
Different samples of AF (Table S1) were analyzed by the proposed method to determine the 12 chemical markers by HPLC. The quantitative results are presented in Figure 4A. Naringin and neohesperidin were the main constituents, the contents of which varied from 80.40–106.81 mg/g, and 26.97–102.3 mg/g in 11 samples, respectively. All the samples were in accordance with the standards of the Chinese Pharmacopoeia except for batch 11, because it might be a variety. In addition, it was found that narirutin, hesperidin, poncirin, and neoeriocitrin were also considerably varied from 2.87-9.15 mg/g, 5.10–38.14 mg/g, 1.80–9.40 mg/g, and 1.27–6.48 mg/g, respectively (Table S2). Meanwhile, the content of 12 markers in 11 samples had a relatively large variation. Therefore, it was recommendable to evaluate the quality in different samples of AF.
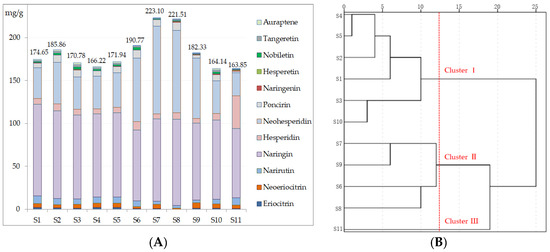
Figure 4.
Contents of quantitative markers in Aurantii fructus from 11 different samples (A). Hierarchical clustering dendrogram of 11 samples of Aurantii fructus based on the quantitative analysis (B).
Hierarchical cluster analysis was performed based on the quantitative determination results from the different samples of AF in order to finding relatively homogeneous clusters. The contents of the 12 components in AF samples were defined as the variables in the analysis to differentiate and classify the 11 samples. In the dendrogram, the quantitative relationship reflected the degree of similarity between different AF samples. As shown in Figure 4B, 11 samples could be divided into three main clusters. Generally, samples with common contents of the compounds, such as samples 1, 2, 3, 4, 5, and 10, were arranged to be a clusters (I) in normal content range of the 12 chemical markers. Higher contents of the markers in the samples 6, 7, 8 and 9 were gathered to clusters II with high quality. Sample 11 was a single, generated as clusters III. Because of the huge difference content of the main chemical markers, naringin and neohesperidin in the sample were lower than other samples, but with a higher content of hesperidin (Figure 4A). The different samples of AF were discriminated by hierarchical cluster analysis for quality evaluation.
3. Materials and Methods
3.1. Materials, Chemicals and Reagents
Eleven samples of Aurantii fructus (AF) samples from different habitats were collected and identified by Associate Professor Tang Qi. Reference standards included synephrine, eriocitrin, neoeriocitrin, rutin, narirutin, naringin, hesperidin, neohesperidin, limonin, xanthotol, poncirin, naringenin, hesperetin, nobiletin, tangeretin and auraptene with a purity of over 98% were purchased from Yuan-ye Bio-Technology Co., Ltd. (Shanghai, China). Chromatographic grade formic acid, methanol, ethanol and acetonitrile were purchased from Sinopharm Chemical Reagent Co., Ltd. (Shanghai, China) and used for extractive and analytical procedures.
3.2. HPLC-Q-TOF-MS Conditions
Mass spectrum identification was performed on an Agilent 1290 HPLC system (Agilent Technologies, Palo Alto, CA, USA) combined with an accurate Agilent 6530 Q-TOF-MS mass spectrometer. Chromatographic separations used an XAqua C18 (2.1 × 150 mm, 5 μm, Agilent Technologies, Acchrom Technologies Co., Ltd, Beijing, China), the mobile phase A was deionized water (0.1% formic acid), and the mobile phase B was acetonitrile. The injection volume was 10 μL and the flow rate was 0.7 mL/min. The detection wavelength was set to 284 nm and the column temperature was maintained at 30 °C. The gradient elution procedure was optimized as follow: 0~10 min, 0~3.5% B; 10~13 min, 3.5~5% B; 13~18 min, 5~15% B; 18~21 min, 15~17.5% B; 21~32 min, 17.5~22% B; 32~44 min, 22~31% B; 44~58 min, and 31~90% B. Then, the effluent of the HPLC mobile phase was split (10:1) and guided into the electrospray ionization (ESI) source. MS conditions were performed as follow: Capillary voltage, 3500 V; nebulizer pressure, 50 psi; nozzle voltage, 1000 V; flow rate of drying gas, 6 L/min; temperature of sheath gas, 350 °C; flow rate of sheath gas, 11 L/min; skimmer voltage, 65 V; OCT1 RF Vpp, 750 V; fragmentor voltage, 135 V. The mass information was recorded in the range of m/z 100–1000 Da. The MS2 data of the selected targets were analyzed by regulating multilevel collision energy (18–45 eV). Data handling of the chemical compounds of AF was analyzed by the Mass Hunter Qualitative Analysis B.04.00.
3.3. GC-MS Conditions
GC-MS analysis of volatile oils was performed on an Agilent 6850 Network GC System coupled to an Agilent 5975C VL Mass Selective Detector (MSD). An HP-5 MS capillary column (30.0 m × 250 μm × 0.25 μm) was used for the separation. Helium (purity 99.99%) was employed as the carrier gas, with a flow rate of 3.0 mL/min. The splitting ratio was set at 10:1. The injection volume was 1.0 μL and the interface temperature to 250 °C. The MS source temperature was set to 230 °C and the MS quadrupole temperature to 150 °C. The mass spectra plot was acquired using the full scan monitoring mode with a mass scan range of m/z 45–450. The column temperature was initially set at 50 °C (3 min held) and programmed to rise at 5 °C/min to 220 °C (3 min held), 5 °C/min to 250 °C (3 min held), and 5 °C/min to 310 °C (3 min held).
3.4. HPLC Quantitative Determination Conditions
An Agilent 1260 HPLC system with a ZORBAX SB-C18 column (4.6 mm × 250 mm, 5 μm, Agilent Technologies, Palo Alto, CA, USA) was employed for the determination of chemical markers in AF. The mobile phases, injection volume, flow rate, detection wavelength and column temperature were consistent with Section 3.2, but with a little difference in the elution procedure as follows: 0~5 min, 10~15% B; 5~10 min, 15~18% B; 10~15 min, 18~20% B; 15~20 min, 20~22% B; 20~25 min, 22~22% B; 25~30 min, 22~25% B; 30~32 min, 25~28% B; 32~35 min, 28~50% B; 35~38 min, 50~50% B; 38~40 min, 50~65% B; 40~43 min, 65~90% B; 43~48 min, 90~90% B; 48~50 min, 90~10% B; 50~55 min, 10% B.
3.5. Preparation of Samples and Standards
3.5.1. Preparation of AF Extract (Ethanol Solution)
The conditions were optimized in our previous study via response surface methodology. In short, 50 mg of each AF sample was added to 20 mL of 58% ethanol, and extracted for 17 min in a 70 °C water bath by use of an ultrasonic instrument with a constant power (200 W, 40 Hz). After the process, the solution weight was re-adjusted and complement, then the extract solution was filtered through a 0.22 μm membrane for further direct Q-TOF-MS analysis and HPLC determination. This extraction procedure was fast, low energy, low solvent consumption, and low toxicity, and could be considered to be an economical preparation method.
3.5.2. Preparation of AF Extract (Volatile Oils)
A 500 g AF sample was added into the supercritical fluid extraction device. The conditions of the device included temperature (50 °C), pressure (20 Mpa), time (2 h) and flow of CO2 (2 L/h), and were improved. Then, the volatile oils were sealed immediately for direct GC-MS analysis. This extraction method was a friendly procedure with low volatility and no toxicity.
3.5.3. Preparation of Mixed Standard Solution
The standards of eriocitrin (0.39 mg), neoeriocitrin (0.38 mg), narirutin (0.41 mg), naringin (0.44 mg), hesperidin (0.37 mg), neohesperidin (0.42 mg), poncirin (0.44 mg), naringenin (0.44 mg), hesperetin (0.45 mg), nobiletin (0.39 mg), tangeretin (0.38 mg), and auraptene (0.36 mg) were dissolved in 0.5 mL of methanol to obtain the mixed standard solution. A series of concentration gradients were prepared by serial dilution and were filtered through a 0.22 μm membrane and directly determined.
3.6. Validation of Quantitative Analysis HPLC
To determine the limits of detection and quantification, methanol stock solution containing the 12 reference compounds was diluted into a series of appropriate concentrations with the same solvent, and aliquots of the diluted solutions were injected into HPLC for analysis. The limits of detection (LOD) and quantification (LOQ) under the present chromatographic conditions were determined at S/N (the ratios of signal to noise) of three and 10, respectively. Calibration curves were fitted by HPLC response for at least seven appropriate concentrations in triplicate of each markers. The precision was investigated by analyzing a proper calibration sample with the chromatographic system and repeated six times. For repeatability, the mixed solution was examined for six replicates within one day. To investigate the stability of the sample, the sample solution was analyzed at different time points (0, 1, 2, 4, 6, 12, 18, and 24 h). To evaluate the accuracy of the analytical method, the recovery study was measured by analyzing spiked samples. A certain amount of reference substances (low, medium, and high concentrations) were added into a certain amount of AF samples, respectively, and then were extracted and analyzed under the proposed method.
4. Conclusions
A sum of 104 compounds were identified or tentatively assigned in this study from ethanol extraction and volatile oils of AF by HPLC-Q-TOF-MS and GC-MS methods. The detailed chemical composition of AF was systematically illustrated and classified by comparing retention times, MS spectra of exact mass, fragmentation behaviors and data previously reported on this issue. Among them, 41 compounds were reported in AF for the first time. This provides the basic chemical data for further pharmacological and clinical research. Then, the direct quantitative determination of 12 biochemical markers for AF was efficiently established by the HPLC method that could be suitable for the quality control of AF. The main advantage of the proposed method is the low required amount of the sample, low organic solvents, and low energy consumption, from sample preparation to analytical procedures. Thus, it could be considered an efficient method for analysis and determination of AF samples [22,48]. We anticipate that this research will become an important basis for better comprehension of the pharmacological profiles and for practical application of the QA and QC of AF, which should be developed into a high quality traditional Chinese medicine and health functional foods in the future.
Supplementary Materials
The following are available online at http://www.mdpi.com/1420-3049/23/9/2189/s1, Figure S1: Structures of 86 compounds form ethanol extract of Aurantii fructus. Figure S2: Structures of 18 compounds in volatile oils of Aurantii fructus. Table S1: 11 samples of Aurantii fructus obtained from different habitats. Table S2: Contents of chemical markers in Aurantii fructus from11 different samples (mg/g).
Author Contributions
Y.H., H.X. and Q.T. conceived and designed the experiments; Y.H., Z.L., W.W., Y.S., Y.C., performed the experiments and designed the figures; Y.H., Z.L., Y.S. and Y.C. analyzed and helped in data interpretation; Q.T. and Q.W. collected the materials; Y.H. wrote the manuscript; S.R.S. and H.X. edited and supported constructive suggestions for the manuscript.
Funding
This research was funded by the China Agriculture Research System (No. CARS-21), the Project of Hunan Science and Technology Innovation (No. S2017SFXYZ0116), the Major Projects of Hunan Provincial Science and Technology Department (No. 2015SK1001, 2014SK2005), the Project of Hunan Natural Science Foundation (No. 2017JJ2119) and the Project of Hunan Postgraduate Research and Innovation (No. CX2016B311).
Conflicts of Interest
The authors declare no conflicts of interest.
References
- Li, P.; Zeng, S.L.; Duan, L.; Ma, X.D.; Dou, L.L.; Wang, L.J.; Li, P.; Bi, Z.M.; Liu, E.H. Comparison of Aurantii Fructus Immaturus and Aurantii Fructus based on multiple chromatographic analysis and chemometrics methods. J. Chromatogr. A 2016, 1469, 96–107. [Google Scholar] [CrossRef] [PubMed]
- Lin, Z.; Wang, H.; Xu, Y.; Dong, J.; Hashi, Y.; Chen, S. Identification of antioxidants in Fructus aurantii and its quality evaluation using a new on-line combination of analytical techniques. Food Chem. 2012, 134, 1181–1191. [Google Scholar] [CrossRef] [PubMed]
- Zhou, D.Y.; Zhang, X.L.; Xu, Q.; Xue, X.Y.; Zhang, F.F.; Liang, X.M. UPLC/Q-TOFMS/MS as a powerful technique for rapid identification of polymethoxylated flavones in Fructus aurantia. J. Pharmaceut. Biomed. 2009, 50, 2–8. [Google Scholar] [CrossRef] [PubMed]
- Liu, X.; Gu, Z.; Guo, Y.; Liu, J.; Ma, M.; Chen, B.; Wang, L. Rapid analysis of Aurantii Fructus Immaturus (Zhishi) using paper spray ionization mass spectrometry. J. Pharm. Biomed. Anal. 2017, 137, 204–212. [Google Scholar] [CrossRef] [PubMed]
- Zhang, J.; Gao, W.; Liu, Z.; Zhang, Z.; Liu, C. Systematic Analysis of Main Constituents in Rat Biological Samples after Oral Administration of the Methanol Extract of Fructus Aurantii by HPLC-ESI-MS/MS. IJPR 2014, 13, 493–503. [Google Scholar] [PubMed]
- Zhao, S.Y.; Liu, Z.L.; Shu, Y.S.; Wang, M.L.; He, D.; Song, Z.Q.; Zeng, H.L.; Ning, Z.C.; Lu, C.; Lu, A.P.; et al. Chemotaxonomic Classification Applied to the Identification of two closely-related citrus TCMs using UPLC-Q-TOF-MS-based metabolomics. Molecules 2017, 22, 1721. [Google Scholar] [CrossRef] [PubMed]
- Chen, H.F.; Zhang, W.G.; Yuan, J.B.; Li, Y.G.; Yang, S.L.; Yang, W.L. Simultaneous quantification of polymethoxylated flavones and coumarins in Fructus Aurantii and Fructus Aurantii immaturus using HPLC-ESI-MS/MS. J. Pharm. Biomed. Anal. 2012, 59, 90–95. [Google Scholar] [CrossRef] [PubMed]
- Zhang, H.; Xie, Y.; Liu, C.; Chen, S.; Hu, S.; Xie, Z.; Deng, X.; Xu, J. Comprehensive comparative analysis of volatile compounds in citrus fruits of different species. Food Chem. 2017, 230, 316–326. [Google Scholar] [CrossRef] [PubMed]
- Li, L.; Zhang, S.; Xin, Y.; Sun, J.; Xie, F.; Yang, L.; Chen, Z.; Chen, H.; Liu, F.; Xuan, Y.; You, Z. Role of quzhou Fructus Aurantii extract in preventing and treating acute lung injury and inflammation. Sci. Rep. 2018, 8, 1698. [Google Scholar] [CrossRef] [PubMed]
- Liu, X.Y.; Fan, M.L.; Wang, H.Y.; Yu, B.Y.; Liu, J.H. Metabolic profile and underlying improved bio-activity of Fructus Aurantii immaturus by human intestinal bacteria. Food Funct. 2017, 8, 2193–2201. [Google Scholar] [CrossRef] [PubMed]
- Su, M.S.; Shyu, Y.T.; Chien, P.J. Antioxidant activities of citrus herbal product extracts. Food Chem. 2008, 111, 892–896. [Google Scholar] [CrossRef]
- Tan, W.; Li, Y.; Wang, Y.; Zhang, Z.; Wang, T.; Zhou, Q.; Wang, X. Anti-coagulative and gastrointestinal motility regulative activities of Fructus Aurantii Immaturus and its effective fractions. Biomed. Pharmacother. 2017, 90, 244–252. [Google Scholar] [CrossRef] [PubMed]
- Kang, M.; Kim, J.H.; Cho, C.; Chung, H.S.; Kang, C.W.; Kim, Y.; Shin, M.; Hong, M.; Bae, H. Anti-ischemic effect of Aurantii Fructus on contractile dysfunction of ischemic and reperfused rat heart. J. Ethnopharmacol. 2007, 111, 584–591. [Google Scholar] [CrossRef] [PubMed]
- Jiang, Y.; Bai, X.; Zhu, X.; Li, J. The effects of Fructus Aurantii extract on the 5-hydroxytryptamine and vasoactive intestinal peptide contents of the rat gastrointestinal tract. Pharm. Biol. 2014, 52, 581–585. [Google Scholar] [CrossRef] [PubMed]
- Xiong, X.; Peng, W.; Chen, L.; Liu, H.; Huang, W.; Yang, B.; Wang, Y.; Xing, Z.; Gan, P.; Nie, K. Traditional Chinese medicine Zhiqiao-Houpu herb-pair induce bidirectional effects on gastric motility in rats. J. Ethnopharmacol. 2015, 175, 444–450. [Google Scholar] [CrossRef] [PubMed]
- Zhou, D.Y.; Xing, R.; Xu, Q.; Xue, X.Y.; Zhang, F.F.; Liang, X.M. Polymethoxylated flavones metabolites in rat plasma after the consumption of Fructus Aurantii extract: Analysis by liquid chromatography/electrospray ion trap mass spectrometry. J. Pharm. Biomed. Anal. 2008, 46, 543–549. [Google Scholar] [CrossRef] [PubMed]
- Ding, Y.Q.; Xiong, Y.; Zhou, B.; Deng, M.Z.; Deng, K.Z. Isolation and structural identification of flavonoids from Aurantii Fructus. China J. Chin. Mater. Med. 2015, 40, 2352–2356. [Google Scholar]
- Xing, T.T.; Zhao, X.J.; Zhang, Y.D.; Li, Y.F. Fast separation and sensitive quantitation of polymethoxylated flavonoids in the peels of citrus using UPLC-Q-TOF-MS. J. Agric. Food Chem. 2017, 65, 2615–2627. [Google Scholar] [CrossRef] [PubMed]
- Liu, S.; Chen, P.; Zhang, N.; Sun, L.; Dai, G.; Zhu, L.; Li, C.; Zhao, Y.; Zhang, L.; Fu, H.; et al. Comprehensive characterization of the in vitro and in vivo metabolites of limonin in human samples using LC-Q-TOF/MS. J. Chromatogr. B Anal. Technol. Biomed. Life Sci. 2017, 1068–1069, 226–232. [Google Scholar] [CrossRef] [PubMed]
- Ma, X.; Lv, B.; Li, P.; Jiang, X.; Zhou, Q.; Wang, X.; Gao, X. Identification of “multiple components-multiple targets-multiple pathways” associated with naoxintong capsule in the treatment of heart diseases using UPLC/Q-TOF-MS and network pharmacology. Evid. Based Complement. Alternat. Med. 2016, 2016, 9468087. [Google Scholar] [CrossRef] [PubMed]
- Commission, C.P. Pharmacopoeia of the People Republic of China; Chinese Medical Science and Technology Press: Beijing, China, 2015. [Google Scholar]
- Galuszka, A.; Konieczka, P.; Migaszewski, Z.M.; Namiesnik, J. Analytical Eco-Scale for assessing the greenness of analytical procedures. Trend. Anal. Chem. 2012, 37, 61–72. [Google Scholar] [CrossRef]
- Wang, S.; Tu, H.; Wan, J.; Chen, W.; Liu, X.; Luo, J.; Xu, J.; Zhang, H. Spatio-temporal distribution and natural variation of metabolites in citrus fruits. Food Chem. 2016, 199, 8–17. [Google Scholar] [CrossRef] [PubMed]
- Zaher, A.M.; Makboul, M.A.; Moharram, A.M.; Calderon, A.I. LC-MS metabolite fingerprinting and MtSK-based screening of an endophyte Bartalinia pondoensis Marinc of Citrus aurantum L. J. Chromatogr. B Anal. Technol. Biomed. Life Sci. 2014, 970, 18–23. [Google Scholar] [CrossRef] [PubMed]
- Kuroyanagi, M.; Ishii, H.; Kawahara, N.; Sugimoto, H.; Yamada, H.; Okihara, K.; Shirota, O. Flavonoid glycosides and limonoids from Citrus molasses. J. Nat. Med 2008, 62, 107–111. [Google Scholar] [CrossRef] [PubMed]
- Matsubara, Y.; Yusa, T.; Sawabe, A.; Iizuka, Y.; Takekuma, S.; Yoshida, Y. Structures of new cyclic peptides in young unshiu (Citrus unshiu Marcov.), orange (Citrus sinensis Osbeck.) and amanatsu (Citrus natsudaidai) peelings. Agric. Biol. Chem. 1991, 55, 2923–2929. [Google Scholar] [PubMed]
- He, Y.; Cheng, P.; Wang, W.; Yan, S.; Tang, Q.; Liu, D.; Xie, H. Rapid Investigation and Screening of Bioactive Components in Simo Decoction via LC-Q-TOF-MS and UF-HPLC-MD Methods. Molecules 2018, 23, 1792. [Google Scholar] [CrossRef] [PubMed]
- Bagatela, B.S.; Lopes, A.P.; Cabral, E.C.; Perazzo, F.F.; Ifa, D.R. High-performance thin-layer chromatography/desorption electrospray ionization mass spectrometry imaging of the crude extract from the peels of Citrus aurantium L. (Rutaceae). Rapid Commun. Mass Spectrom. 2015, 29, 1530–1534. [Google Scholar] [CrossRef] [PubMed]
- Peng, G.P.; He, M.; Xu, L.H. Studies on the active constituents of Fructus Aurantii immaturus. J. Nanjing Univ. Tradit. Chin. Med. 2001, 17, 2. [Google Scholar]
- Li, Y.Y.; Wang, M.R.; Zhang, Q.Q.; Tian, Y.; Xu, F.G.; Zhang, Z.J. Chemical differentiation of Da-Cheng-Qi decoction and its three analogous decoctions using UFLC-IT-TOF/MS-based chemomic and chemometric approach. Anal. Methods 2014, 6, 1720–1727. [Google Scholar] [CrossRef]
- Zhou, W.J.; Song, J.Z.; Fu, W.W.; Tan, H.S.; Bian, Z.X.; Xu, H.X. Chemical comparison of two dosage forms of Hemp Seed Pills by UHPLC-Q-ToF-MS/MS and multivariate statistical techniques. J. Pharm. Biomed. Anal. 2013, 84, 59–68. [Google Scholar] [CrossRef] [PubMed]
- Durand-Hulak, M.; Dugrand, A.; Duval, T.; Bidel, L.P.; Jay-Allemand, C.; Froelicher, Y.; Bourgaud, F.; Fanciullino, A.L. Mapping the genetic and tissular diversity of 64 phenolic compounds in Citrus species using a UPLC-MS approach. Ann. Bot. 2015, 115, 861–877. [Google Scholar] [CrossRef] [PubMed]
- Li, C.; Gu, H.; Dou, H.; Zhou, L. Identification of flavanones from peel of Citrus changshan-huyou, YB Chang, by HPLC–MS and NMR. Eur. Food Res. Technol. 2007, 225, 777–782. [Google Scholar] [CrossRef]
- Liu, W.Y.; Zhou, C.; Yan, C.M.; Xie, S.L.; Feng, F.; Wu, C.Y.; Xie, N. Characterization and simultaneous quantification of multiple constituents in Aurantii Fructus Immaturus extracts by HPLC-DAD-ESI-MS/MS. Chin. J. Nat. Med. 2012, 10, 456–463. [Google Scholar] [CrossRef]
- Song, Z.L.R. Identification of flavonoid metabolites of Fructus Aurantii Immaturus in rat biological samples by liquid chromatography-tandem mass spectrometry. J. Chin. Pharm. Univ. 2010, 41, 9. [Google Scholar]
- Mencherini, T.; Campone, L.; Piccinelli, A.L.; Mesa, M.G.; Sanchez, D.M.; Aquino, R.P.; Rastrelli, L. HPLC-PDA-MS and NMR characterization of a hydroalcoholic extract of Citrus aurantium L. var. amara peel with antiedematogenic activity. J. Agric. Food Chem. 2013, 61, 1686–1693. [Google Scholar] [CrossRef] [PubMed]
- Ye, X.; Cao, D.; Zhao, X.; Song, F.; Huang, Q.; Fan, G.; Wu, F. Chemical fingerprint and metabolic profile analysis of Citrus reticulate ‘Chachi’ decoction by HPLC-PDA-IT-MS(n) and HPLC-Quadrupole-Orbitrap-MS method. J. Chromatogr. B Anal. Technol. Biomed. Life Sci. 2014, 970, 108–120. [Google Scholar] [CrossRef] [PubMed]
- Zhou, D.Y.; Chen, D.L.; Xu, Q.; Xue, X.Y.; Zhang, F.F.; Liang, X.M. Characterization of polymethoxylated flavones in Fructus Aurantii by liquid chromatography with atmospheric pressure chemical ionization combined with tandem mass spectrometry. J. Pharm. Biomed. Anal. 2007, 43, 1692–1699. [Google Scholar] [CrossRef] [PubMed]
- Jiang, Z.; Liu, F.; Zhong, A.; Dugu, J.; Li, X. Determination of a new chromone from Aurantii Fructus Immaturus by DFT/GIAO method. Nat. Prog. Res. 2016, 30, 69–73. [Google Scholar] [CrossRef] [PubMed]
- Tian, Q.; Schwartz, S.J. Mass spectrometry and tandem mass spectrometry of citrus limonoids. Anal. Chem. 2003, 75, 5451–5460. [Google Scholar] [CrossRef] [PubMed]
- Zhang, Y.; Pan, J.; Zhong, J.; Wang, Y.; Fan, X.; Cheng, Y. Virtual separation of phytochemical constituents by their adduct-ion patterns in full mass spectra. J. Chromatogr. A 2012, 1227, 181–193. [Google Scholar] [CrossRef] [PubMed]
- Jandric, Z.; Cannavan, A. An investigative study on differentiation of citrus fruit/fruit juices by UPLC-QToF MS and chemometrics. Food Control 2017, 72, 8. [Google Scholar] [CrossRef]
- Dugrand, A.; Olry, A.; Duval, T.; Hehn, A.; Froelicher, Y.; Bourgaud, F. Coumarin and furanocoumarin quantitation in citrus peel via ultraperformance liquid chromatography coupled with mass spectrometry (UPLC-MS). J. Agric. Food Chem. 2013, 61, 10677–10684. [Google Scholar] [CrossRef] [PubMed]
- Zhu, H.; Bi, K.; Han, F.; Guan, J.; Zhang, X.; Mao, X.; Zhao, L.; Li, Q.; Hou, X.; Yin, R. Identification of the absorbed components and metabolites of Zhi-Zi-Da-Huang decoction in rat plasma by ultra-high performance liquid chromatography coupled with quadrupole-time-of-flight mass spectrometry. J. Pharm. Biomed. Anal. 2015, 111, 277–287. [Google Scholar] [CrossRef] [PubMed]
- Yao, Z.H.; Qin, Z.F.; Cheng, H.; Wu, X.M.; Dai, Y.; Wang, X.L.; Qin, L.; Ye, W.C.; Yao, X.S. Simultaneous quantification of multiple representative components in the Xian-Ling-Gu-Bao capsule by ultra-performance liquid chromatography coupled with quadrupole time-of-flight tandem mass spectrometry. Molecules 2017, 22, 927. [Google Scholar] [CrossRef] [PubMed]
- Zhang, X.; Han, L.; Liu, J.; Xu, Q.; Guo, Y.; Zheng, W.; Wang, J.; Huang, X.; Ren, P. Pharmacokinetic study of 7 compounds following oral administration of Fructus Aurantii to depressive rats. Front. Pharmacol. 2018, 9, 131. [Google Scholar] [CrossRef] [PubMed]
- Ma, C.; Gao, W.; Gao, Y.; Man, S.; Huang, L.; Liu, C. Identification of chemical constituents in extracts and rat plasma from Fructus Aurantii by UPLC-PDA-Q-TOF/MS. Phytochem. Anal. 2011, 22, 112–118. [Google Scholar] [CrossRef] [PubMed]
- Plotka-Wasylka, J. A new tool for the evaluation of the analytical procedure: Green Analytical Procedure Index. Talanta 2018, 181, 204–209. [Google Scholar] [CrossRef] [PubMed]
Sample Availability: Sample of naringenin-7-O-neohesperidoside is available from the authors. |

© 2018 by the authors. Licensee MDPI, Basel, Switzerland. This article is an open access article distributed under the terms and conditions of the Creative Commons Attribution (CC BY) license (http://creativecommons.org/licenses/by/4.0/).