Optimization of Ultrasonic-Assisted Simultaneous Extraction of Three Active Compounds from the Fruits of Forsythia suspensa and Comparison with Conventional Extraction Methods

Abstract
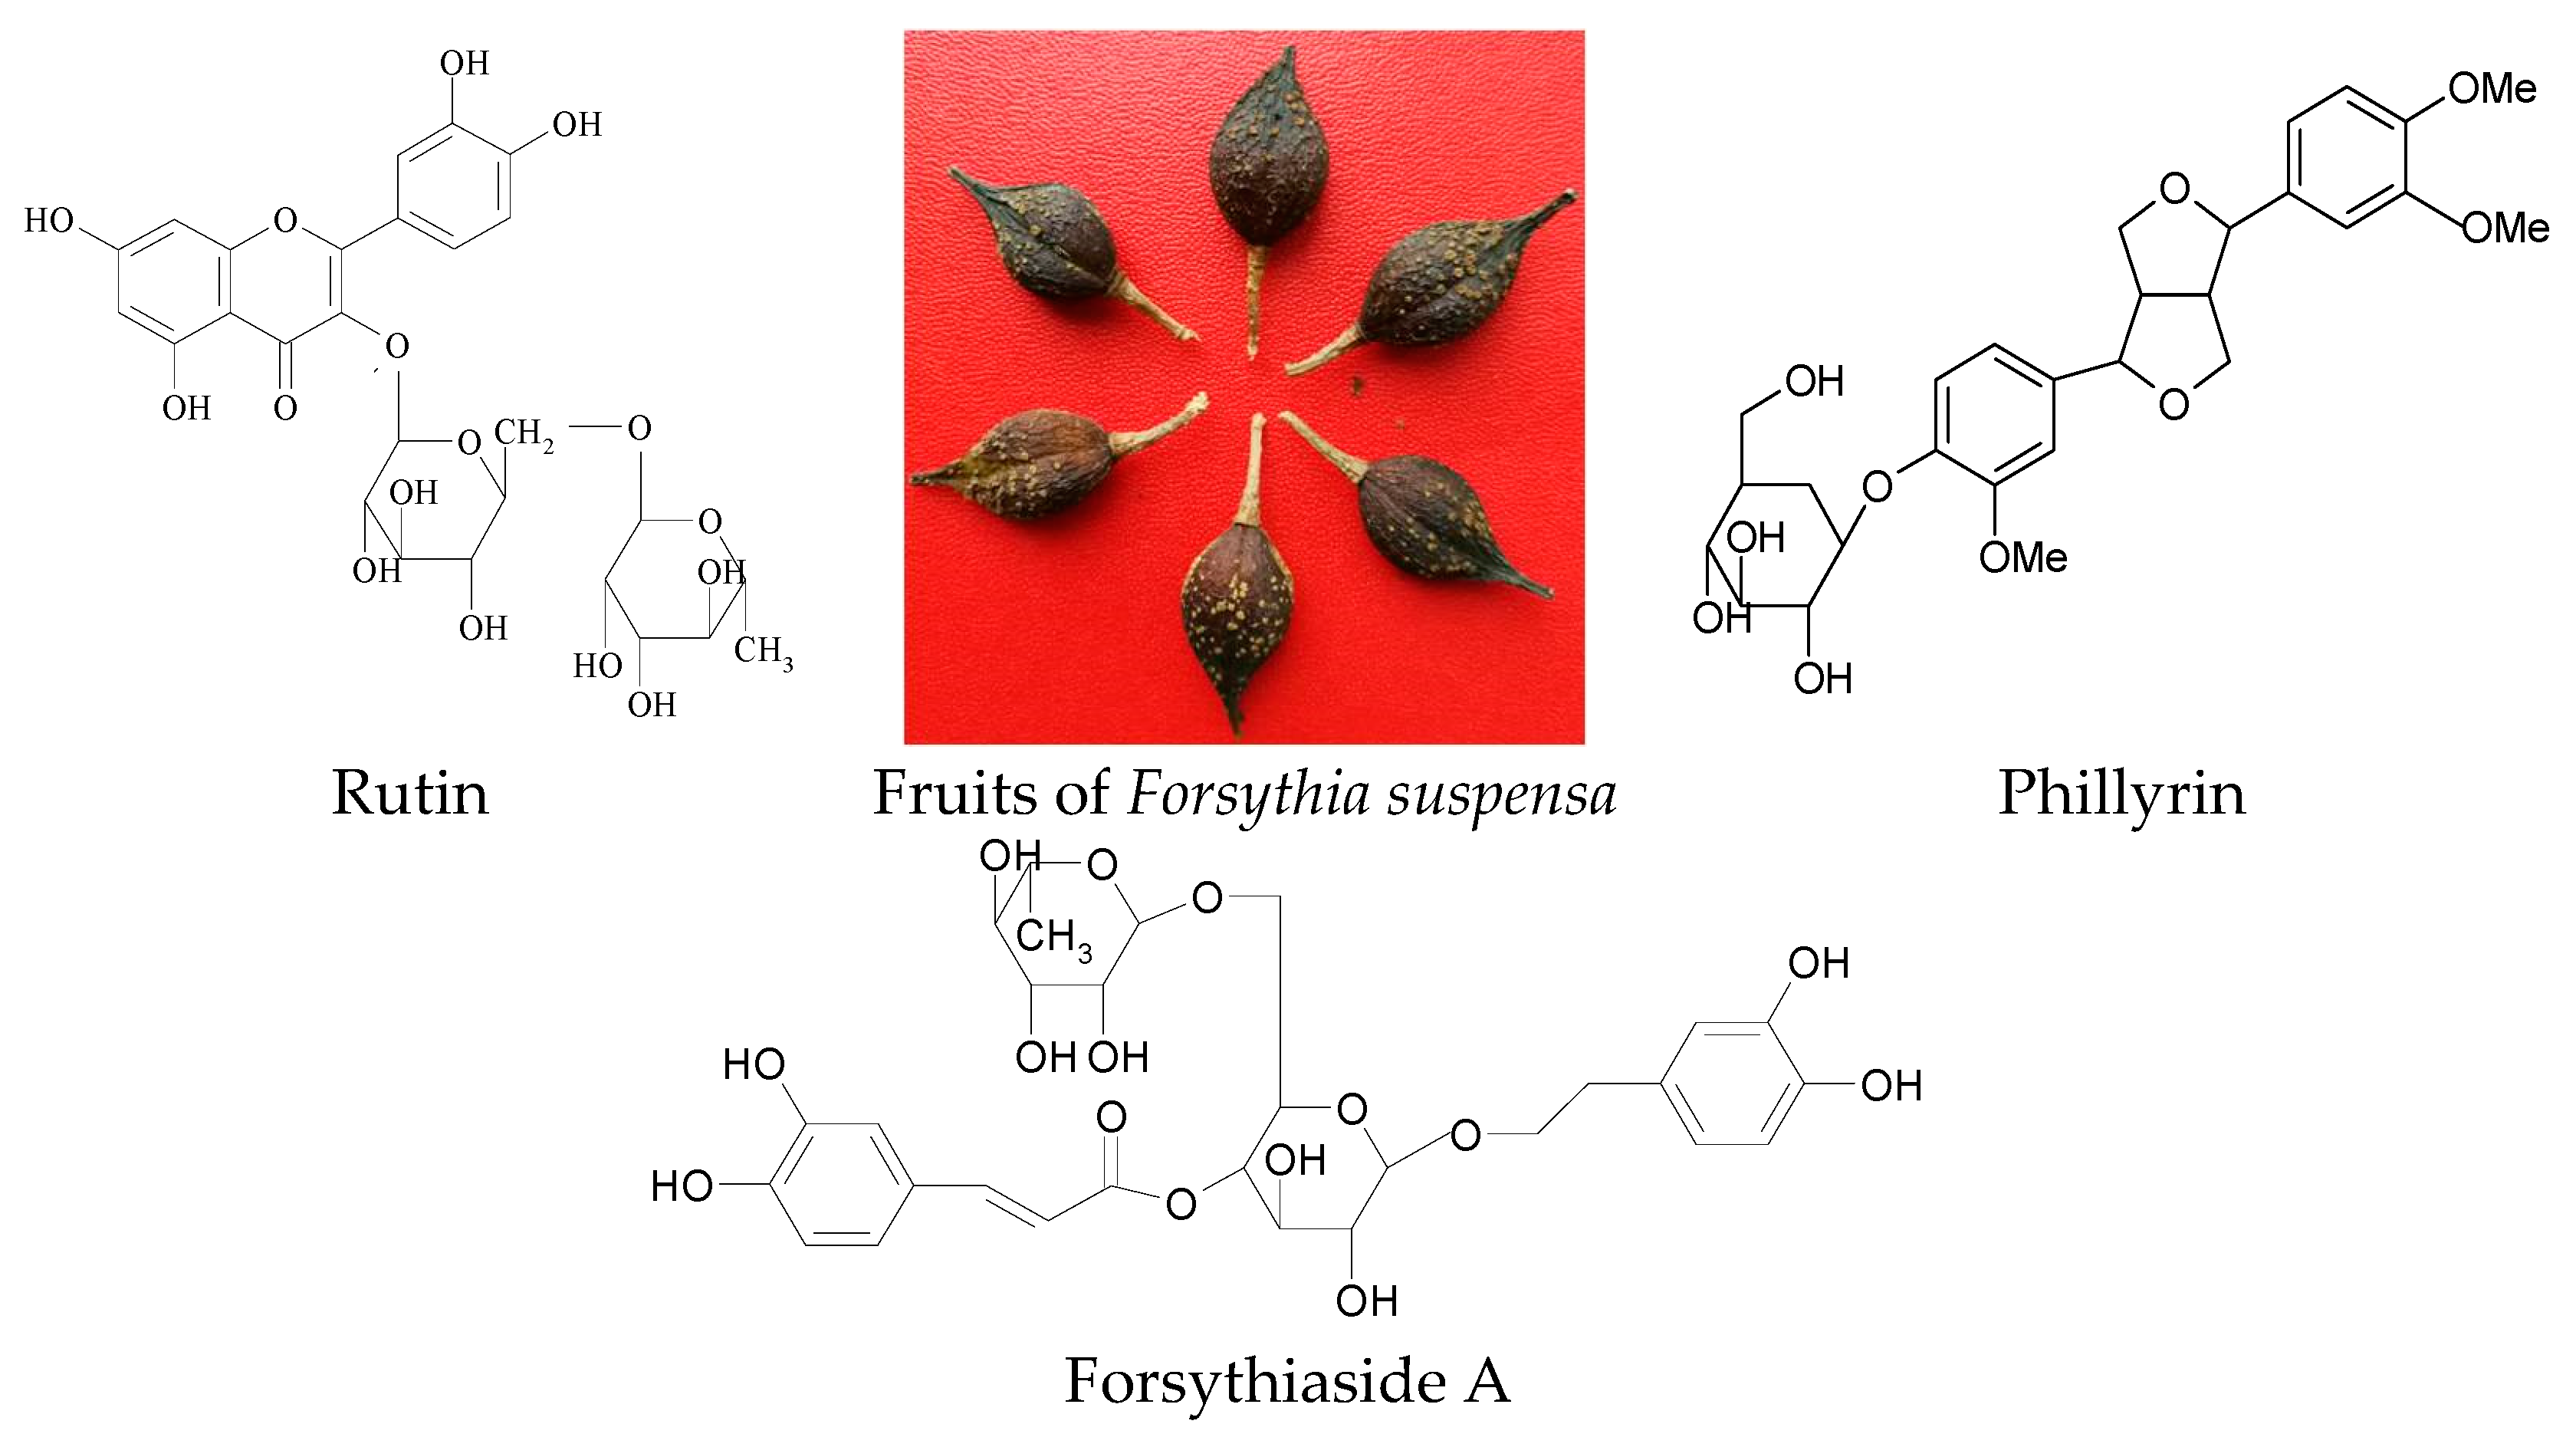
:1. Introduction
2. Results and Discussion
2.1. Effect of a Single Factor on Extraction Yields
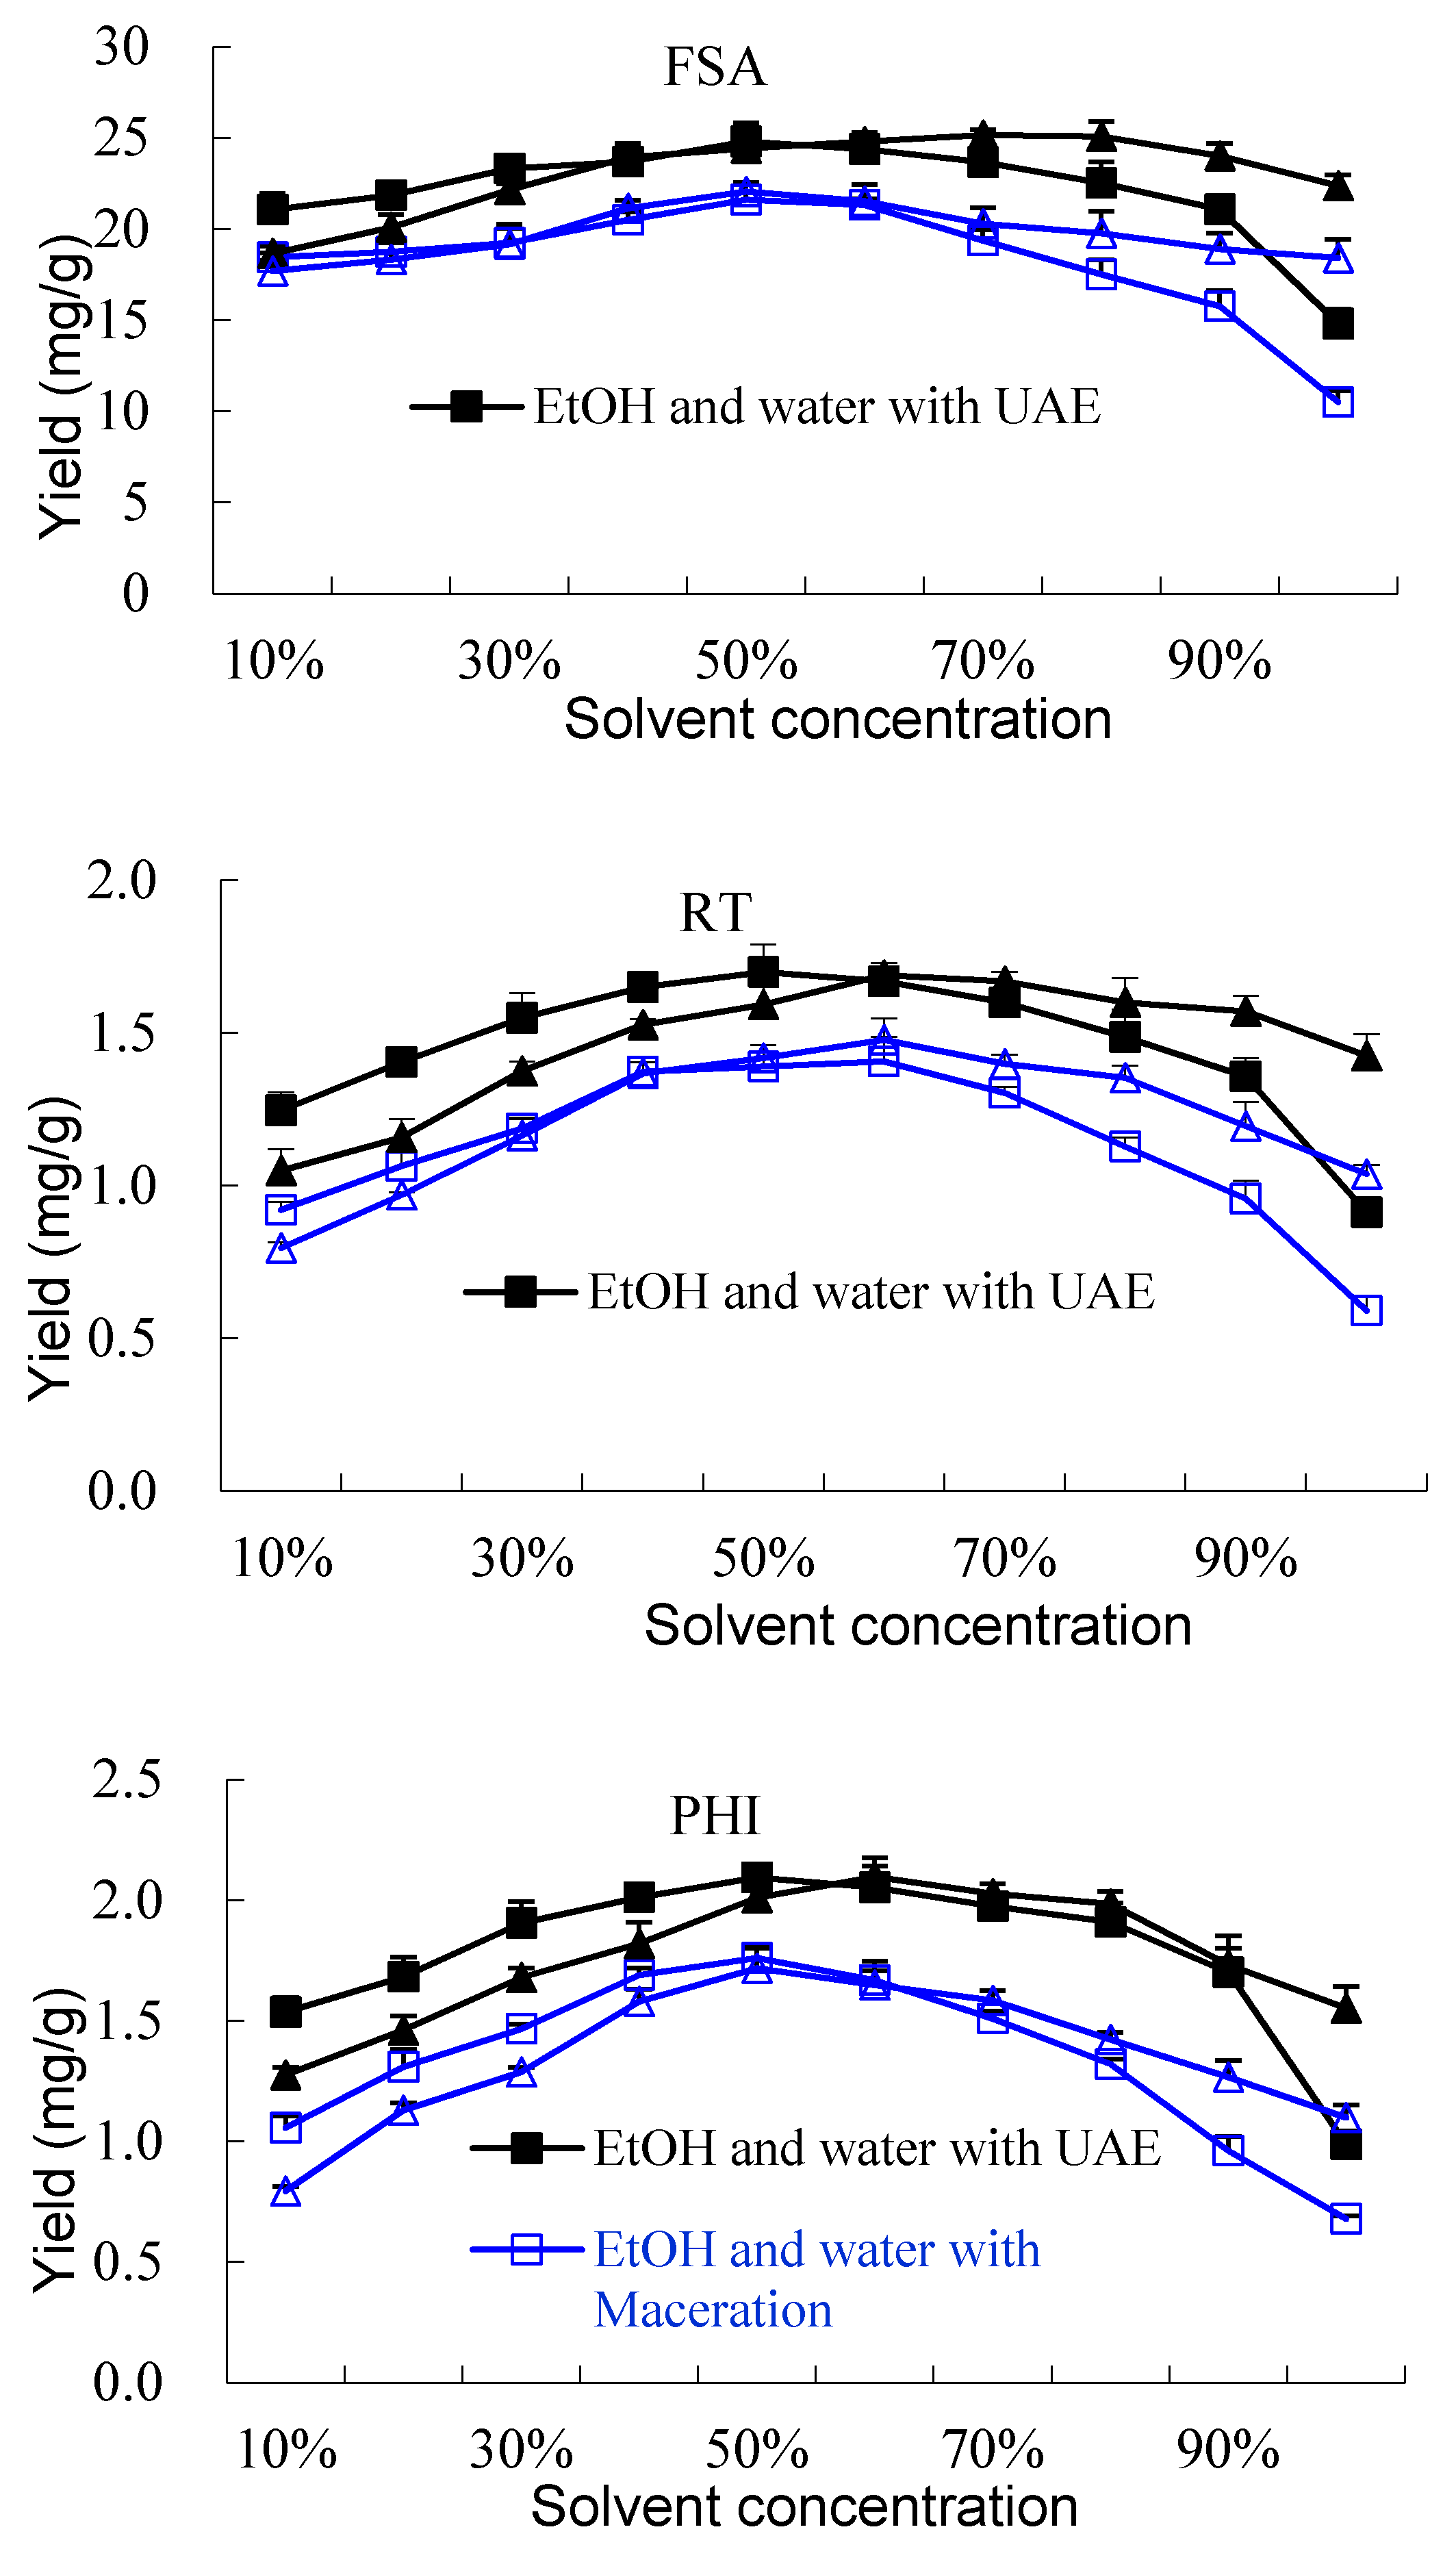
2.1.1. Effect of Solvent and Comparison with Maceration
2.1.2. Effect of pH of the Solvent
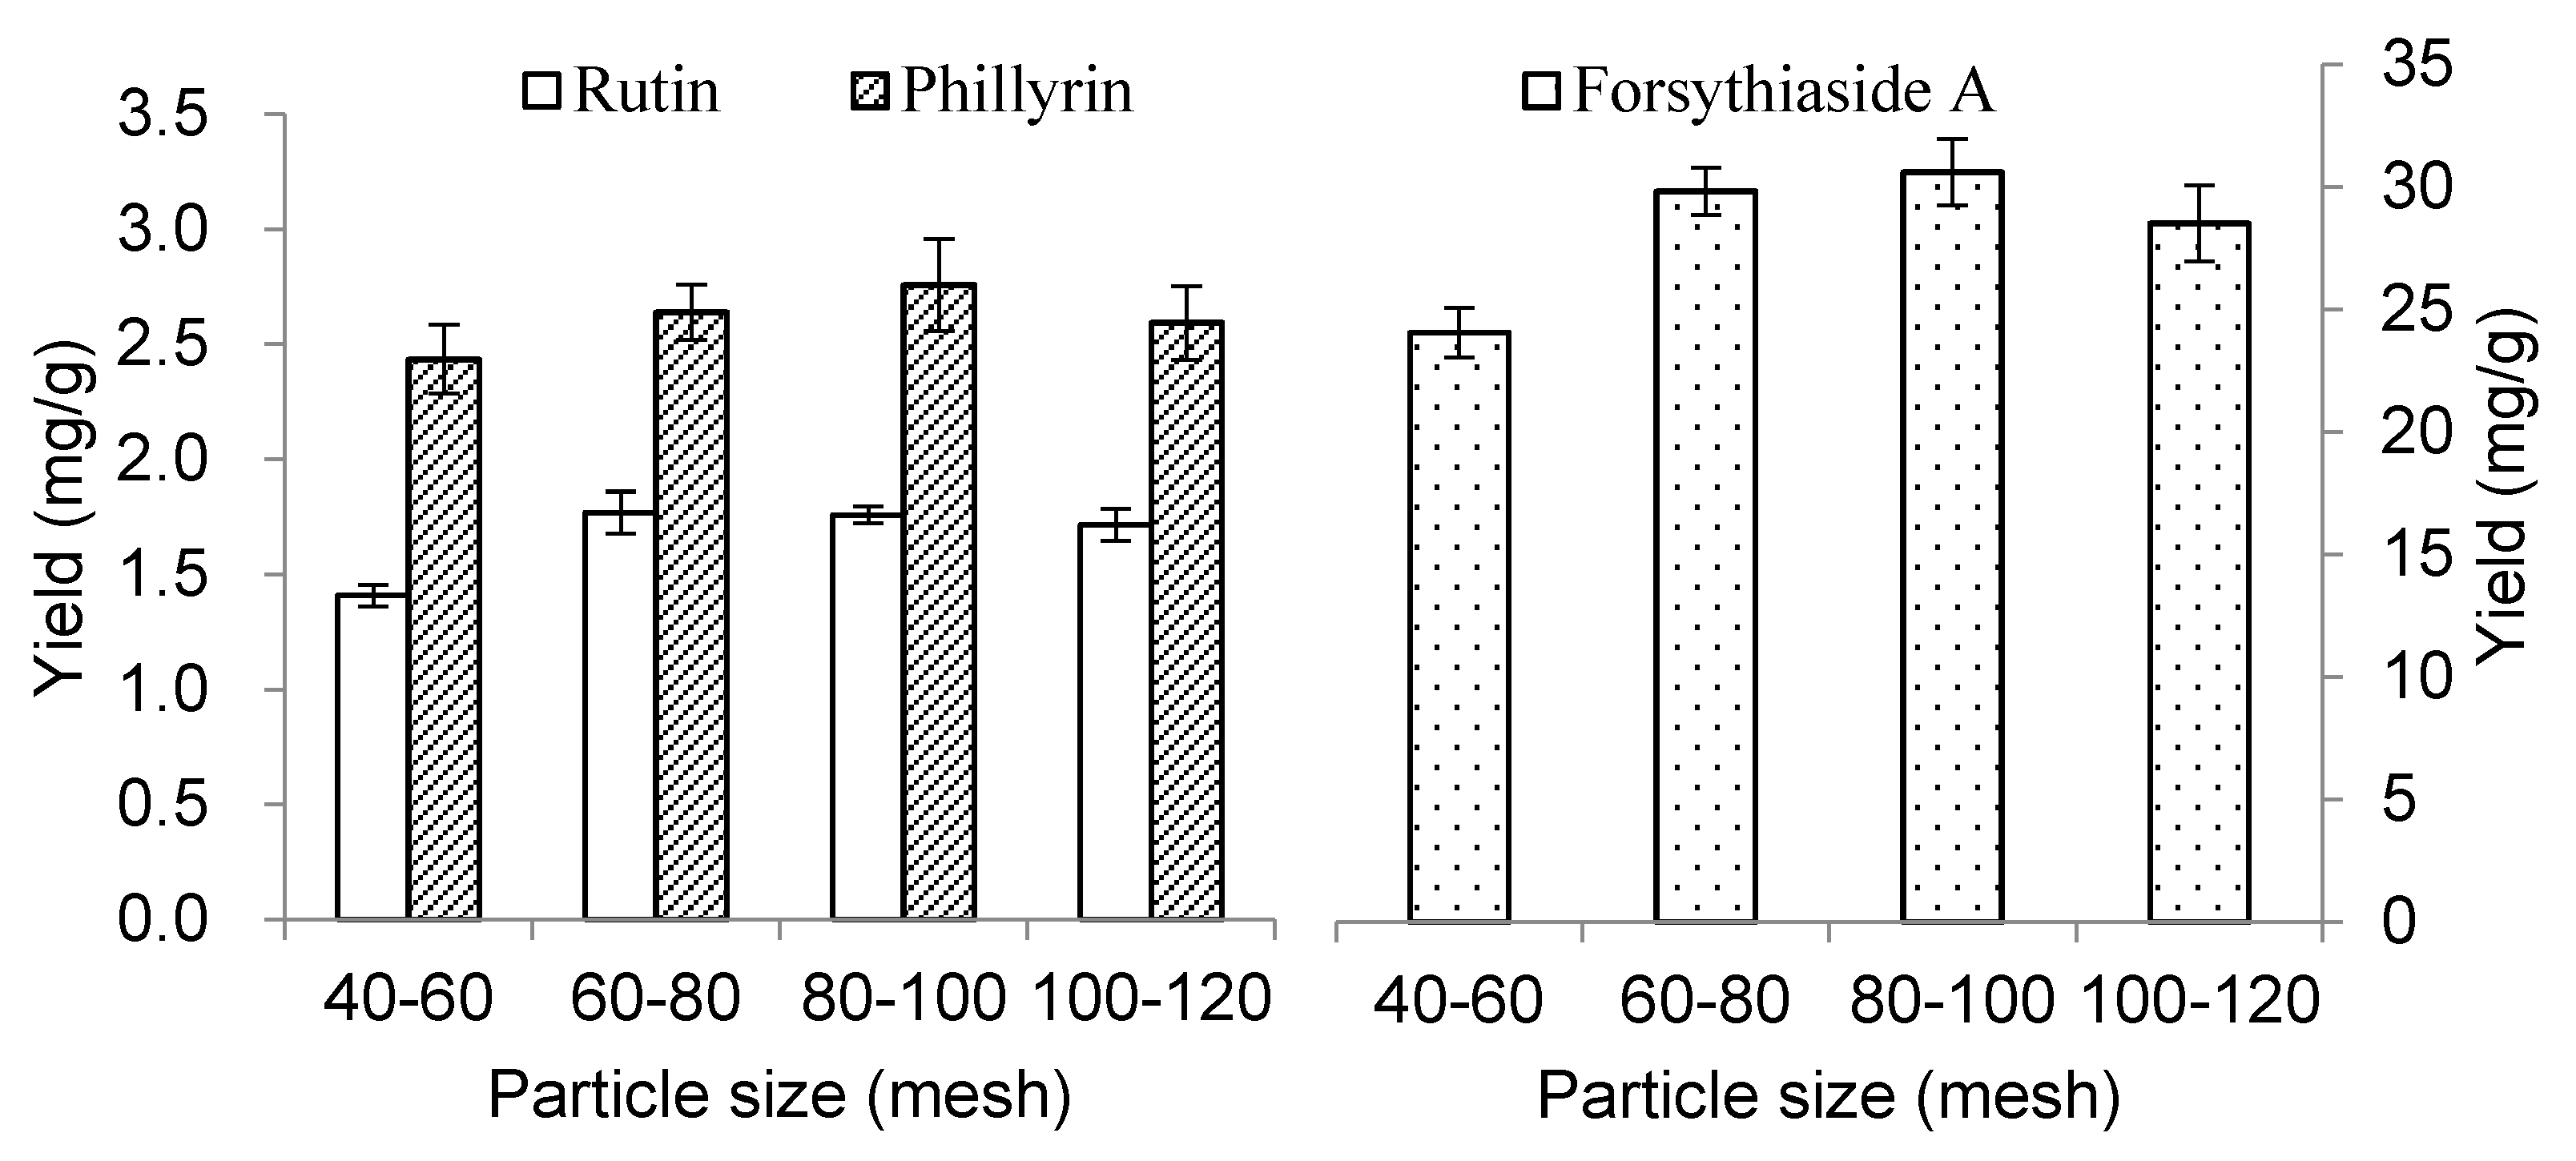
2.1.3. Effect of Particle Size of the Sample
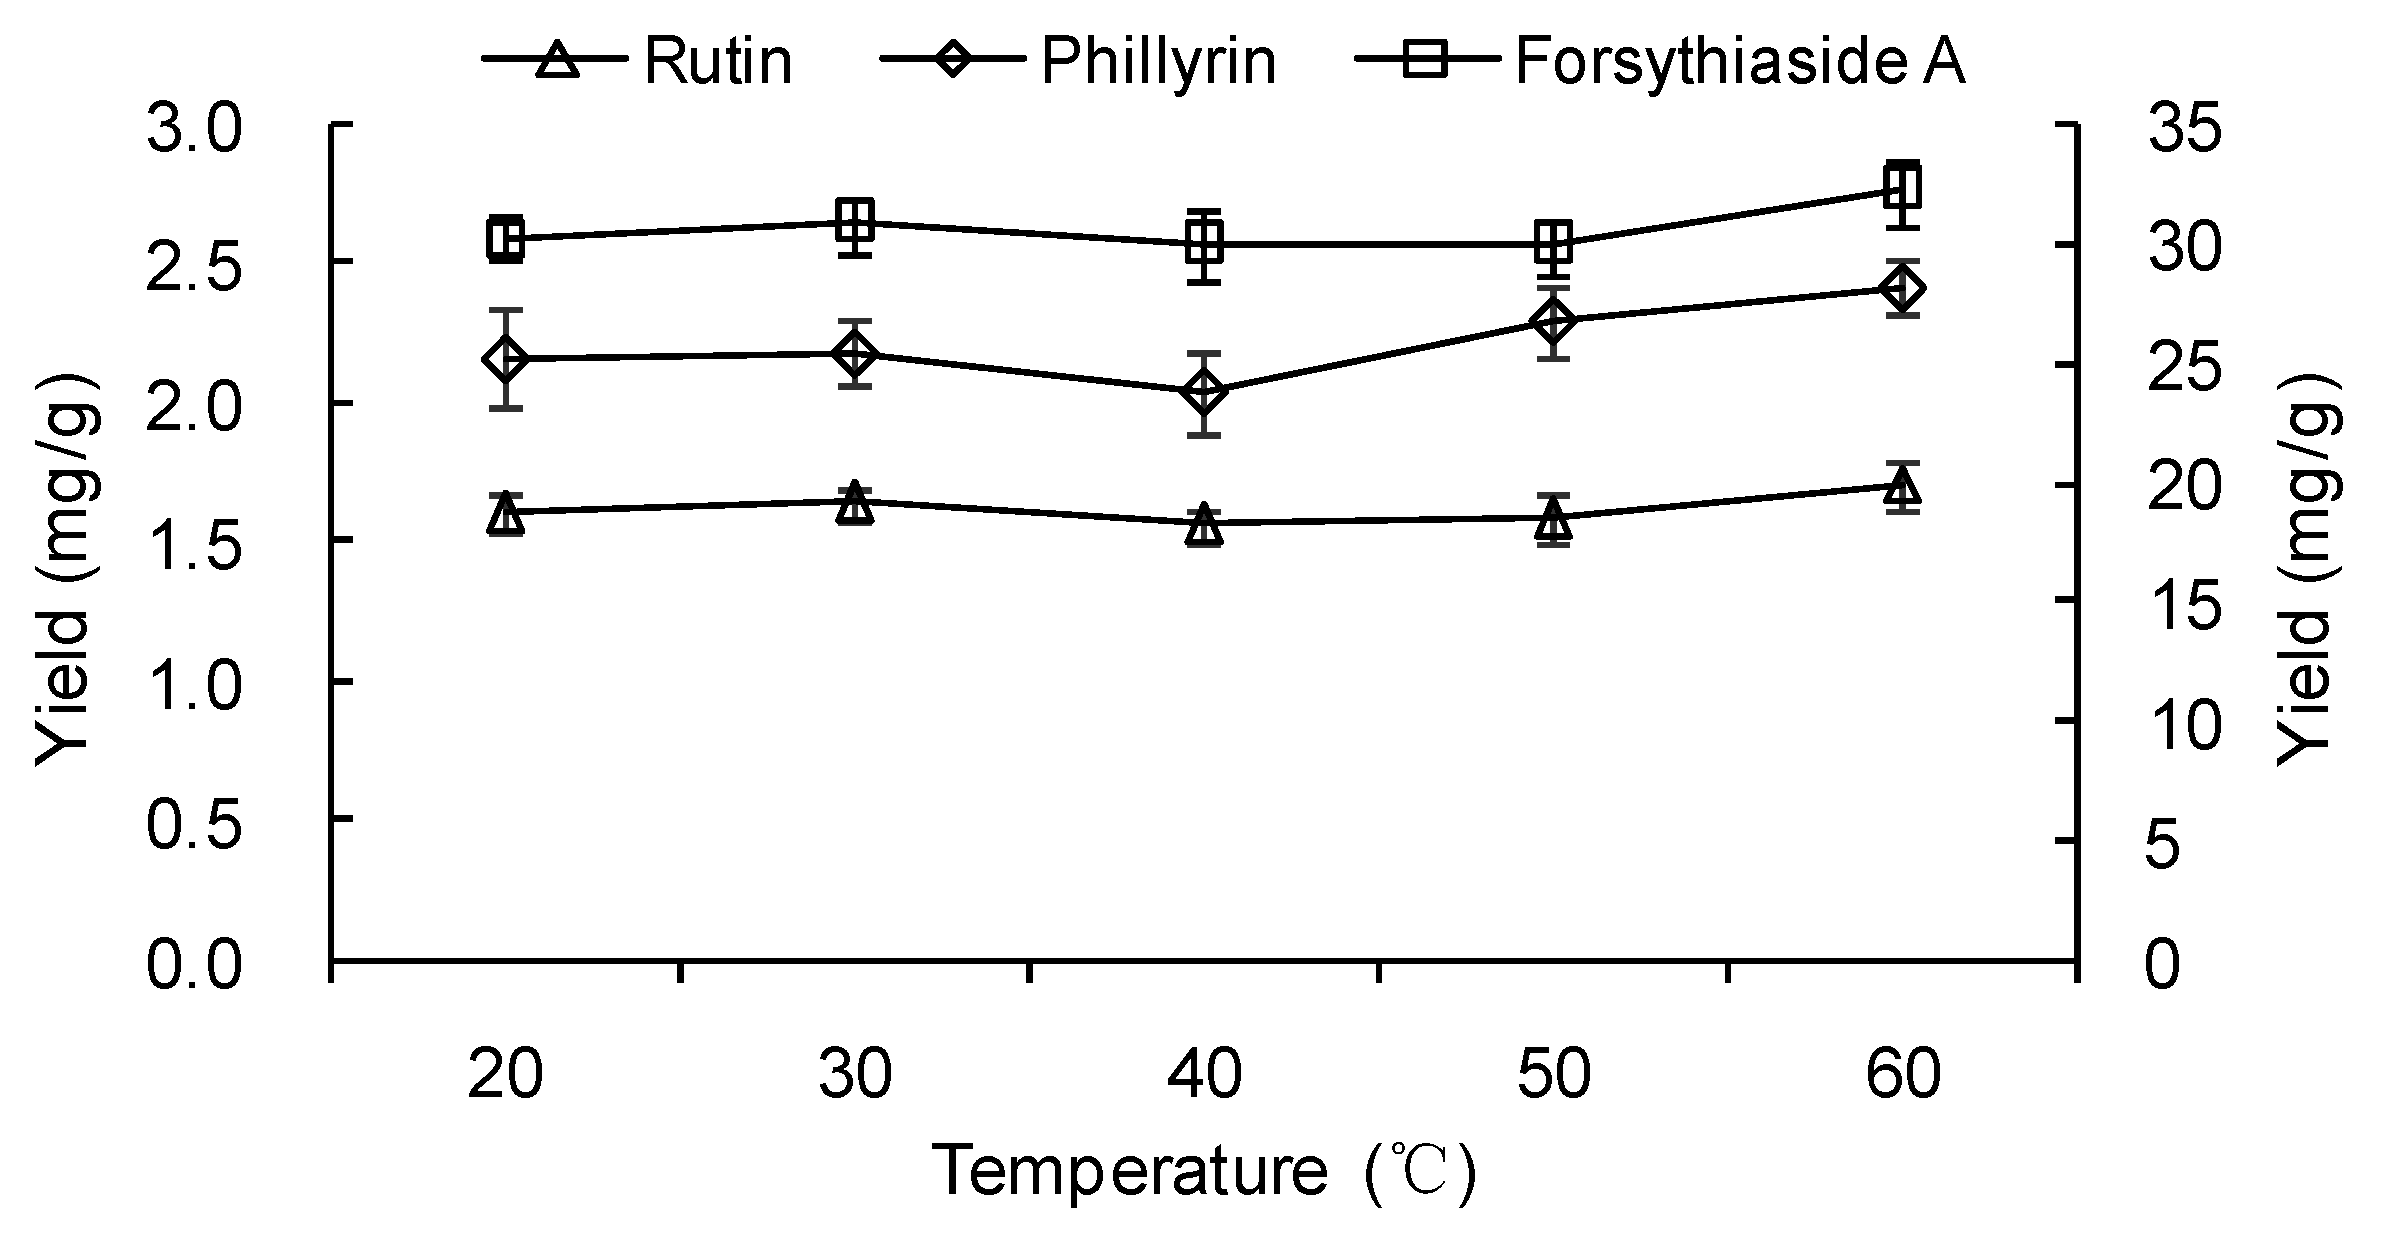
2.1.4. Effect of Temperature
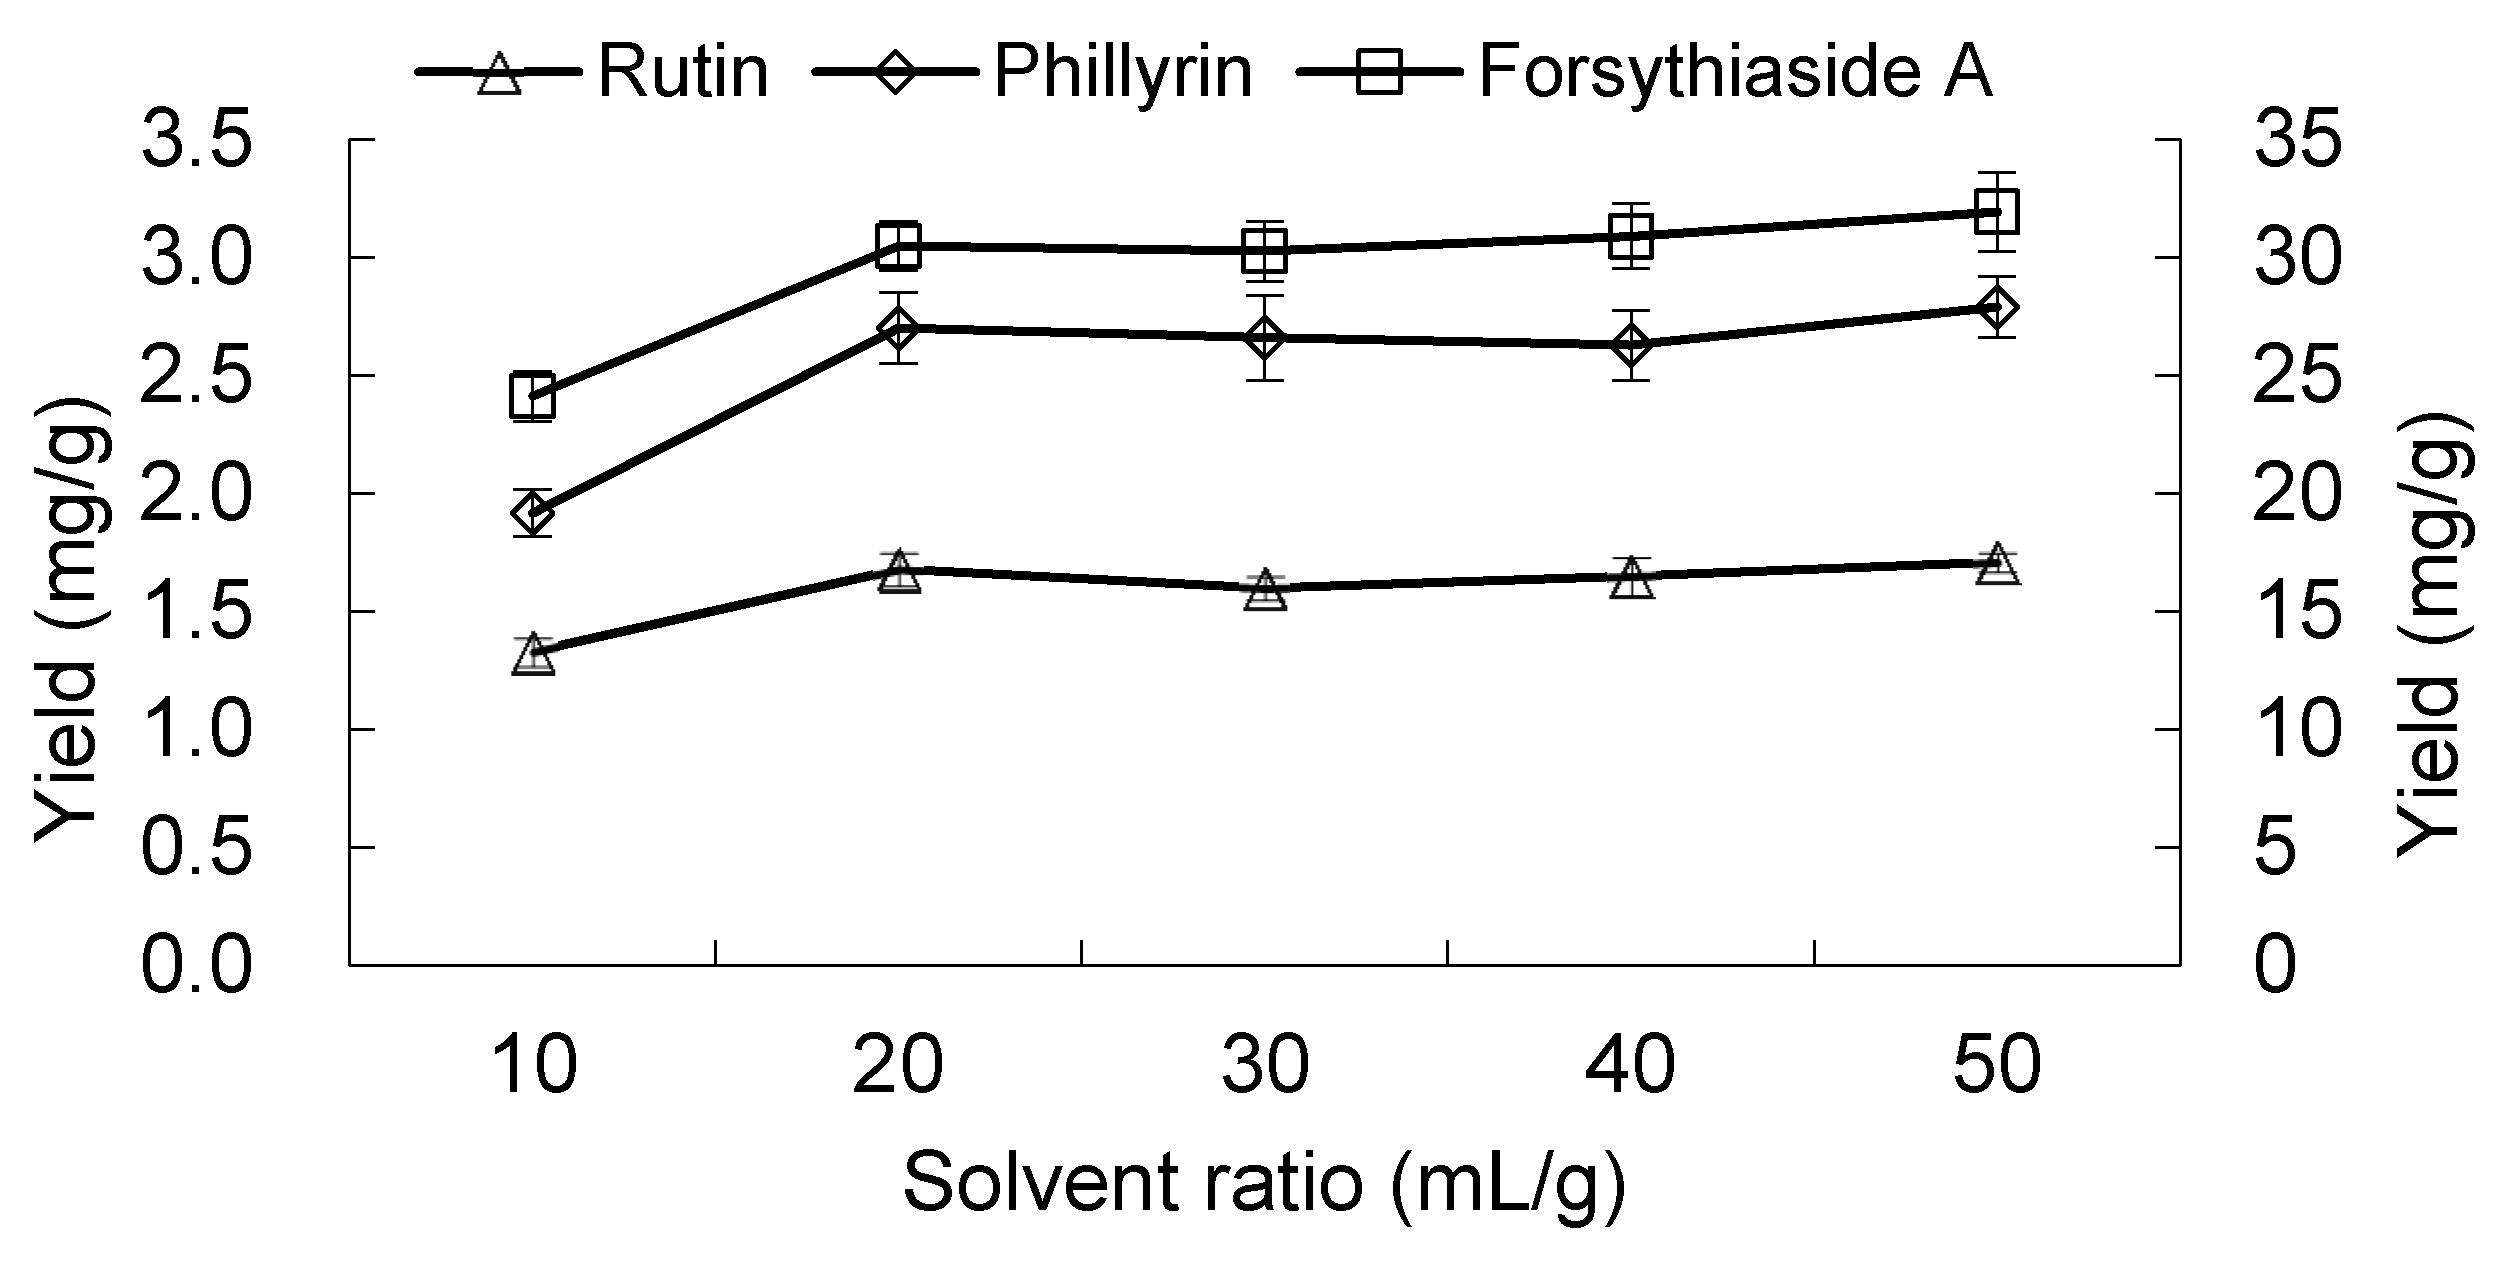
2.1.5. Effect of Solvent to Material Ratio
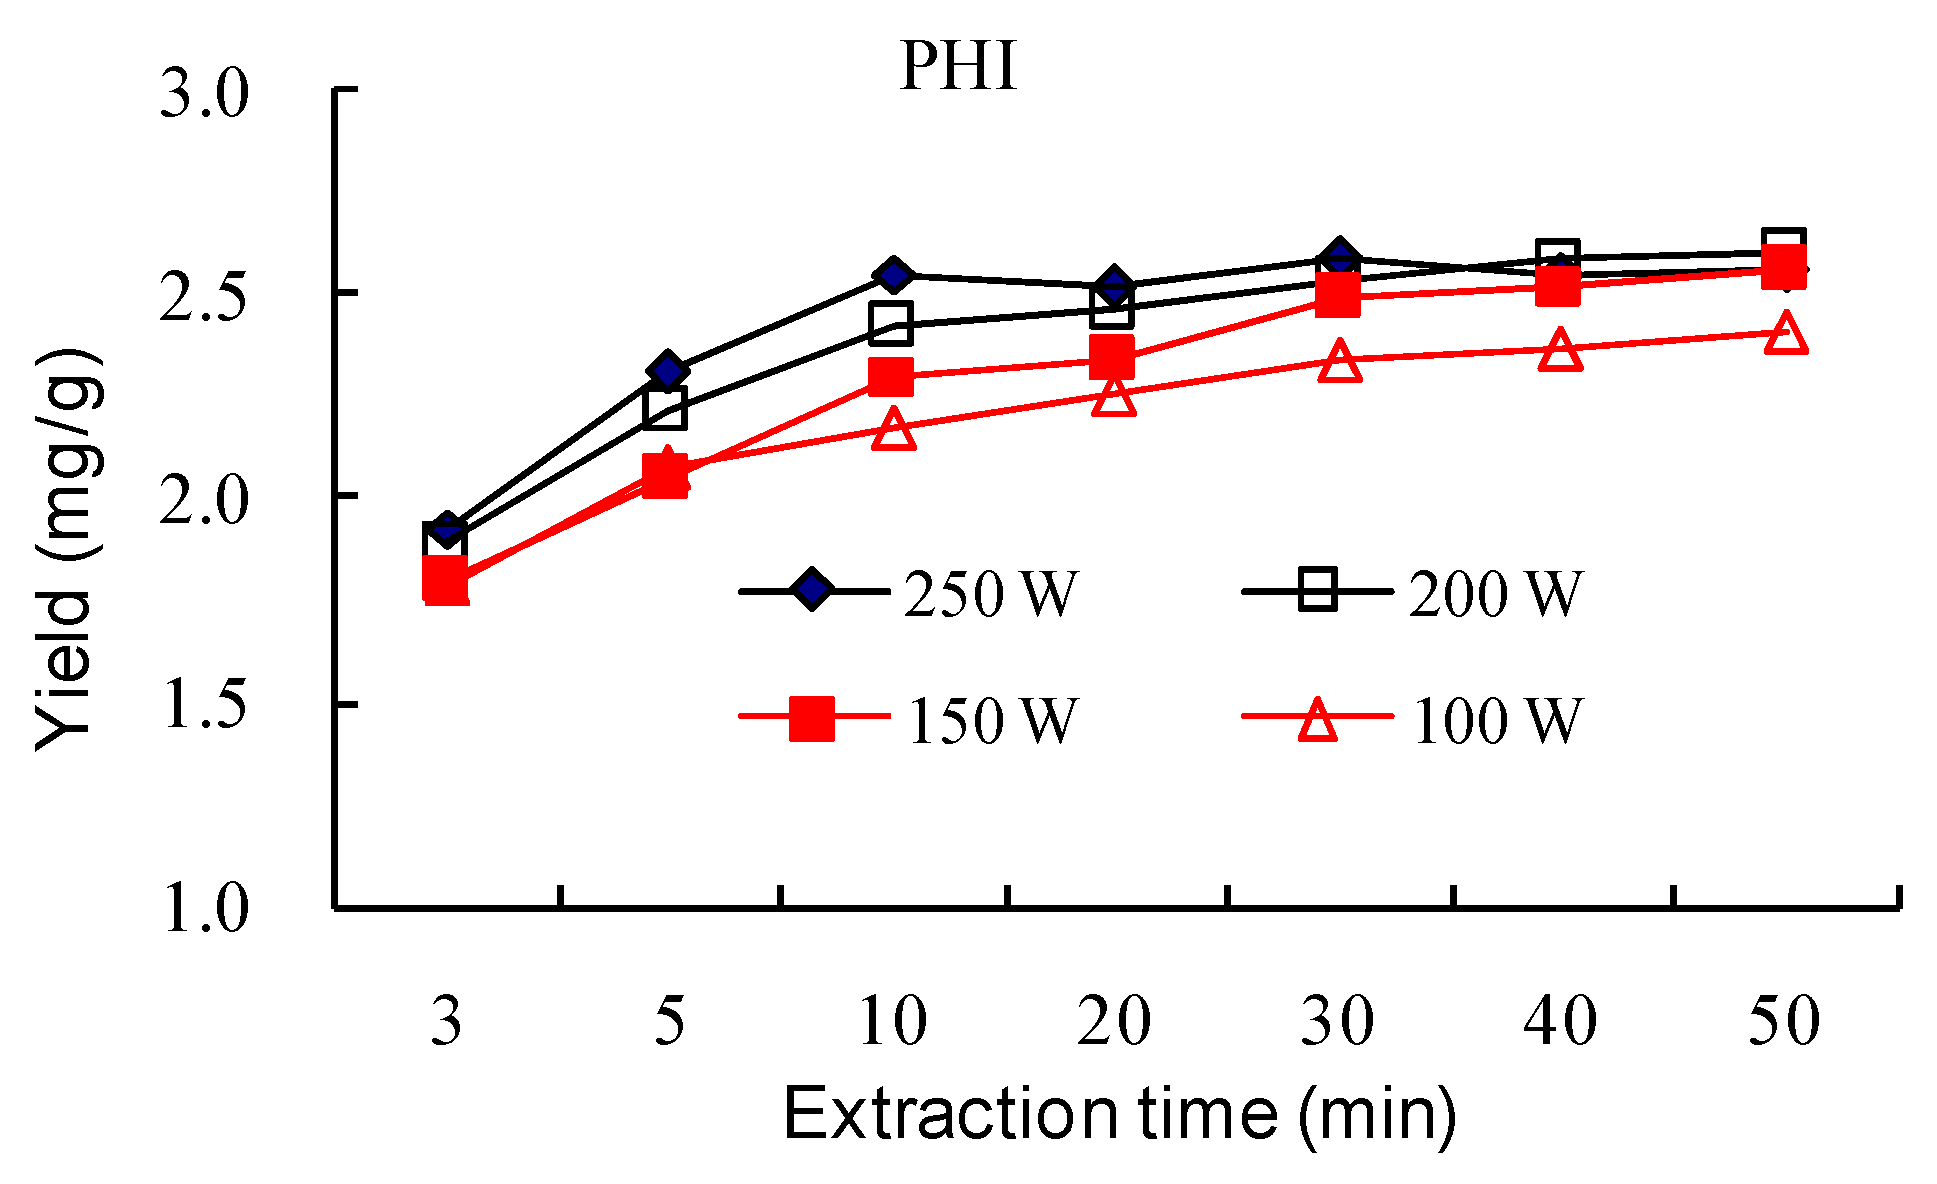
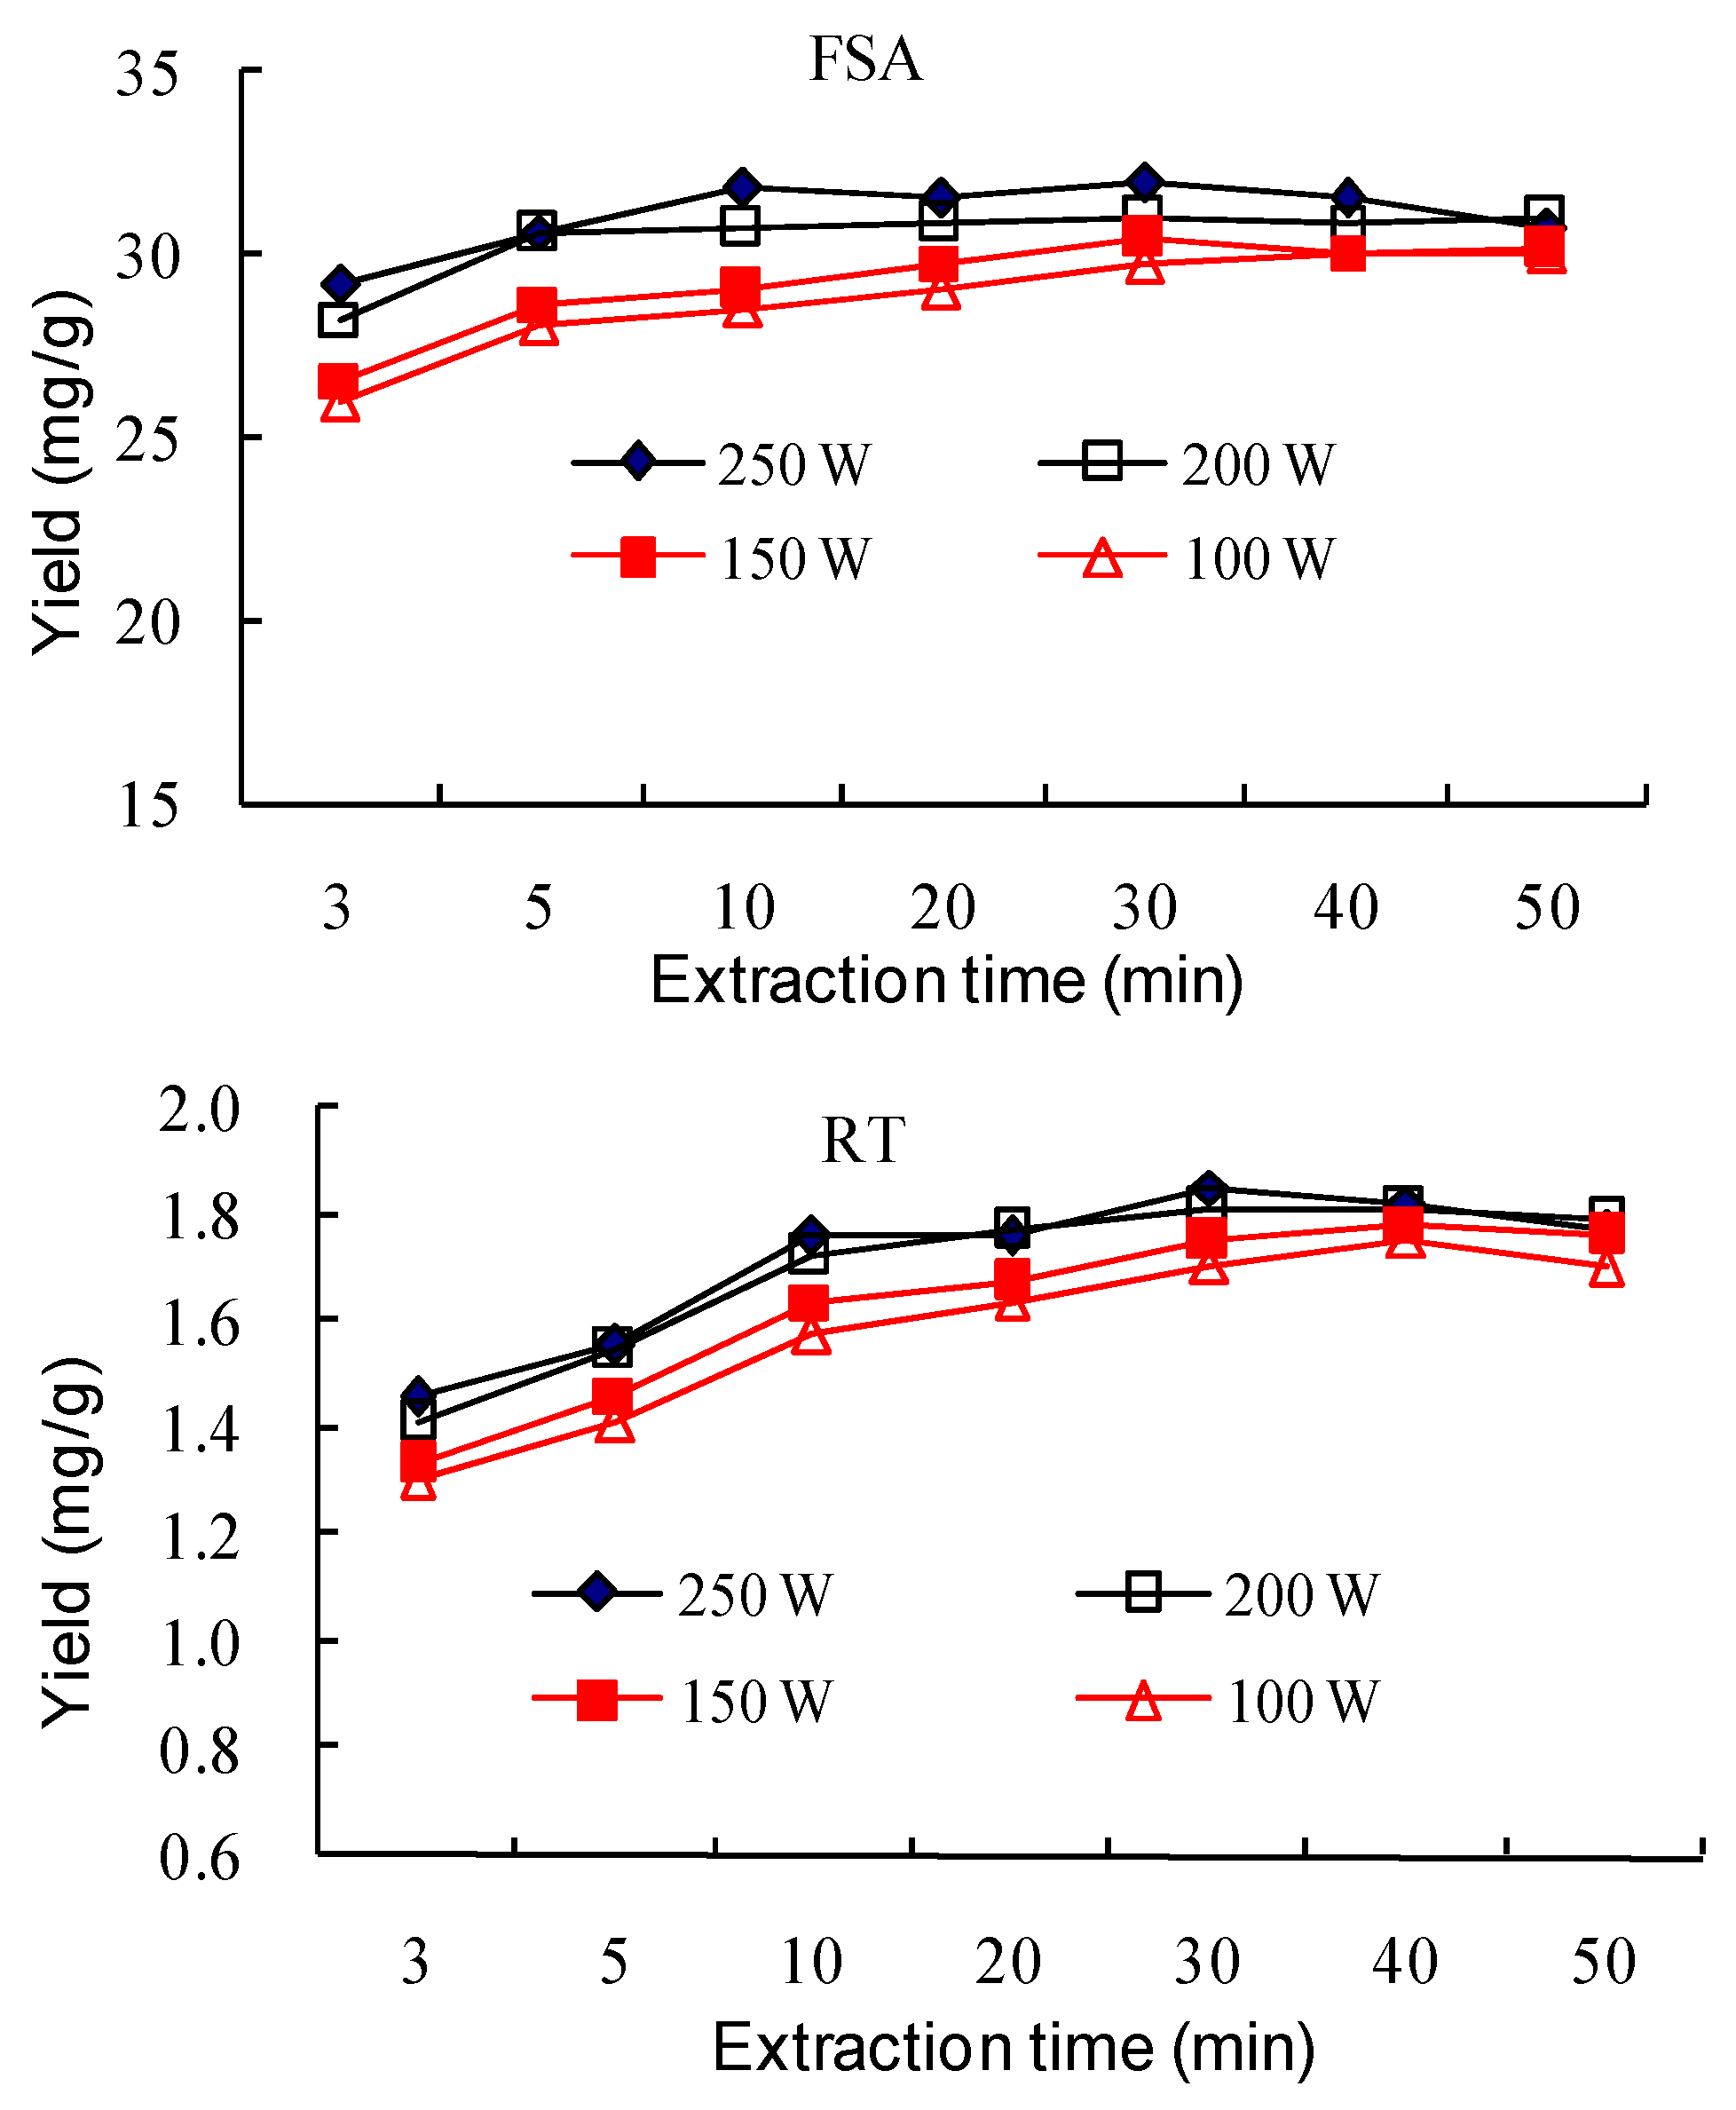
2.1.6. Effect of Ultrasonic Input Power and Extraction Time
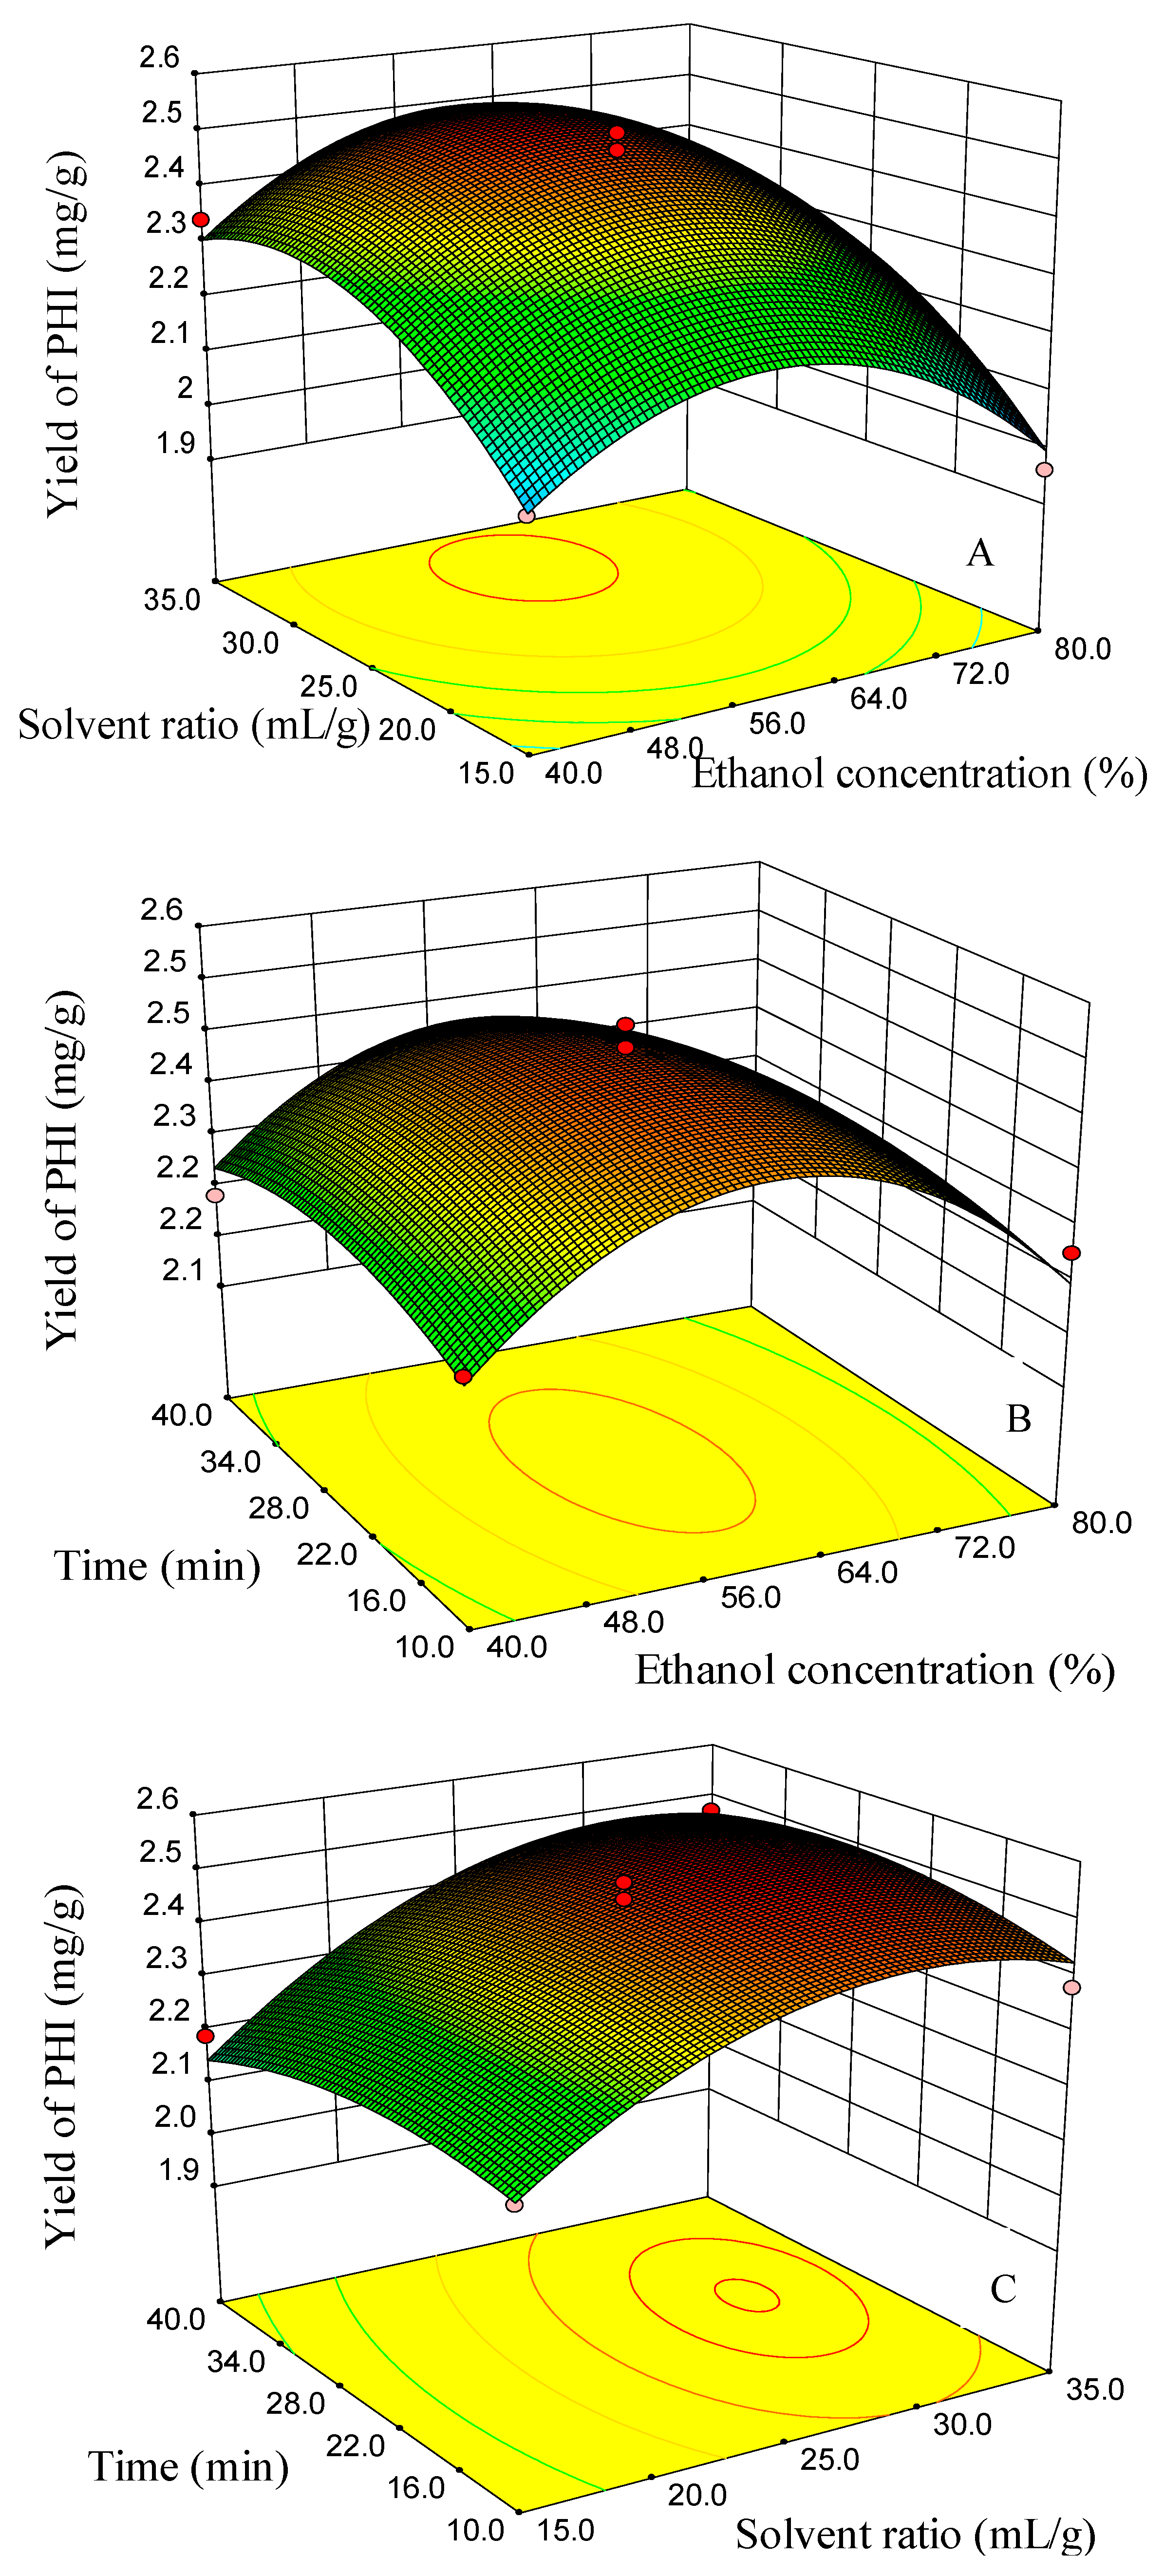
2.2. Optimization of UAE Using RSM
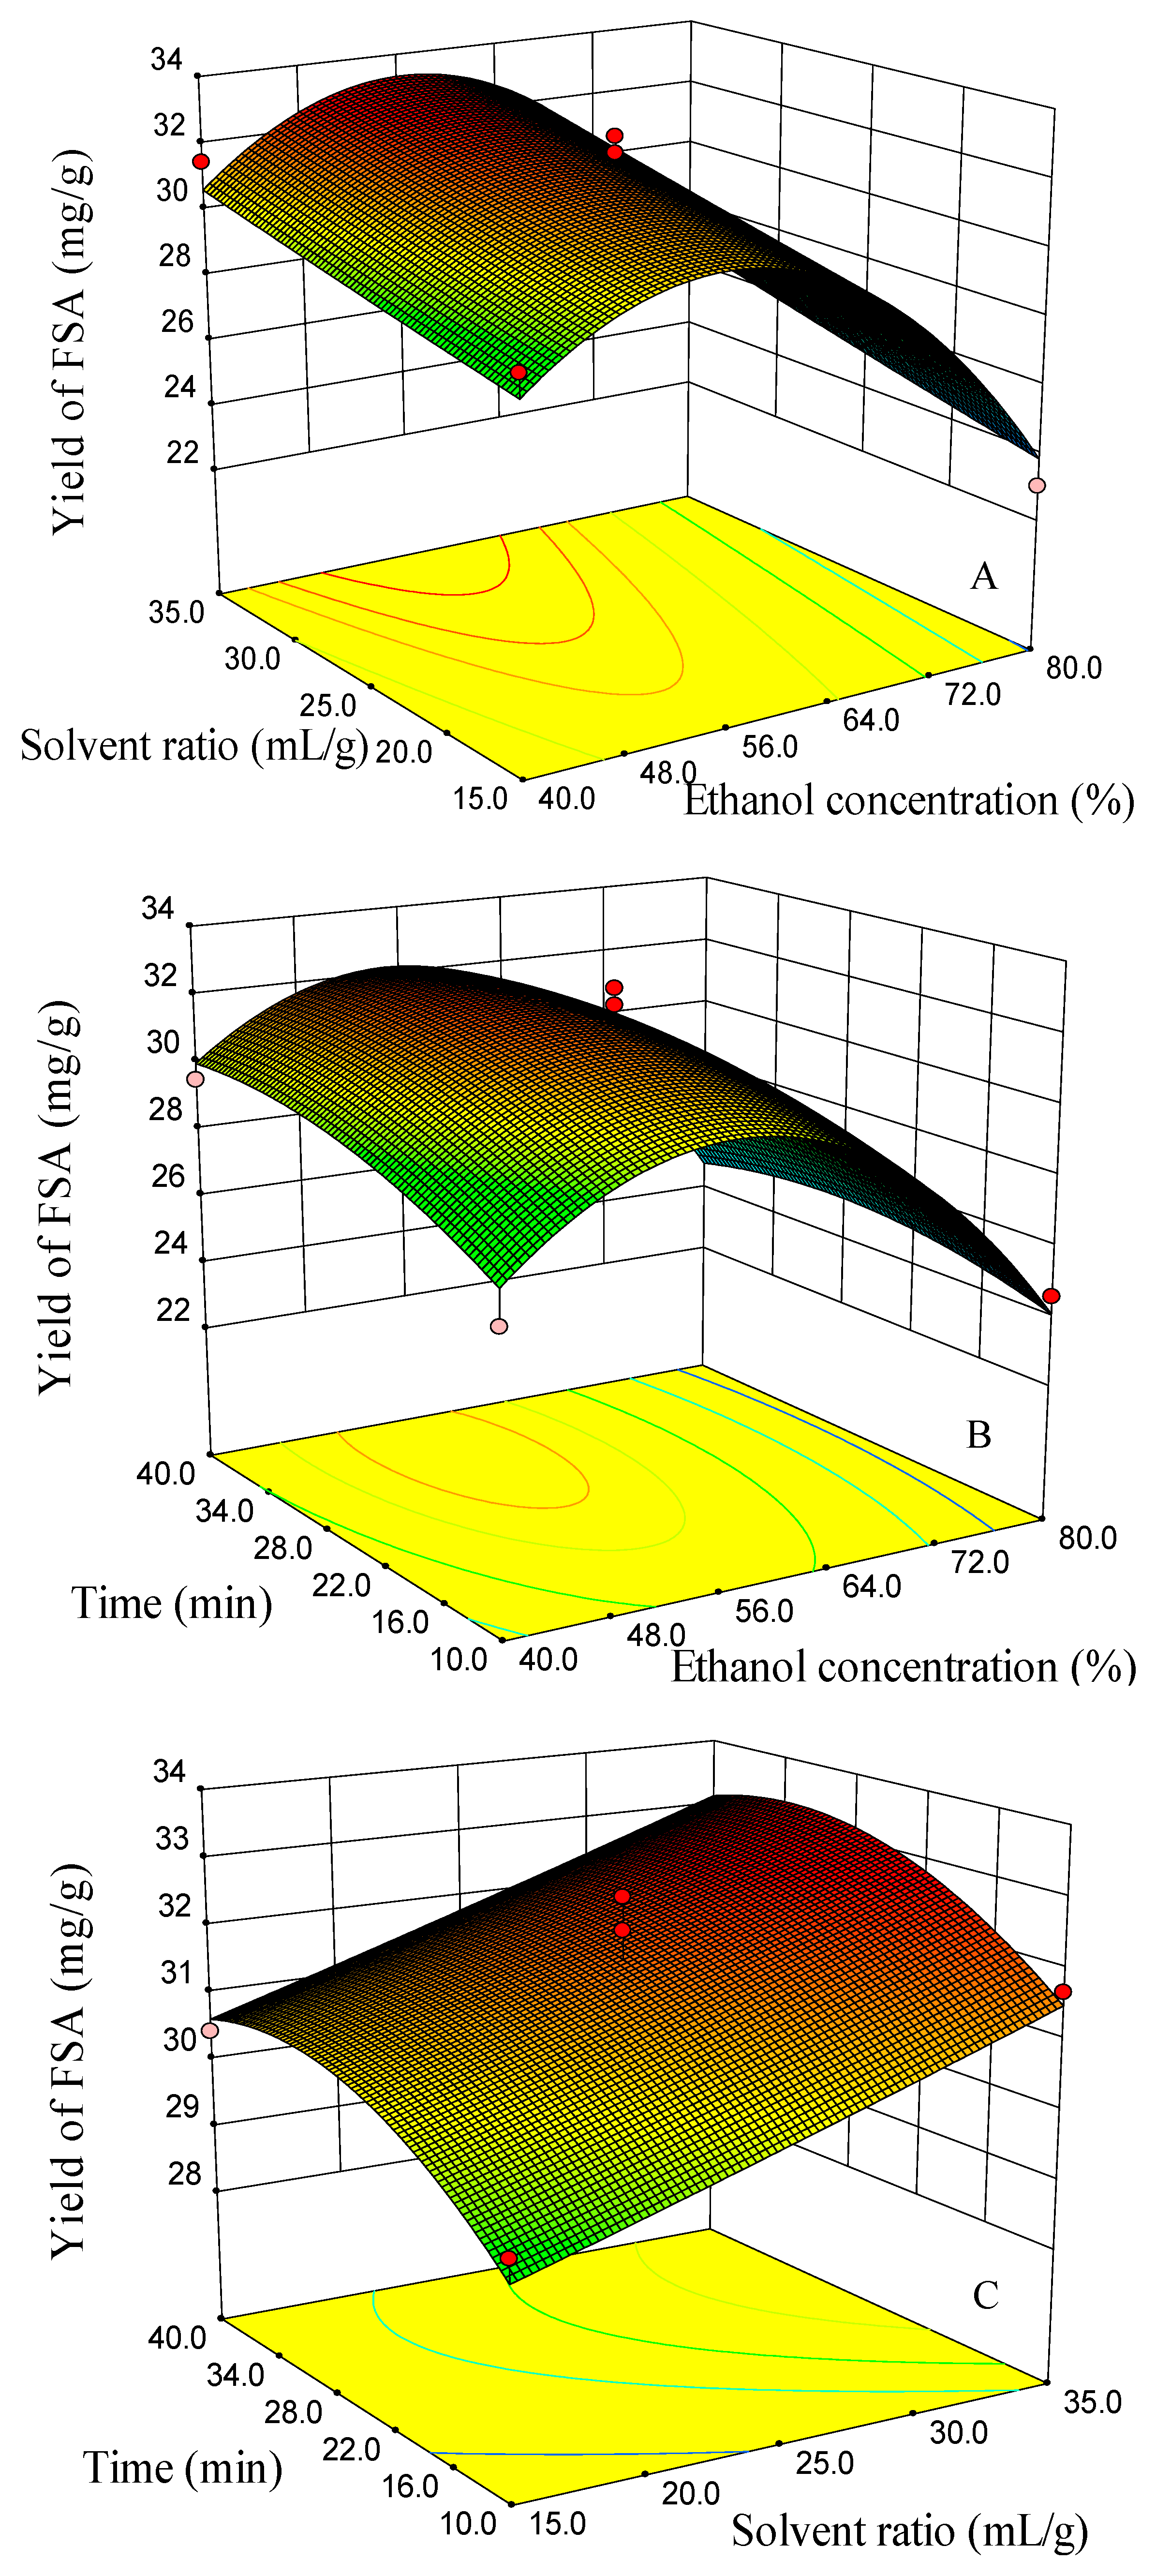
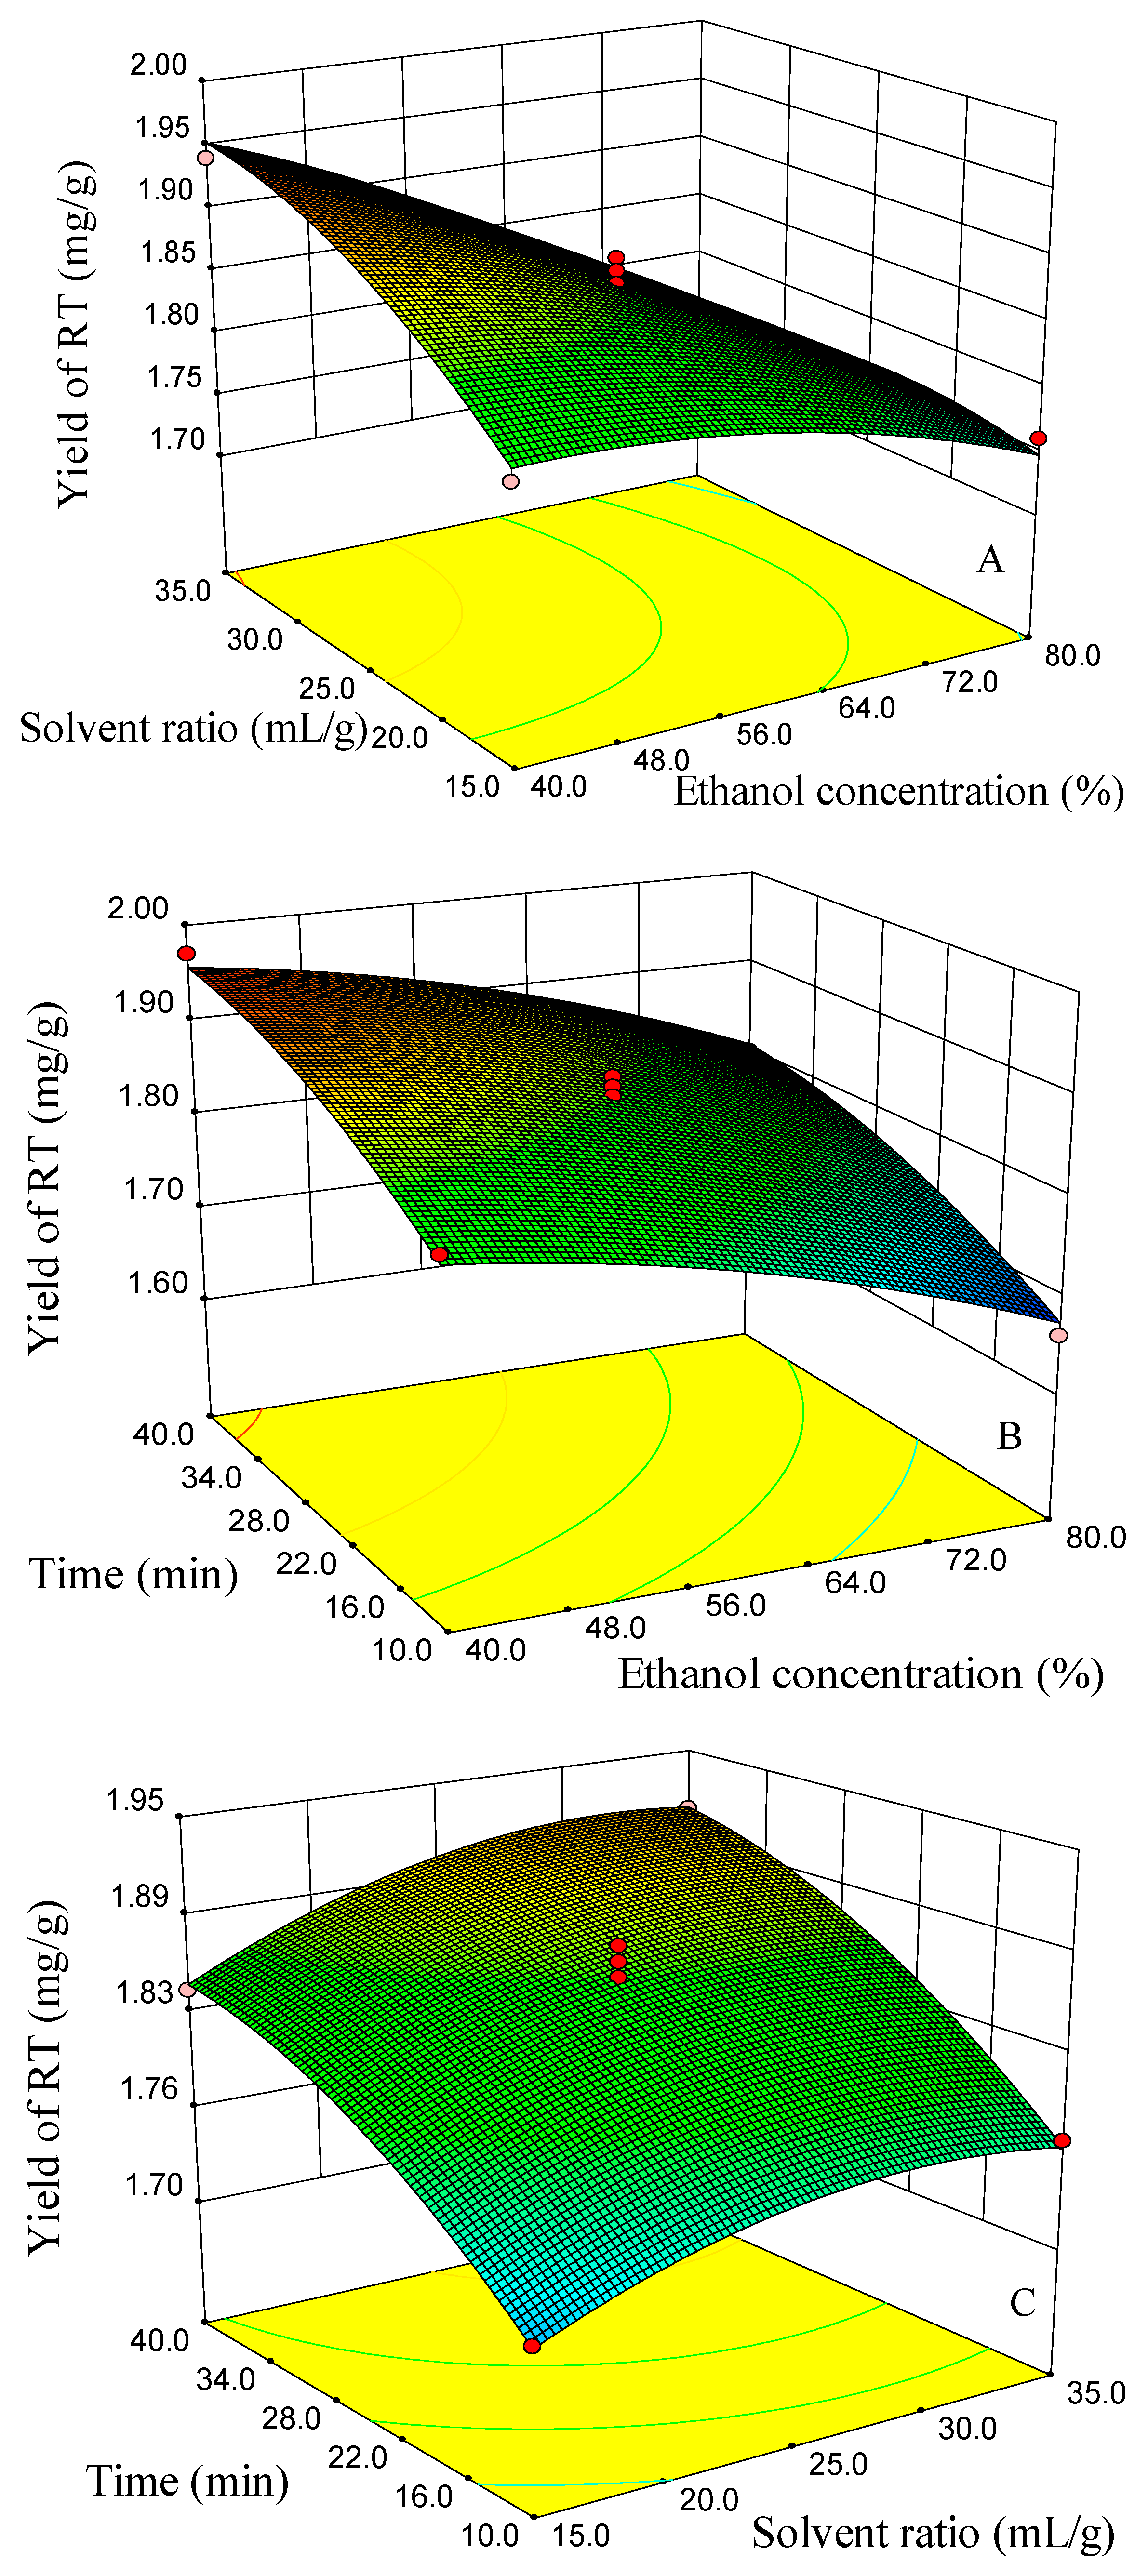
2.2.1. Modeling of the Extraction Yields and Response Surface Analysis
2.2.2. Optimization of the UAE
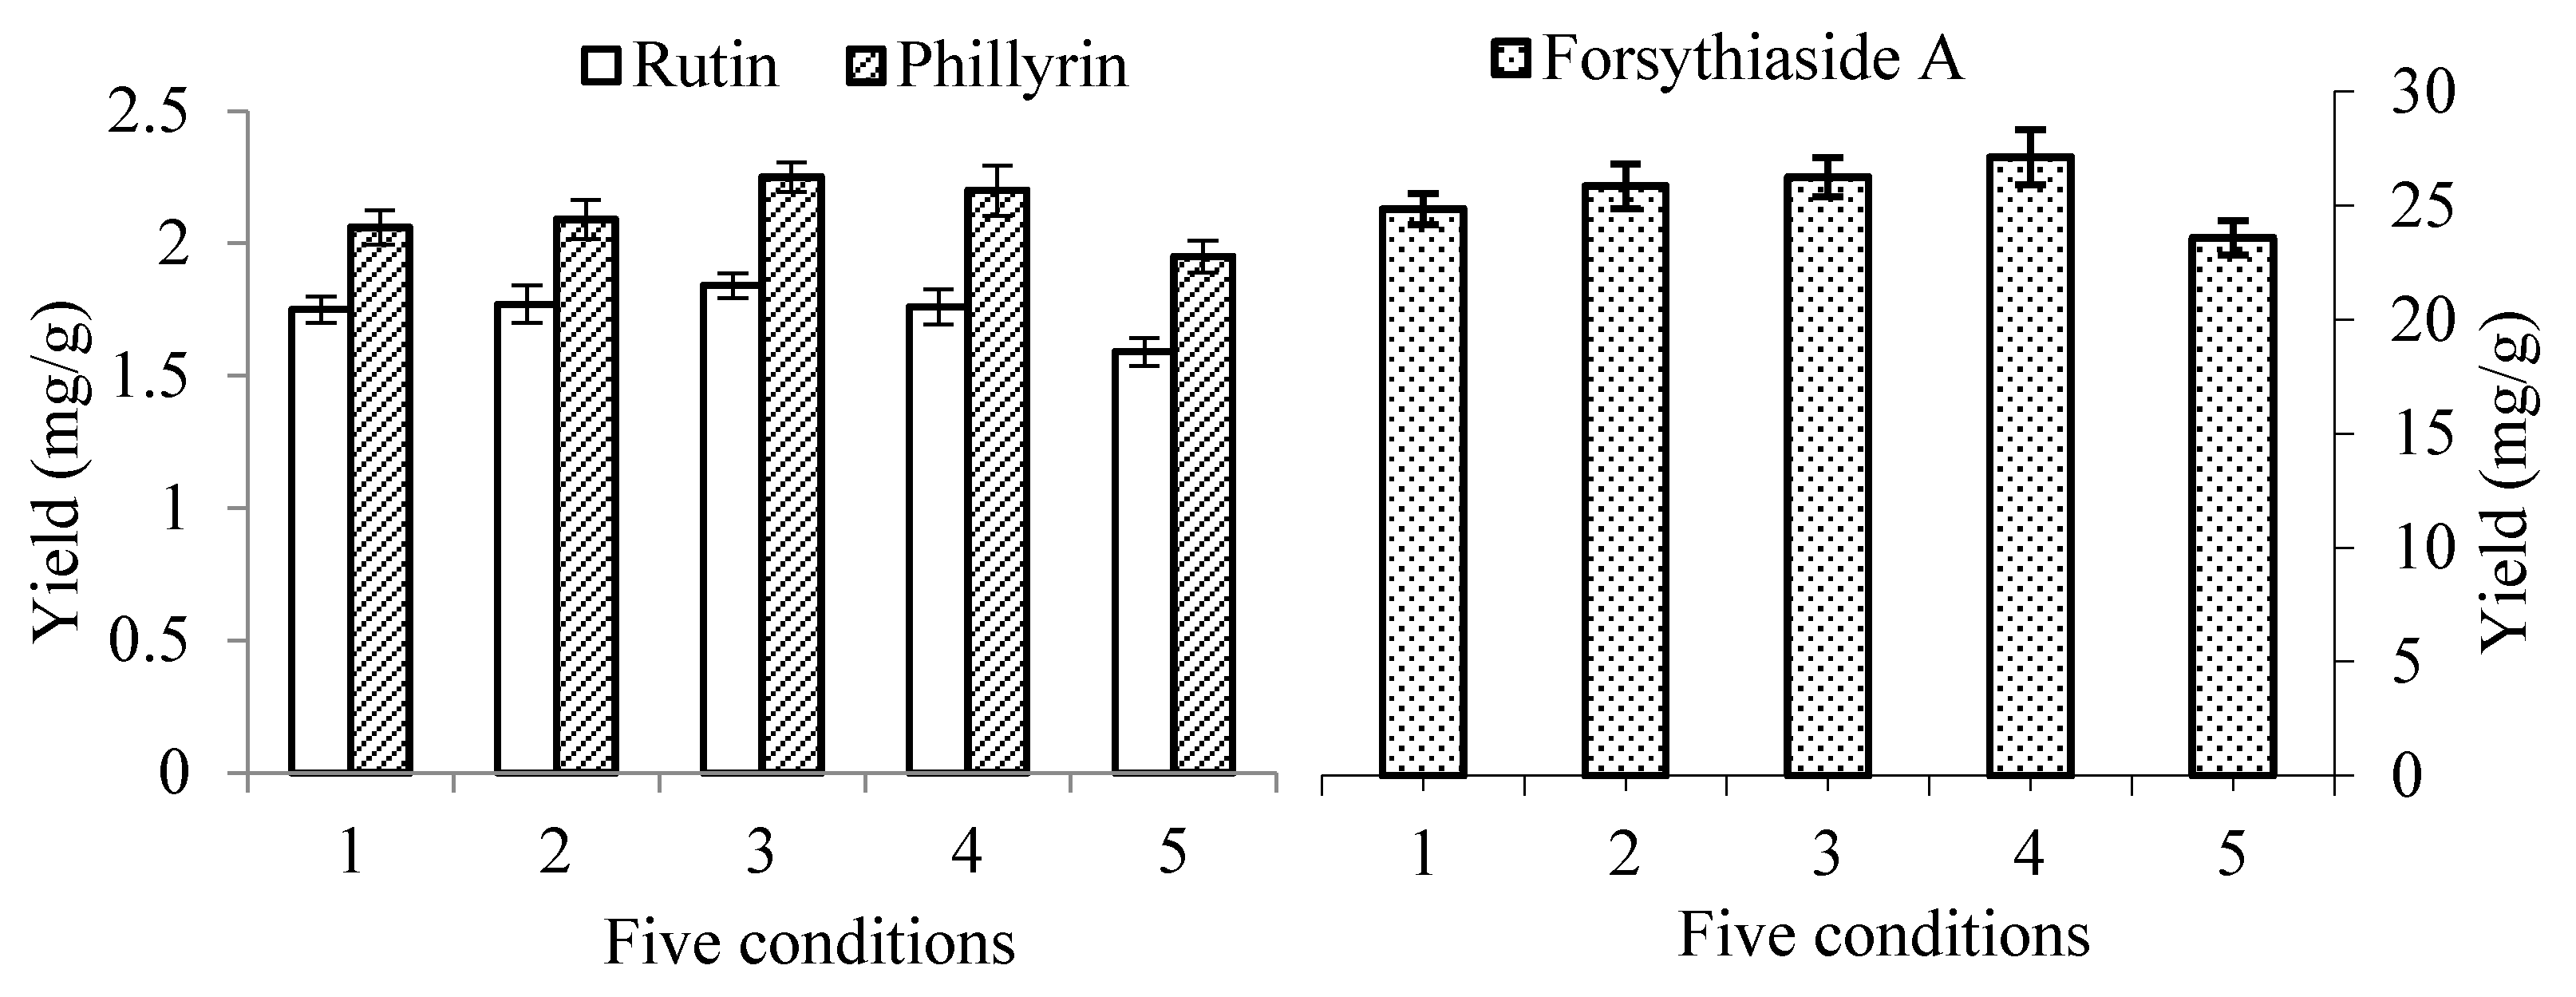
2.3. Validation of UAE and Comparison with Conventional Methods
2.4. Analytical Method Performance
3. Materials and Methods
3.1. Materials, Standards and Reagents
3.2. Methods
3.2.1. Extraction Methods
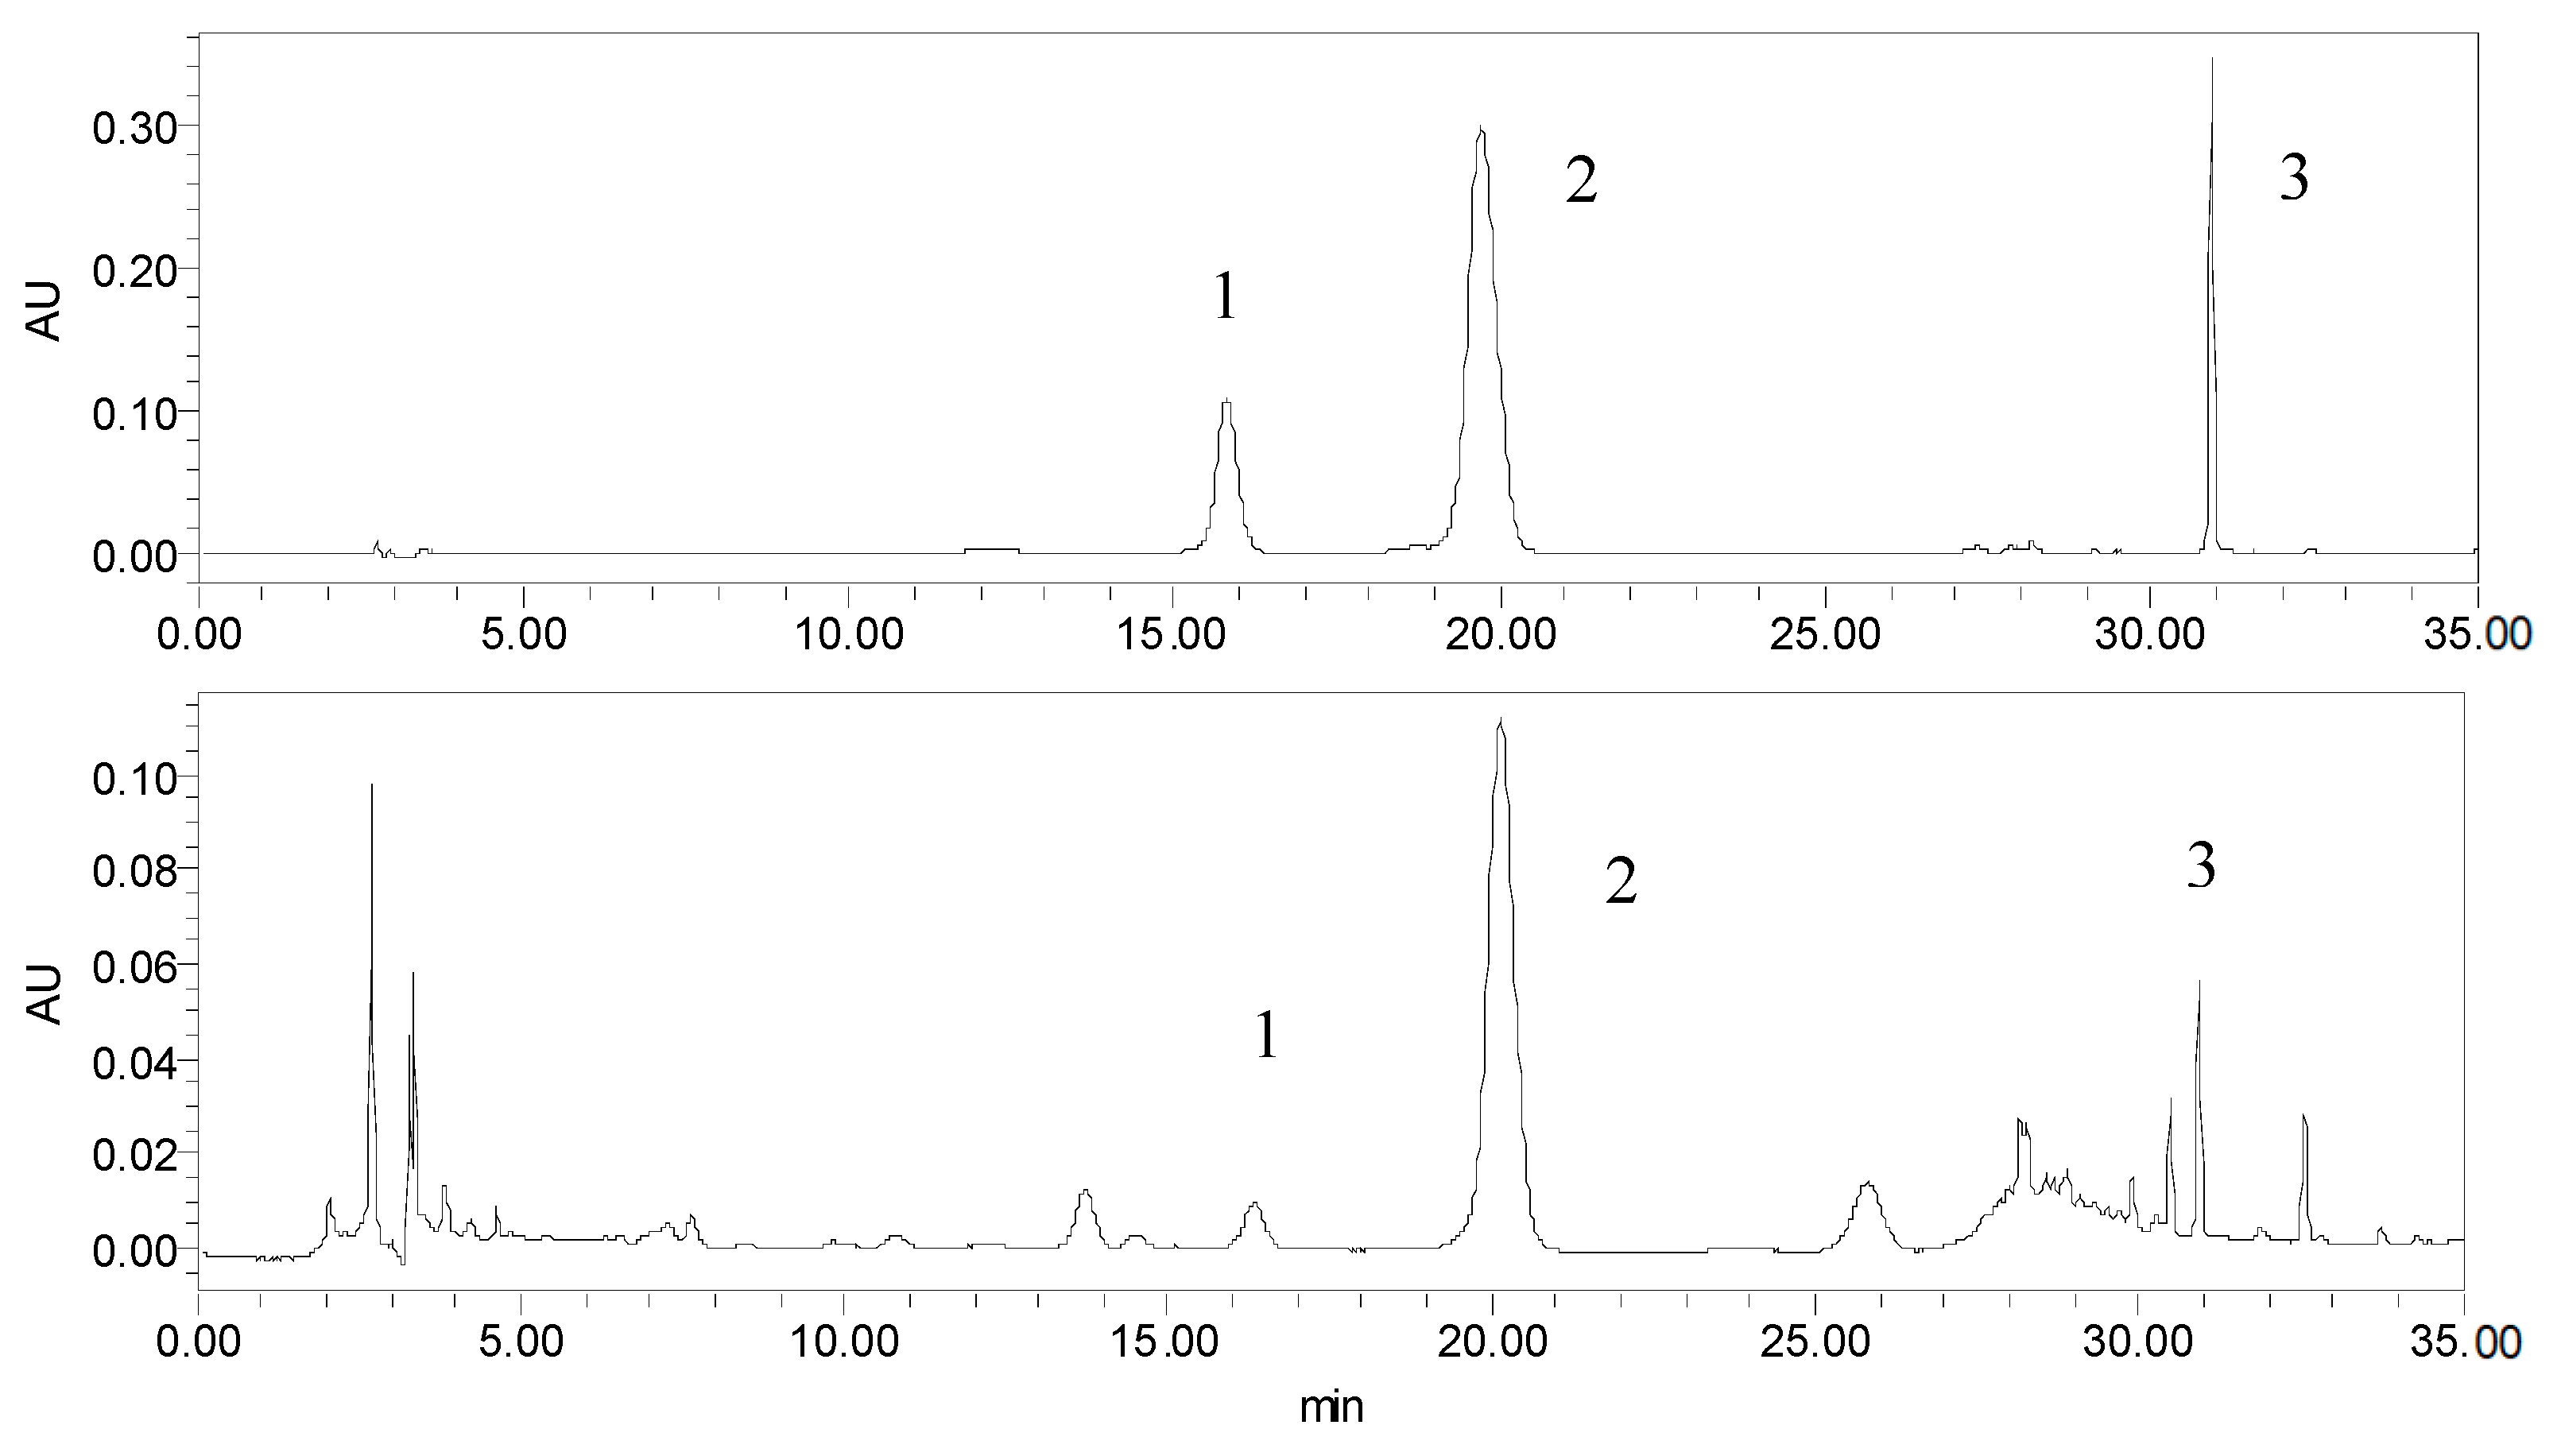
3.2.2. HPLC Analysis
3.2.3. Single Factor Experiments
3.2.4. Response Surface Design
4. Conclusions
Author Contributions
Funding
Conflicts of Interest
References
- National Committee of Chinese Pharmacopoeia. Pharmacopoeia of P. R. China; Chemical Industry Press: Beijing, China, 2015; pp. 170–171. [Google Scholar]
- Nishibe, S.; Okabe, K.; Tsukamoto, H.; Sakushima, A.; Hisada, S.; Baba, H.; Akisada, T. Studies on the Chinese crude drug “Forsythiae Fructus”. VI. The structure and antibacterial activity of suspensaside isolated from Forsythia suspense. Chem. Pharm. Bull. 1982, 30, 4548–4553. [Google Scholar] [CrossRef] [PubMed]
- Prieto, J.M.; Recio, M.C.; Giner, R.M.; Manez, S.; Giner, E.M.; Rios, J.L. Influence of traditional Chinese anti-inflammatory medicinal plants on leukocyte and platelet functions. J. Pharm. Pharmacol. 2003, 55, 1275–1282. [Google Scholar] [CrossRef] [PubMed]
- Ozaki, Y.; Rui, J.; Tang, Y.T. Anti-inflammatory effect of Forsythia suspense V (AHL) and its active principle. Biol. Pharm. Bull. 2000, 23, 365–367. [Google Scholar] [CrossRef] [PubMed]
- Qu, H.; Zhang, Y.; Wang, Y.; Li, B.; Sun, W. Antioxidant and antibacterial activity of two compounds (forsythiaside and forsythin) isolated from Forsythia suspense. J. Pharm. Pharmacol. 2008, 60, 261–266. [Google Scholar] [CrossRef] [PubMed]
- Guo, H.; Liu, A.H.; Ye, M.; Yang, M.; Guo, D.A. Characterization of phenolic compounds in the fruits of Forsythia suspensa by high-performance liquid chromatography coupled with electrospray ionization tandem mass spectrometry. Rapid Commun. Mass Spectrom. 2007, 21, 715–729. [Google Scholar] [CrossRef] [PubMed]
- Qu, H.H.; Li, B.X.; Li, X.; Tu, G.Z.; Lü, J.; Sun, W.J. Qualitative and quantitative analyses of three bioactive compounds in different parts of Forsythia suspensa by high-performance liquid chromatography-electrospray ionization-mass spectrometry. Microchem. J. 2008, 89, 159–164. [Google Scholar] [CrossRef]
- Wang, Z.Y.; Xia, Q.; Liu, X.; Liu, W.X.; Huang, W.Z.; Mei, X.; Luo, J.; Shan, M.X.; Lin, R.C.; Zou, D.X.; Ma, Z.Q. Phytochemistry, pharmacology, quality control and future research of Forsythia suspensa (Thunb.) Vahl: A review. J. Ethnopharmacol. 2018, 210, 318–339. [Google Scholar] [CrossRef] [PubMed]
- Li, H.; Wu, J.; Zhang, Z.; Ma, Y.; Liao, F.; Zhang, Y.; Wu, G. Forsythoside a inhibits the avian infectious bronchitis virus in cell culture. Phytother. Res. 2011, 25, 338–342. [Google Scholar] [CrossRef] [PubMed]
- Lu, T.; Piao, X.L.; Zhang, Q.; Wang, D.; Piao, X.S.; Kim, S.W. Protective effects of Forsythia suspensa extract against oxidative stress induced by diquat in rats. Food Chem. Toxicol. 2010, 48, 764–770. [Google Scholar] [CrossRef] [PubMed]
- Iizuka, T.; Nagai, M. Vasorelaxant effects of forsythiaside from the fruits of Forsythia suspensa. J. Pharm. Soc. Jpn. 2005, 125, 219–224. [Google Scholar] [CrossRef]
- Kim, J.M.; Kim, S.; Kim, D.H.; Lee, C.H.; Park, S.J.; Jung, J.W.; Ko, K.H.; Cheong, J.H.; Lee, S.H.; Ryu, J.H. Neuroprotective effect of forsythiaside against transient cerebral global ischemia in gerbil. Eur. J. Pharmacol. 2011, 660, 326–333. [Google Scholar] [CrossRef] [PubMed]
- Wang, H.M.; Wang, L.W.; Liu, X.M.; Li, C.L.; Xu, S.P.; Farooq, A.D. Neuroprotective effects of forsythiaside on learning and memory deficits in senescence-accelerated mouse prone (SAMP8) mice. Pharmacol. Biochem. Behav. 2013, 105, 134–141. [Google Scholar] [CrossRef] [PubMed]
- Qu, X.Y.; Li, Q.J.; Zhang, H.M.; Zhang, X.J.; Shi, P.H.; Zhang, X.J.; Yang, J.; Zhou, Z.; Wang, S.Q. Protective effects of phillyrin against influenza A virus in vivo. Arch. Pharm. Res. 2016, 39, 998–1005. [Google Scholar] [CrossRef] [PubMed]
- Zhong, W.T.; Wu, Y.C.; Xie, X.X.; Zhou, X.A.; Wei, M.M.; Soromou, L.W.; Ci, X.X.; Wang, D.C. Phillyrin attenuates LPS-induced pulmonary inflammation via suppression of MAPK and NF-κB activation in acute lung injury mice. Fitoterapia 2013, 90, 132–139. [Google Scholar] [CrossRef] [PubMed]
- Kamalakkannan, N.; Prince, P.S.M. Rutin improves the antioxidant status in streptozotocin-induced diabetic rat tissues. Mol. Cell Biochem. 2006, 293, 211–219. [Google Scholar] [CrossRef] [PubMed]
- Janbaz, K.H.; Saeed, S.A.; Gilani, A.H. Protective effect of rutin on paracetamol and CCl4-induced hepatotoxicity in rodents. Fitoterapia 2002, 73, 557–563. [Google Scholar] [CrossRef]
- Panchal, S.K.; Poudyal, H.; Arumugam, T.V.; Brown, L. Rutin attenuates metabolic changes, nonalcoholic steatohepatitis, and cardiovascular remodeling in high-carbohydrate, high-fat diet-fed rats. J. Nutr. 2011, 141, 1062–1069. [Google Scholar] [CrossRef] [PubMed]
- Kim, H.; Kong, H.; Choi, B.; Yang, Y.; Kim, Y.; Lim, M.J. Metabolic and pharmacological properties of rutin, a dietary quercetin glycoside, for treatment of inflammatory bowel disease. Pharm. Res. 2005, 22, 1499–1509. [Google Scholar] [CrossRef] [PubMed]
- Koda, T.; Kuroda, Y.; Imai, H. Protective effect of rutin against spatial memory impairment induced by trimethyltin in rats. Nutr. Res. 2008, 28, 629–634. [Google Scholar] [CrossRef] [PubMed]
- Vinatoru, M. An overview of the ultrasonically assisted extraction of bioactive principles from herbs. Ultrason. Sonochem. 2001, 8, 303–313. [Google Scholar] [CrossRef]
- Garcia-Castello, E.M.; Rodriguez-Lopez, A.D.; Mayor, L.; Ballesteros, R.; Conidi, C.; Cassano, A. Optimization of conventional and ultrasound assisted extraction of flavonoids from grapefruit (Citrus paradisi L.) solid wastes. LWT Food Sci. Technol. 2015, 64, 1114–1122. [Google Scholar] [CrossRef]
- Tekin, K.; Akalın, M.K.; Şeker, M.G. Ultrasound bath-assisted extraction of essential oils from clove using central composite design. Ind. Crop. Prod. 2015, 77, 954–960. [Google Scholar] [CrossRef]
- Xia, E.Q.; Ai, X.X.; Zang, S.Y.; Guan, T.T.; Xu, X.R.; Li, H.B. Ultrasound-assisted extraction of phillyrin from Forsythia suspense. Ultrason. Sonochem. 2011, 18, 549–552. [Google Scholar] [CrossRef] [PubMed]
- Porto, C.D.; Porretto, E.; Decorti, D. Comparison of ultrasound-assisted extraction with conventional extraction methods of oil and polyphenols from grape (Vitisvinifera L.) seeds. Ultrason. Sonochem. 2013, 20, 1076–1080. [Google Scholar] [CrossRef] [PubMed]
- Chen, S.S.; Zeng, Z.; Hu, N.; Bai, B.; Wang, H.L.; Suo, Y.R. Simultaneous optimization of the ultrasound-assisted extraction for phenolic compounds content and antioxidant activity of Lycium ruthenicum Murr. fruit using response surface methodology. Food Chem. 2018, 242, 1–8. [Google Scholar] [CrossRef] [PubMed]
- Zhou, T.; Xu, D.P.; Lin, S.J.; Li, Y.; Zheng, J.; Zhou, Y.; Zhang, J.J.; Li, H.B. Ultrasound-Assisted Extraction and Identification of Natural Antioxidants from the Fruit of Melastoma sanguineum Sims. Molecules 2017, 22, 306. [Google Scholar] [CrossRef] [PubMed]
- Xu, D.P.; Zhou, Y.; Zheng, J.; Li, S.; Li, A.N.; Li, H.B. Optimization of ultrasound-assisted extraction of natural antioxidants from the flower of Jatropha integerrima by response surface methodology. Molecules 2016, 21, 18. [Google Scholar] [CrossRef] [PubMed]
- Chemat, F.; Huma, Z.; Khan, M.K. Applications of ultrasound in food technology: Processing, preservation and extraction. Ultrason. Sonochem. 2011, 18, 813–835. [Google Scholar] [CrossRef] [PubMed]
- Saleh, I.A.; Vinatoru, M.; Mason, T.J.; Abdel-Azim, N.S.; Aboutabl, E.A.; Hammouda, F.M. A possible general mechanism for ultrasound-assisted extraction (UAE) suggested from the results of UAE of chlorogenic acid from Cynara scolymus L. (artichoke) leaves. Ultrason. Sonochem. 2016, 31, 330–336. [Google Scholar] [CrossRef] [PubMed]
- Sun, Y.S.; Hou, Z.; Liu, Z.B.; Wang, J.H. Ionic Liquid-Based Ultrasonic-Assisted Extraction of Forsythosides from the Leaf of Forsythia suspensa (Thunb.) Vahl and Subsequent Separation and Purification by High-Speed Counter-Current Chromatography. J. Chromatogr. Sci. 2016, 54, 1445–1452. [Google Scholar] [CrossRef] [PubMed]
- Fang, X.S.; Wang, Y.Z.; Wang, J.H.; Zhang, J.; Wang, X. Microwave-assisted extraction followed by RP-HPLC for the simultaneous extraction and determination of forsythiaside A, rutin, and phillyrin in the fruits of Forsythia suspense. J. Sep. Sci. 2013, 36, 2672–2679. [Google Scholar] [CrossRef] [PubMed]
- Guo, H.; Liu, A.H.; Li, L.; Guo, D.A. Simultaneous determination of 12 major constituents in Forsythia suspensa by high performance liquid chromatography-DAD method. J. Pharm. Biomed. Anal. 2007, 43, 1000–1006. [Google Scholar] [CrossRef] [PubMed]
- Vilkhu, K.; Mawson, R.; Simons, L.; Bates, D. Applications and opportunities for ultrasound assisted extraction in the food industry—A review. Innov. Food Sci. Emerg. 2008, 9, 161–169. [Google Scholar] [CrossRef]
- Chivate, M.M.; Panditt, A.B. Quantification of cavitation intensity in fluid bulk. Ultrason. Sonochem. 1995, 2, 19–25. [Google Scholar] [CrossRef]
- Xu, Y.; Pan, S.Y. Effects of various factors of ultrasonic treatment on the extraction yield of all-trans-lycopene from red grapefruit (Citrus paradise Macf.). Ultrason. Sonochem. 2013, 20, 1026–1032. [Google Scholar] [CrossRef] [PubMed]
- Shirsath, S.R.; Sable, S.S.; Gaikwad, S.G.; Sonawane, S.H.; Saini, D.R.; Gogate, P.R. Intensification of extraction of curcumin from Curcuma amada using ultrasound assisted approach: Effect of different operating parameters. Ultrason. Sonochem. 2017, 38, 437–445. [Google Scholar] [CrossRef] [PubMed]
- Xu, W.J.; Zhai, J.W.; Cui, Q.; Liu, J.Z.; Luo, M.; Fu, Y.J.; Zu, Y.G. Ultra-turrax based ultrasound-assisted extraction of five organic acids from honeysuckle (Lonicera japonica Thunb.) and optimization of extraction process. Sep. Purif. Technol. 2016, 166, 73–82. [Google Scholar] [CrossRef]
- Jovanović, A.A.; Đorđević, V.B.; Zdunić, G.M.; Pljevljakušić, D.S.; Šavikin, K.P.; Gođevac, D.M.; Bugarski, B.M. Optimization of the extraction process of polyphenols from Thymus serpyllum L. herb using maceration, heat- and ultrasound-assisted techniques. Sep. Purif. Technol. 2017, 179, 369–380. [Google Scholar] [CrossRef]
- Wei, M.C.; Yang, Y.C. Extraction characteristics and kinetic studies of oleanolic and ursolic acids from Hedyotisdiffusa under ultrasound-assisted extraction conditions. Sep. Purif. Technol. 2014, 130, 182–192. [Google Scholar] [CrossRef]
- Caleja, C.; Barros, L.; Prieto, M.A.; Barreiro, M.F.; Beatriz, M.; Oliveira, P.P.; Ferreira, I.C.F.R. Extraction of rosmarinic acid from Melissa officinalis L. by heat-, microwave- and ultrasound-assisted extraction techniques: A comparative study through response surface analysis. Sep. Purif. Technol. 2017, 186, 297–308. [Google Scholar] [CrossRef]
- Lewis, G.A.; Mathieu, D.; Phan-Tan-Luu, R. Pharmaceutical Experimental Design; Marcel Dekkler: New York, NY, USA, 1999. [Google Scholar]
Sample Availability: Sample of the fruits of Forsythia suspensa is available from the authors. |


| No. Exp. | Ethanol Concentration (%) | Solvent Ratio (mL/g) | Extraction Time (min) | Extraction Yield (mg/g) | ||
|---|---|---|---|---|---|---|
| FSA | PHI | RT | ||||
| 1 | 80 | 25 | 10 | 24.58 | 2.28 | 1.66 |
| 2 | 40 | 15 | 25 | 29.14 | 2.06 | 1.81 |
| 3 | 80 | 15 | 25 | 23.02 | 1.96 | 1.76 |
| 4 | 60 | 25 | 25 | 32.72 | 2.49 | 1.87 |
| 5 | 60 | 35 | 40 | 32.80 | 2.47 | 1.91 |
| 6 | 60 | 15 | 40 | 30.44 | 2.19 | 1.84 |
| 7 | 80 | 35 | 25 | 26.02 | 2.30 | 1.74 |
| 8 | 40 | 25 | 10 | 26.42 | 2.26 | 1.83 |
| 9 | 60 | 25 | 25 | 32.24 | 2.48 | 1.85 |
| 10 | 80 | 25 | 40 | 25.82 | 2.19 | 1.80 |
| 11 | 60 | 25 | 25 | 31.26 | 2.45 | 1.84 |
| 12 | 60 | 15 | 10 | 29.32 | 2.2 | 1.72 |
| 13 | 40 | 25 | 40 | 29.50 | 2.23 | 1.97 |
| 14 | 60 | 25 | 25 | 31.5 | 2.52 | 1.88 |
| 15 | 40 | 35 | 25 | 31.46 | 2.34 | 1.94 |
| 16 | 60 | 25 | 25 | 31.42 | 2.47 | 1.86 |
| 17 | 60 | 35 | 10 | 31.68 | 2.38 | 1.77 |
| Coefficient | FSA | PHI | RT |
|---|---|---|---|
| β0 | −9.36 | −0.29 | 1.22 |
| β1 | 1.25 ** | 0.056 | 7.38 × 10⁻³ ** |
| β2 | 0.059 ** | 0.067 ** | 0.026 ** |
| β3 | 0.32 * | 9.28 × 10⁻³ | 8.94 × 10⁻³ ** |
| β12 | 8.50 × 10⁻⁴ | 7.50 × 10⁻⁵ | −1.88 × 10⁻⁴ ** |
| β13 | −1.5 × 10⁻³ | −5.00 × 10⁻⁵ | 2.08 × 10⁻¹⁹ |
| β23 | −2.4 × 10⁻¹⁷ | 1.67 × 10⁻⁴ | 3.33 × 10⁻⁵ |
| β11 | −0.011 ** | −4.84 × 10⁻⁴ ** | −5.31 × 10⁻⁵ * |
| β22 | 3.1 × 10⁻⁴ | −1.24 × 10⁻³ ** | −2.63 × 10⁻⁴ * |
| β33 | −3.55 × 10⁻³ | −2.16 × 10⁻⁴ | −1.06 × 10⁻⁴ * |
| Model (p-value) | 0.0006 | 0.0002 | <0.0001 |
| Lack of Fit (p-value) | 0.093 | 0.078 | 0.358 |
| Extraction Methods | Solvent | Extraction Time (min) | Extraction Yields (mg/g) | ||
|---|---|---|---|---|---|
| FSA | RT | PHI | |||
| UAE | 50% Ethanol | 37 | 32.80 ± 1.03 | 1.90 ± 0.035 | 2.47 ± 0.11 |
| HRE | 50% Ethanol | 90 | 29.44 ± 1.20 | 1.50 ± 0.030 | 1.96 ± 0.085 |
| SE | Methanol | 240 | 31.97 ± 0.99 | 1.74 ± 0.070 | 2.10 ± 0.067 |
| DE | Water | 270 | 22.15 ± 0.79 | 1.28 ± 0.065 | 1.64 ± 0.092 |
| Compounds | Regression Equation | Regression Coefficient (r2) | Linear Range (µg/mL) |
|---|---|---|---|
| RT | y = 2E + 07x + 49,211 | 0.9993 | 2.30–153.00 |
| FSA | y = 2E + 07x + 129,820 | 0.9997 | 7.40–644.00 |
| PHI | y = 1E + 07x + 22,223 | 0.9996 | 2.06–103.00 |
| Independent Variables | Levels | ||
|---|---|---|---|
| −1 | 0 | 1 | |
| Ethanol concentration (X1) (%) | 40 | 60 | 80 |
| Solvent to material ratio (X2) (mL/g) | 15 | 25 | 35 |
| Extraction time (X3) (min) | 10 | 25 | 40 |
© 2018 by the authors. Licensee MDPI, Basel, Switzerland. This article is an open access article distributed under the terms and conditions of the Creative Commons Attribution (CC BY) license (http://creativecommons.org/licenses/by/4.0/).
Share and Cite
Fang, X.; Gu, S.; Jin, Z.; Hao, M.; Yin, Z.; Wang, J. Optimization of Ultrasonic-Assisted Simultaneous Extraction of Three Active Compounds from the Fruits of Forsythia suspensa and Comparison with Conventional Extraction Methods. Molecules 2018, 23, 2115. https://doi.org/10.3390/molecules23092115
Fang X, Gu S, Jin Z, Hao M, Yin Z, Wang J. Optimization of Ultrasonic-Assisted Simultaneous Extraction of Three Active Compounds from the Fruits of Forsythia suspensa and Comparison with Conventional Extraction Methods. Molecules. 2018; 23(9):2115. https://doi.org/10.3390/molecules23092115
Chicago/Turabian StyleFang, Xinsheng, Shubo Gu, Zongyuan Jin, Mingqian Hao, Zhenzhen Yin, and Jianhua Wang. 2018. "Optimization of Ultrasonic-Assisted Simultaneous Extraction of Three Active Compounds from the Fruits of Forsythia suspensa and Comparison with Conventional Extraction Methods" Molecules 23, no. 9: 2115. https://doi.org/10.3390/molecules23092115
APA StyleFang, X., Gu, S., Jin, Z., Hao, M., Yin, Z., & Wang, J. (2018). Optimization of Ultrasonic-Assisted Simultaneous Extraction of Three Active Compounds from the Fruits of Forsythia suspensa and Comparison with Conventional Extraction Methods. Molecules, 23(9), 2115. https://doi.org/10.3390/molecules23092115