Abstract
Plant P-type H+-ATPase (P-ATPase) is a membrane protein existing in the plasma membrane that plays an important role in the transmembrane transport of plant cells. To understand the variety and quantity of P-ATPase proteins in different cotton species, we combined four databases from two diploid cotton species (Gossypium raimondii and G. arboreum) and two tetraploid cotton species (G. hirsutum and G. barbadense) to screen the P-ATPase gene family and resolved the evolutionary relationships between the former cotton species. We identified 53, 51, 99 and 98 P-ATPase genes from G. arboretum, G. raimondii, G. barbadense and G. hirsutum, respectively. The structural and phylogenetic analyses revealed that the gene structure was consistent between P-ATPase genes, with a close evolutionary relationship. The expression analysis of P-ATPase genes showed that many P-ATPase genes were highly expressed in various tissues and at different fiber developmental stages in G. hirsutum, suggesting that they have potential functions during growth and fiber development in cotton.
1. Introduction
H+-ATPase is a membrane protein that is widely present in the plant plasma membrane and various endomembranes, and plays an important role in cell metabolism. The representative H+-ATPases are currently divided into three types according to structure, namely the vacuolar-type H+-ATPases (V-ATPases), H+-pyrophosphatases (H+-PPases) and P type H+-ATPases (P-ATPase). The H+-PPases is located in vacuolar or endomembranes; the vacuole H+-ATPase is a V-type ATPase; and the plasma membrane H+-ATPase belongs to the P-type ATPase. As a P-type pump, P-ATPase can generate and maintain the electrochemical gradient of H+ on both sides of the cell membrane by decomposing intracellular ATP and providing energy for the transmembrane transport of various nutrients and ions [1,2]. In addition, the plant P-ATPase also participates in the regulation of various physiological processes, such as intracellular pH, cell elongation, stomatal opening and closing, and plant response to environmental stress [3,4].
To date, 10 subfamilies of P-ATPase have been identified according to their transport of various ions, heavy metals and possibly lipids: P1B (heavy metal ion ATPases [HMA]), P2A (endoplasmic reticulum Ca2+ ATPase [ECA]), P2B (autoinhibited Ca2+ ATPase [ACA]), P3A (autoinhibited H+ ATPase (AHA)), P4 (putative aminophospholipid ATPase [ALA]), P5 (unknown ATPase), P1A (K+ ATPase), P2C (Na+/K+ ATPase), P2D (Na+ or Ca2+ ATPase), and P3B (Mg2+ ATPase) [5,6]. Forty-six P-ATPase genes have been identified in Arabidopsis [7], and 43 P-ATPase genes have been identified in rice [8]. The gene numbers of five subfamilies (P1B, P2A, P2B, P3A, and P4) are high, but there are few P5 subfamily genes, while the genes of the P2C, P2D, P1A and P3B subfamilies were absent in Arabidopsis and rice [8].
Some studies have revealed that P-ATPase genes play an important role in primary metabolic and secondary metabolic processes in plants. For example, some genes of the P3A subfamily can affect the transport of anthocyanins and proanthocyanidins (PAs) in plants, such as TT13 in Arabidopsis [9] and PH5 in petunia [10]. However, there are only a few detailed reports about P3A-ATPase in cotton, especially involving the transport of PAs, while another study reported that pigment formation in brown cotton fiber is related to the transport of PAs [11]. Cotton is the most important fiber crop in China with wide varieties. The whole genome sequencing of two diploid cotton species (G. arboretum and G. raimondii) and two tetraploid cotton species (G. barbadense and G. hirsutum) has been completed [12,13,14,15]. In this study, the P-ATPase genes of four cotton species were identified, screened and analyzed using bioinformatics, the evolutionary relationship of the P-ATPase family in cotton has been preliminarily discussed, and the expression pattern of the P-ATPase gene in upland cotton has been analyzed. To search for possible genes related to PA accumulation, fluorescent quantitative analysis of the P3A-ATPase subfamily of genes of brown cotton fibers was used, combined with the accumulation of PAs in brown cotton fibers. This study lays the foundation for further cloning and utilization of P-ATPase genes to cultivate new varieties of colored cotton.
2. Results
2.1. Identification of P-ATPase Genes in Cotton
We first queried the specific domains of Arabidopsis AHA10 (PF00122, PF00702, and PF00690) on the Pfam website and used the amino acid sequences of these domains to search for candidate genes in the local databases of G. arboretum, G. raimondii, G. barbadense and G. hirsutum, which were previously established. We screened these candidate genes using the PFAM and SMART databases [16,17] and identified 301 P-ATPase genes with specific domains of P-ATPase genes in four cotton species. Fifty-one P-ATPase genes were found in G. raimondii and 53 P-ATPase genes were found in G. arboretum, similar to those in Arabidopsis and rice, containing 46 and 43 P-ATPase genes, respectively. However, 99 and 98 P-ATPase genes were found in the tetraploid cotton G. barbadense and G. hirsutum, respectively. These genes in cotton were classified and named according to the classifications and names of the P-ATPase genes in Arabidopsis.
In addition, the lengths and molecular weights of proteins encoded by the P-ATPase genes were analyzed. The characteristics of 301 P-ATPase genes in G. raimondii, G. hirsutum, G. arboreum and G. barbadense suggested that the lengths of all P-ATPase proteins differed largely, ranging from 800 to 1301 aa; the molecular weights of the P-ATPase proteins ranged from 90 to 140 kDa in G. arboretum and G. raimondii, and the lengths and molecular weights of most P-ATPase proteins in G. barbadense and G. hirsutum had a similar trend as those in G. arboretum and G. raimondii, but some proteins were different. For example, GhHMA10 encodes 420 amino acids with a molecular weight of 44.9kDa, and GbAHA23 encodes 1646 aa with a molecular weight of 183.48 kDa. The isoelectric points of all P-ATPase proteins were predicted; the minimum was 4.82, and the maximum was 8.81 (Table S1).
2.2. Chromosome Distribution of P-ATPase Genes
To better understand the distribution of P-ATPase genes on chromosomes, according to the genome database information of G. raimondii, G. arboretum and G. hirsutum, the chromosome localization was mapped. The results showed that the P-ATPase genes of G. hirsutum were tagged on 21 chromosomes, and the P-ATPase genes of G. raimondii and G. arboretum were tagged on 12 and 13 chromosomes (Figure 1). The P1B-ATPase genes of G. hirsutum were distributed in nine chromosomes (At1, Dt1, At4, At5, Dt5, At8, Dt8, At9 and Dt9), and each chromosome had only one gene, while the P1B-ATPase genes of G. raimondii and G. arboretum were all distributed in 6 chromosomes, with only one or two genes on each chromosome (Figure 1). The distributions of the P2A-ATPase, P2B-ATPase, and P3A-ATPase genes in G. raimondii, G. arboretum and G. hirsutum were similar to that of the P1B-ATPase gene, but a few chromosomes had different distributions. For instance, there were four P2B-ATPase genes on the 6th chromosome of G. raimondii, 4 P2B-ATPase genes on the 3rd chromosome of G. arboretum, and six P3A-ATPase genes on the Dt9 chromosome. The P4 subfamily genes in four cotton species are evenly distributed on chromosomes, with one or two genes per chromosome.
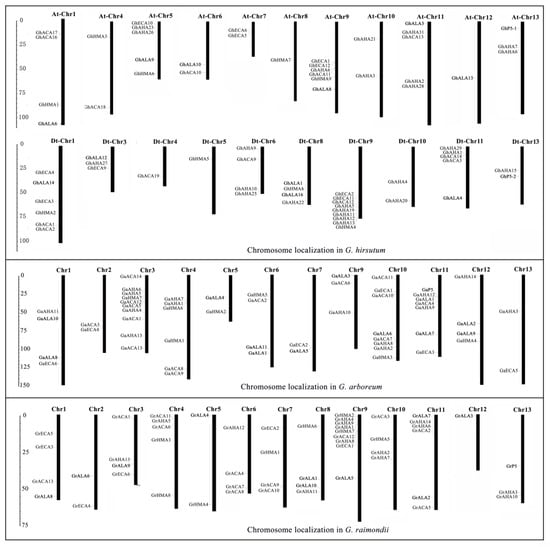
Figure 1.
Chromosomal localization of P-ATPase genes in G. hirsutum, G. arboretum, and G. raimondii. Number of P-ATPase genes on each chromosome and location of each gene on the chromosome are shown on the map. Scale number is in megabases (Mb).
2.3. Phylogenetic Analysis of the P-ATPase Genes
To determine the subfamily classification of P-ATPase genes in cotton species and the number of genes in each subfamily, a phylogenetic tree was constructed with the sequences of 51 P-ATPase proteins in G. raimondii, 53 P-ATPase proteins in G. arboretum, 98 P-ATPase proteins in G. hirsutum, 99 P-ATPase proteins in G. barbadense and 45 P-ATPase proteins in Arabidopsis. As shown in the result, all P-ATPases genes in each cotton species could be clustered into six subfamilies: P1B, P2B, P2A, P3A, P4 and P5 (Figure 2). The gene numbers of each subfamily in G. raimondii and G. arboretum were very similar, and there were large numbers in the P2B and P3A subfamilies, which were approximately twice those in the P1B, P2A and P4 subfamilies. (Figure 2). In G. hirsutum, the gene numbers were approximately twice that of G. raimondii and G. arboretum, but the distribution of genes in each subfamily was similar to G. raimondii, with the most genes in the P3A subfamily and the least in the P2A subfamily. In G. barbadense, P2B-ATPase genes were most abundant, while P2A-ATPase genes were least abundant. Interestingly, the member of P5 subfamily was very few in the five plants, only one or two genes (Table S2).
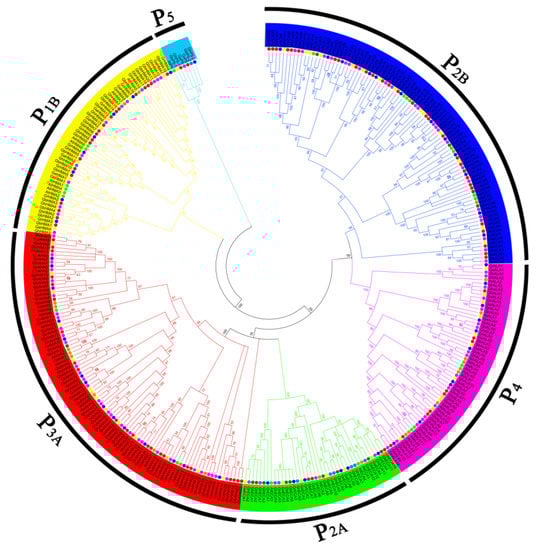
Figure 2.
Phylogenetic tree of P-ATPase genes in various cottons and Arabidopsis, constructed by neighbor-joining (NJ) using MEGA 5 software (1000 bootstrap replicates). Different colors indicate different subfamilies of P-ATPase, the green, orange, blue, red and purple dots indicate Arabidopsis, G. arboretum, G. raimondii, G. barbadense and G. hirsutum respectively.
2.4. Evolutionary Relationship Analysis of P-ATPase Genes
To gain insight into the evolutionary relationship of P-ATPase genes in G. arboretum, G. raimondii, G. barbadense and G. hirsutum, a phylogenetic tree was constructed according to the protein sequences of the P-ATPase genes in four cotton species, and the P-ATPase gene structures were analyzed with their CDS sequences using the GSDS online tool [18]. The results showed that most P-ATPase genes contained introns and exons, and most P-ATPase genes in G. raimondii and G. barbadense also contained untranslated regions (UTRs). Almost all P3A subfamily genes contained 10–20 introns, the P1B subfamily genes contained 5–20 introns, and most P2A subfamily genes contained 5–10 introns, but some genes contained more than 20 introns (Figure 3). Interestingly, the structures of the P1B subfamily genes on different branches had significant differences. Most genes in class C did not contain introns or contained only one, and most genes in class A contained 5–7 introns, but all genes in class B contained more than 30 introns. In the phylogenetic tree, the gene structures of most paralogous gene pairs between G. hirsutum and G. arboretum/G. raimondii were very similar, which suggests that their genetic relationship is close, and these paralogous genes had high homology. However, the gene structures of paralogous gene pairs between G. barbadense and G. arboretum/G. raimondii were not close, which indicates that G. hirsutum has a closer genetic relationship to G. arboretum/G. raimondii than G. barbadense.
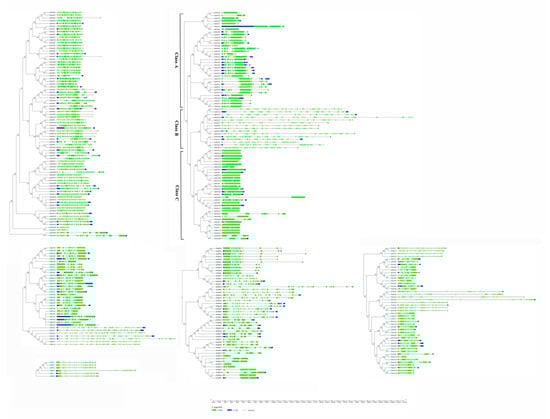
Figure 3.
Phylogenetic tree and structure of P-ATPase genes in G. arboretum, G. raimondii, G. hirsutum and G. barbadense. Green boxes, blue boxes and gray lines represent exons, UTRs and introns, respectively.
To further analyze the evolutionary relationship of P-ATPase genes in G. hirsutum, G. arboretum and G. raimondii, the collinearity of P-ATPase genes was drawn, using Circos software, between different cotton species. Twenty-one pairs of orthologous genes were identified between G. hirsutum and G. arboretum, and 16 pairs of orthologous genes were identified between G. hirsutum and G. raimondii. The results showed significant collinear relationships between G. hirsutum and G. arboretum or G. raimondii, and G. hirsutum was more closely related to G. arboretum than G. raimondii (Figure 4 and Table S3). In addition, the remaining genes in G. hirsutum do not have duplicative relationships with those in G. arboretum and G. raimondii, indicating that independent duplications might occur in G. hirsutum.
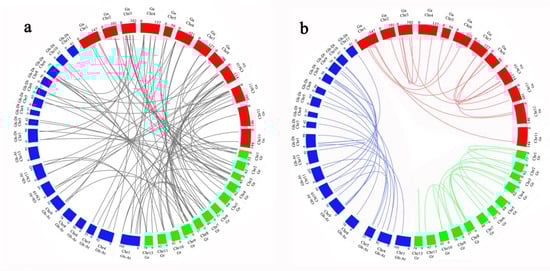
Figure 4.
Collinearity analysis of P-ATPase genes in G. hirsutum, G. arboreum, and G. raimondii.; (a) Duplication between G. hirsutum, G. arboreum, and G. raimondii, (b) Duplication within G. hirsutum, G. arboreum, and G. raimondii. Red, blue and green rectangles represent chromosomes of three cotton species. Blue, orange and gray lines represent genetic duplication in three cotton species themselves, and green lines indicate genetic duplication between different cotton species.
2.5. Expression Patterns of P-ATPase Genes in G. hirsutum
P-ATPase plays a variety of roles in plant cells. Thus, to realize the function of P-ATPase genes in G. hirsutum, the expression of P-ATPase genes in the different tissues (leaf, petal, pistil, root, stamen, stem and torus) and fibers was analyzed at various developmental stages (5 DPA,10 DPA, 20 DPA and 25 DPA). Among the 98 genes, 84 P-ATPase genes were at least expressed in one tissue or at one developmental stage of fiber because the value of log2 FPKM was more than 1. The heat map was plotted using R software. The results indicated that 84 P-ATPase genes might play a role at various growth stages of cotton, and the remaining 14 genes might be expressed in a special environment or were only pseudogenes. More than one-third of the 84 P-ATPase genes were widely expressed in the various tissues of cotton and at three developmental stages of cotton fiber, which suggested that these genes may participate in the whole growth and fiber development of cotton (Figure 5). In addition, some genes were highly expressed in the petal and pistil or stamen, suggesting that these genes may play a role in flower development. A few genes had higher expression at the three developmental stages of cotton fibers compared to other tissues, indicating that these genes are involved in the regulation of cotton fiber development. In the stem, leaf, and root, a few genes were highly expressed, showing that these genes may be involved in stress resistance. Interestingly, seven P-ATPase genes (GhAHA1, 2, 4–8) were only expressed in the stamen, suggesting that these genes are associated with a specific role in the development of the cotton stamen (Figure 5 and Table S4). A significantly different expression pattern in P-ATPase members in the same subfamily was observed, signifying that these genes performed functional differentiation, while a similar expression pattern of some genes from different subfamilies was observed, which showed that these genes may have a kind of synergy.
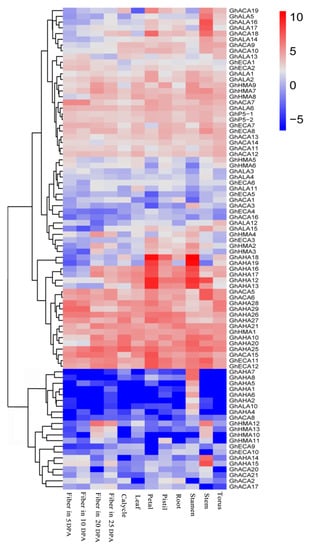
Figure 5.
Expression patterns of P-ATPase genes in G. hirsutum. Different colors represent expression level; –5 and 10 indicates the expression level, different colors represent expression level; red indicates high expression, white indicates low expression, and blue indicates not expressing.
2.6. Accumulation of PAs and Expression Analysis of P3A-ATPase Genes in Brown Cotton.
Some P3A-ATPase genes were found in Arabidopsis and petunia, such as TT13 and PH5 [9,10], which were related to the accumulation of PAs. Thus, we explored whether such genes are present in brown cotton. First, the contents of PAs at different development stages of brown cotton fiber were measured. As shown in Figure 6, the contents of PAs increased gradually with the development of fiber, reached the highest level at 12 DPA, and thereafter decreased gradually. The accumulation of PAs showed a trend that increased initially and then decreased gradually back to baseline. To find the genes in the P3A subfamily associated with the accumulation of PAs in brown cotton fiber, primers were designed according to the sequences of P3A-ATPase genes, and qRT-PCR was performed with the fibers at 6, 12, 24, and 30 DPA in brown cotton, respectively. The results suggested that the relative expression levels of most P3A-ATPase genes were not consistent with the accumulation of PAs in brown cotton fibers. However, GhAHA5, GhAHA 7, GhAHA 9, GhAHA10 and GhAHA11 showed a relative expression tendency similar to the PAs’ accumulation (Figure 7). Therefore, we hypothesized that one or more of these five genes may be related to the accumulation of PAs.
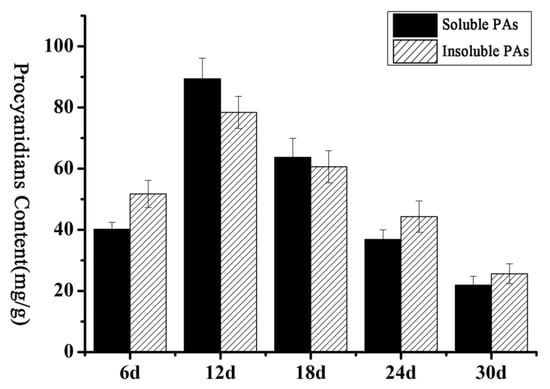
Figure 6.
PA content at different development stages of brown cotton fibers. Abscissa indicates different days post anthesis of cotton fibers, and ordinate indicates PA content, the error bars indicate SE.
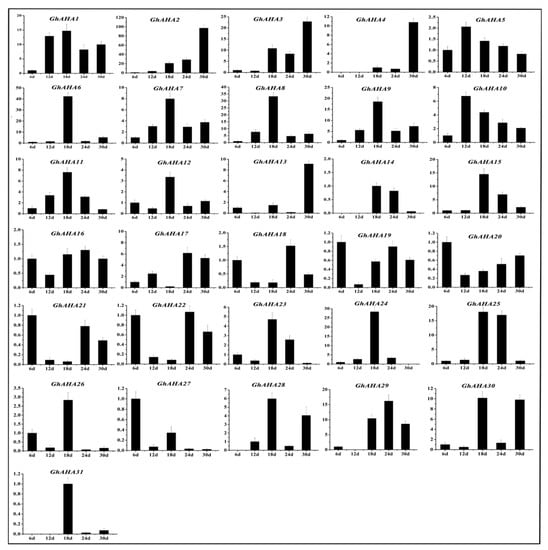
Figure 7.
Relative expression levels of the P3A-ATPase genes at different development stages of brown cotton fiber. The relative expression level was calculated using the 2−△△Ct method, the error bars indicate SE.
3. Discussion
In recent years, many reports have described the structure and function P-ATPase genes [9,19,20], but a comprehensive study of their roles is still lacking in cotton. In this study, we identified and analyzed the P-ATPase gene family in G. arboretum, G. raimondii, G. barbadense and G. hirsutum at the genomic level. In all, 53, 51, 99 and 98 P-ATPase genes were identified in G. arboretum, G. raimondii, G. barbadense and G. hirsutum, respectively. The rich members and their high homology determined the diversity of expression and the specificity of function for the P-ATPase gene family. The homologous genes of various P-ATPases have been isolated from various plants. For example, AtECA1-4 can be expressed in all tissues of Arabidopsis. These genes play a role in the entire growth process of Arabidopsis, such as transporting calcium or manganese ions [21]. In upland cotton, there were similar expression of P2A genes, GhECA1, 2, 7, 8, 11, 12 were expressed in all tissues, they might play a similar function like AtECA1-4. In plants, some P-ATPase genes showed tissue-specific expression, suggesting they have specific function in a tissue. In Arabidopsis, the AHA3 is only expressed in phloem cells [22]; the expression pattern of AHA2, AHA9 and AHA10 had well defined the interaction/role in root hair, anther and developing seeds, respectively [23,24]; In rice, OsHMA3, OsHMA4 and OsHMA5 have high expression in root [25,26,27]; In Hevea brasiliensis, HbHA2 and HbHA4 showed high transcript abundance in latex [28]; in tomato, SlHA5, 6, 7, show tissue-specific pattern, its transcripts can only be detected in flowers [29]; In Arabidopsis, ALA10 is only expressed in guard cells and root epidermal cells [30]. These P-ATPase genes have been shown to play a role in specific tissues. The expression patterns of P-ATPase in upland cotton showed that some genes had obvious tissue-specific expression. For instance, GhAHA1, 2, 4–8 were expressed in stamen and GhAHA14, GhAHA15 had a specific expression in stem, suggesting these genes may play a role in stamen or stem, like P3A genes of Arabidopsis in different tissues. Some genes of other subfamilies also showed tissue-specific expression. In all, the tissue-specific expression indicates that the P-ATPase genes play multiple functions in upland cotton. Kutschera et al. (2004) [31] found that three P-ATPase genes form different subfamilies and could be expressed in the same type of cells at the same development stage. Interestingly, the similar expression patterns in upland cotton were found, GhAHA2 and GhALA10 were only expressed in stamens, GhAHA21 and GhHMA1 showed similar expression patterns in different tissues, suggesting these genes may have similar or synergistic effects in specific tissue. In addition, the expression of some P-ATPase genes in specific tissues was also influenced by different developmental stages. For example, tobacco pma1 is mainly expressed in the guard cells of seedling cotyledons and stems, whereas the pma1 gene in fruit is only expressed in the phloem, and pma6 is mainly expressed in the vegetative phase of trichomes [32]. In upland cotton, GhHMA12 and GhHMA13 showed a similar expression in developmental fiber, which had an expression level at 20 and 25 DPA, but little expression at 5 and 10 DPA (Figure 5). Upland cotton, as an important economic crop in the world, had complex gene regulation networks. Many P-ATPases have been shown to participate in regulating growth and physiological processes in different plants. The analysis of P-ATPases expression patterns in upland cotton showed that vast majority of P-ATPases had a certain function in cotton growth and development. Combining with the tissue-specific expression and functional analysis of P-ATPases in other plants, the potential functions of some P-ATPases in upland cotton could be inferred, such as regulating root and fiber development, and participating in some abiotic stresses response, etc.
Interestingly, in brown cotton fiber, the expression patterns of major P3A-ATPase genes by qRT-PCR were found to be inconsistent with the expression pattern of P3A-ATPase genes in upland cotton (Figure 5). The material used for fluorescence quantification experiments was brown cotton fiber, and white cotton was used for transcriptome analyses. We speculated that the differences in cotton varieties may lead to the changes in expression patterns of P3A genes, and the difference in the environment may also be the cause of the changes.
In Arabidopsis and rice, the P-ATPase gene family can be divided into six subfamilies: P1B, P2B, P2A, P3A, P4, and P5. [8]. Phylogenetic analysis showed that the P-ATPases genes of four cotton species could be also clustered into the same six subfamilies. There was only one or two P5 members in four cotton species, which were similar with Arabidopsis and rice. Gilbert (1987) believed that there is a relationship between intron structure and gene evolution [33]. There are two different hypotheses about the origin of introns. One posits that the gene encoding the protein is initially discontinuous, namely that introns were present at the beginning, before the gene encodes the protein; and the other speculation is that the gene encoding the protein is continuous, and thus, there is no intron while the gene encodes the protein [34]. Cao et al. (2016) showed that the original genes had few introns, and with the ongoing replication of genes, intron number gradually increased [35]. The study also indicated that some introns were already present, and others were generated or increased with the insertion of transposons during gene duplication. By comparing the exon and intron distributions of P-ATPase genes in diploid and tetraploid cotton genotypes, most P-ATPase genes on the same branch were found to have a nearly identical structure, which suggested that the evolution of cotton species was highly conserved. In addition, the P-ATPase genes on different branches or the same branches in diploid and tetraploid cotton species were found to have some structural diversity, indicating that the structural diversity of the P-ATPase genes ensured that some new functional genes appeared in the evolution of the P-ATPase gene family.
In a previous study, it was suggested that proanthocyanidin is synthesized in the cytoplasm, transported into vacuoles by transporters, and is then accumulated in vacuoles [36]. The P-ATPase genes play important roles during this process. First, H+-ATPase decomposes ATP and releases energy to generate and maintain an electrochemical gradient of H+ on both sides of the cell membrane and to provide energy to transporters for the transmembrane transport of PAs. Second, H+-ATPase is used to adjust cell pH [3,4]. A relatively stable pH can maintain cell activity and affect the activity of H+-ATPase [37]. pH can affect the accumulation of PAs in the vacuole, whether it is too high or too low. Appelhagen et al. (2015) showed that TT13 played an important role in the accumulation of PAs in the Arabidopsis seed coat [9]. When TT13 is mutated, PAs will not accumulate in the vacuoles of the seed coat. Some researchers found that vacuole pH increased, and the petal color changed from red to purple color when the expression of PH5 was reduced in petunia [19,20]. In the present study, it is speculated that P3A-ATPase, the homologous gene to PH5, may also play an important role in the PAs biosynthesis of brown cotton fiber. Xiao et al. (2007) analyzed the expression levels of five key genes (CHI, F3H, DFR, ANS and ANR) participating in PAs synthesis pathways at different developmental stages of brown cotton fiber and found that these genes have higher expression levels in the early stage of fiber development. After reaching the peak, the expression began to gradually decrease [38]. This result is consistent with the accumulation of PAs during the development of brown cotton fibers. We speculate that if there are one or more P3A genes involved in the proanthocyanidin synthesis pathway, they might have an expression trend similar to the accumulation of PAs. Fluorescence quantitative analysis showed that the trend of relative expression of GhAHA5, GhAHA7, GhAHA9, GhAHA10, and GhAHA11 in brown cotton fiber was similar to that for PAs accumulation (Figure 6 and Figure 7), especially the changes in expression levels of GhAHA10 and GhAHA11 were basically consistent with changes in the accumulation of PAs. Therefore, it was speculated that one or more of these genes may affect the accumulation of PAs in cotton fiber. Other P3A genes may also have certain functions in the development of fibers, such as GhAHA6 and GhAHA24, which had the highest expression at 18 DPA; they may play a role in the stage of fiber development.
4. Materials and Methods
4.1. Genomic Data Sources
The genome data for Arabidopsis were downloaded from The Arabidopsis Information Resource (http://www.arabidopsis.org/). The genome data for four cotton species were obtained from their genomes’ respective sequence websites: Gossypium raimondii from the Phytozome database (http://www.phytozome.net/); Gossypium arboreum and Gossypium hirsutum from the Cotton Genome Project (http://cgp.genomics.org.cn); and Gossypium barbadense from the Cotton Crop Databases (http://cotton.cropdb.org).
4.2. Sequence Identification of P-ATPase Genes
First, we used DNATOOLS software to establish four local databases with the whole genome amino acid sequences of G. arboretum, G. raimondii, G. barbadense and G. hirsutum. Then, we used the amino acid sequence of Arabidopsis P-ATPase gene (AHA10)-specific domains as a query sequence to preliminarily identify P-ATPase genes in four local databases using DNAtools software (E-value < 0.001) [39]. These candidate genes were examined to determine whether they contained the P-ATPase domains using the PFAM (http://pfam.wustl.edu/hmmsearch.shtml) [16] and SMART databases (http://smart.embl-heidelberg.de) [17].
4.3. Phylogenetic Analysis of P-ATPase Genes
These P-ATPase sequences were aligned using the ClustalW tool [40] of MEGA 5.0 software to remove repeat sequences, and the phylogenetic tree of Arabidopsis and four cotton species was constructed using the Neighbor-Joining method (Bootstrap = 1000) to analyze the evolutionary relationships of the P-ATPase gene family [41]. The naming and classification of P-ATPase genes in cotton refers to Arabidopsis P-ATPase genes [7].
4.4. Amino Acid Sequence Analysis of Cotton P-ATPase Genes
To analyze the basic properties and characteristics of cotton P-ATPase genes, the data for isoelectric point, protein molecular weight and amino acid length were obtained using the ExPAsy (http://www.expasy.org) online tools and the Cotton Functional Genomics Database (https://cottonfgd.org/) [42]. The basic structure of P-ATPase genes was analyzed using the GSDS online tool (http://gsds.cbi.pku.edu.cn) [18].
4.5. Chromosome Localization and Gene Duplication of Cotton P-ATPase Genes
The genome annotation information for G. arboretum, G. hirsutum and G. raimondii was downloaded from the Phytozome database (http://www.phytozome.net/) and the Cotton Genome Project (http://cgp.genomics.org.cn). The syntenic information was obtained using OrthoMCL (http://orthomcl.org/orthomcl/) [43]. The chromosome localizations and syntenic blocks were mapped using MapInspect (http://mapinspect.software.informer.com) and Circos software [44].
4.6. Expression Patterns of P-ATPase in G. hirsutum
The RNA-seq data derived from the TM-1 transcriptome of the Cotton Functional Genomics Database (https://cottonfgd.org/) (Zhang et al., 2015) were used to analyze P-ATPase gene expression profiles in G. hirsutum [15], which included the expression analyses of P-ATPase genes in various tissues and fibers at different development stages. If the value of log2FPKM was more than 1, we considered the gene expressed, and if the value was less than or equal to 1, we considered it not expressed [45]. R software was used to visualize the expression patterns with normalization method.
4.7. qRT-PCR of P3A-ATPase Genes in G. hirsutum
The PCR primers were designed according to the sequences of P3A-ATPase genes (Table S3). The RNA of brown cotton fibers at 6 days post-anthesis (DPA), 12 DPA, 18 DPA, 24 DPA and 30 DPA was extracted with an RNA extraction kit (TransGen Biotech, Beijing, China) and used to perform qRT-PCR. The total volume was 20 μL, including 10 μL of SYBR®Premix Ex Taq ™ II (2x), 2 μL of cDNA, and 0.8 μL of upstream and downstream primers. The reaction procedure was as follows: 50 °C for 2 min, 95 °C for 30 s, 40 cycles of 95 °C for 15s, 60 °C for 20 s and 68 °C for 20 s, and 4 °C for storage. The UBQ7 gene was used as an internal reference gene [46]. For each experiment, three biological replicates were executed, and the relative expression levels were calculated using the 2−△△Ct method [47].
4.8. Determination of PA Content
According to methods from Ikegami [48], the soluble and insoluble PAs of brown cotton fibers at different developmental stages (6 DPA, 12 DPA, 18 DPA, 24 DPA, and 30 DPA) were extracted, and the content of PAs was determined by spectrophotometry according to the standard curve of catechins, which were used as controls [49]. For each experiment, three biological replicates were executed.
5. Conclusions
In the study, a total of 301 P-ATPase genes were identified according to the whole genome sequences of G. arboretum, G. raimondii, G. barbadense and G. hirsutum using TBlastN, PFAM, and ClustalW tools, and the isoelectric point and molecular weight of 301 genes were predicted. The phylogenetic and structural analyses of P-ATPase genes in four cotton species showed that most genes located in the same branch of the evolutionary tree had a similar structure, and the numbers of exons and introns contained in the genes were also similar. The expression pattern analysis of P-ATPase genes in G. hirsutum indicated that most genes participated in the growth and development of cotton. In addition, the qRT-PCR analyses suggested that some members of the P3A subfamily in brown cotton might participate in the transport and accumulation of PAs. The function of P3A-ATPase genes in transporting the pigment of brown cotton fiber was initially explored, laying the foundation for selecting a functional P-ATPase gene and breeding a new brown cotton variety.
Supplementary Materials
The following are available online. Table S1: Characteristics of 301 P-ATPase genes in G. raimondii, G. hirsutum, G. arboreum and G. barbadense. “At” and “Dt” represent Group A and Group D chromosomes in G. hirsutum, respectively, and “sca” indicates that there is no chromosomal location information for the gene. Table S2: Gene numbers of 5 P-ATPase subfamilies in Arabidopsis, G. raimondii, G. hirsutum, G. arboreum and G. barbadense. Table S3: Homologous analyses of P-ATPase genes between different cotton species. Table S4: The RNA-seq data of P-ATPases expression patterns in upland cotton. Table S5: Primers used in qRT-PCR.
Author Contributions
J.-S.G., Y.L. and Y.-P.C. conceived the idea; G.Z. and G.-Y.S. analyzed the data; J.-S.G., W.C. and M.A. wrote the manuscript; N.G., D.-H.L. and X.S. assisted in sequence analysis.
Acknowledgments
This study was sponsored by State Key Laboratory of Cotton Biology Open Fund (No. CB2018A01). It was also supported by The National Natural Science Foundation of China (grant numbers 31640068 and 31672497). We extend our thanks to the reviewers and editors for their careful reading and helpful comments on this manuscript and give thanks for support by State Key Laboratory of Cotton Biology Open Fund and The National Natural Science Foundation of China.
Conflicts of Interest
The authors declare no conflict of interest.
References
- Sondergaard, T.E.; Schulz, A.; Palmgren, M.G. Energization of transport processes in plants. Roles of the plasma membrane H+-ATPase. Plant Physiol. 2004, 136, 2475–2482. [Google Scholar] [CrossRef] [PubMed]
- Falhof, J.; Pedersen, J.T.; Fuglsang, A.T.; Palmgren, M. Plasma membrane H+-ATPase regulation in the center of plant physiology. Mol. Plant 2016, 9, 323–337. [Google Scholar] [CrossRef] [PubMed]
- Portillo, F. Regulation of plasma membrane H+-ATPase in fungi and plants. Biochim. Biophys. Acta 2000, 1469, 31–42. [Google Scholar] [CrossRef]
- Serrano, R. Structure and function of plasma membrane ATPase. Annu. Rev. Plant Biol. 1989, 40, 61–94. [Google Scholar] [CrossRef]
- Palmgren, M.G.; Axelsen, K.B. Evolution of P-type ATPases. Biochim. Biophys. Acta 1998, 1365, 37–45. [Google Scholar] [CrossRef]
- Palmgren, M.G.; Nissen, P. P-type ATPases. Annu. Rev. Biophys. 2011, 40, 243–266. [Google Scholar] [CrossRef] [PubMed]
- Palmgren, M.G. Plant plasma membrane H+-ATPase: Powerhouses for nutrient uptake. Annu. Rev. Plant Biol. 2001, 52, 817–845. [Google Scholar] [CrossRef] [PubMed]
- Baxter, I.; Tchieu, J.; Sussman, M.R.; Boutry, M.; Palmgren, M.G.; Gribskov, M.; Harper, J.F.; Axelsen, K.B. Genomic comparison of P-type ATPases ion pumps in Arabidopsis and rice. Plant Physiol. 2003, 132, 618–628. [Google Scholar] [CrossRef] [PubMed]
- Appelhagen, I.; Nordholt, N.; Seidel, T.; Spelt, K.; Koes, R.; Quattrochio, F.; Sagasser, M.; Weisshaar, B. Transparent testa 13 is a tonoplast P3A-ATPase required for vacuolar deposition of proanthocyanidins in Arabidopsis thaliana seeds. Plant J. 2015, 82, 840–849. [Google Scholar] [CrossRef] [PubMed]
- Li, Y.; Provenzano, S.; Bliek, M.; Spelt, C.; Appelhagen, I.; De Faria, L.M.; Verweij, W.; Schubert, A.; Sagasser, M.; Seidel, T. Evolution of tonoplast P-ATPase transporters involved in vacuolar acidification. New Phytol. 2016, 211, 1092–1107. [Google Scholar] [CrossRef] [PubMed]
- Li, T.; Fan, H.; Li, Z.; Wei, J.; Lin, Y.; Cai, Y. The accumulation of pigment in fiber related to proanthocyanidins synthesis for brown cotton. Acta Physiologiae Plantarum 2012, 34, 813–818. [Google Scholar] [CrossRef]
- Li, F.; Fan, G.; Wang, K.; Sun, F.; Yuan, Y.; Song, G.; Li, Q.; Ma, Z.; Lu, C.; Zou, C. Genome sequence of the cultivated cotton gossypium arboreum. Nat. Genet. 2014, 46, 567–572. [Google Scholar] [CrossRef] [PubMed]
- Wang, K.; Wang, Z.; Li, F.; Ye, W.; Wang, J.; Song, G.; Yue, Z.; Cong, L.; Shang, H.; Zhu, S. The draft genome of a diploid cotton gossypium raimondii. Nat. Genet. 2012, 44, 1098–1103. [Google Scholar] [CrossRef] [PubMed]
- Yuan, D.; Tang, Z.; Wang, M.; Gao, W.; Tu, L.; Xin, J.; Chen, L.; He, Y.; Lin, Z.; Zhu, L. The genome sequence of sea-island cotton (gossypium barbadense) provides insights into the allopolyploidization and development of superior spinnable fibres. Sci. Rep. 2015, 5, 17662. [Google Scholar] [CrossRef] [PubMed]
- Zhang, T.; Hu, Y.; Jiang, W.; Fang, L.; Guan, X.; Chen, J.; Zhang, J.; Saski, C.A.; Scheffler, B.E.; Stelly, D.M. Sequencing of allotetraploid cotton (gossypium hirsutum l. Acc. Tm-1) provides a resource for fiber improvement. Nat. Biotechnol. 2015, 33, 531–537. [Google Scholar] [CrossRef] [PubMed]
- Finn, R.D.; Mistry, J.; Schusterbockler, B.; Griffithsjones, S.; Hollich, V.; Lassmann, T.; Moxon, S.; Marshall, M.; Khanna, A.; Durbin, R. Pfam: Clans, web tools and services. Nucl. Acids Res. 2006, 34, 247–251. [Google Scholar] [CrossRef] [PubMed]
- Letunic, I.; Doerks, T.; Bork, P. Smart 7: Recent updates to the protein domain annotation resource. Nucl. Acids Res. 2012, 40, 302–305. [Google Scholar] [CrossRef] [PubMed]
- Hu, B.; Jin, J.; Guo, A.; Zhang, H.; Luo, J.; Gao, G. Gsds 2.0: An upgraded gene feature visualization server. Bioinformatics 2015, 31, 1296–1297. [Google Scholar] [CrossRef] [PubMed]
- Faraco, M.; Spelt, C.; Bliek, M.; Verweij, W.; Hoshino, A.; Espen, L.; Prinsi, B.; Jaarsma, R.; Tarhan, E.; De Boer, A.H. Hyperacidification of vacuoles by the combined action of two different P-ATPases in the tonoplast determines flower color. Cell Rep. 2014, 6, 32–43. [Google Scholar] [CrossRef] [PubMed]
- Verweij, W.; Spelt, C.; Sansebastiano, G.D.; Vermeer, J.E.M.; Reale, L.; Ferranti, F.; Koes, R.; Quattrocchio, F. An H+ P-ATPase on the tonoplast determines vacuolar ph and flower colour. Nat. Cell Biol. 2008, 10, 1456–1462. [Google Scholar] [CrossRef] [PubMed]
- Mills, R.F.; Doherty, M.L.; López-Marqués, R.L.; Weimar, T.; Dupree, P.; Palmgren, M.G.; Pittman, J.K.; Williams, L.E. Eca3, a golgi-localized P2A-type ATPase, plays a crucial role in manganese nutrition in Arabidopsis. Plant Physiol. 2008, 146, 116–128. [Google Scholar] [CrossRef] [PubMed]
- Oparka, K.J.; Turgeon, R. Sieve elements and companion cells-traffic control centers of the phloem. The Plant Cell 1999, 11, 739–750. [Google Scholar] [CrossRef] [PubMed]
- Sussman, M.R. Molecular analysis of proteins in the plant plasma membrane. Annu. Rev. Plant Biol. 1994, 45, 211–234. [Google Scholar] [CrossRef]
- Houlne, G.; Boutry, M. Identification of an Arabidopsis thaliana gene encoding a plasma membrane H+-APTase whose expression is restricted to anther tissue. Plant J. 1994, 5, 311–317. [Google Scholar] [CrossRef] [PubMed]
- Deng, F.; Yamaji, N.; Xia, J.; Ma, J.F. A member of the heavy metal P-type ATPase oshma5 is involved in xylem loading of copper in rice. Plant Physiol. 2013, 163, 1353–1362. [Google Scholar] [CrossRef] [PubMed]
- Huang, X.; Deng, F.; Yamaji, N.; Pinson, S.R.M.; Fujiikashino, M.; Danku, J.; Douglas, A.E.; Guerinot, M.L.; Salt, D.E.; Ma, J.F. A heavy metal P-type ATPase oshma4 prevents copper accumulation in rice grain. Nat. Commun. 2016, 7, 12138. [Google Scholar] [CrossRef] [PubMed]
- Miyadate, H.; Adachi, S.; Hiraizumi, A.; Tezuka, K.; Nakazawa, N.; Kawamoto, T.; Katou, K.; Kodama, I.; Sakurai, K.; Takahashi, H. Oshma3, a P1B-type of ATPase affects root-to-shoot cadmium translocation in rice by mediating efflux into vacuoles. New Phytol. 2011, 189, 190–199. [Google Scholar] [CrossRef] [PubMed]
- Zhu, J.; Jing, X.; Chang, W.; Zhang, Z. Isolation and expression analysis of four members of the plasma membrane H+-ATPase gene family in hevea brasiliensis. Trees 2015, 29, 1355–1363. [Google Scholar] [CrossRef]
- Liu, J.; Liu, J.; Chen, A.; Ji, M.; Chen, J.; Yang, X.; Gu, M.; Qu, H.; Xu, G. Analysis of tomato plasma membrane H+-ATPase gene family suggests a mycorrhiza-mediated regulatory mechanism conserved in diverse plant species. Mycorrhiza 2016, 26, 1–12. [Google Scholar] [CrossRef] [PubMed]
- Poulsen, L.R.; Lópezmarqués, R.L.; Pedas, P.R.; Mcdowell, S.C.; Brown, E.; Kunze, R.; Harper, J.F.; Pomorski, T.G.; Palmgren, M. A phospholipid uptake system in the model plant Arabidopsis thaliana. Nat. Commun. 2015, 6, 7649. [Google Scholar] [CrossRef] [PubMed]
- Kutschera, U. Stem elongation and cell wall proteins in flowering plants. Plant Biol. 2001, 3, 466–480. [Google Scholar] [CrossRef]
- Oufattole, M.; Arango, M.; Boutry, M. Identification and expression of three new nicotiana plumbaginifolia genes which encode isoforms of a plasma-membrane H+-ATPase, and one of which is induced by mechanical stress. Planta 2000, 210, 715–722. [Google Scholar] [CrossRef] [PubMed]
- Gilbert, W. The exon theory of genes. Cold Spring Harb. Symp. Quant. Biol. 1987, 52, 901–905. [Google Scholar] [CrossRef] [PubMed]
- Plomin, R.; Spinath, F.M. Intelligence: Genetics, genes, and genomics. J. Personal. Soc. Psychol. 2004, 86, 112–129. [Google Scholar] [CrossRef] [PubMed]
- Cao, Y.; Han, Y.; Meng, D.; Li, D.; Jin, Q.; Lin, Y.; Cai, Y. Structural, evolutionary, and functional analysis of the class iii peroxidase gene family in chinese pear (pyrus bretschneideri). Front. Plant Sci. 2016, 7, 1874. [Google Scholar] [CrossRef] [PubMed]
- Baxter, I.; Young, J.C.; Armstrong, G.; Foster, N.; Bogenschutz, N.; Cordova, T.; Peer, W.A.; Hazen, S.P.; Murphy, A.S.; Harper, J.F. A plasma membrane H+-ATPase is required for the formation of proanthocyanidins in the seed coat endothelium of Arabidopsis thaliana. PNAS 2005, 102, 2649–2654. [Google Scholar] [CrossRef] [PubMed]
- Reuveni, M.; Evenor, D.; Artzi, B.; Perl, A.V.I.; Erner, Y. Decrease in vacuolar ph during petunia flower opening is reflected in the activity of tonoplast H+-ATPase. J. Plant Physiol. 2001, 158, 991–998. [Google Scholar] [CrossRef]
- Xiao, Y.H.; Zhang, Z.S.; Yin, M.H.; Luo, M.; Li, X.B.; Hou, L.; Pei, Y. Cotton flavonoid structural genes related to the pigmentation in brown fibers. Biochem. Biophys. Res. Commun. 2007, 358, 73–78. [Google Scholar] [CrossRef] [PubMed]
- Paterson, A.H.; Wendel, J.F.; Gundlach, H.; Guo, H.; Jenkins, J.; Jin, D.; Llewellyn, D.J.; Showmaker, K.C.; Shu, S.; Udall, J.A. Repeated polyploidization of gossypium genomes and the evolution of spinnable cotton fibres. Nature 2012, 492, 423–427. [Google Scholar] [CrossRef] [PubMed]
- Larkin, M.A.; Blackshields, G.; Brown, N.P.; Chenna, R.; Mcgettigan, P.A.; Mcwilliam, H.; Valentin, F.; Wallace, I.M.; Wilm, A.; Lopez, R. Clustal w and clustal x version 2.0. Bioinformatics 2007, 23, 2947–2948. [Google Scholar] [CrossRef] [PubMed]
- Tamura, K.; Peterson, D.; Peterson, N.; Stecher, G.; Nei, M.; Kumar, S. Mega5: Molecular evolutionary genetics analysis using maximum likelihood, evolutionary distance, and maximum parsimony methods. Mol. Biol. Evol. 2011, 28, 2731–2739. [Google Scholar] [CrossRef] [PubMed]
- Wang, Y.; Feng, L.; Zhu, Y.; Li, Y.; Yan, H.; Xiang, Y. Comparative genomic analysis of the wrky iii gene family in populus, grape, Arabidopsis and rice. Biol. Direct 2015, 10, 48. [Google Scholar] [CrossRef] [PubMed]
- Wang, Q.; Liu, J.; Wang, Y.; Zhao, Y.; Jiang, H.; Cheng, B. Systematic analysis of the maize phd-finger gene family reveals a subfamily involved in abiotic stress response. Gene 2015, 566, 95–108. [Google Scholar] [CrossRef] [PubMed]
- Xu, X.; Feng, Y.; Fang, S.; Xu, J.; Wang, X.; Guo, W. Genome-wide characterization of the β-1,3-glucanase gene family in gossypium by comparative analysis. Sci. Rep. 2016, 6, 29044. [Google Scholar] [CrossRef] [PubMed]
- Li, P.; Guo, W. Genome-wide characterization of the rab gene family in gossypium by comparative analysis. Bot. Stud. 2017, 58, 26. [Google Scholar] [CrossRef] [PubMed][Green Version]
- Wang, M.; Wang, Q.; Zhang, B. Evaluation and selection of reliable reference genes for gene expression under abiotic stress in cotton (gossypium hirsutum l.). Gene 2013, 530, 44–50. [Google Scholar] [CrossRef] [PubMed]
- Livak, K.J.; Schmittgen, T.D. Analysis of relative gene expression data using real-time quantitative PCR and the 2−ΔΔCT method. Methods 2001, 25, 402–408. [Google Scholar] [CrossRef] [PubMed]
- Ikegami, A.; Akagi, T.; Potter, D.; Yamada, M.; Sato, A.; Yonemori, K.; Kitajima, A.; Inoue, K. Molecular identification of 1-Cys peroxiredoxin and anthocyanidin/flavonol 3-O-galactosyltransferase from proanthocyanidin-rich young fruits of persimmon (diospyros kaki thunb.). Planta 2009, 230, 841–855. [Google Scholar] [CrossRef] [PubMed]
- Li, Y.; Tanner, G.; Larkin, P.J. The DMACA-HCL protocol and the threshold proanthocyanidin content for bloat safety in forage legumes. J. Sci. Food Agric. 1996, 70, 89–101. [Google Scholar] [CrossRef]
Sample Availability: Not available. |
© 2018 by the authors. Licensee MDPI, Basel, Switzerland. This article is an open access article distributed under the terms and conditions of the Creative Commons Attribution (CC BY) license (http://creativecommons.org/licenses/by/4.0/).