Article

1H-NMR Profiling and Chemometric Analysis of Selected Honeys from South Africa, Zambia, and Slovakia

1
Faculty of Pharmacy, Pharmaceutical Chemistry Division, Rhodes University, Grahamstown 6140, South Africa
2
Makana Meadery, Reynolds St, Grahamstown 6139, South Africa
*
Author to whom correspondence should be addressed.
Molecules 2018, 23(3), 578; https://doi.org/10.3390/molecules23030578
Submission received: 4 December 2017 / Revised: 18 January 2018 / Accepted: 23 January 2018 / Published: 5 March 2018

Abstract

:
Honey is the natural sweet substance produced by honeybee from nectar or honeydew, exhibiting several nutritional and health benefits. It contains a complex mixture of compounds in different proportions, with sugars being the main component. The physicochemical characteristics of ten honeys were evaluated; represented by five, three, and two from South Africa, Slovakia, and Zambia, respectively. The range of values for the pH (3.75–4.38), electrical conductivity (99–659 µS/cm), and moisture content (14.2–17.7%) are within the recommended limits for quality honeys. 1H-NMR (Nuclear Magnetic Resonance) profiling of the honeys in D2O was determined, and the data were analysed by chemometrics. This method is fast, reproducible, and sample pre-treatment is not necessary. The 1H-NMR fingerprints of various chemical shift regions showed similarity or dissimilarity across geographical origins that are useful for identification, detection of adulteration, and quality control. The principal component analysis PCA and partial linear square discriminant analysis PLS-DA of the 1H-NMR profiles successively categorises the honeys into two chemically related groups. The R2 values are higher than the corresponding Q2 values for all samples, confirming the reliability of the model. Honeys in the same cluster contain similar metabolites and belong to the same botanic or floral origin.

1. Introduction

Honey is the natural sweet substance produced by honeybees (genera: Apis and Meliponini) after nectar or honeydew collection, transformation by combining with certain substances in the bee, and maturation; it is then deposited inside the beehive [1]. It is a complex mixture of more than seventy different compounds that are present in varying proportions, majorly natural sugars (fructose, glucose, maltose, and sucrose) [2]. The transformation process in honeybees involves regurgitation, evaporation, and enzymatic transformation of saccharides collected from nectar into honey [3].
Generally, the quality of honey and the chemical composition are linked to many factors, such as geographical, botanical or floral origin, climatic and seasonal, and botanical [4]. Other factors could be external, such as environmental factors, honey treatment methods by beekeepers, correct labeling of honey, storage conditions, and deliberate adulteration by producers [5]. For quality assurance purposes, these factors are important to honey producers, consumers, the food industry, and regulatory authorities. Africa is a diverse climatic region, which includes mangrove forests, tropical rain forests, savanna, and arid regions, with the honeys from these varied geographical and botanical origins presenting different chemical compositions that can be explored to categorise them into groups [4]. In general, honey metabolites include carbohydrates, protein, enzymes, minerals, amino acids and organic acids (e.g., formic, acetic), polyphenols, and carotenoids [6].The assessment of the origin of honey is important as part of the quality control requirements in line with the European Union (EU) regulation that the geographical and botanical origins of honey products must be printed on the label [4,7].
Several studies have been reported on the assessment of the physicochemical properties of honey in order to determine the quality, geographical, and botanical origins, and unravel possible adulteration associated with breeding, and the processing of natural and commercial products [8,9]. Natural honey is colourless to dark brown fluid; it can be viscous, partly, or entirely crystalline with varied organoleptic characteristics (e.g., taste, aroma) depending on age, length of storage, and botanical or floral origin [10]. Colour is a useful criterion for classifying unifloral honeys, and it often correlates with the flavour. Light-coloured honeys are mild-flavoured, while the dark ones have stronger flavour, and light-coloured honeys usually have higher prices than the dark ones [11]. The colour of honey can be determined using Pfund scale by measuring the level of absorption (in millimeters) of light using visible spectrophotometer at various wavelengths (i.e., 560 nm, Table 1) [12]. To the best knowledge of the authors, there is no previous report on the 1H-NMR profiling and chemometrics of South African and Zambian honeys. Also, little information is available on the spectroscopical assessment of Slovakian honeys that are being used in this study for comparison with African honeys.
Honey has many nutritional and health benefits [13,14,15,16,17,18,19,20,21], and it contains several useful nutritional substances, including monosaccharides and disaccharides (glucose and fructose, maltose, sucrose), group B vitamins and enzymes [3]. The rising commercial demand for honey worldwide has led to increase in the price of honey products, resulting in fraudulent adulteration of natural honey [22]. For instance, at least three times the quantity of Manuka honey that is produced in New Zealand is sold worldwide [22]. Therefore, beekeeping and commercial production of honey require more stringent quality control measures in order to deliver high-quality, safe products to the consumers.
Methods of honey adulteration include over feeding of bees with sucrose; addition of fructose or glucose, which may alter the fructose/glucose ratio (normal ratio in quality honey: 1–1.2); and feeding bees or addition of corn, invert sugar, and high fructose corn syrup (HFCS) with a resultant variation in the carbohydrate composition [23]. In recent times, adulterated honey has been on the increase, particularly with sugars such as glucose (30%), fructose (40%), maltose (8%), and sucrose (2%) [24]. The most frequent method of honey adulteration involves adding sucrose of greater than 1% of the dried mass, as well as rice syrup, because of its similar appearance and taste to natural honey [23,25]. Also, some honey adulterants are difficult to detect, such as brown rice syrup, BRS [26]. Hence, both the manufacturing process and the chemical composition of honey products are regulated in Europe by the EU Council directives [27]. Similarly, the Slovak Beekeepers Association (SZV) and Slovak Federation of Beekeepers (SVS) recommend and enforce stringent quality requirements for both locally produced and imported honeys [25]. SZV and SVS recommend that the hydroxymethylfurfural (HMF) content ≤ 15 mg/kg, water content ≤ 18%; they also specify the writing of a well-defined geographic origin on the label [28]. A high level of hydroxymethylfurfural (HMF) as a result of sugar metabolism in honey is an indication of heat damage and long storage time [29]. The objectives of the quality requirements in Slovakia were to increase national consumption of high-quality local honeys, reduce export of high-quality Slovak honey, lower importation of low-quality foreign honeys, and decrease both national purchase and consumption of low-quality honeys [28]. Several methods have been reported for the analysis of honey, aimed at assessing the quality and detection of adulteration. The conventional analytical techniques for quality assessment of honey from both unifloral and multifloral origins involve melissopalynological analysis in combination with chemometrics and the evaluation of organoleptic characteristics. These methods are time-consuming and operator dependent, and some category of adulterations (e.g., the addition of sugar concentrate to honey) are difficult to detect [30]. Other methods with specific advantages and limitations include mass spectrometry, high performance liquid chromatography (HPLC), and gas chromatography coupled with mass spectrometry (GC-MS) [31].
Nuclear magnetic resonance (NMR) spectroscopy in combination with chemometrics is useful in food industry for biomarker discovery and origin discrimination [32]. Application of NMR spectroscopy for the analysis of honey offers some advantages, including availability of a variety of information in a single measurement, which is relatively faster than most analytical methods in terms of run and processing time, reproducible and comparable data with high statistical confidence level, sample pre-treatment is not necessary, retrospective identification, and quantification of samples [33]. NMR spectroscopy is a useful approach for solving problems associated with the determination of the botanical and geographical origin of honey using pollen analysis, particularly when plants with similar pollen morphology are in abundance in the same area [33]. Also, 1H-NMR profiling can identify and quantify markers of different botanical origin; thus, it can be used to complement pollen analysis. Although other methods can differentiate chemical markers in honeys, they are usually cumbersome and require a combination of different methods [34,35]. When NMR spectroscopy is combined with chemometrics, overheating and the long storage condition of honey can be detected by monitoring specific markers, such as hydroxymethyl furfural (HMF) [26]. Also, 1H-NMR profiling can solve the problem associated with false positive results observed during quality control testing of some markers in honey that is adulterated with sugar when the Association of Official Agricultural Chemists, AOAC 998.12 C4 sugar detection test is used [36].
The current study is aimed at investigating the qualitative application of 1H-NMR fingerprints to honeys obtained from South Africa, Slovakia, and Zambia, to evaluate the clustering of the honeys using multivariate statistical tools. Thus, 1H-NMR profiling will assist in classifying the samples according to their botanical or geographical origins. A long term goal is to create a database of 1H-NMR fingerprints for honeys from Africa for the purpose of authenticating honey products, detecting adulteration, and for quality control.

2. Results and Discussion

2.1. Physicochemical Properties

2.1.1. pH

The results of the pH (Table 2) showed values in the range of 3.75 ± 0.015 to 4.38 ± 0.025, which are within the recommended limit for a quality honey [1]. In general, the pH of quality honey ranges between 3.5 and 5.5 depending on the botanical origin, concentration of acids in the honey, pH of nectar and soil, ash content, and concentrations of minerals in the honey [37]. Apart from HD and HG with pH values of 4.01 ± 0.015 and 4.07 ± 0.01, respectively, other South African and Zambian honeys have higher pH values compared to those from Slovakia. High pH value increases the tendency for the formation of hydroxymethylfurfural, particularly during long storage time and when exposed to high temperature [38]. Although pH value does not directly relate to free acidity in honeys because of the presence of buffers and minerals, it is a parameter that contributes to the quality of honey and as a tool for evaluating the total acidity. When the pH value of honey is altered, it may indicate fermentation or adulteration [37].

2.1.2. Electrical Conductivity (EC)

The honeys have electrical conductivity values in the range of 99 ± 5.03 to 659 ± 10.7 (µS/cm) that are below the recommended 800 µS/cm upper limit [1] (Table 2). There is a direct correlation between the acid content and EC of honeys. Additionally, EC has been a good criterion for botanical classification of botanical origin, and it is determined routinely [39]. The two Zambia honeys have high and similar EC values of 646 ± 5.0 and 659 ± 10.7 µS/cm for HI and HJ, respectively. These indicate that the two honeys are possibly obtained from the same botanical or floral origin.

2.1.3. Moisture Content

The quality of honey is related to the moisture content. All the honeys (HA-HJ) have moisture contents less than the recommended upper limit of 20% [1,40] (Table 2). The lower the moisture content of a honey, the higher the shelf life and quality, since the degree of spoilage via fermentation by yeasts increases with the moisture content. HA (17.4 ± 1.95) from Slovakia, and HC (17.7 ± 0.330) and HE (17.4 ± 0.220) from South Africa have the highest moisture contents and may be more prone to fermentation and granulation than the other honeys during storage [41]. Generally, high moisture content becomes a great challenge for preserving the quality of honey when the storage temperature and relative humidity are high [42].

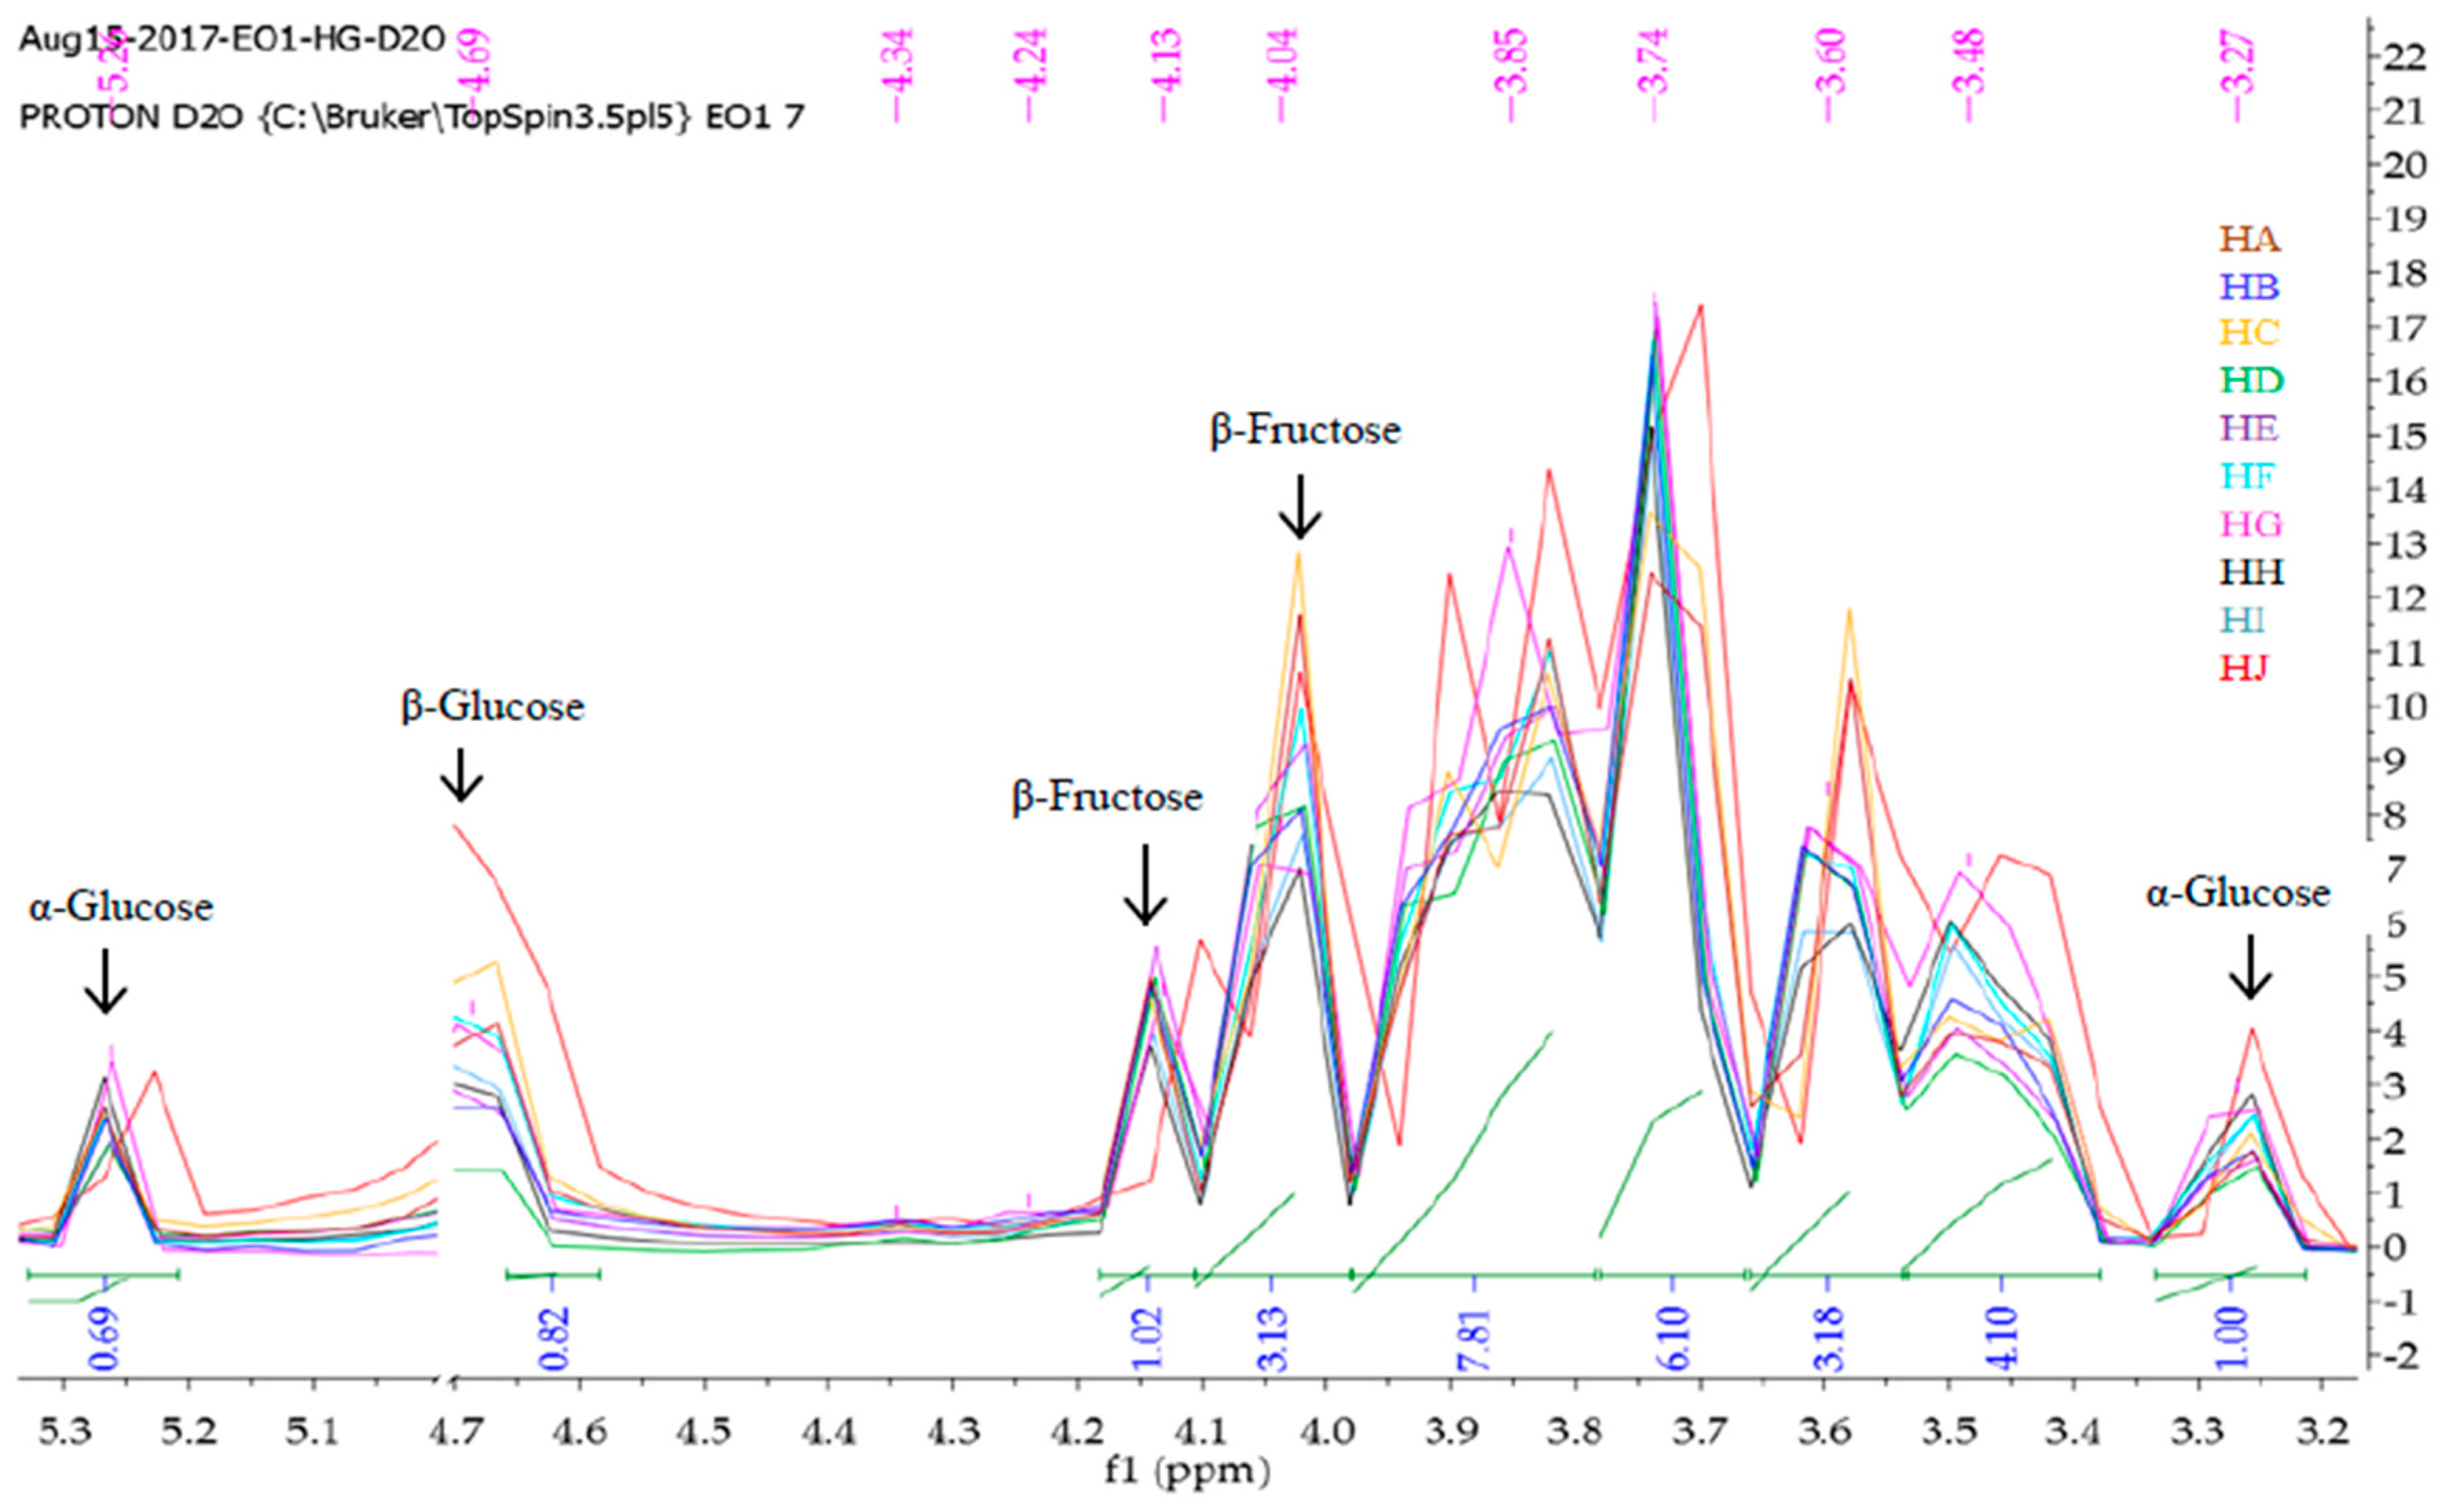
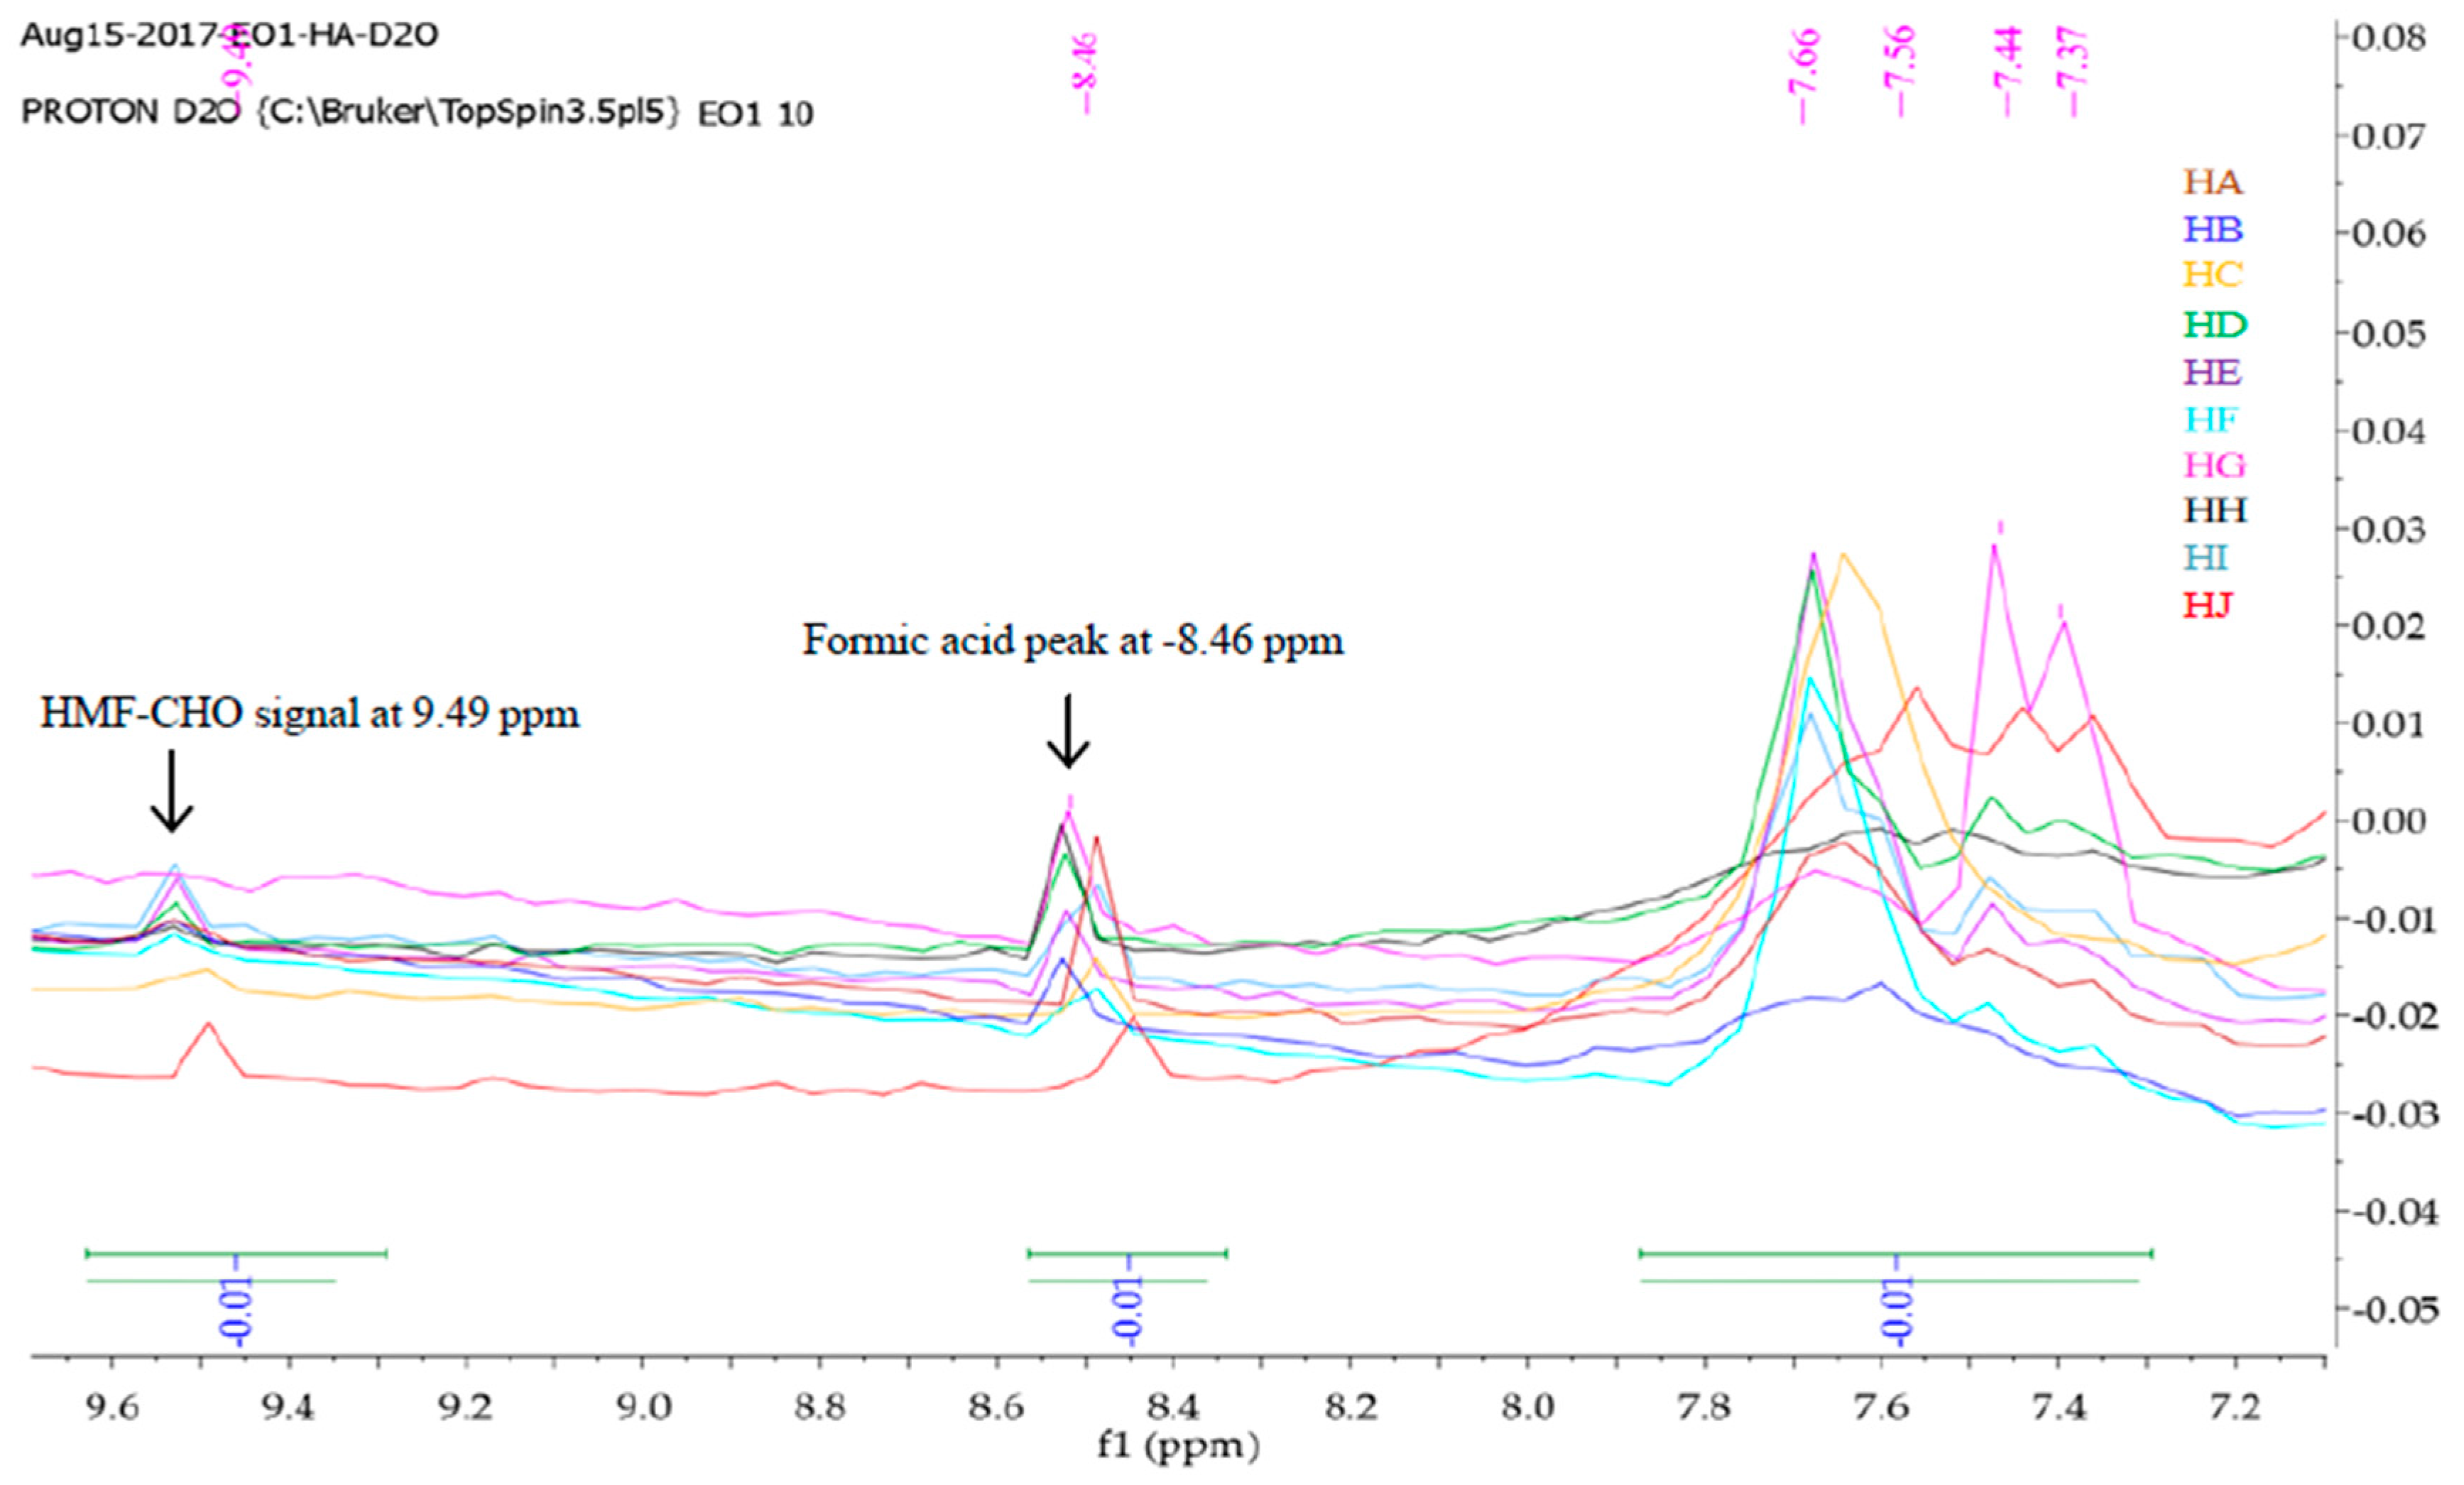
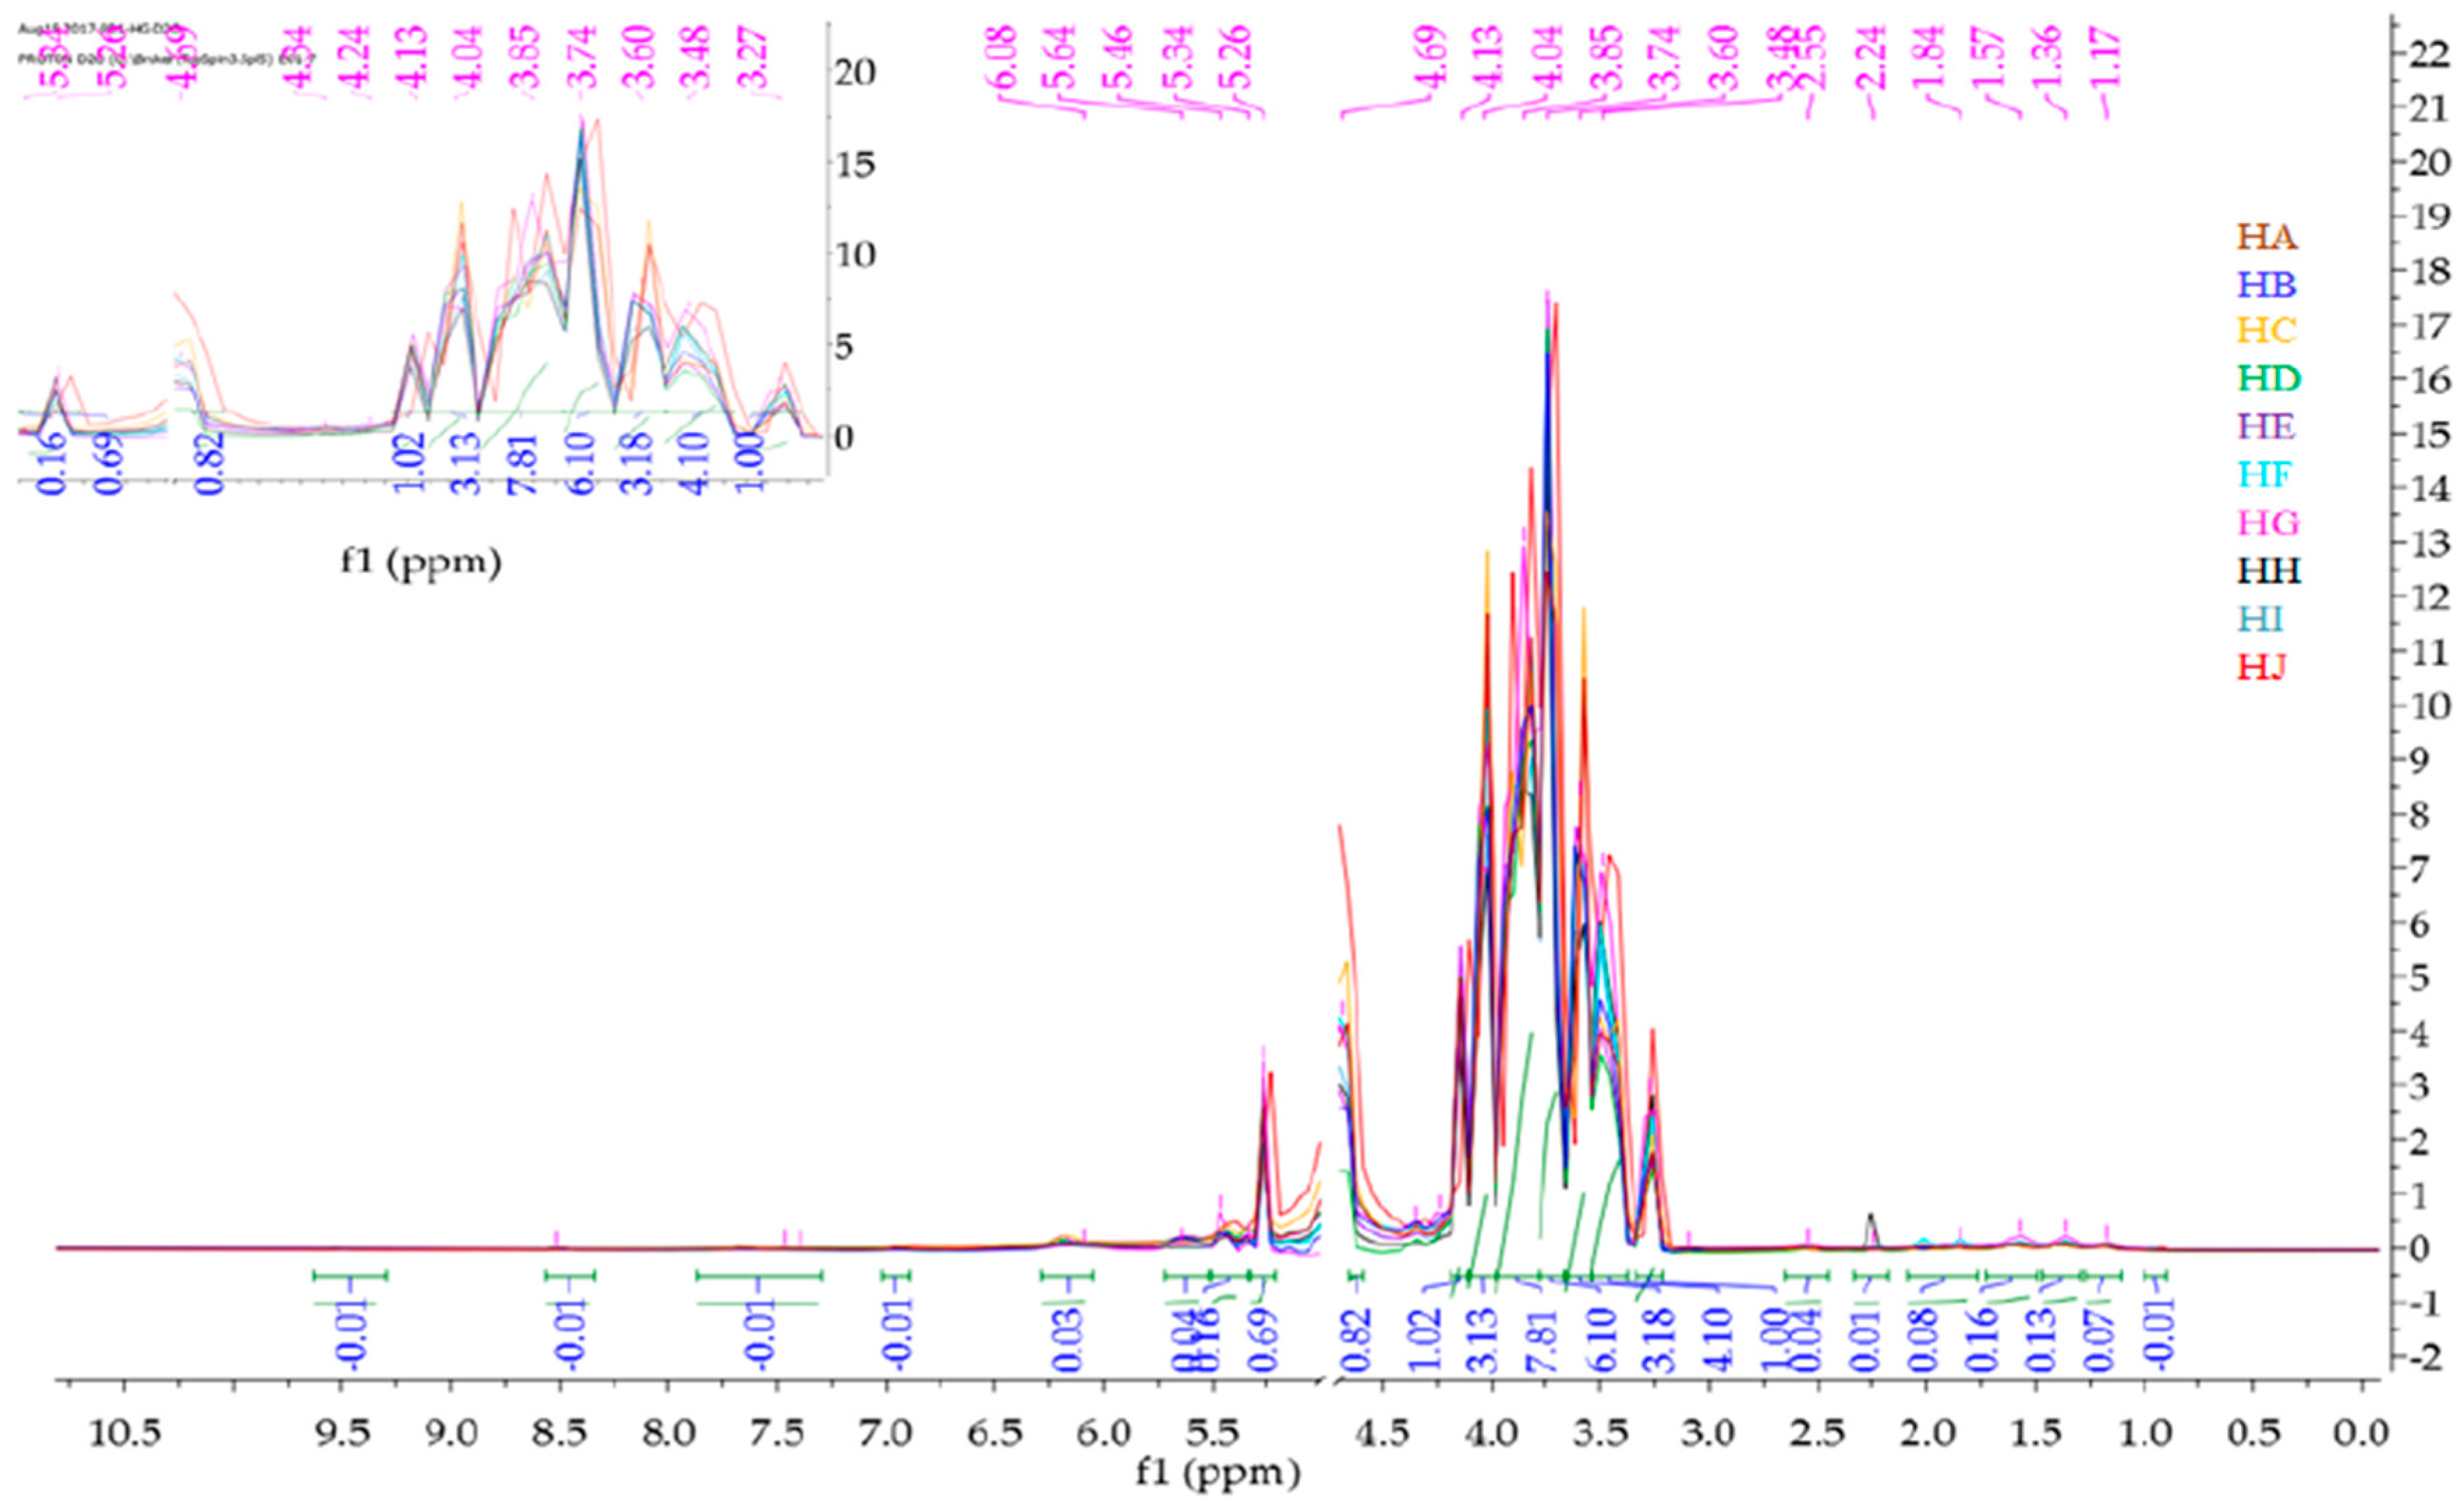
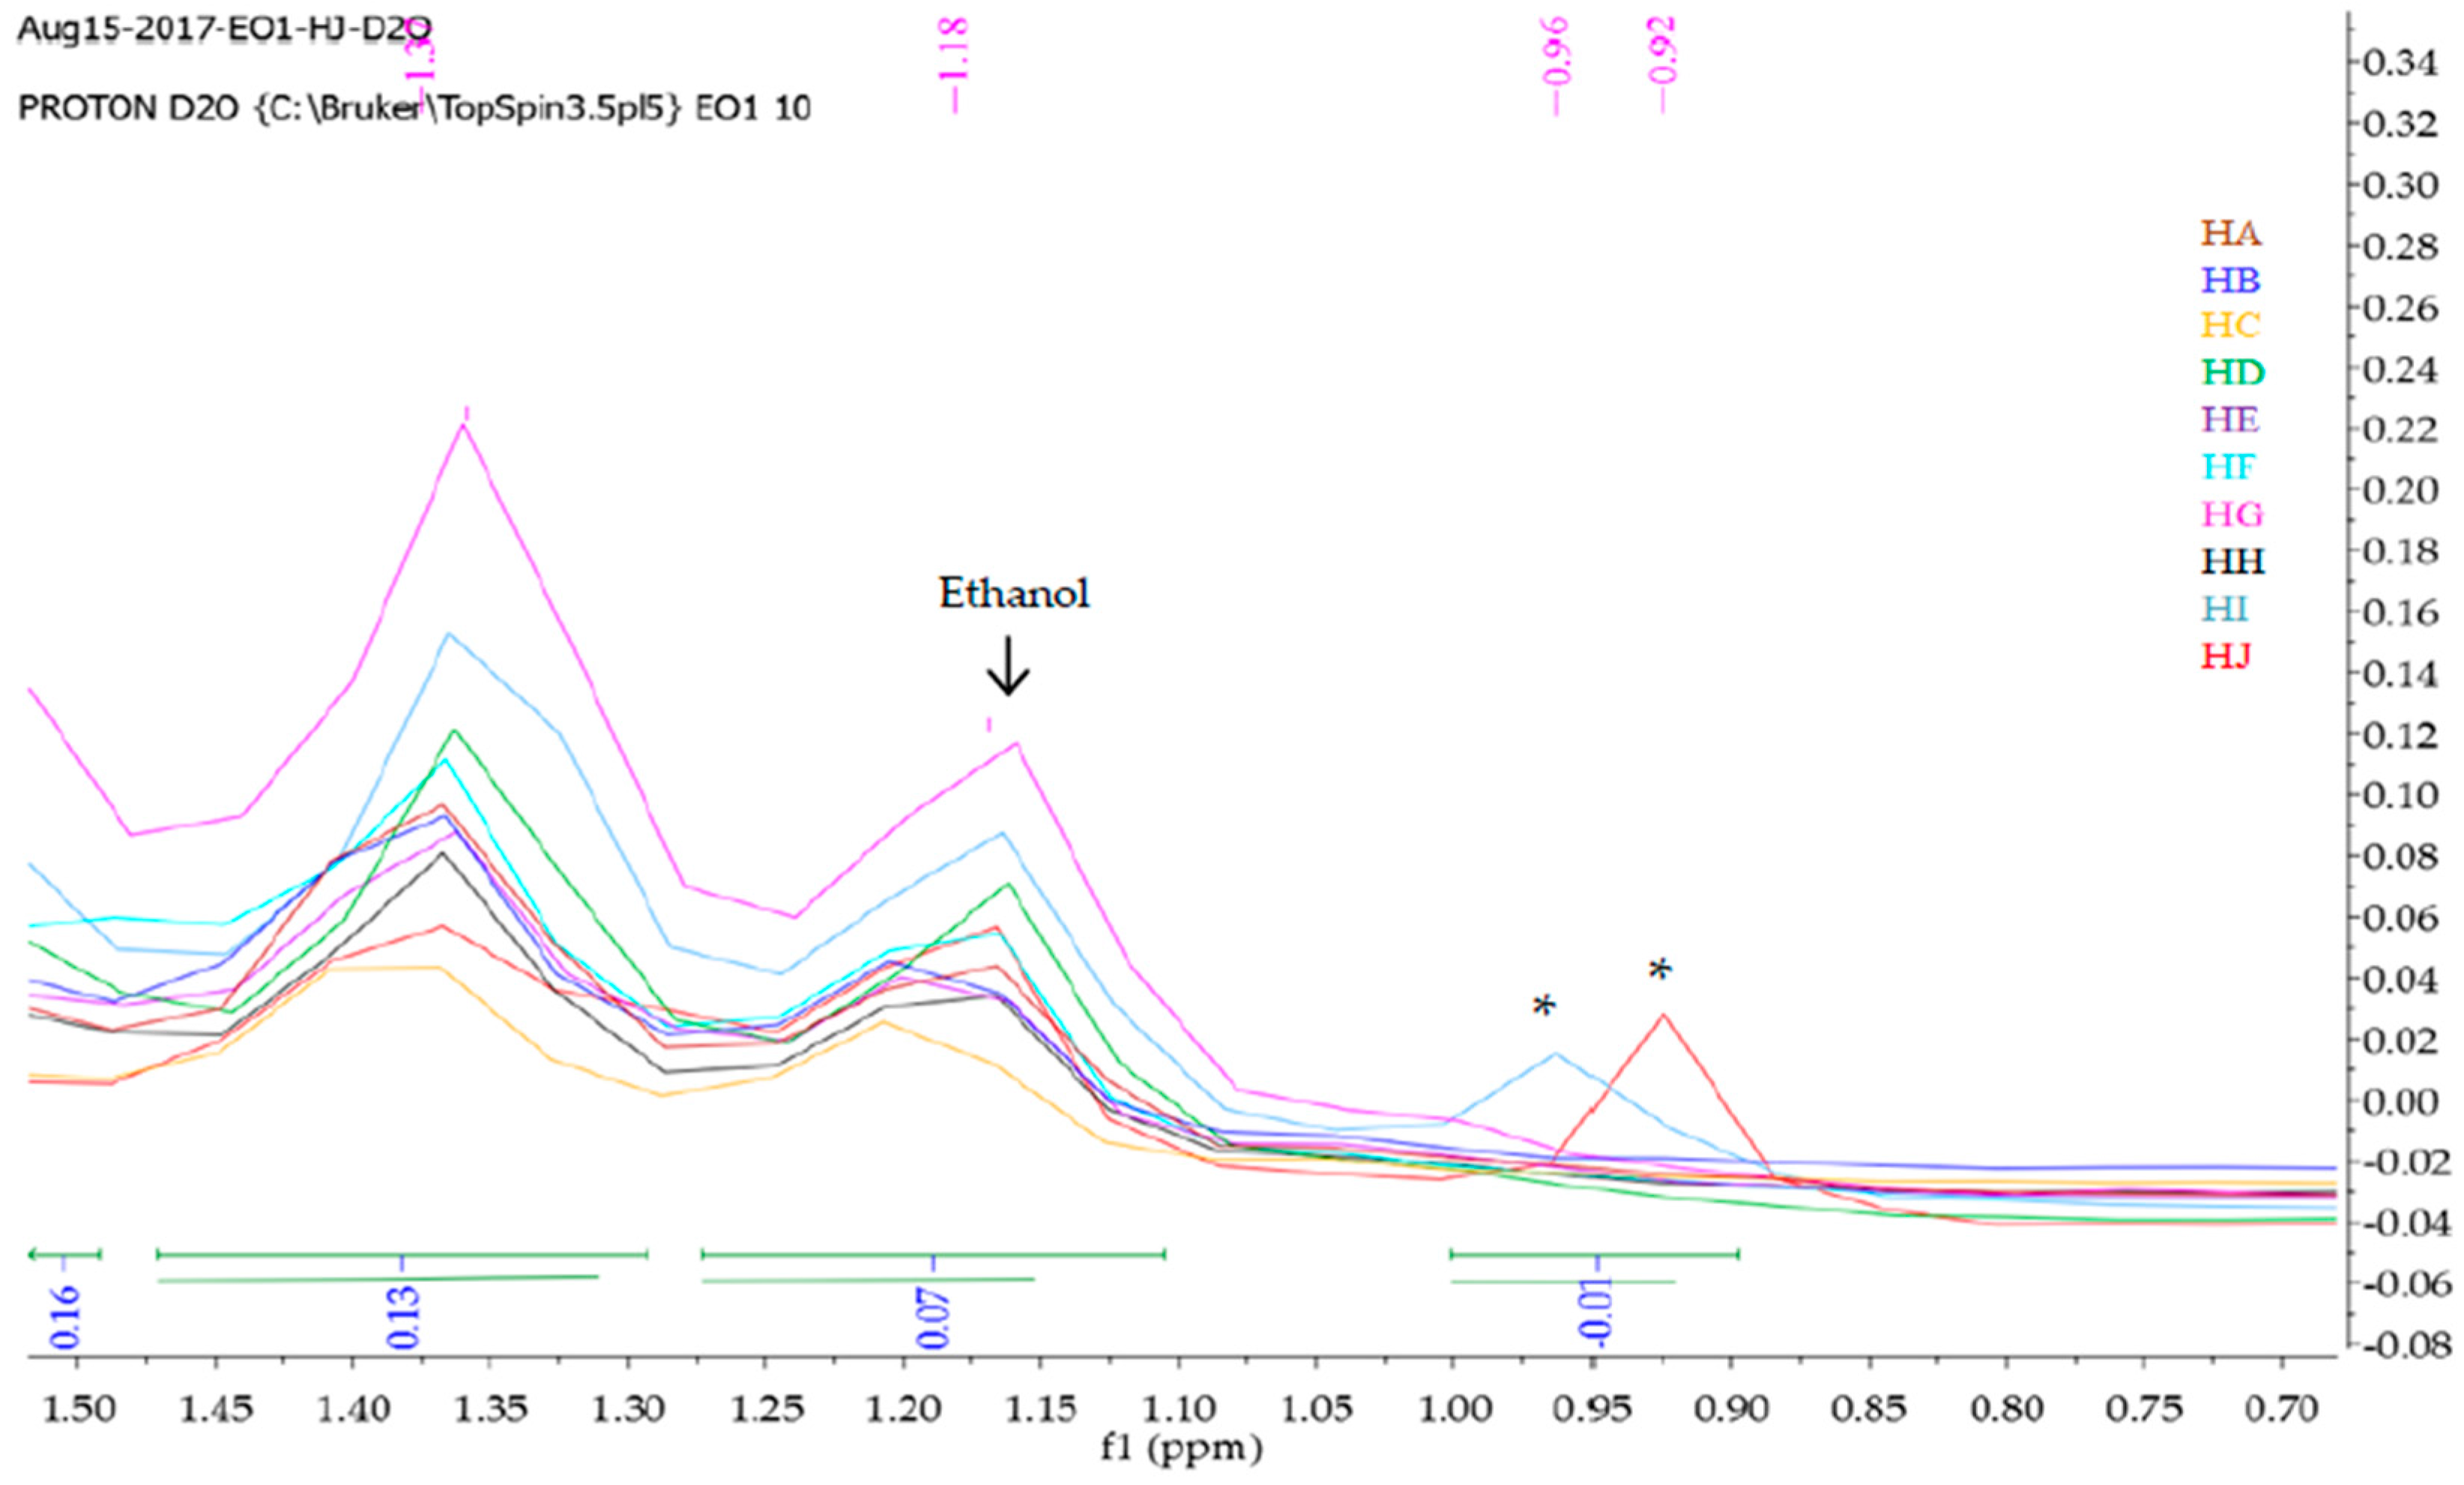
2.2. 1H-NMR Fingerprinting

Nuclear magnetic resonance (NMR) spectroscopy has been used to identify organic compounds in food samples, particularly liquids such as wines, fruit juices, and honeys [36,43]. For example, some Italian honeys were classified using NMR spectroscopy in combination with multivariate statistical tools [44,45], and the principal component analysis (PCA) of the NMR data has been used to determine the identity card of saccharides from floral source [46,47]. The chemical composition of natural honey depends principally on the floral origin and geographical source; thus, the chromatographic and spectroscopic fingerprints are not expected to be the same for the honeys under current investigation, since they were obtained from different geographical and floral origins.
Mnova 12 NMR software was used for the 1H-NMR fingerprinting. The zone between 4.70 and 5.00 ppm was excluded from the superimposed and binned spectra of HA-HJ in order to get rid of the residual water peak [26]. Then, the stacked 1H-NMR spectra signals between δ values 10.5 and 0 ppm (Figure 1) were segmented into various regions (9.60–7.20, 5.30–3.20, 3.0-1.50, and 1.50–0.75) to obtain characteristic fingerprints for each of the honeys to identify and classify the samples on the basis of similarity or dissimilarity of their chemical composition (Figure 2, Figure 3, Figure 4 and Figure 5). The full superimposed and binned spectra (Figure 1) at δ value range of 10.5–0.00 ppm revealed similar fingerprints for all the honeys, showing possible similarities in the major chemical composition. However, the weak signal regions (0.75–1.50, 3.00–1.50, and 9.60–7.20 ppm) of the expanded spectra showed characteristic peaks for each honey, which can be used to categorise them into clusters. The fingerprints of all the honeys at region 1.50–0.75 ppm are similar to the exception of the two Zambia honeys (HI and HJ) with an extra signal at 0.93 ppm (Figure 2), indicating the same floral origin for HI and HJ. It was also observed that each of the honeys has a diagnostic fingerprint at region 3.00–1.50 ppm with the exception of the South African (HH) and a Zambian (HI) honeys that have similar pattern (Figure 3), indicating similar chemical constituents in this region of the spectra origin. Region 9.60–7.20 ppm (Figure 5) represents the downfield region, showing HA, HC-HF, and HI sharing similar fingerprints, while each of the remaining honeys (HB, HG, HH, and HJ) has a unique fingerprint in this region of the spectra. This shows that apart from HB and HH, all honeys obtained from South Africa, HA from Slovakia, and HI from Zambia contain similar chemical constituents in this region. However, irrespective of the geographical and botanical origin, all the honeys contain two chemical markers with δ values of 8.46 ppm (formic acid) and 9.49 ppm (HMF) [48]. The carbonyl signal CHO resonating at 9.49 ppm has a low integral value 0.02 compared to the major signals, as typified by α-Glucose signal resonating at 3.25 ppm with an integral value of 1. It shows that all the honeys contain hydroxymethyl furfural (HMF), which is a quality control marker in honeys. Generally, the level of HMF in honey increases during prolonged storage and with overheating of honey during processing. Other signals observed in the weak fingerprint regions include ethanol (1.18 ppm, CH3), methylgloxal (2.25 ppm, CH3), and other aryl signals at 7.41 and 7.66 ppm (Figure 2, Figure 4 and Figure 5) [3,49]. The 1H-NMR signals at the most intense region (δ = 5.30–3.20 ppm), particularly between 4.20 and 3.20 ppm, represent the major monosaccharides (e.g., d-glucose and d-Fructose) and disaccharides (e.g., maltose and sucrose) in honey (Figure 4), whereas the 5.30–4.50 ppm portion of this region contains mainly anomeric and glycosidic signals, and all the honeys have similar 1H-NMR fingerprints in this region. Thus, this region cannot be used to categorise or distinguish the honeys as corroborated by the assignment of the 1H-NMR signals for the major monosaccharides in honey [46].

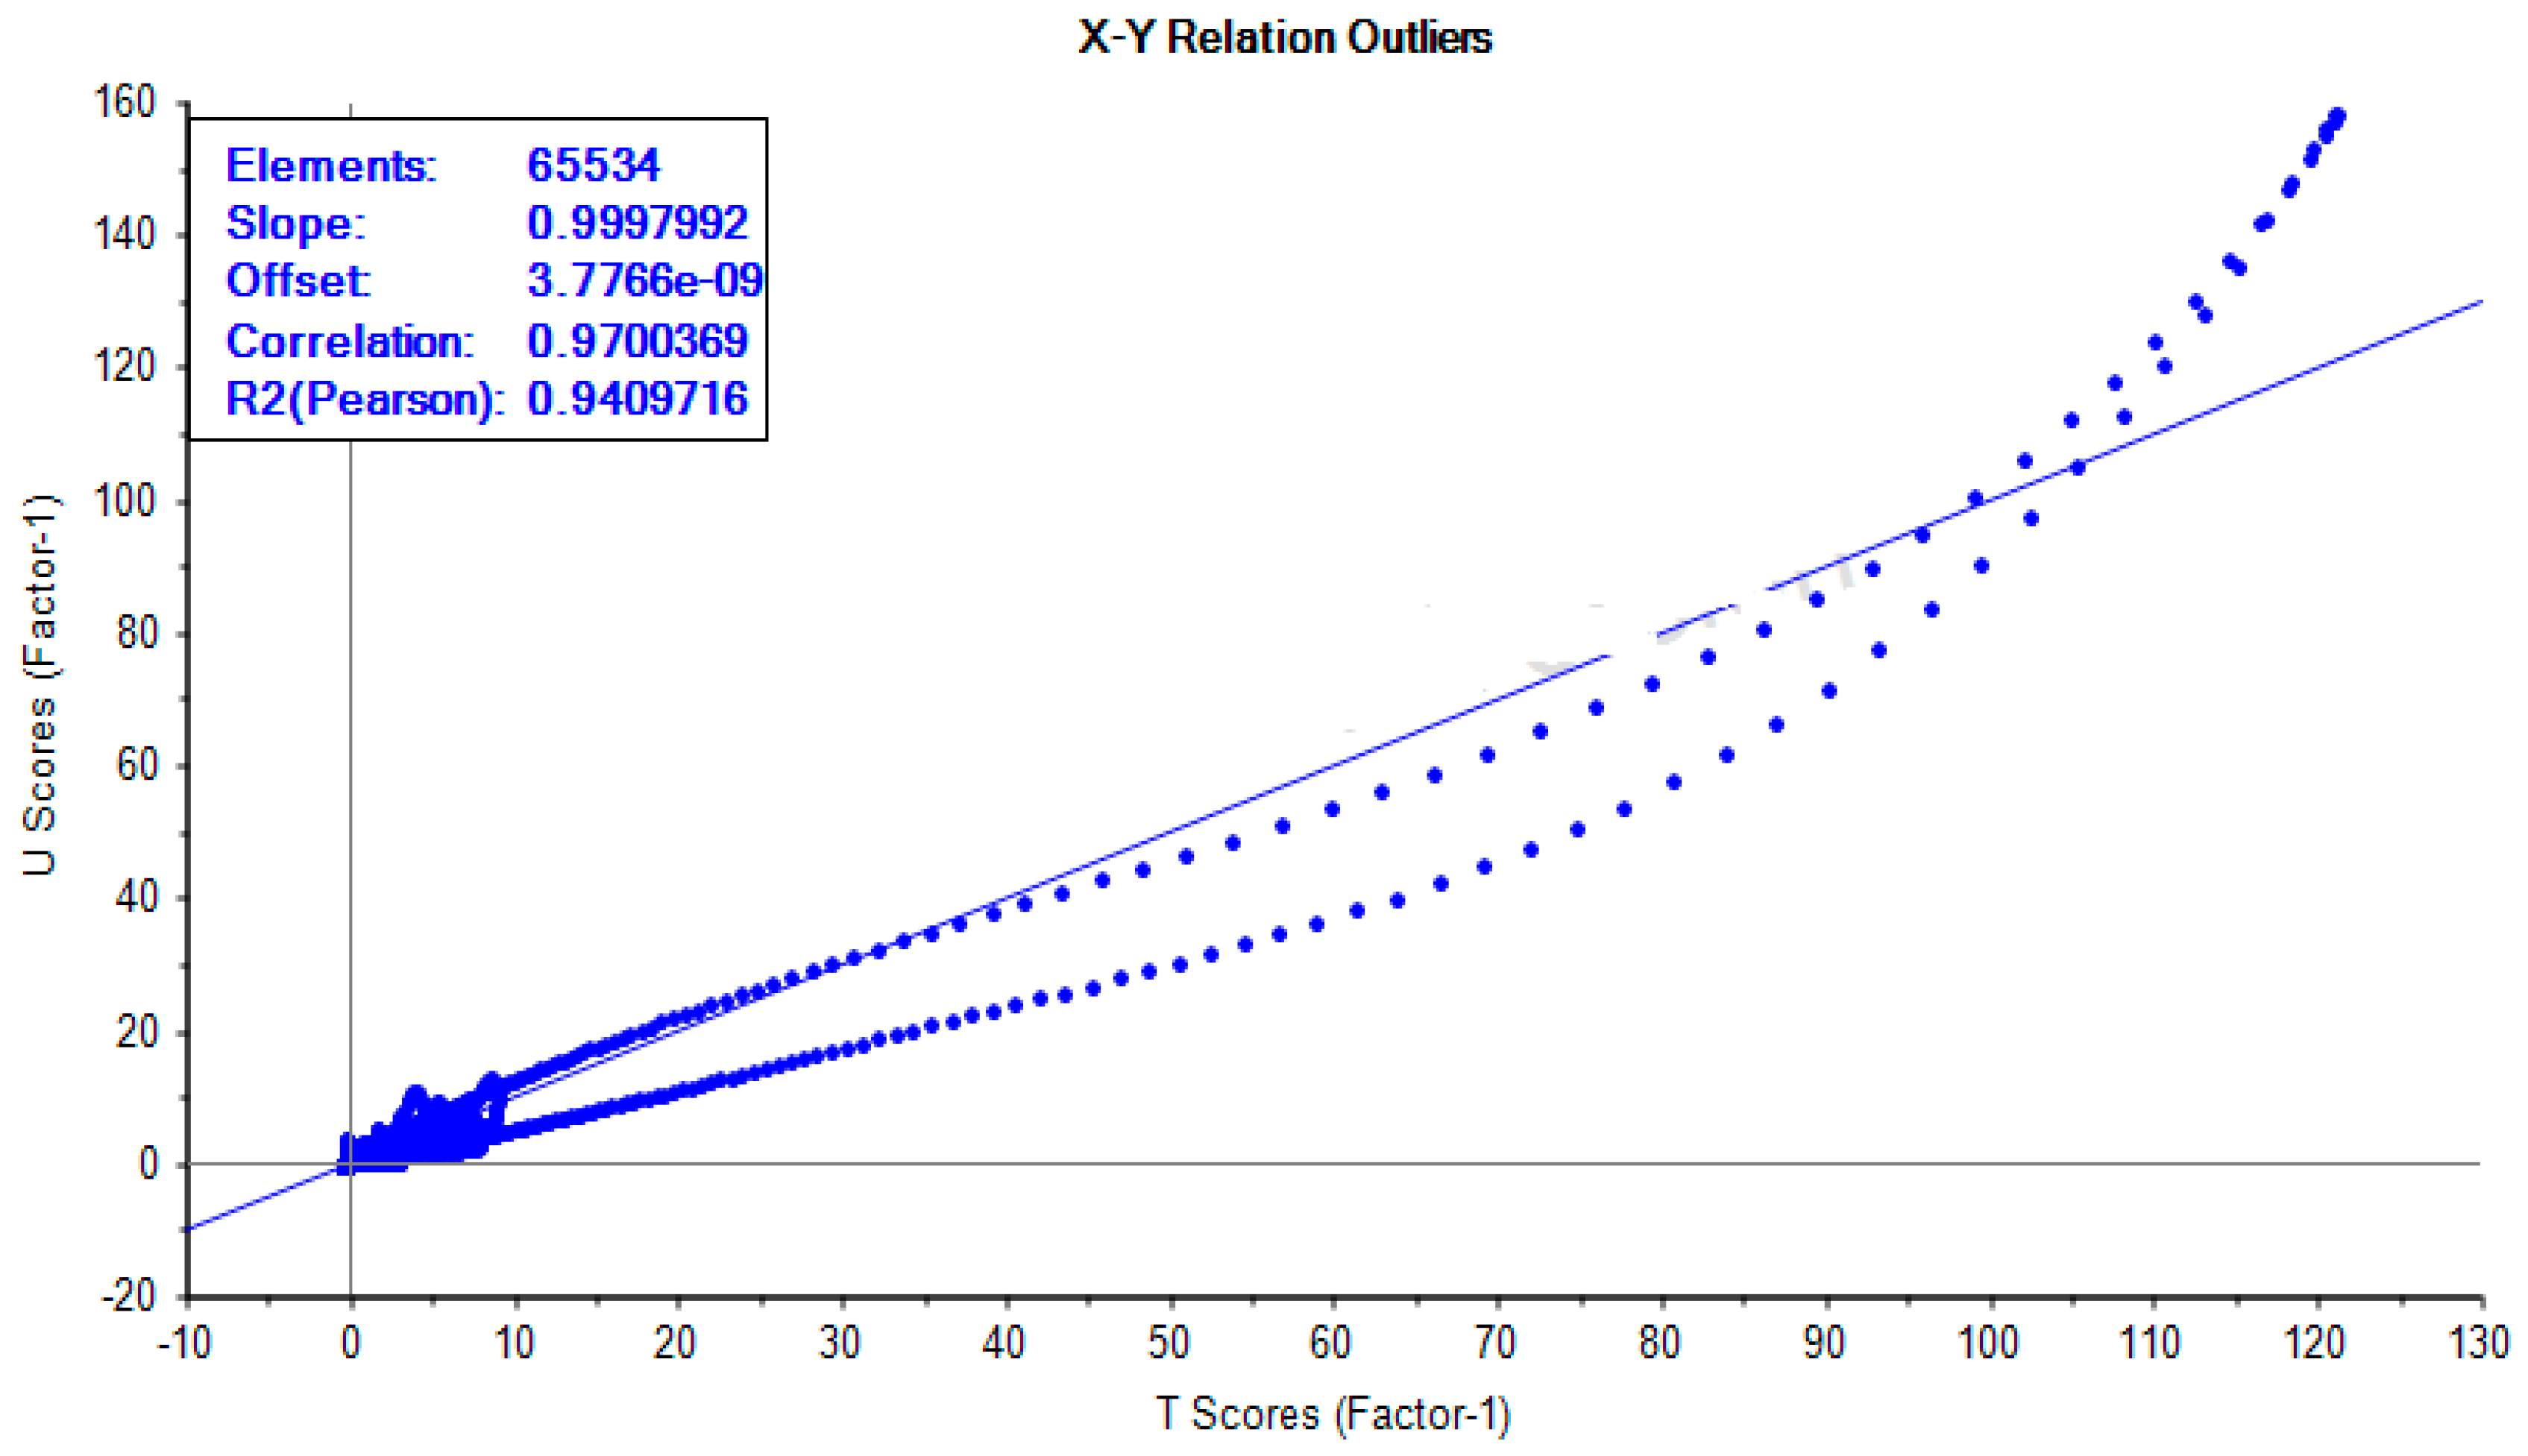
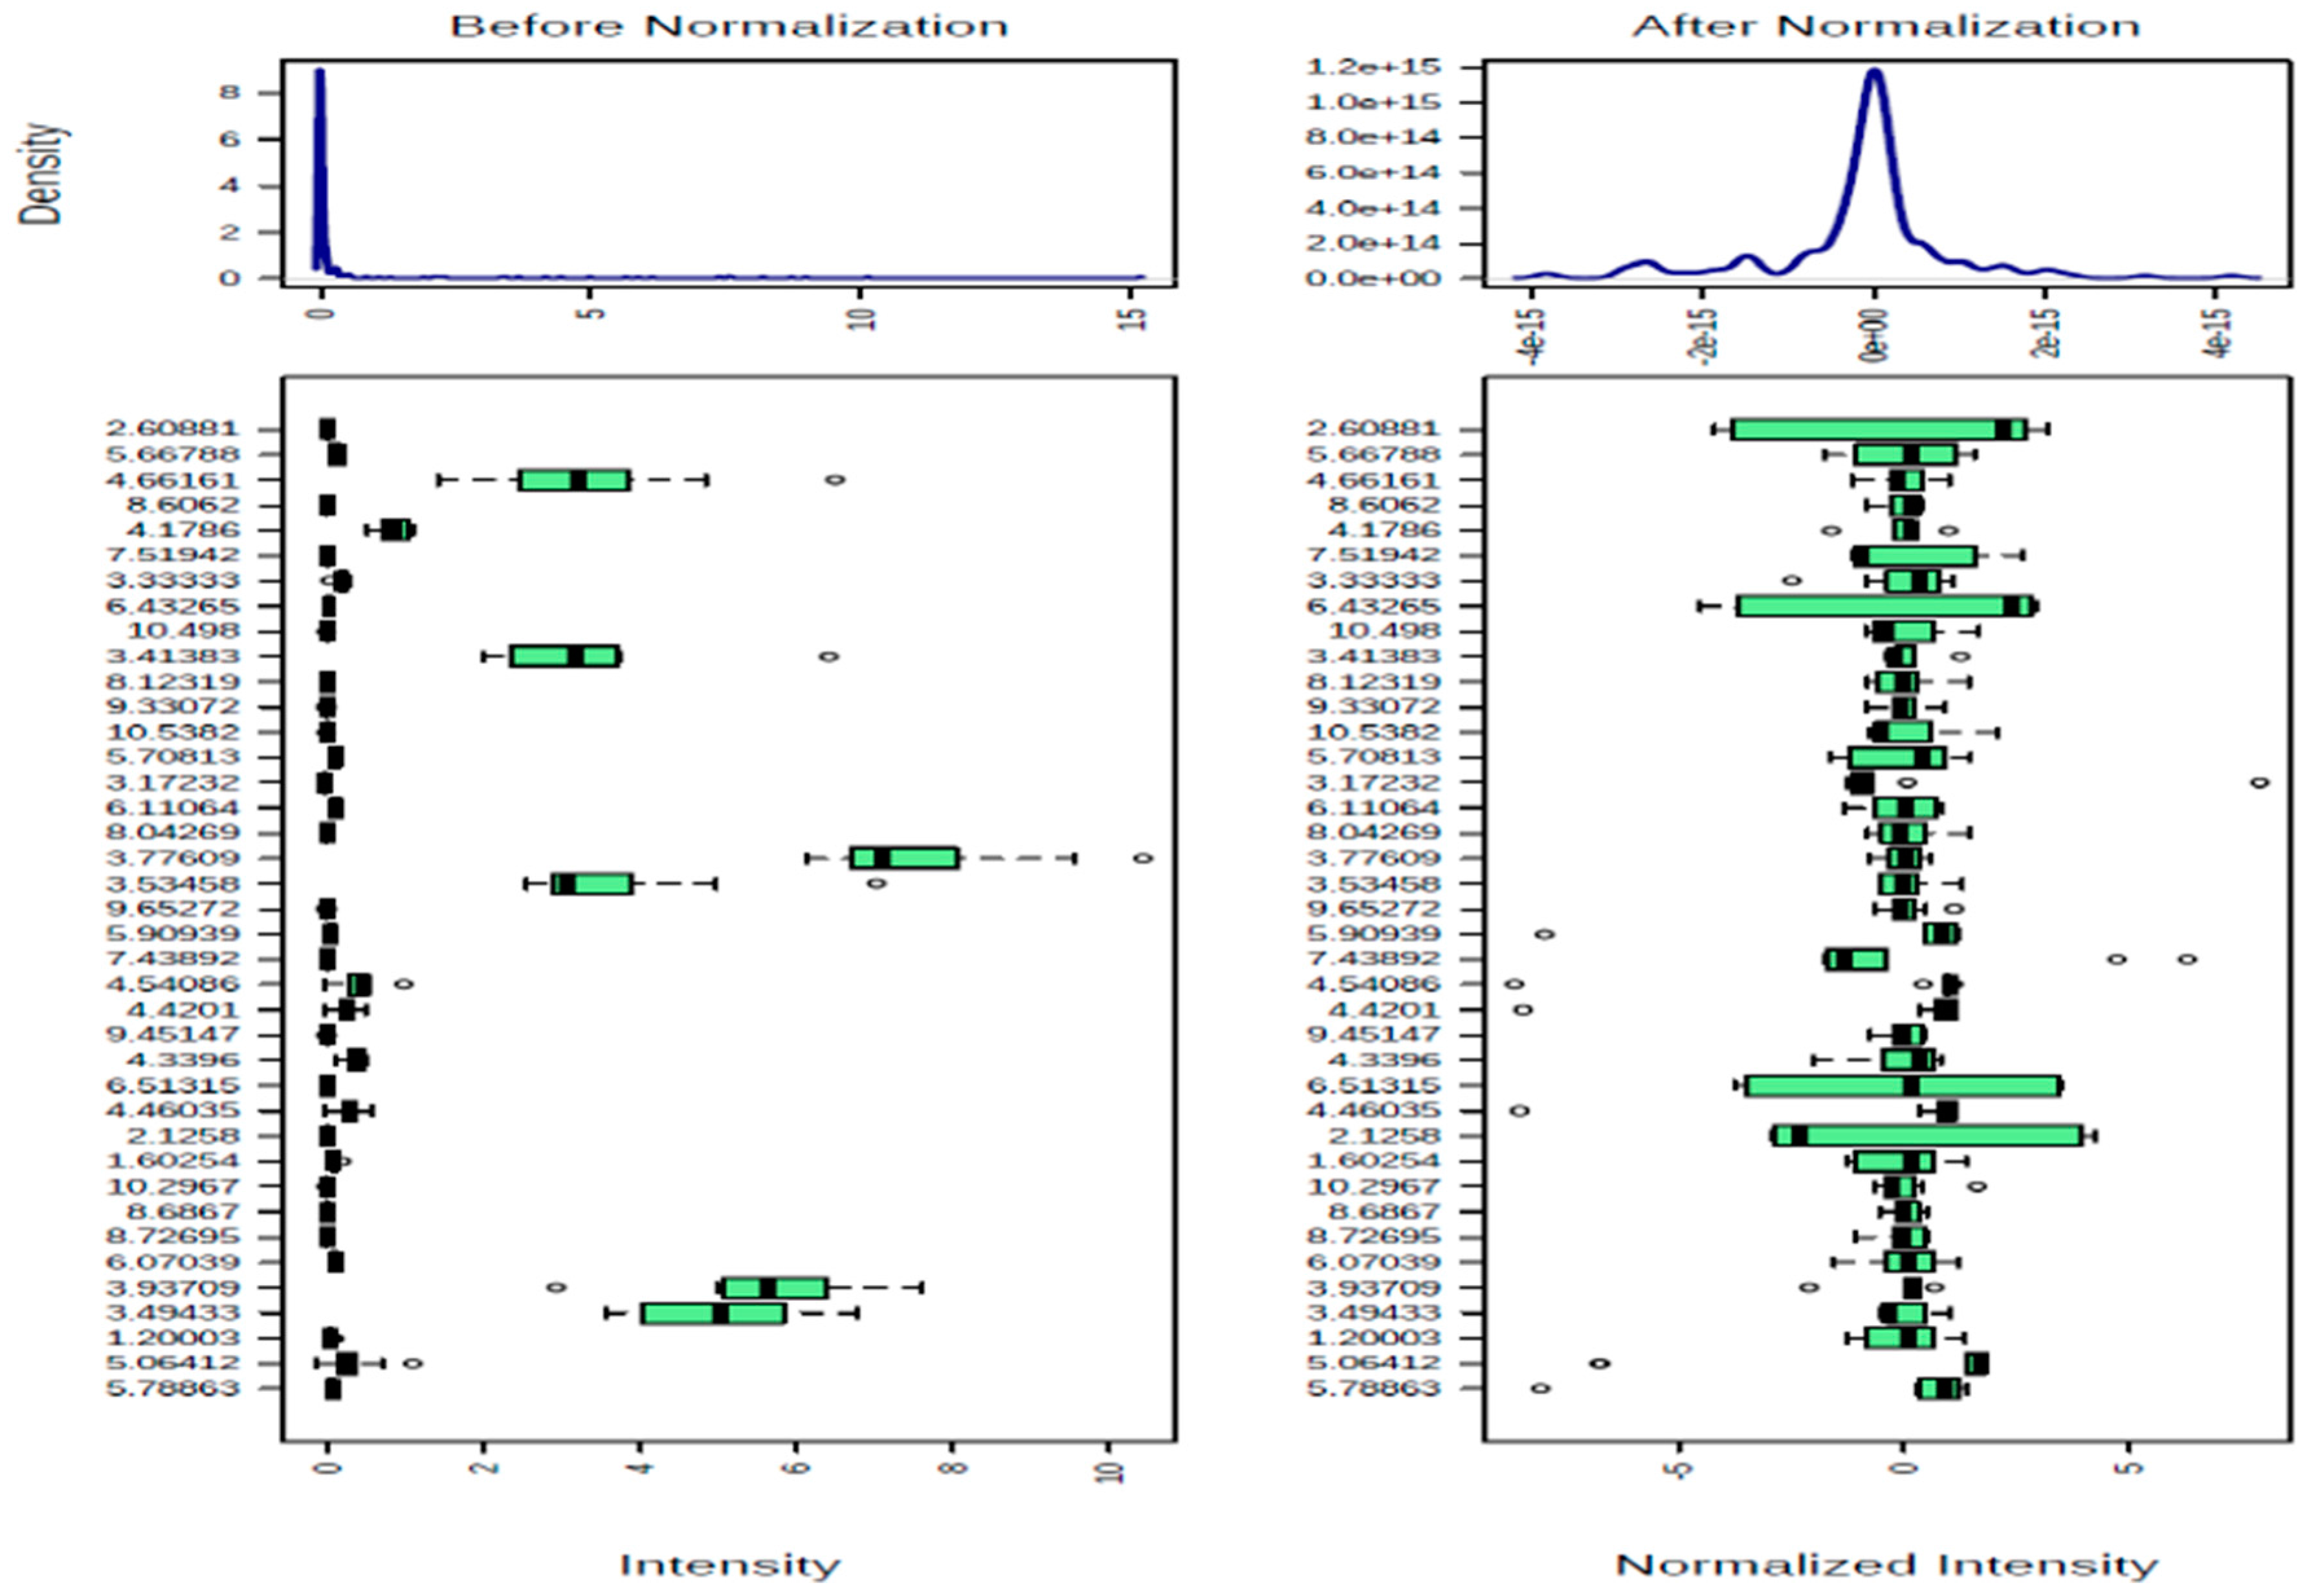
2.3. Data Validation and Transformation

Model selection, validation, transformation, and quality control of the raw data were carried out using MetaboloAnalyst 3.0 (Parasitology Building, 21111 Lakeshore Road Ste. McGill University, Anne de Bellevue, QC, Canada; http://www.metaboanalyst.ca), Simca 15 (Umetrics, Tvistevägen 48 SE-907 36, Umeå, Sweden) and the Unscrambler® X 10.5 (CAMO Software AS., Oslo Science Park, Gaustadalléen 21, Oslo, Norway) software. Variation in the intrinsic pH of honeys may cause the chemical shifts of the chemical constituents or metabolites to vary, and it may require the addition of buffers to the deuterated solvents for the NMR experiments. The preliminary investigation of the pH values of the honeys showed a narrow pH range with a value of 0.63 (calculated from the difference between 3.75 ± 0.015 and 4.38 ± 0.025); thus, the addition of buffers to D2O was considered unnecessary. The 1H-NMR data points were reduced from 65534 data points to 271 continuous bins of equal width of 0.04 ppm for the chemical shift range of 10.5–0.00 ppm, using Mnova 12 NMR software after peak peaking and integration of the spectra. This procedure was carried out to reduce dimensionality in chemical shifts among the honeys, which may arise from small variations in pH, ionic environment, and other factors that may affect the chemical environment and the results of the principal component analysis (PCA) and principal least square discriminant (PLS-DA) methods.
All the OH peaks of the sugars of the 1H-NMR spectra of the honeys have been exchanged for D2O, and they appeared as broad peaks at 4.790 ppm. Hence, region 5.00–4.79 ppm was excluded from the spectra to remove the effect of variation of the suppression of the water resonance and any cross-relaxation effect of the OH peaks of the honeys that has been exchanged for D2O. The Unscrambler® X 10.5 software was used to determine the outliers, representing data points that arise from a different model and that are different from the rest of the data points, showing correlation coefficient of 0.97004 and R2 value of 0.94097, indicating good linearity of the 1H-NMR data for HA-HJ (Figure 6). The results of cross-validation of five cycles using with Simca 15 software showed the R2 values to be higher than the corresponding Q2 values for HA-HJ and the reference sugars (Figure 7), confirming the reliability of the model. Similarly, cross-validated R2Y and Q2 coefficients values of 0.989 and 0.477, respectively, and PLS-DA model validation based on separation distance of p value of 0.797 were obtained using permutation tests for MetaboloAnalyst 3.0 software. The 1H-NMR spectra of d-glucose, d-fructose, maltose, and sucrose in D2O were similarly treated using Mnova 12 NMR, and were used as the reference values for the main metabolites of the honeys. Figure 8 showed the effect of quantile normalisation of the data using Log 2 transformation and Pareto scaling to make the metabolites concentration data reasonably normal and more comparable [50].

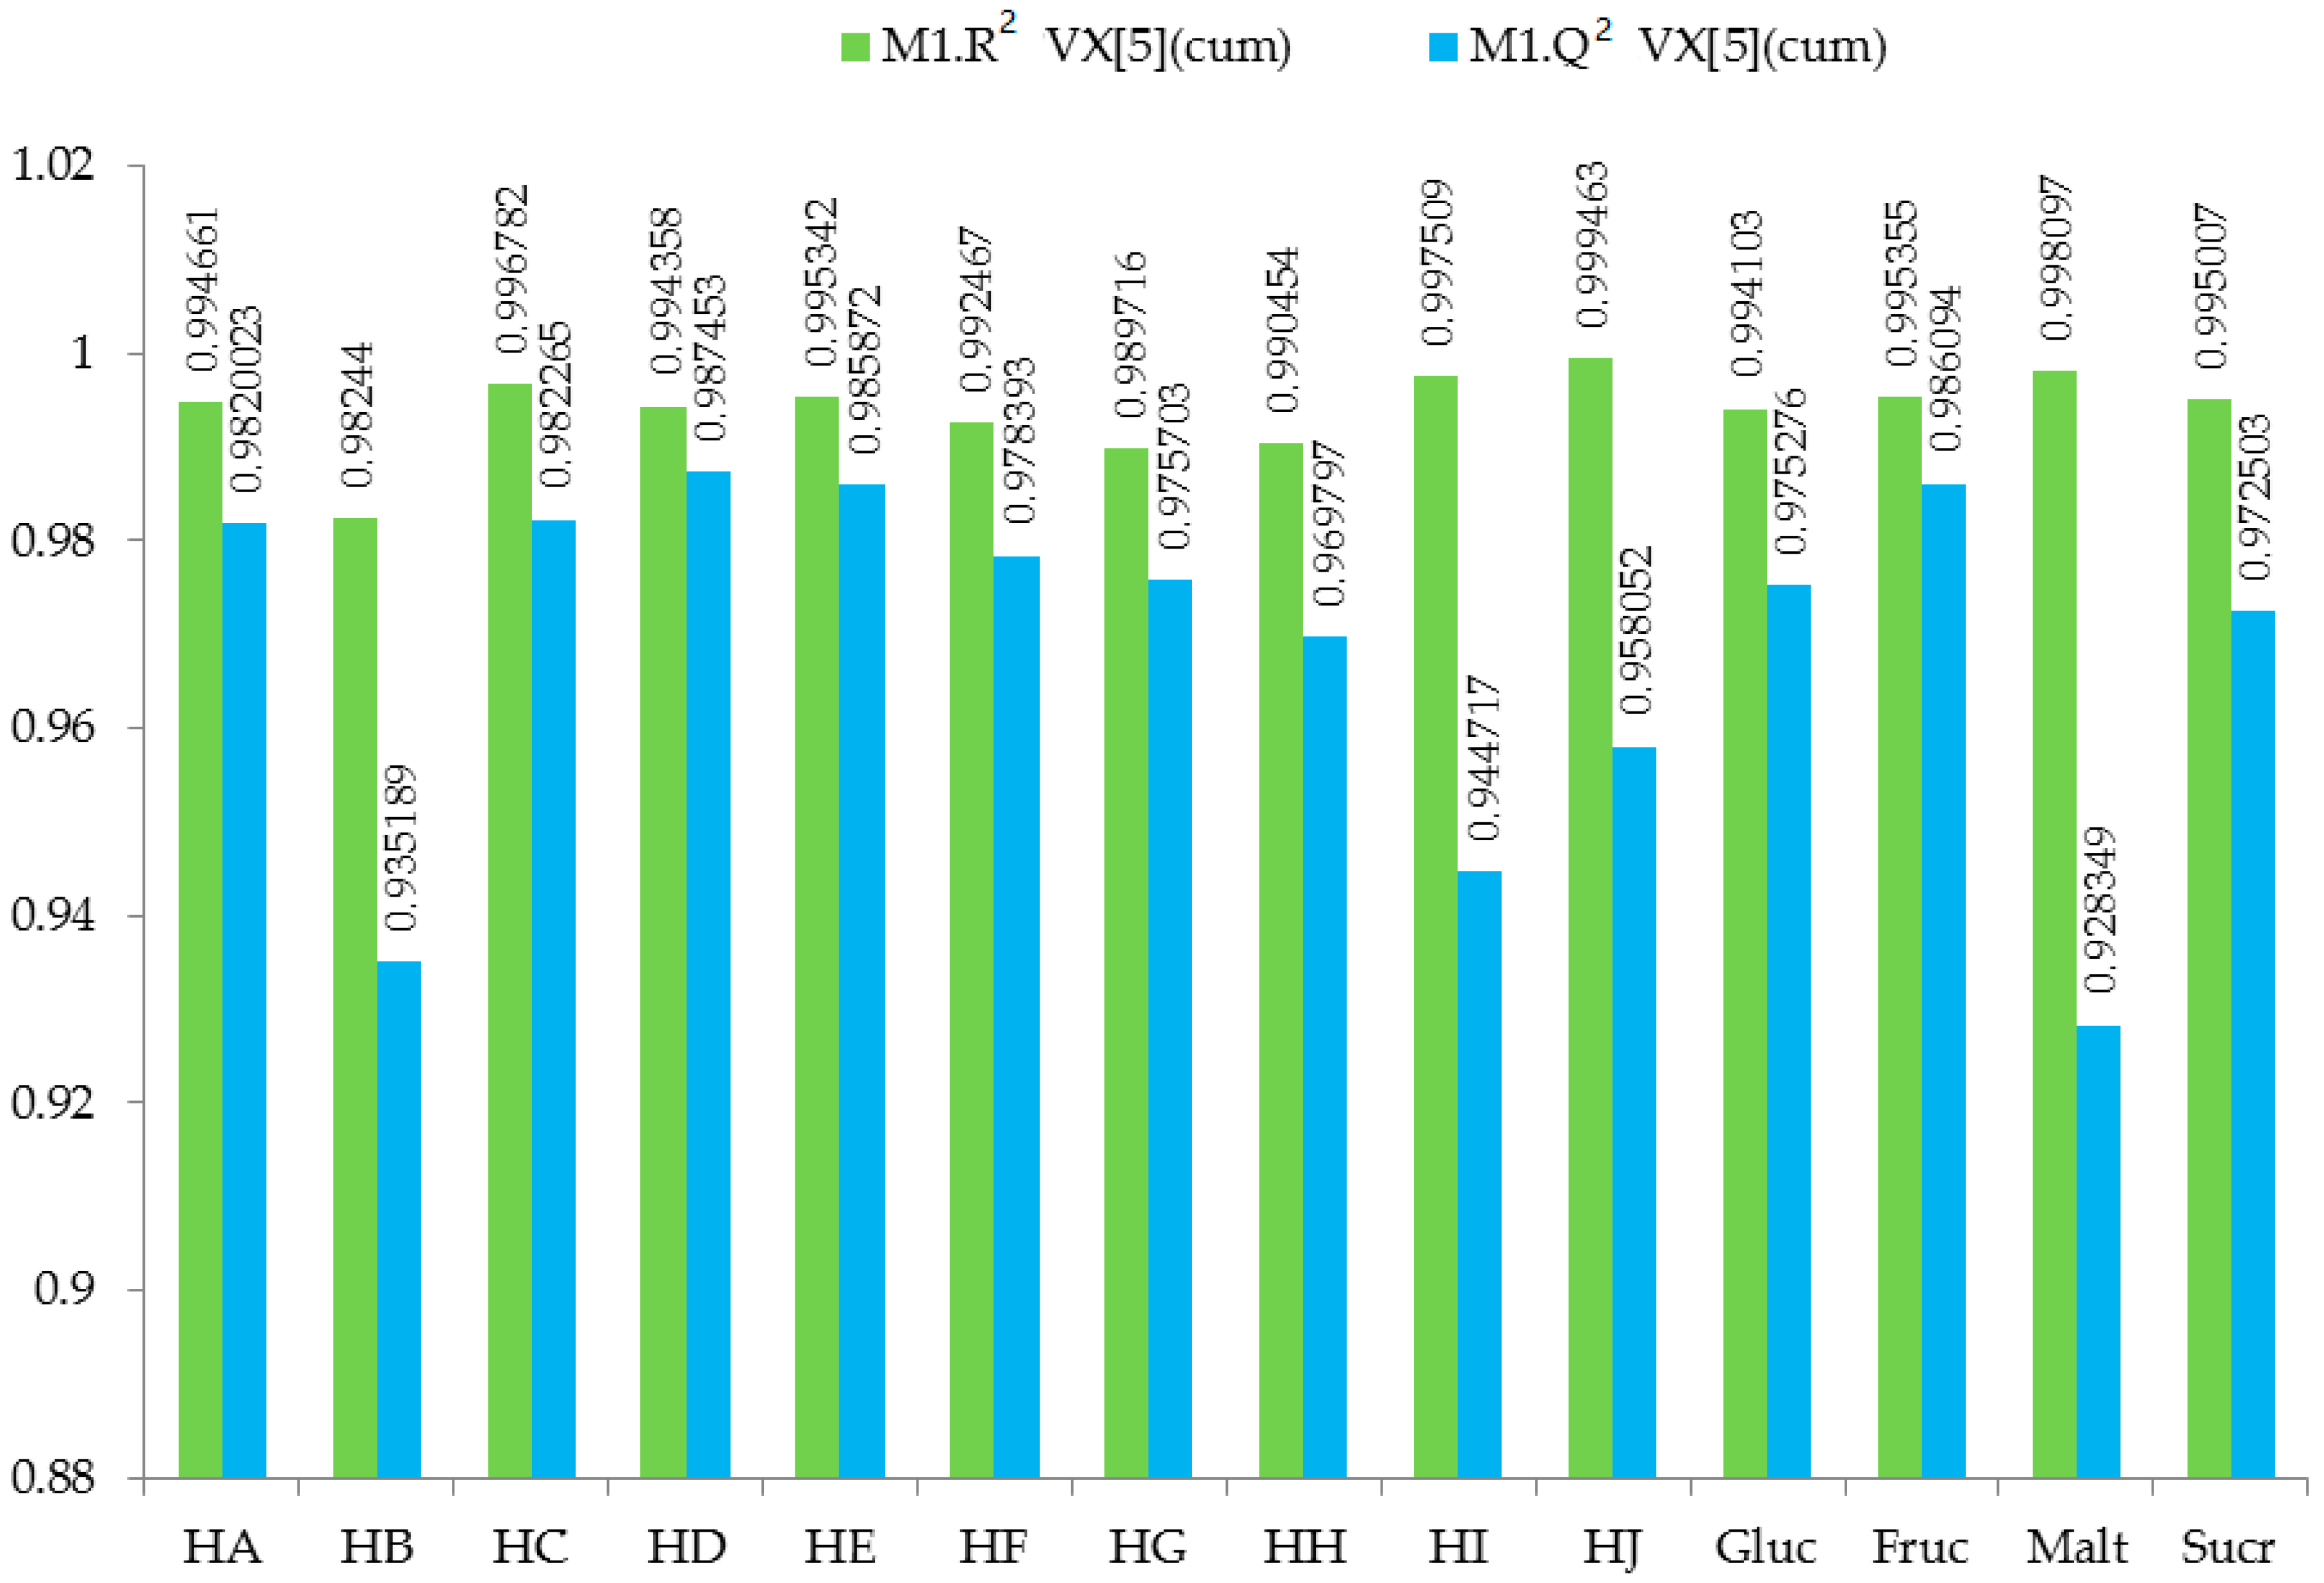
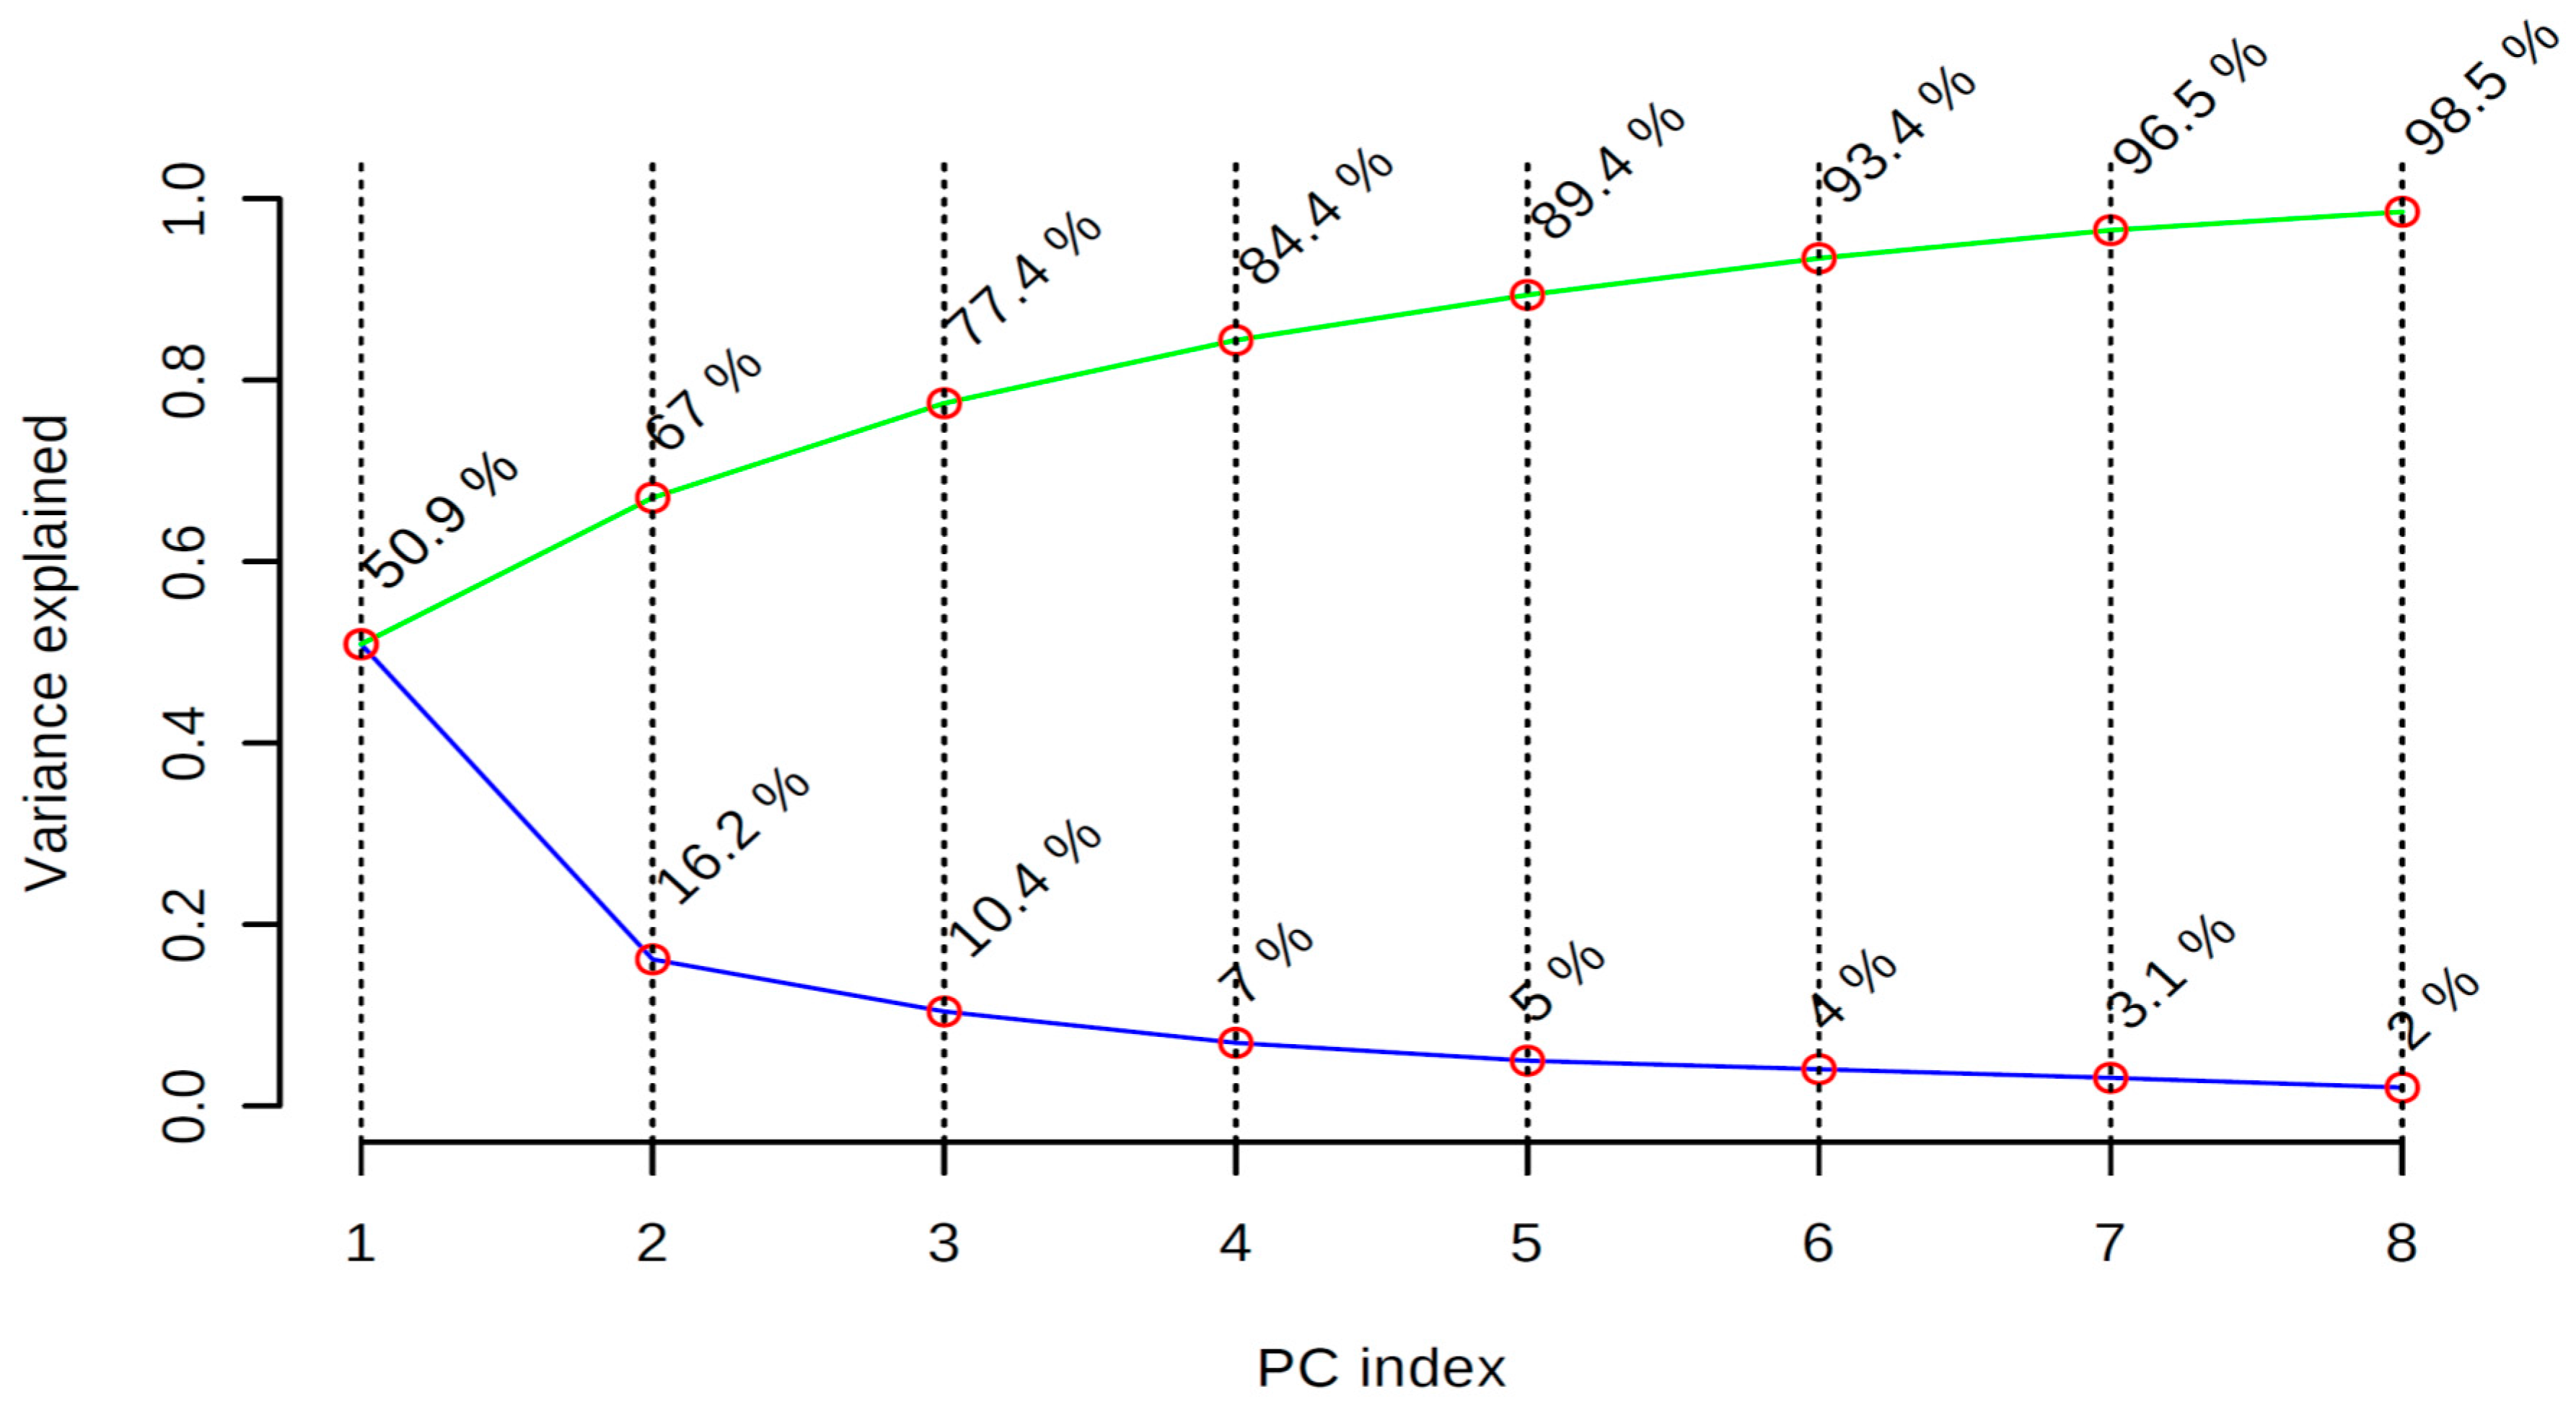
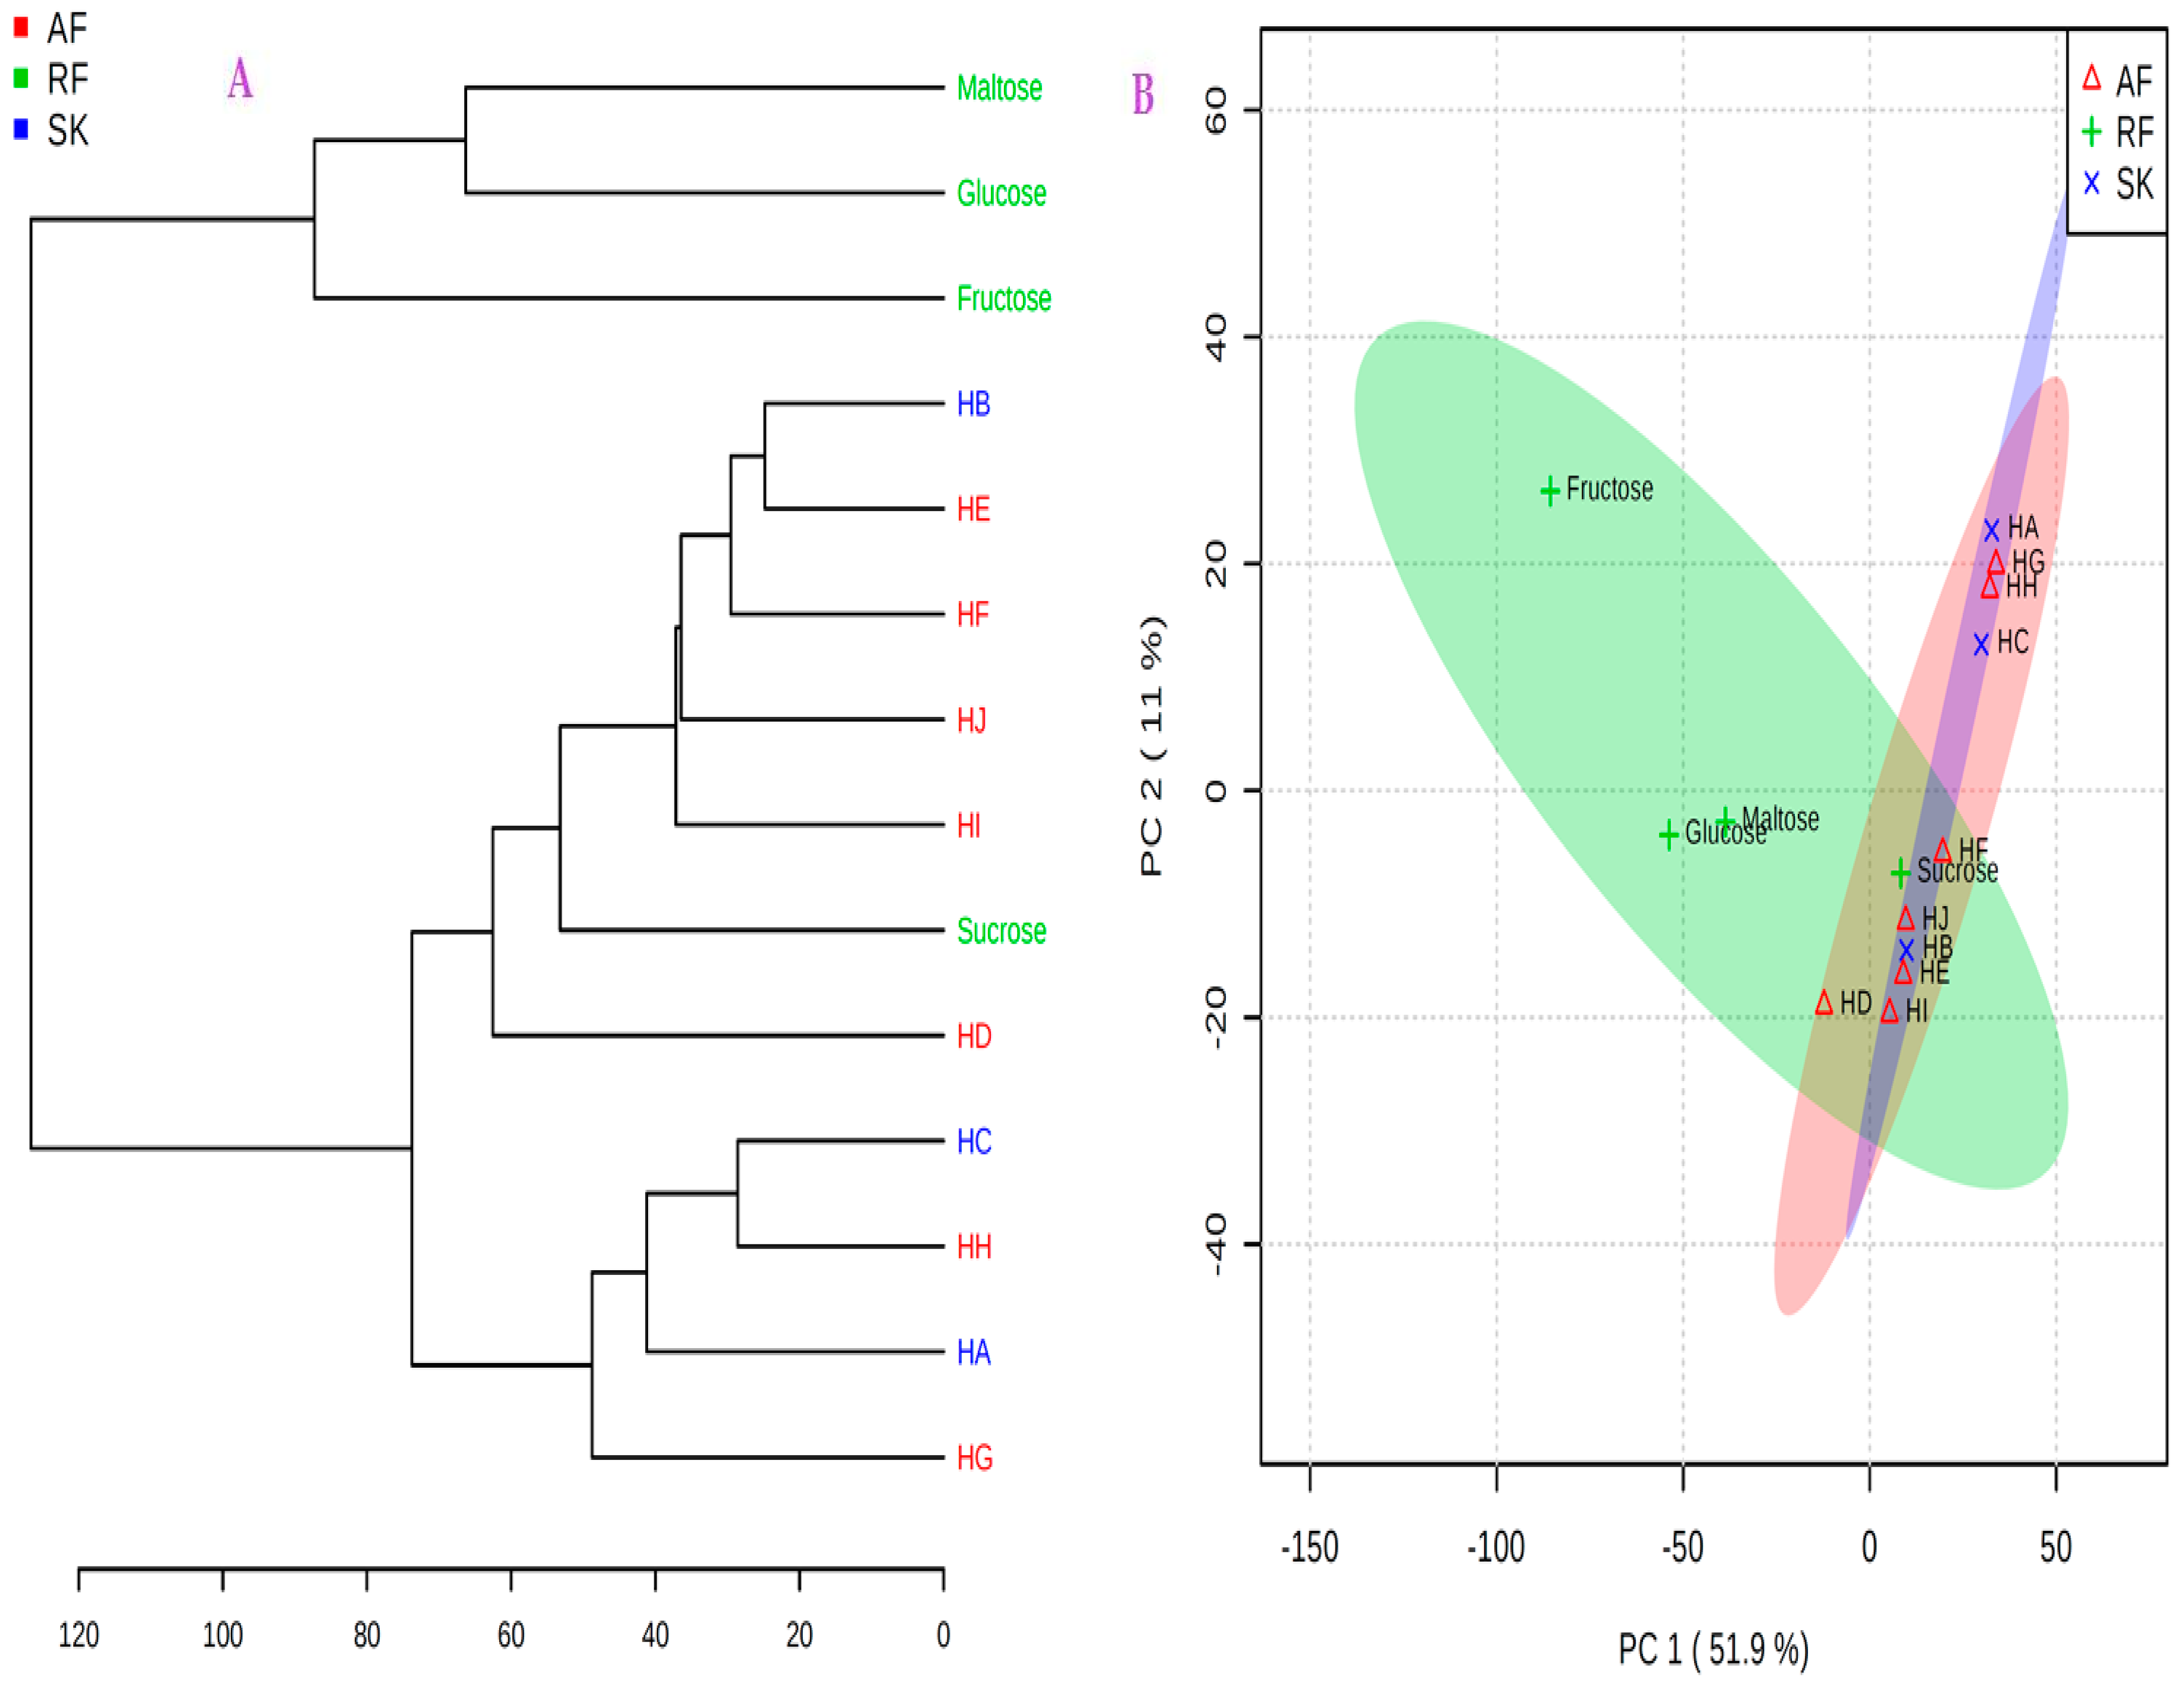
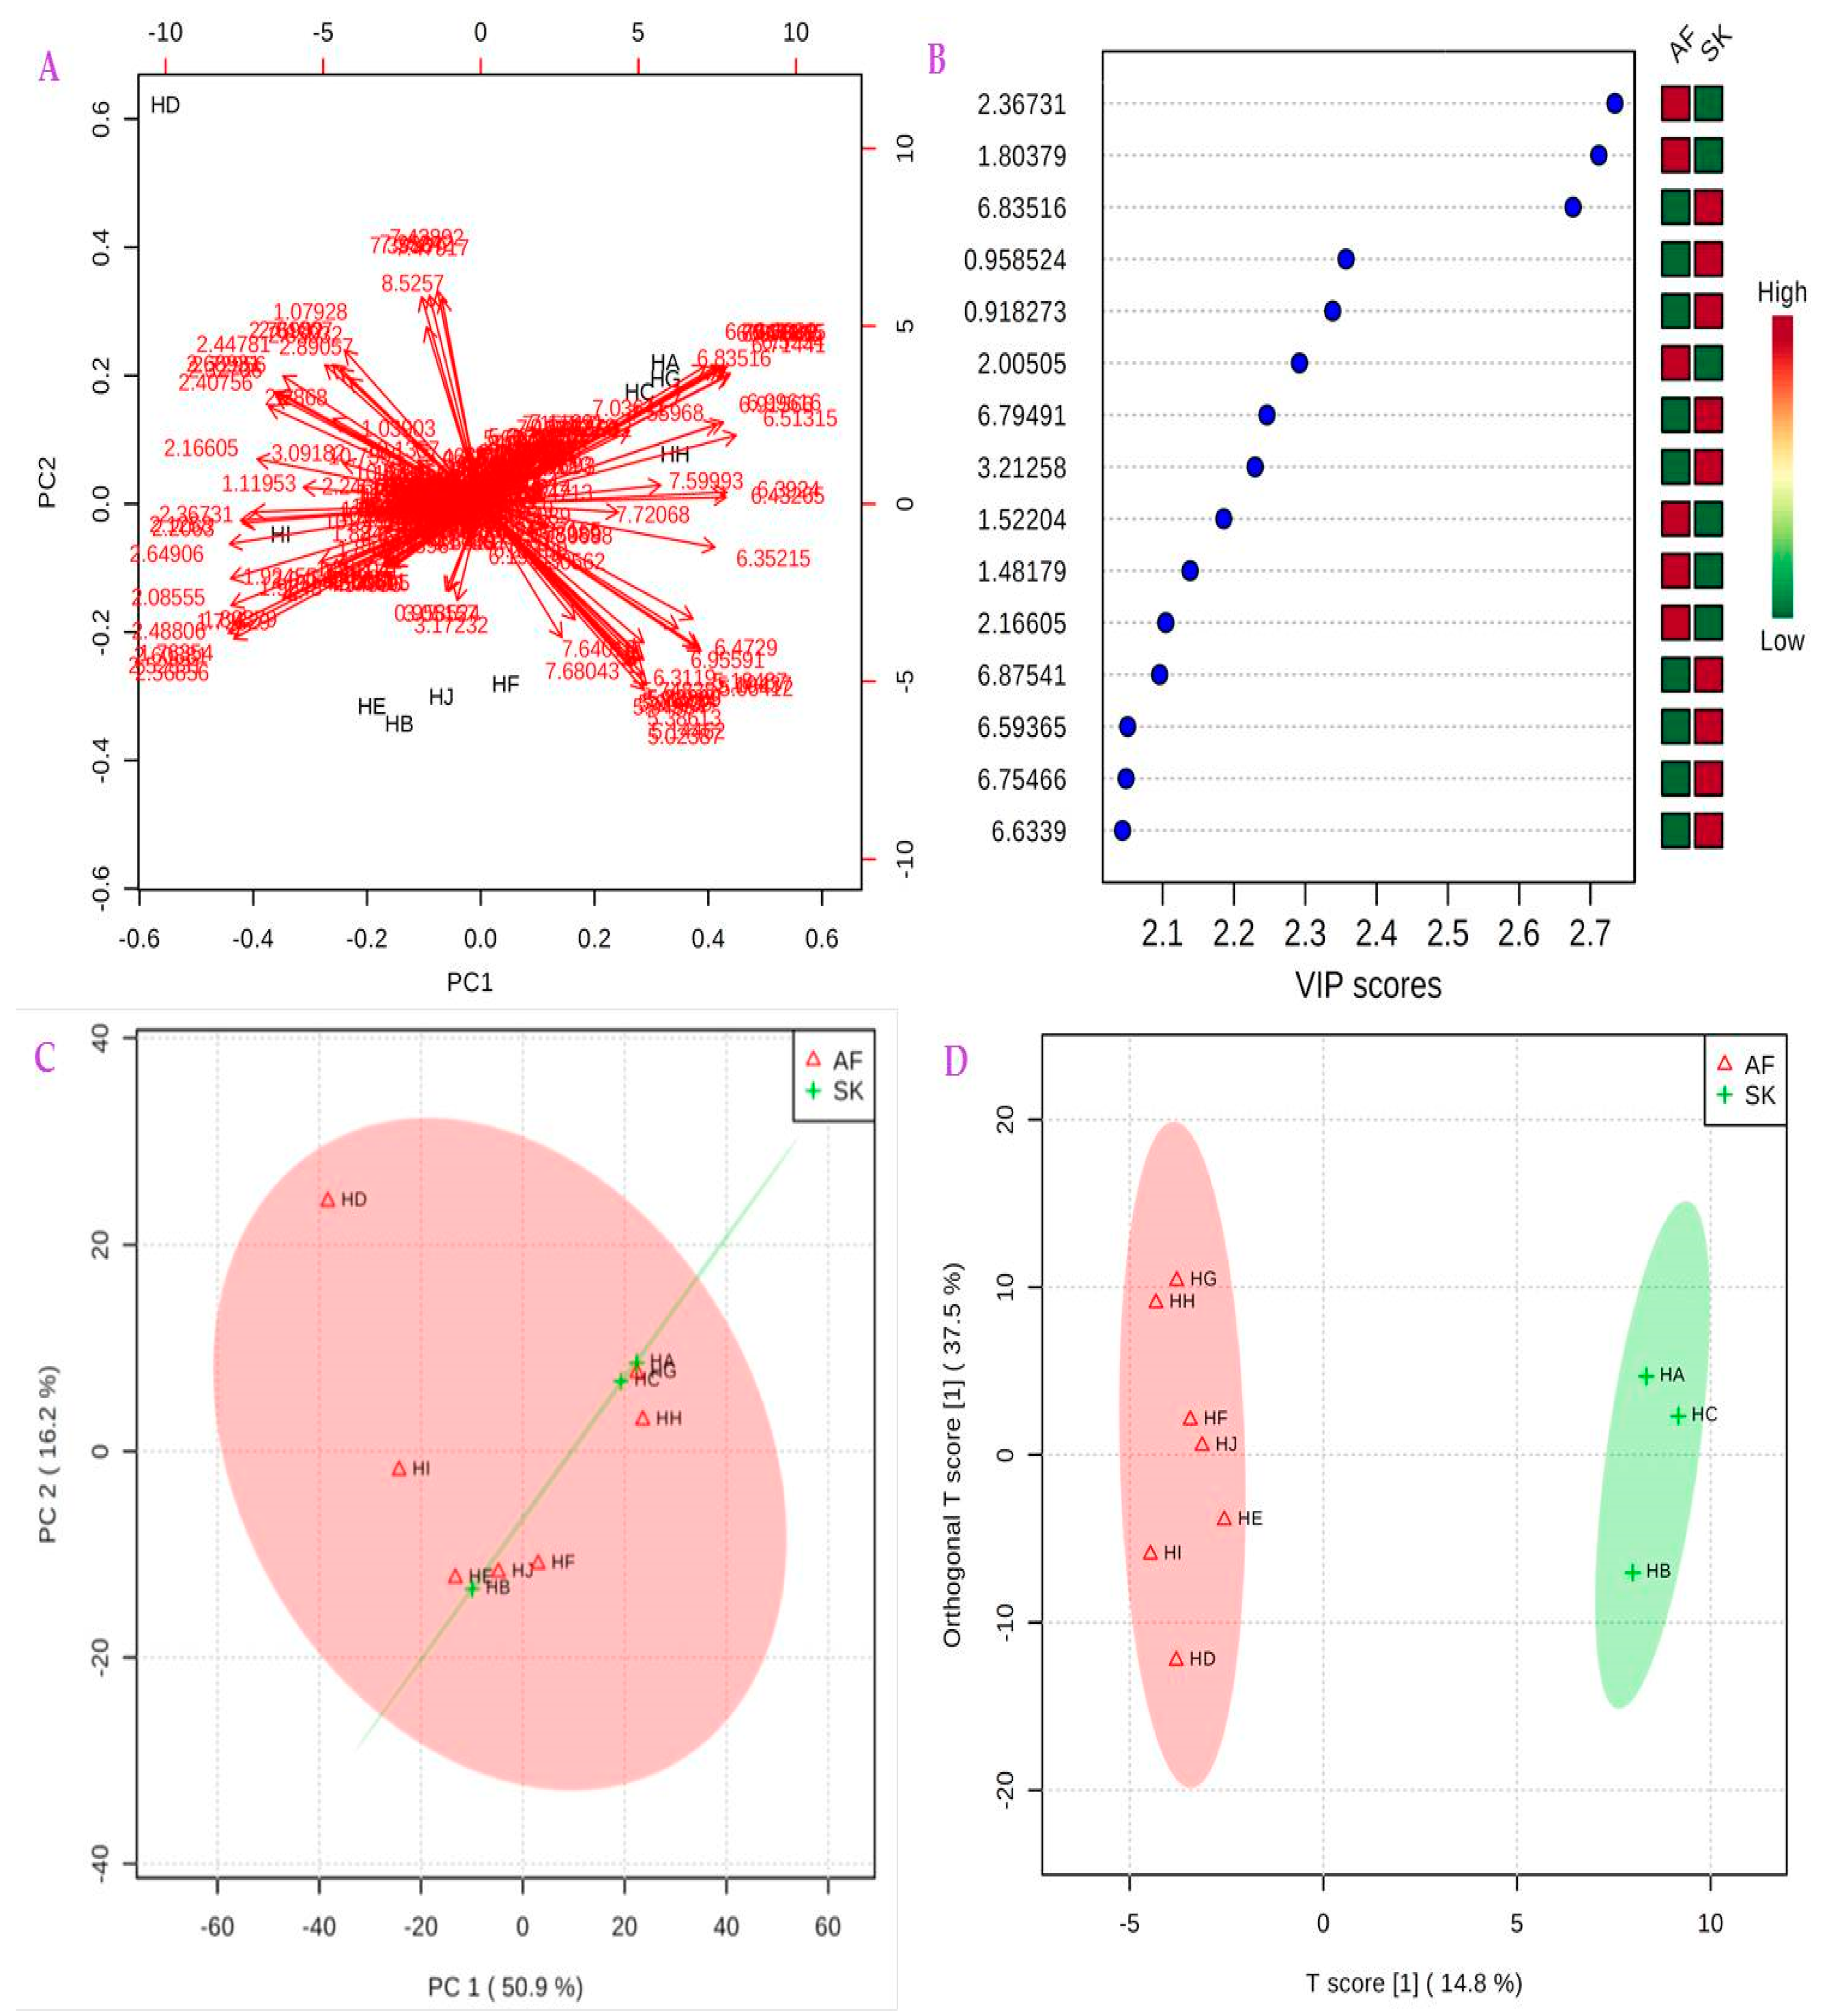
2.4. 1H-NMR Metabolomics Using Multivariate Analysis

1H-NMR spectroscopy in combination with chemometrics is a simple, fast, and reproducible method for profiling the metabolites in honey, and it only requires about 30 minutes for spectra collection, processing, and analysis of data. Recently, 1H-NMR profiling has become a fast and global method for authenticity screening for honeys [51]. The botanical origin of honey can be determined by selected signals using Principal Component Analysis (PCA) and projection to latent structures by Partial Least Square-Discriminant analysis (PLS-DA) [51]. In current work, the PCA and PLS-DA were performed using MetaboloAnalyst 3.0 software to visualise and evaluate the 1H-NMR data, report correlation, and categorise the samples.
Generally, the two most commonly used multivariate statistical tools are PCA and PLS-DA, and the results are often presented as loadings and scores. Score plots are two or three dimensional plot of the projection of the raw 1H-NMR data into a new coordinate system of principal components (e.g., PC1 and PC2 axes) to explain the maximal variance (PCA) or co-variance (PLS-DA) of the data. The score plot represents the map of the honey, showing the degree of closeness in the square plot as an indication of the similarity or dissimilarity of the binned data for the 1H-NMR intensity measured at 10.5-0.00 ppm range, whereas loading plots often show the composition of the variable or compounds responsible for the discriminating patterns. The PCA scree plot of the variance explained by PC1-PC8 showed that the principal component PC1 contributed 50.9% to the total variance observed. The other significant components are given by PC2-PC5 with percentage contributions of 16.2%, 10.4%, 7%, and 5%, respectively. The result further showed that the first eight components accounted for 98.5% of the variance of the samples data matrixes (Figure 9).
PCA is an unsupervised multivariate analytical method useful for summarising or reducing dataset into smaller number of independent variables. It is the weighted average of the original variables, which aims to find the directions that best explain the variance among the variables (X) without making reference to the class labels (Y). PCA extracts information and can identify trends or characteristics within the data; it removes noise during processing of the variables to explain structured variance and reduces dimensionality by compressing the data. It is a superior tool for exploratory data analysis and it is one of the bases for discriminating, classifying, and identifying samples during multivariate analysis. Variable reduction is also possible with PCA using process monitoring to get a virtual analysis of variance [52,53]. Besides scores and loadings, PCA can also be presented as a biplot, a two dimensional scattered plot that offers information derivable from both loadings and scores plots in a single chart. The PCA biplot of the two main principal components PC1 and PC2 (Figure 10A) for MetaboloAnalyst 3.0 software showed two Slovak honeys (HA and HC) and two South African honeys (HG and HH) that were to be categorised in the same cluster. Apart from HI from Zambia and HD from South Africa belonging to distinct groups, the remaining honeys from Slovakia (HB), South Africa (HE and HF), and Zambia (HJ) were discriminated into the same group by certain chemical markers. The results of the PCA score plot confirm these groupings as shown in the explained variance in the brackets (Figure 10C).
The PLS-DA of the binned and normalised 1H-NMR dataset of HA-HJ was carried out to extract linear combination of the original variables using regression techniques in order to predict the class membership of the variables. PLS-DA is a supervised method that can be used for classification and feature selection of the variables, using cross-validation, to select an optimal number of components for classification [54]. The results of variable importance in projection (VIP) of the relevant chemical shifts of the discriminating compounds as identified by PLS-DA with the colored boxes are presented in Figure 10B, showing the relative concentrations of the corresponding metabolites in African (AF) and Slovakian (SK) honeys. VIP is a weighted sum of squares of the PLS loadings with reference to the amount of explained Y-variation in each dimension, and VIP scores are usually calculated for each component. Figure 10B showed certain compounds with the highest VIP values at various concentrations that can be used to discriminate the honeys into clusters or groups. The results also revealed that Slovakian honeys contain two chemical markers with high VIP values and high concentrations, namely methylgloxal resonating at 2.25 ppm and another compound resonating at 1.80 ppm (Figure 3 and Figure 10B). Other markers in honeys from Slovakia with relatively high concentrations and VIP values include compounds resonating at 2.17, 2.00, 1.52, and 1.48 ppm (Figure 2, Figure 3 and Figure 10B). Similarly, the African honeys contain nine chemical markers with relatively high concentrations compared to the Slovakian honeys, including compounds resonating at 6.84, 0.96, 0.92, 6.79, 6.87, 6.59, 6.75, and 6.63 ppm, and they are arranged in the order of decreasing VIP values. These results further showed that compounds of relevance in discriminating between honeys from South Africa, Zambia, and Slovakia are present in relatively very low concentrations compared to the major components of honeys, particularly the four reference sugars (i.e., glucose, fructose, maltose, and sucrose). Hence, further studies are necessary to identify and quantify the phytochemical constituents of these honeys that are present both in high and low concentrations using titrimetric, chemical, and spectroscopical methods.
We also performed the Orthogonal-Orthogonal Projections to Latent Structures Discriminant Analysis (OPLS-DA). This is a supervised modeling method and a powerful tool for dimensions reduction and identification of spectral features for cluster separation, and it makes models less complex and more meaningful than PLS-DA. OPLS-DA may be used instead of PLS-DA, arising from its ability to discriminate between variations in the normalised 1H-NMR dataset of HA-HJ that are important for predicting clustering and variations irrelevant to predicting groupings. The results of the OPLS-DA score plot (Figure 10A,C) successfully grouped the honeys from Slovakia and Africa into clusters, corroborating the results of the PCA and biplot scores.
Further analyses were carried out with MetaboloAnalyst 3.0 software to examine the correlation between the honeys and the major sugars (i.e., glucose, fructose, maltose, and sucrose) in the honeys, and to determine the discrimination patterns among the HA-HJ using the these sugars as the reference standards (Figure 11A,B). Hierarchical cluster analysis was performed using average clustering algorithm, centroids option was used for the observations, and the distance was measured using Euclidean. The dendrogram (Figure 11A) and the PLS-DA score plot (Figure 11B) both showed two major clusters, including the first cluster comprising two Slovakia honeys (HA & HC) and two South Africa honeys (HG & HH). The remaining honeys were discriminated into the second cluster along with sucrose. The latter cluster shows that the Slovakian honey HB, three South African honeys (HD-HF), and the two Zambian honeys (HI & HJ) contain relatively higher levels of sucrose compared to honeys in the first cluster. If these values, along with other sugars and chemical markers in honey, are within the recommended limits, it suggests that honeys in the second group are of better quality. However, if the levels of sucrose in the second cluster are higher than the recommended limit, possible adulteration may be suspected either by direct addition of rice syrup, invert sugar, or corn syrup, or by indirect adulteration by feeding bees with sucrose by the beekeepers.

3. Methods

3.1. Samples and Chemicals

A total of ten honey samples were used for the study, representing Slovakia (3: HA-HC), South Africa (5: HD-HH), and Zambia (2: HI & HJ). The South African and Slovak honeys were purchased from the supermarket, while Dr. Cambray Garth of Makana Meadery, Grahamstown, South Africa obtained the Zambian honeys directly from the beekeepers. All chemicals and standards (fructose, glucose, maltose, and sucrose) that were used to qualify the major compounds present in the honey samples were of high analytical purity. Deuterium oxide (99.9 atom % D) was purchased from Sigma-Aldrich, Johannesburg, South Africa.

3.2. pH

The method described by de Moraes and Teixeira [55] was used. Each honey (6 g) was suspended in distilled water (45 mL) and homogenised on a shaker (Already Enterprises Inc., Taiwan) at 200 rpm at room temperature to obtain a 13.3% (w/v) solution. Thereafter, the pH meter was calibrated using buffer solutions with pH values of 7.0 (Minema® B7070) and 4.0 (Minema® B6760), and the pH of the honey solutions were measured in triplicates [55].

3.3. Electrical Conductivity

The electrical conductivity was measured using a portable Electrical conductivity (EC) meter. A 13.3% (w/v) solution of each honey was prepared by dispersing 6 g of honey in distilled water (45 mL) and homogenised on a shaker (Already Enterprises Inc., Taiwan) at 200 rpm at room temperature. The EC meter was calibrated using a conductivity standard 1415 μS/cm buffer (Minema® 1413 uSIEMENS/cm), and the EC of the honey solutions were measured in triplicates [56,57].

3.4. Moisture Content

The procedure described by Mairaj et al. [58] was adapted and used to determine the moisture contents (%) of the honeys in current studies. Crucibles were placed in an oven at 55 °C for 30 min and cooled to room temperature in a desiccator. About 2 g of each honey was weighed into the crucible in triplicate, and the actual weight of the honey was calculated. Then, the honeys were heated at 100 °C for 18 h in an oven and cooled in a desiccator to the room temperature, and the weight of the residual honey was determined using (1) equation below.
Moisture   content   ( % ) = Weight   of   fresh   honey weight   of   dry   honey Weight   of   fresh   honey = w 2 w 3 w 2 w 1
where: w1 = weight of crucible, w2 = weight of crucible & fresh honey, w3 = weight of crucible & dry honey.

3.5. Sample Preparation and NMR Data Pre-Treatment

The honey samples were homogenised at 200 rpm for five minutes on a shaker (Already Enterprises Inc., Taiwan) at room temperature before sampling to ensure a homogenous mix, and 50 µL of each sample was dissolved in 350 µL of Deuterium oxide (D2O, 99.9 atom % D, Aldrich) and then transferred into NMR tube with 5 mm outer diameter. The 1H-NMR spectra of the honeys in D2O were acquired at 300 K on Bruker AvanceTM III HD 400 MHz spectrometer, TopSpin 3.5 pls (Bruker BioSpin, Rheinstetten, Germany) with a SampleXPress autosampler (Bruker BioSpin, Rheinstetten, Germany) using a PULprog Zg30 at 300 K. The spectra were measured at the frequency of 400.13 Hz by taking 16 scans with 2 prior dummy scans, spectra width (SW) of 20.0254 ppm (or 8016.821 Hz), receiver gain of 32, time, and frequency domain of 32767 and 262144 points, respectively, as well as pulse width of 10.5 μs, relaxation delay of 1.0 s, and acquisition time of 4.096 s. The NMR chemical shifts are reported in ppm, and the spectra were calibrated with residual water signal (δ: 4.790 ppm) before aligning the spectra to compensate for the intrinsic acidity of different honey sample.
The 1H-NMR spectra of the four references (d-glucose, d-Fructose, maltose, and sucrose in D2O) were recorded and used to determine the response factor of the honeys. Zones without useful information beyond 10.5 ppm and before 0 ppm were removed. The proton signals were standardised using automatic positive peak picking and interactive default options, and both known solvents and impurities were auto-classified (hidden). The 1H-NMR spectrum of each of the honey samples HA-HJ and the four reference sugars was processed separately using Mnova 12 (Mestrelab Research S.L., Santiago de Compostela, Spain). Each spectrum was zero fill to a high value of 512K using Toeplitz method with base point and coefficient values of 32743 and 24, respectively. Then, the signals were normalised with the largest peak scale set at 100 in order to make more meaningful comparisons between the samples and smoothed along f1 using auto-directed Whittaker smoother with a smooth factor of 145. This was followed by a series of processing, including Fourier transformation along t1 using Swap Halved (quadrature) approach, automatic phase correction by metabolomics algorithm, and baseline correction using full auto-Bernstein polynomials of degree 5. Positive peak peaking option was used, involving a noise factor of 250, and a maximum number 1000 peaks with a parabolic interpolation and interactive option. The 1H-NMR signals were integrated manually for each spectrum and normalised to make variables more comparable. Thereafter, the HA-HJ spectra were superimposed, aligned, and binned to remove the problem of chemical shift variations with width of each chemical shift region of 10.50–0.00 ppm range set at 0.04 ppm. This approach was employed to solve complications arising from the dependence of the chemical shifts on temperature, pH, and ionic strength of the samples that can influence the electronic environment and the fingerprinting datasets of the metabolites acquired from NMR spectrometers [59]. Then, the stacked and binned spectra in the range of 0–10.5 ppm were segmented into four regions (i.e., 0.75–1.50, 3.00–1.50, 5.30–3.20, and 9.60–7.20 ppm), zoomed, and compared with literature reports. The responses of the four sugars were used as the standards during statistical processing of the data. The OH signals of the sugars in HA-HJ and reference sugars at 4.70–5.00 ppm have been completely exchanged with D2O, and were excluded from the analysis to get rid of the residual water peak [26,60,61,62].

3.6. Multivariate Data Analysis

The Unscrambler® X version 10.5 (CAMO Software AS., Oslo, Norway), Simca 15 (Umetrics, Umeå, Sweden), MetaboloAnalyst 3.0, and Mnova 12 NMR (Mestrelab Research S.L., Santiago de Compostela, Spain) software were used for all chemometric treatments, including visualisation, processing, analysis, and reporting. Raw 1H-NMR spectra were superimposed and binned using Mnova 12, saved as ASCII text files (*.txt), then imported to Microsoft Excel and saved as Excel 97-2003 workbook (*.xls) or CSV comma (*.csv) files. Comma delimited or separator files of CVS and Excel 97-2003 workbook files were imported to Simca 15 and other software for multivariate analysis.
Typical general procedures that were carried out on the datasets for each part of the software before multivariate analysis of the binned and integrated 1H-NMR data are explained for MetaboloAnalyst 3.0 software. These include data check for missing values, data filtering using mean intensity value, quantile normalization (for HA-HJ dataset) or normalisation by a pooled sample from the reference sugar group (for HA-HJ & reference sugars dataset) using Log 2 transformation and Pareto scaling in both cases, and cross-validation of the normalised data using LOOCV method with the performance measure set at Q2. Cross-validation procedure was further cross-checked using Simca 15 software for HA-HJ and the reference sugars in order to ascertain the reliability of the model.

4. Conclusions

The physicochemical characteristics and 1H-NMR profiling of ten selected honeys from South Africa (five), Slovakia (three), and Zambia (two) were examined, and the spectroscopy data were analysed using Chemometric statistical tools. The values for the pH (3.75–4.38), electrical conductivity (99–659 µS/cm), and moisture contents (14.2–17.7%) are within the recommended limits. The 1H-NMR profiling of various chemical shift (δ) regions clearly showed that each honey has a diagnostic fingerprint with specific chemical markers that can be used for identification, detection of adulteration, and, ultimately, for quality control purpose. Multivariate analysis of the normalised and binned data using principal component analysis (PCA) and partial linear square discriminant analysis (PLS-DA) showed linear correlation and successively categorised the honeys into two distinct clusters. Two of the Slovak honeys (HA and HC) contain similar metabolites as HG and HH from South Africa. These four honeys exhibited lower levels of sucrose relative to the remaining honeys, indicating better quality provided if the sucrose is within the recommended limit. The second group includes the two Zambian honeys (HI and HJ), HB from Slovakia, and three South Africa honeys (HD, HE, and HF) with closer correlation in the levels of four sugars, particularly sucrose, glucose, and maltose. If the concentrations of the chemical constituents of the latter group are within the acceptable limits, it may suggest that these honeys are of better quality than the first group. In summary, the honeys have been categorised into two chemically related groups using 1H-NMR spectroscopy in combination with chemometrics, indicating possibly two different botanical or floral origins in the selected honeys from South Africa, Slovakia and Zambia.

Acknowledgments

The authors thank Rhodes University for providing the facilities, postdoctoral research fellowship (for EOO), and generous financial support for this project.

Author Contributions

R.T. proposed the work and E.O.O. coordinated all the work. R.T. and G.C. collected the honeys from Slovakia and Zambia, respectively. E.O.O. performed the experiments, evaluated and analysed the data, and wrote the manuscript. Also, R.T. and G.C. contributed to the analysis of the data. All authors read and approved the final version of the manuscript.

Conflicts of Interest

The authors do not have any conflict of interest concerning the present work.

References

  1. Meekings, G.; Palomar, G.; Sarquis, M.A.; Trongé, A.F.; Nimo, M.; Ros, P.; Woodwar, P. (Eds.) Report of the Seventh Session of the Codex Committee on Sugars; ALINORM 01/25; FAO/WHO Codex Alimenatarius Commission: Geneva, Switzerland, 2001; pp. 1–33. [Google Scholar]
  2. European Commission. Council Directive 2001/110/EC of 20 December 2001 Relating to Honey; The Council of the European Union: Brussels, Belgium, 2002; p. 47. [Google Scholar]
  3. Jamróz, M.K.; Paradowska, K.; Zawada, K.; Makarova, K.; Kaźmierski, S.; Wawer, I. 1H- and 13C-NMR-based sugar profiling with chemometric analysis and antioxidant activity of herbhoneys and honeys. J. Sci. Food Agric. 2014, 94, 246–255. [Google Scholar] [CrossRef] [PubMed]
  4. Nepi, M.; Pacini, E. Nectar production and presentation. In Nectaries and Nectar; Nicolson, S.W., Nepi, M., Pacini, E., Eds.; Springer: Dordrecht, The Netherlands, 2007; pp. 215–264. [Google Scholar]
  5. Soria, A.C.; González, M.; De Lorenzo, C.; Martínez-Castro, I.; Sanz, J. Characterization of artisanal honeys from Madrid (Central Spain) on the basis of their melissopalynological, physicochemical and volatile composition data. Food Chem. 2004, 85, 121–130. [Google Scholar] [CrossRef]
  6. Meda, A.; Lamien, C.E.; Romito, M.; Millogo, J.; Nacoulma, O.G. Determination of the total phenolic, flavonoid and proline contents in Burkina Fasan honey, as well as their radical scavenging activity. Food Chem. 2005, 91, 571–577. [Google Scholar] [CrossRef]
  7. Codex Alimentarius Commission. Revised Codex Standard for Honey Codex Stan 12-1981, Rev. 1 (1987), Rev. 2 (2001). Codex Stand. 1981, 12, 1–7. Available online: http://teca.fao.org/sites/default/files/resources/Annex%20A%20Codex%20Alimentarius%20Honey%20Standard.pdf (accessed on 24 January 2018).
  8. Felsner, M.L.; Cano, C.B.; Bruns, R.E.; Watanabe, H.M.; Almeida-Muradian, L.B.; Matos, J.R. Characterization of monofloral honeys by ash contents through a hierarchical design. J. Food Compos. Anal. 2004, 17, 737–747. [Google Scholar] [CrossRef]
  9. Meda, A.; Lamien, C.E.; Millogo, J.; Romito, M.; Nacoulma, O.G. Physicochemical analyses of Burkina Fasan honey. Acta Vet. Brno 2005, 74, 147–152. [Google Scholar] [CrossRef]
  10. Picqué, C. Council Directive 2001/110/EC of 20 December 2001 Relating to Honey. Official Journal of the European Communities; The Council of the European Union: Brussels, Belgium, 2002; pp. 19–26. [Google Scholar]
  11. Bogdanov, S.; Ruoff, K.; Oddo, L.P. Physico-chemical methods for the characterisation of unifloral honeys: A review. Apidologie 2004, 35, 4–17. [Google Scholar] [CrossRef]
  12. Sereia, M.J.; Março, P.H.; Perdoncini, M.R.G.; Parpinelli, R.S.; de Lima, E.G.; Anjo, F.A. Techniques for the Evaluation of Physicochemical Quality and Bioactive Compounds in Honey; Anjo, F., Ed.; IN TECH: London, UK, 2017; pp. 194–214. [Google Scholar] [CrossRef]
  13. Lianda, R.L.P.; Sant’ana, L.D.O.; Echevarria, A.; Castro, R.N. Antioxidant activity and phenolic composition of Brazilian honeys and their extracts. J. Braz. Chem. Soc. 2012, 23, 618–627. [Google Scholar] [CrossRef]
  14. Mohapatra, D.P.; Thakur, V.; Brar, S.K. Antibacterial efficacy of raw and processed honey. Biotechnol. Res. Int. 2011, 1–6. [Google Scholar] [CrossRef] [PubMed]
  15. Rahman, S.; Salehin, F.; Iqbal, A. Antibacterial efficacy of raw and commercially available honey. Afr. J. Biotechnol. 2011, 10, 11269–11272. [Google Scholar]
  16. Bogdanov, S. Nature and origin of the antibacterial substances in honey. LWT-Food Sci. Technol. 1997, 30, 748–753. [Google Scholar] [CrossRef]
  17. Manyi-Loh, C.E.; Clarke, A.M.; Munzhelele, T.; Green, E.; Mkwetshana, N.F.; Ndip, R.N. Selected South African honeys and their extracts possess in vitro anti-Helicobacter pylori activity. Arch. Med. Res. 2010, 41, 324–331. [Google Scholar] [CrossRef] [PubMed]
  18. McLoone, P.; Warnock, M.; Fyfe, L. Honey: A realistic antimicrobial for disorders of the skin. J. Microbiol. Immunol. Infect. 2016, 49, 161–167. [Google Scholar] [CrossRef] [PubMed]
  19. Syazana, M.S.N.; Halim, A.; Gan, S.; Shamsuddin, S. Antiproliferative effect of methanolic extraction of tualang honey on human keloid fibroblasts. BMC Complement. Altern. Med. 2011, 11, 82. [Google Scholar] [CrossRef] [PubMed]
  20. Oršolić, N.; Terzić, S.; Šver, L.; Bašić, I. Honey-bee products in prevention and/or therapy of murine transplantable tumours. J. Sci. Food Agric. 2005, 85, 363–370. [Google Scholar] [CrossRef]
  21. Al-Waili, N.S. Natural honey lowers plasma glucose, C-reactive protein, homocysteine, and blood lipids in healthy, diabetic, and hyperlipidemic subjects: Comparison with dextrose and sucrose. J. Med. Food 2004, 7, 100–107. [Google Scholar] [CrossRef] [PubMed]
  22. Spiteri, M.; Rogers, K.M.; Jamin, E.; Thomas, F.; Guyader, S.; Lees, M.; Rutledge, D.N. Combination of 1H-NMR and chemometrics to discriminate manuka honey from other floral honey types from Oceania. Food Chem. 2017, 217, 766–772. [Google Scholar] [CrossRef] [PubMed]
  23. Guler, A.; Bakan, A.; Nisbet, C.; Yavuz, O. Determination of important biochemical properties of honey to discriminate pure and adulterated honey with sucrose (Saccharum officinarum L.) syrup. Food Chem. 2007, 105, 1119–1125. [Google Scholar] [CrossRef]
  24. Bertoncelj, J.; Doberšek, U.; Jamnik, M.; Golob, T. Evaluation of the phenolic content, antioxidant activity and colour of Slovenian honey. Food Chem. 2007, 105, 822–828. [Google Scholar] [CrossRef]
  25. Cotte, J.F.; Casabianca, H.; Chardon, S.; Lheritier, J.; Grenier-Loustalot, M.F. Application of carbohydrate analysis to verify honey authenticity. J. Chromatogr. A 2003, 1021, 145–155. [Google Scholar] [CrossRef] [PubMed]
  26. Padovan, G.J.; De Jong, D.; Rodrigues, L.P.; Marchini, J.S. Detection of adulteration of commercial honey samples by the 13C/12C isotopic ratio. Food Chem. 2003, 82, 633–636. [Google Scholar] [CrossRef]
  27. European Comission. European Commission Council Directive 2001/110/EC relating to honey. Off. J. Eur. Commun. 2002, L10, 47–52. [Google Scholar]
  28. Jánošík, M. (Ed.) Slovak Beekeepers Association (SZV) and Slovak Federation of Beekeepers (SVS) Program. (2004). [Annex II to Regulation (EC) No.917/2004; Statistical Office of the Slovak Republic: Bratislava, Slovakia; Available online: http://213.30.17.29/MA/apicultura/PAN_UE/Docs/SK_AGRI-2013-60986-00-03-EN-TRA-00.pdf (accessed on 24 January 2018).
  29. Zappalà, M.; Fallico, B.; Arena, E.; Verzera, A. Methods for the determination of HMF in honey: A comparison. Food Control. 2005, 16, 273–277. [Google Scholar] [CrossRef]
  30. Gok, S.; Severcan, M.; Goormaghtigh, E.; Kandemir, I.; Severcan, F. Differentiation of Anatolian honey samples from different botanical origins by ATR-FTIR spectroscopy using multivariate analysis. Food Chem. 2015, 170, 234–240. [Google Scholar] [CrossRef] [PubMed]
  31. Elflein, L.; Raezke, K.P. Improved detection of honey adulteration by measuring differences between 13C/12C stable carbon isotope ratios of protein and sugar compounds with a combination of elemental analyzer-isotope ratio mass spectrometry and liquid chromatography-isotope ra. Apidologie 2008, 39, 574–587. [Google Scholar] [CrossRef]
  32. Cole, P.; Vasiliou, S.; Mormeneo, D.; Rosa, E. Medicinal chemistry selections from the 237th American chemical society national meeting & exposition. Drugs Future 2009, 34, 509–520. [Google Scholar]
  33. Schievano, E.; Stocchero, M.; Morelato, E.; Facchin, C.; Mammi, S. An NMR-based metabolomic approach to identify the botanical origin of honey. Metabolomics 2012, 8, 679–690. [Google Scholar] [CrossRef]
  34. Morgan, M. Experts Reveal That Three Times More Jars of Healing Manuka Are Sold around the World Than Being Produced in New Zealand. Is Your Superfood Honey FAKE? 2015. Available online: http://www.dailymail.co.uk/femail/article-3066381/Issuperfood-honey-FAKE-jars-manuka-sold-world-produced-New-Zealand.html (accessed on 24 January 2018).
  35. Adams, C.J.; Boult, C.H.; Deadman, B.J.; Farr, J.M.; Grainger, M.N.C.; Manley-Harris, M.; Snow, M.J. Isolation by HPLC and characterisation of the bioactive fraction of New Zealand manuka (Leptospermum scoparium) honey. Carbohydr. Res. 2008, 343, 651–659. [Google Scholar] [CrossRef] [PubMed]
  36. Rogers, K.M.; Grainger, M.; Manley-Harris, M. The unique manuka effect: Why New Zealand manuka honey fails the AOAC 998.12 C-4 sugar method. J. Agric. Food Chem. 2014, 62, 2615–2622. [Google Scholar] [CrossRef] [PubMed]
  37. Bogdanov, S.; Martin, P.; Lüllmann, C. Harmonised methods of the European Honey Commission. Apidologie 1997, 28, 1–59. [Google Scholar]
  38. Rattanathanalerk, M.; Chlewchan, N.; Srichum-Poung, W. Effects of thermo processing on the duality loss of pineapple juice. J. Food Eng. 2005, 66, 259–265. [Google Scholar] [CrossRef]
  39. Adenekan, M.O.; Amusa, N.A.; Lawal, A.O.; Okpeze, V.E. Physico-chemical and microbiological properties of honey samples obtained from Ibadan. J. Microbiol. Antimicrobial. 2010, 2, 100–104. [Google Scholar]
  40. Muruke, M.H. Assessment of quality of Tanzanian honey based on physicochemical properties. Food Sci. Qual. Manag. 2014, 3, 61–72. Available online: http://citeseerx.ist.psu.edu/viewdoc/download?doi=10.1.1.833.3399&rep=rep1&type=pdf (accessed on 24 January 2018).
  41. Singh, N.; Bath, P.K. Quality evaluation of different types of Indian honey. Food Chem. 1997, 58, 129–133. [Google Scholar] [CrossRef]
  42. Terrab, A.; Dıez, M.J.; Heredia, F.J. Palynological, physicochemical and colour characterization of Moroccan honeys: I. River red gum (Eucalyptus camaldulensis Dehnh) honey. Int. J. Food Sci. Technol. 2003, 38, 379–386. [Google Scholar] [CrossRef]
  43. Kosir, I.J.; Kidric, J. Identification of amino acids in wines by one- and two-dimensional nuclear magnetic resonance spectroscopy. J. Agric. Food Chem. 2001, 49, 50–56. [Google Scholar] [CrossRef] [PubMed]
  44. Vlahov, G.; Kiprono Chepkwony, P.; Ndalut, P.K. 13C-NMR characterization of triacylglycerols of Moringa oleifera seed oil: An “oleic-vaccenic acid” oil. J. Agric. Food Chem. 2002, 50, 970–975. [Google Scholar] [CrossRef] [PubMed]
  45. Lolli, M.; Bertelli, D.; Plessi, M.; Sabatini, A.G.; Restani, C. Classification of Italian honeys by 2D HR-NMR. J. Agric. Food Chem. 2008, 56, 1298–1304. [Google Scholar] [CrossRef] [PubMed]
  46. Consonni, R.; Cagliani, L.R.; Cogliati, C. NMR characterization of saccharides in Italian honeys of different floral sources. J. Agric. Food Chem. 2012, 60, 4526–4534. [Google Scholar] [CrossRef] [PubMed]
  47. Bertelli, D.; Lolli, M.; Papotti, G.; Bortolotti, L.; Serra, G.; Plessi, M. Detection of honey adulteration by sugar syrups using one-dimensional and two-dimensional high-resolution nuclear magnetic resonance. J. Agric. Food Chem. 2010, 58, 8495–8501. [Google Scholar] [CrossRef] [PubMed]
  48. Kortesniemi, M.; Slupsky, C.M.; Ollikka, T.; Kauko, L.; Spevacek, A.R.; Sjövall, O.; Yang, B.; Kallio, H. NMR profiling clarifies the characterization of Finnish honeys of different botanical origins. Food Res. Int. 2016, 86, 83–92. [Google Scholar] [CrossRef]
  49. Boffo, E.F.; Tavares, L.A.; Tobias, A.C.T.; Ferreira, M.M.C.; Ferreira, A.G. Identification of components of Brazilian honey by 1H-NMR and classification of its botanical origin by chemometric methods. Food Sci. Tech. 2012, 49, 55–63. [Google Scholar] [CrossRef]
  50. Dieterle, F.; Ross, A.; Schlotterbeck, G.; Senn, H. Probabilistic quotient normalization as robust method to account for dilution of complex biological mixtures. Application in 1H-NMR metabonomics. Anal. Chem. 2006, 78, 4281–4290. [Google Scholar] [CrossRef] [PubMed]
  51. Schievano, E.; Morelato, E.; Facchin, C.; Mammi, S. Characterization of markers of botanical origin and other compounds extracted from unifloral honeys. J. Agric. Food Chem. 2013, 61, 1747–1755. [Google Scholar] [CrossRef] [PubMed]
  52. Spiteri, M.; Jamin, E.; Thomas, F.; Rebours, A.; Lees, M.; Rogers, K.M.; Rutledge, D.N. Fast and global authenticity screening of honey using 1H-NMR profiling. Food Chem. 2015, 189, 60–66. [Google Scholar] [CrossRef] [PubMed]
  53. Schievano, E.; Peggion, E.; Mammi, S. 1H nuclear magnetic resonance spectra of chloroform extracts of honey for chemometric determination of its botanical origin. J. Agric. Food Chem. 2010, 58, 57–65. [Google Scholar] [CrossRef] [PubMed]
  54. Bijlsma, S.; Bobeldijk, I.; Verheij, E.R.; Ramaker, R.; Kochhar, S.; Macdonald, I.A.; van Ommen, B.; Smilde, A.K. Large-scale human metabolomics studies: A strategy for data (pre-) processing and validation. Anal. Chem. 2006, 78, 567–574. [Google Scholar] [CrossRef] [PubMed]
  55. Hankin, L. Analysis of Honey; Bulletin 847; The Connecticut Agricultural Experiment Station: New Haven, CT, USA, 1987; pp. 1–6. Available online: http://www.ct.gov/caes/lib/caes/documents/publications/bulletins/b847.pdf (accessed on 24 January 2018).
  56. Helrich, K. Official Methods of Analysis, 15th ed.; Association of Official Analytical Chemists Inc.: Arlington, VA, USA, 1990; pp. 1028–1030. [Google Scholar]
  57. Bogdanov, S.; Lüllmann, C.; Martin, P.; Von Der Ohe, W.; Russmann, H.; Mossel, B.L.; D’Arcy, B.; Vorwohl, G.R.; Oddo, L.; Sabatini, A.G.; et al. Honey quality, methods of analysis and international regulatory standards: review of the work of the international honey commission. Bee World 1999, 80, 61–69. [Google Scholar] [CrossRef]
  58. Mairaj, G.; Akhtar, S.; Khan, A.R.; Uilah, Z.; Bibi, S.; Ali, S. Quality evaluation of different honey samples produced in Peshawar valley. Par. J. Biol. Sci. 2008, 11, 797–800. [Google Scholar]
  59. Worley, B.; Powers, R. Multivariate analysis in metabolomics. Curr. Metab. 2013, 1, 92–107. [Google Scholar]
  60. Beretta, G.; Caneva, E.; Regazzoni, L.; Bakhtyari, N.G.; Maffei Facino, R. A solid-phase extraction procedure coupled to 1H-NMR, with chemometric analysis, to seek reliable markers of the botanical origin of honey. Anal. Chim. Acta 2008, 620, 176–182. [Google Scholar] [CrossRef] [PubMed]
  61. Savorani, F.; Tomasi, G.; Engelsen, S.B. icoshift: A versatile tool for the rapid alignment of 1D-NMR spectra. J. Magn. Reson. 2010, 202, 190–202. [Google Scholar] [CrossRef] [PubMed]
  62. Mazet, V.; Carteret, C.; Brie, D.; Idier, J.; Humbert, B. Background removal from spectra by designing and minimising a non-quadratic cost function. Chemom. Intell. Lab. Syst. 2005, 76, 121–133. [Google Scholar] [CrossRef]
Sample Availability: Samples of the compounds HA-HJ and reference sugars are available from the authors.
Figure 1. Superimposed and binned full 1H-NMR spectra of honeys HA-HJ (10.5–0 ppm) in D2O, using Mnova 12 NMR software.
Molecules 23 00578 g001
Figure 2. Fingerprints of superimposed and binned 1H-NMR spectra in D2O at region 1.50–0.75 ppm, using Mnova 12 NMR software. * Variable Importance in Projection (VIP) chemical markers resonating at 0.92 and 0.96 ppm.
Molecules 23 00578 g002
Figure 3. Fingerprints of superimposed and binned 1H-NMR spectra in D2O at region 3.00–1.50 ppm, using Mnova 12 NMR software. * VIP chemical markers resonating at 1.80, 2.00, and 2.17 ppm.
Molecules 23 00578 g003
Figure 4. Fingerprints of superimposed and binned 1H-NMR spectra in D2O at region 5.30–3.20 ppm, using Mnova 12 NMR software.
Molecules 23 00578 g004
Figure 5. Fingerprints of superimposed and binned 1H-NMR spectra in D2O at region 9.60–7.20 ppm, using Mnova 12 NMR software [49].
Molecules 23 00578 g005
Figure 6. Outliers plot of U-scores vs. T-scores of the H-NMR spectra of honeys (HA-HJ) using Unscrambler® X 10.5 software.
Molecules 23 00578 g006
Figure 7. Cumulative cross-validation values for R2 and Q2 for HA-HG and the reference sugars, using Simca 15 software.
Molecules 23 00578 g007
Figure 8. Log 2 transformed normalisation of HA-HJ using Pareto scaling for MetaboloAnalyst 3.0 software.
Molecules 23 00578 g008
Figure 9. Scree plot showing the variance explained by PC1-PC8 using MetaboloAnalyst 3.0. Green line: accumulated variance. Blue line: variance by individual PC.
Molecules 23 00578 g009
Figure 10. Screen reports for HA-HJ for MetaboloAnalyst 3.0. (A) PCA biplot of PC1 vs. PC2; (B) Important chemical shifts of major compounds identified by PLS-DA with the coloured boxes indicating the relative concentrations of the corresponding metabolites in African (AF) and Slovakian (SK) honeys; (C) PCA score plot of PC1 vs. PC2, showing the explained variances in brackets; (D) OPLS-DA scores plot of all metabolite in HA-HJ.
Molecules 23 00578 g010
Figure 11. Screen reports for HA-HJ & reference sugars using MetaboloAnalyst 3.0 software. (A) Dendrogram clustering, showing the distance measured for African honeys (AF), Slovak honeys (SK), and the reference sugars (RF), using Euclidean option and complete clustering algorithm; (B) PLS-DA score plot of PC1 vs. PC2, showing the explained variances in brackets.
Molecules 23 00578 g011
Table 1. Pfund scale for determination of honey color.
ColourPfund Sacle (mm)Colour Range
Water white1 to 80.030 or less
Extra whiteMore than 8–17More than 0.030–0.060
WhiteMore than 17–34More than 0.060–0.120
Extra light amberMore than 34–50More than 0.120–0.188
Light amberMore than 50–85More than 0.188–0.440
AmberMore than 85–114More than 0.440–0.945
Dark amberMore than 114More than 0.945
Table 2. Electrical conductivity (µS/cm), moisture content (%), and pH of honeys HA-HJ.
HoneyGeographicalpHMoisture ContentElectrical Conductivity
CodeOrigin(%)×102 (µS/cm)
HASlovakia4.06 ± 0.00617.4 ± 1.954.29 ± 0.0503
HBSlovakia4.01 ± 0.01514.6 ± 0.1161.79 ± 0.0404
HCSlovakia3.75 ± 0.01517.7 ± 0.3300.99 ± 0.0503
HDSouth Africa4.01 ± 0.01515.0 ± 0.1804.66 ± 0.0252
HESouth Africa4.16 ± 0.01517.4 ± 0.2204.12 ± 0.111
HFSouth Africa4.27 ± 0.01214.4 ± 0.194.19 ± 0.105
HGSouth Africa4.07 ± 0.0114.2 ± 0.0602.17 ± 0.105
HHSouth Africa4.38 ± 0.02517.4 ± 0.1201.78 ± 0.0436
HIZambia4.29 ± 0.0115.0 ± 0.3506.46 ± 0.050
HJZambia4.29 ± 0.01216.8 ± 1.156.59 ± 0.107
Values are expressed as mean ± stand deviation in triplicates with p < 0.05.

