Enhancement of Berberine Hypoglycemic Activity by Oligomeric Proanthocyanidins

 ,
,
Abstract
:1. Introduction
2. Results
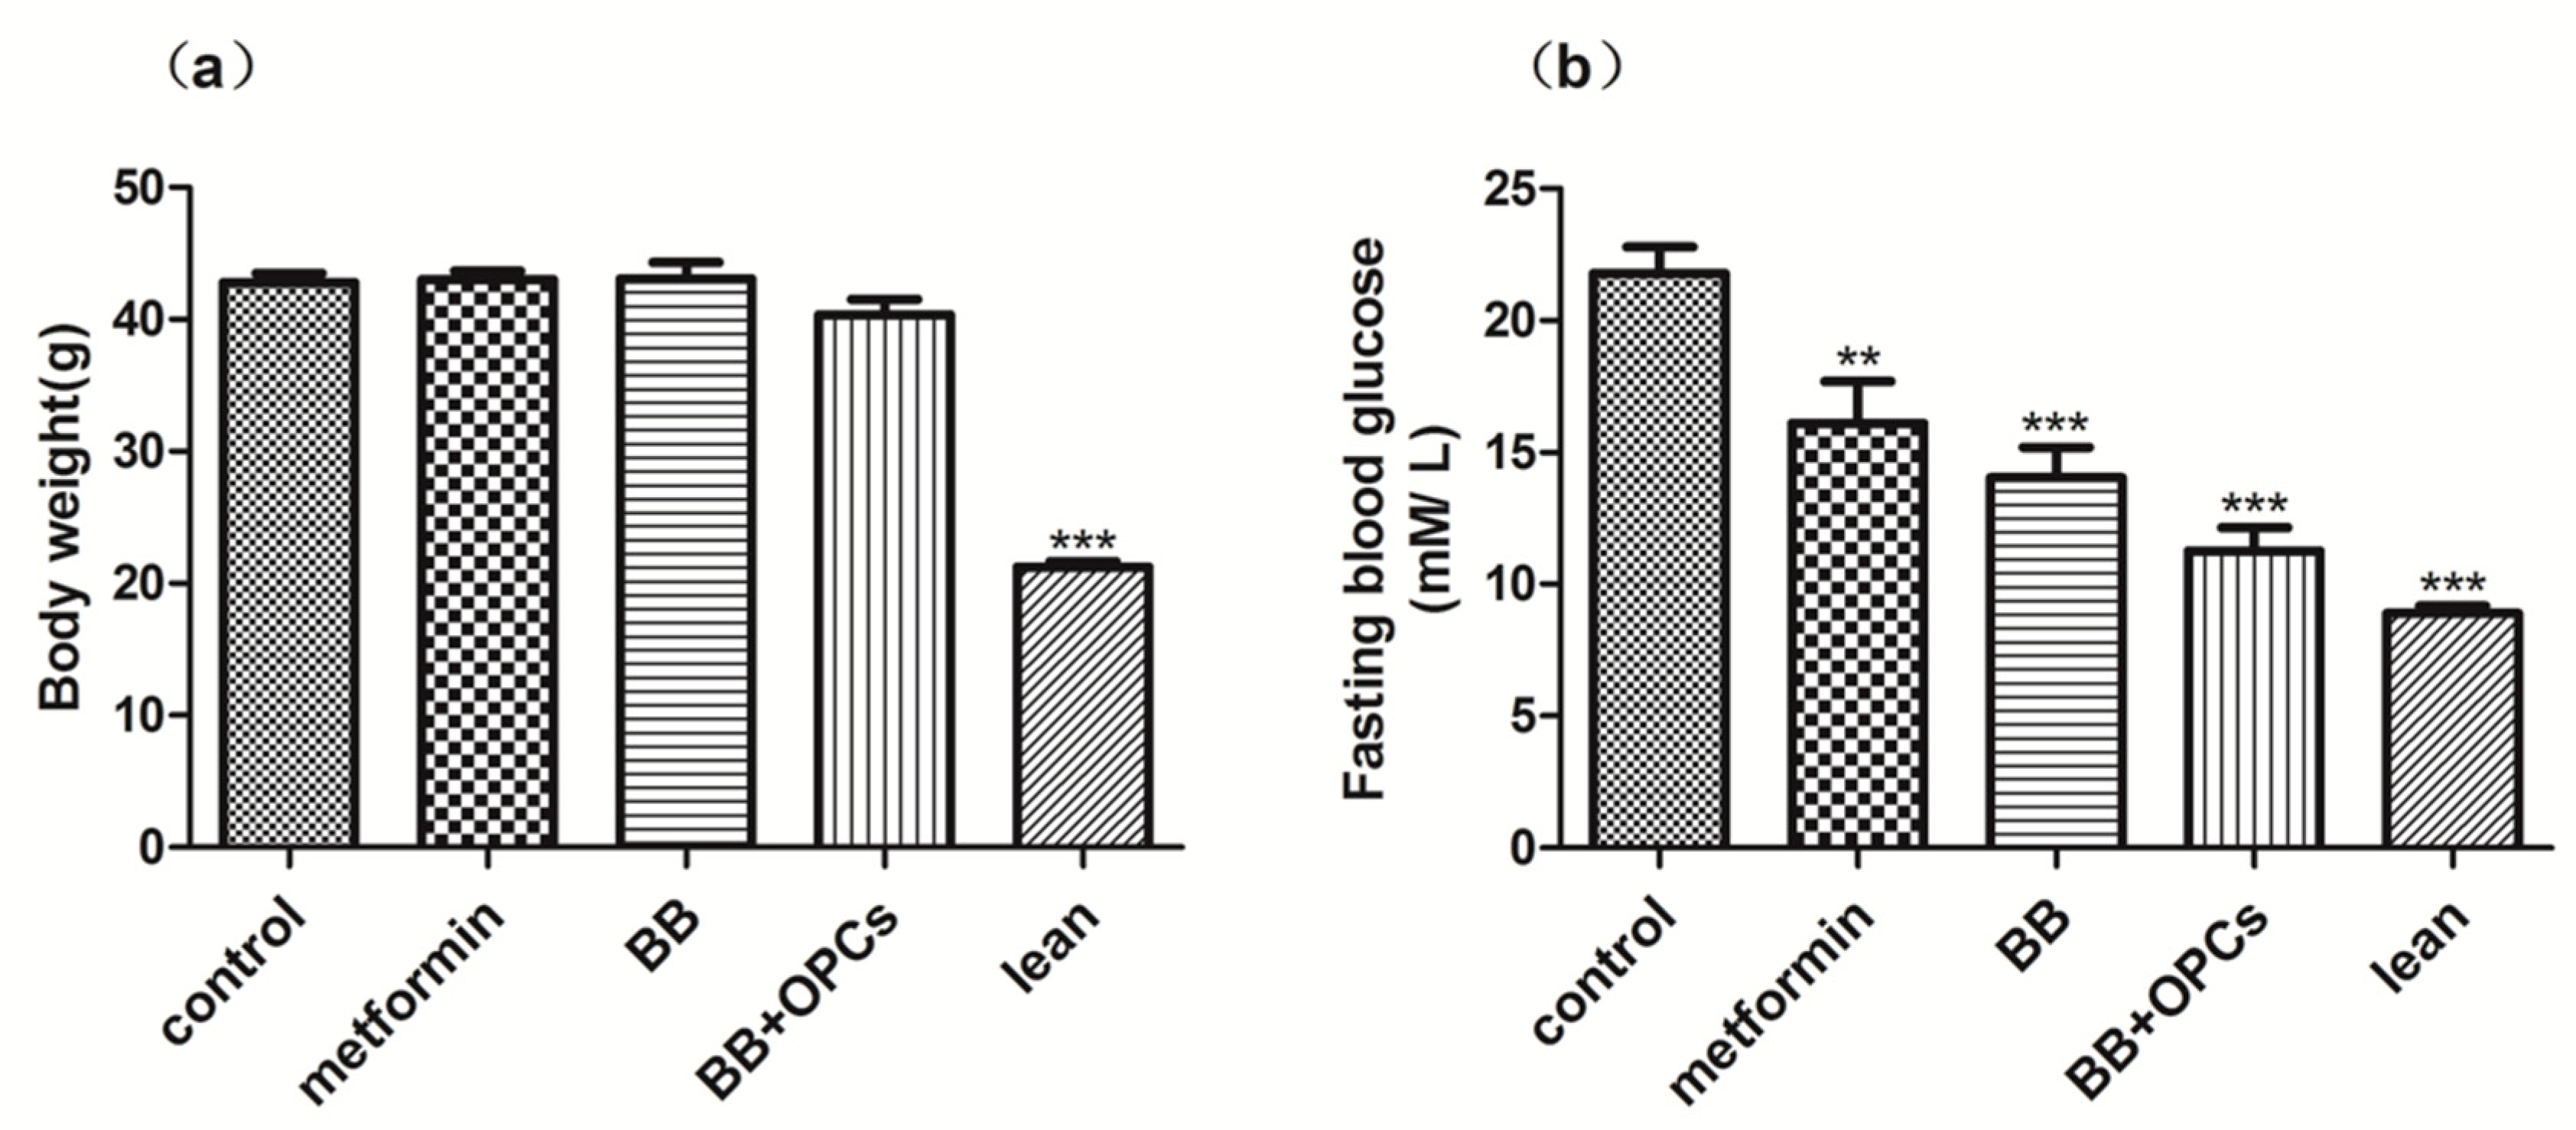
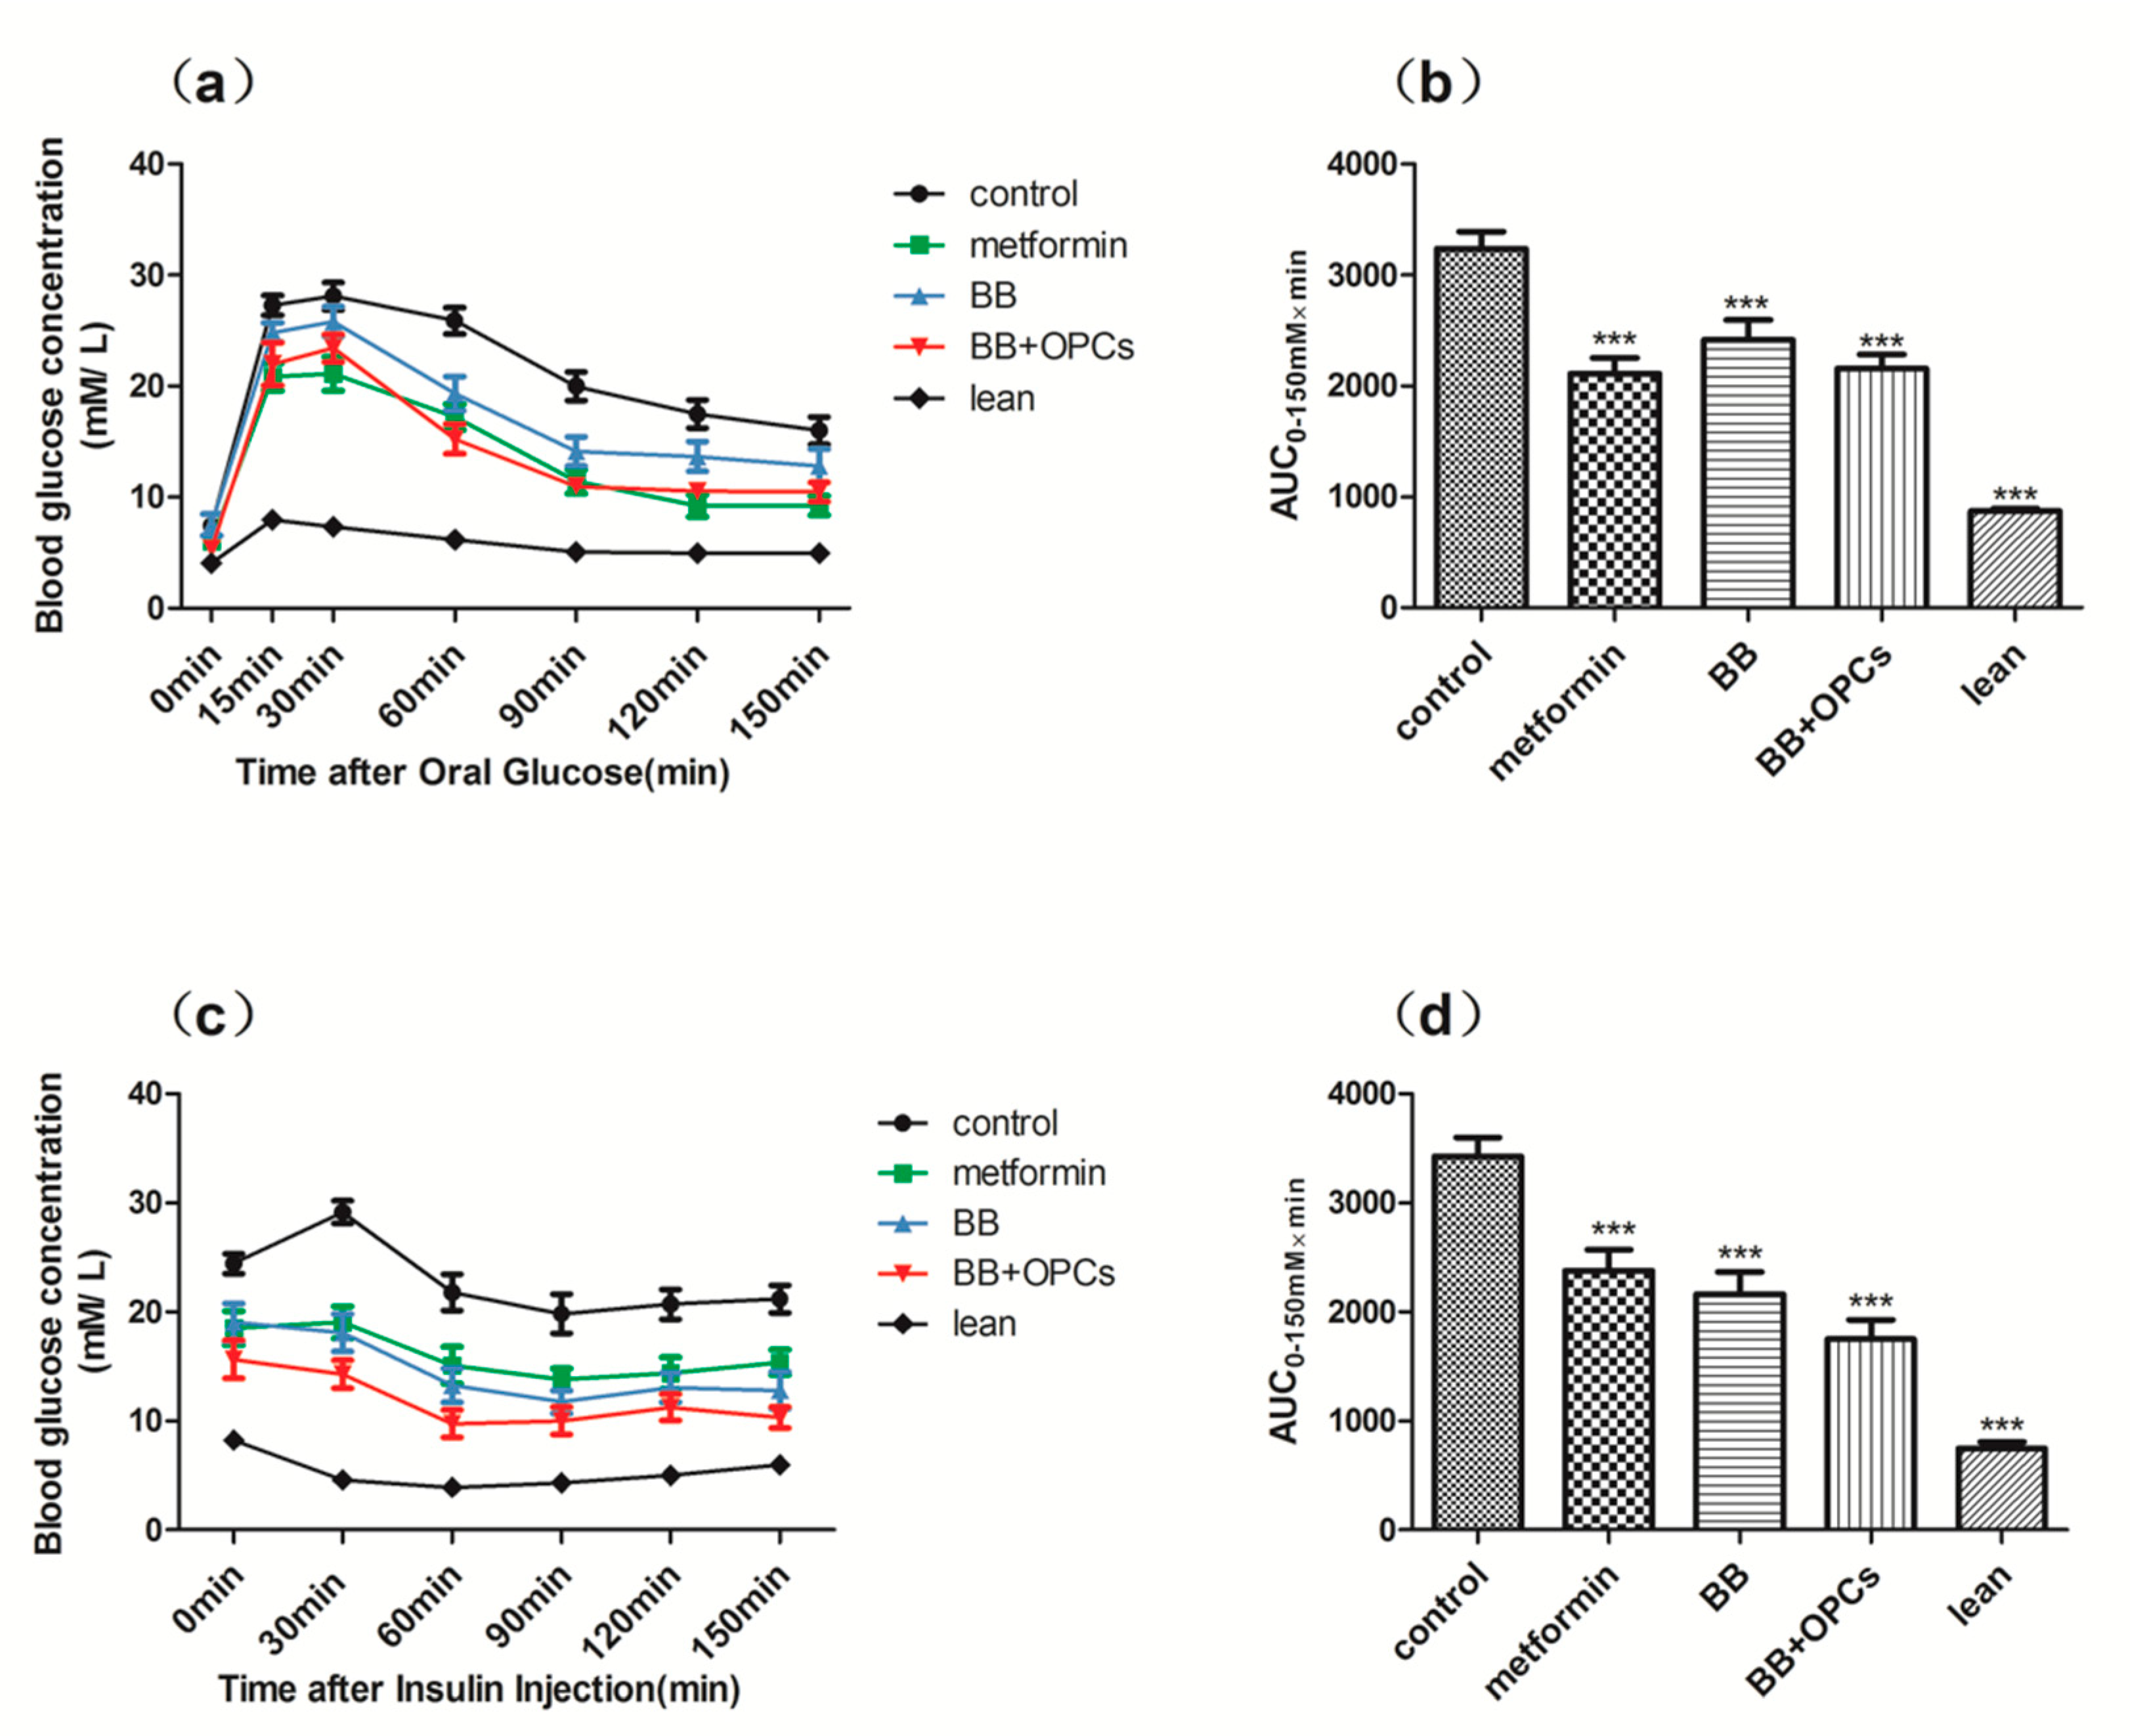
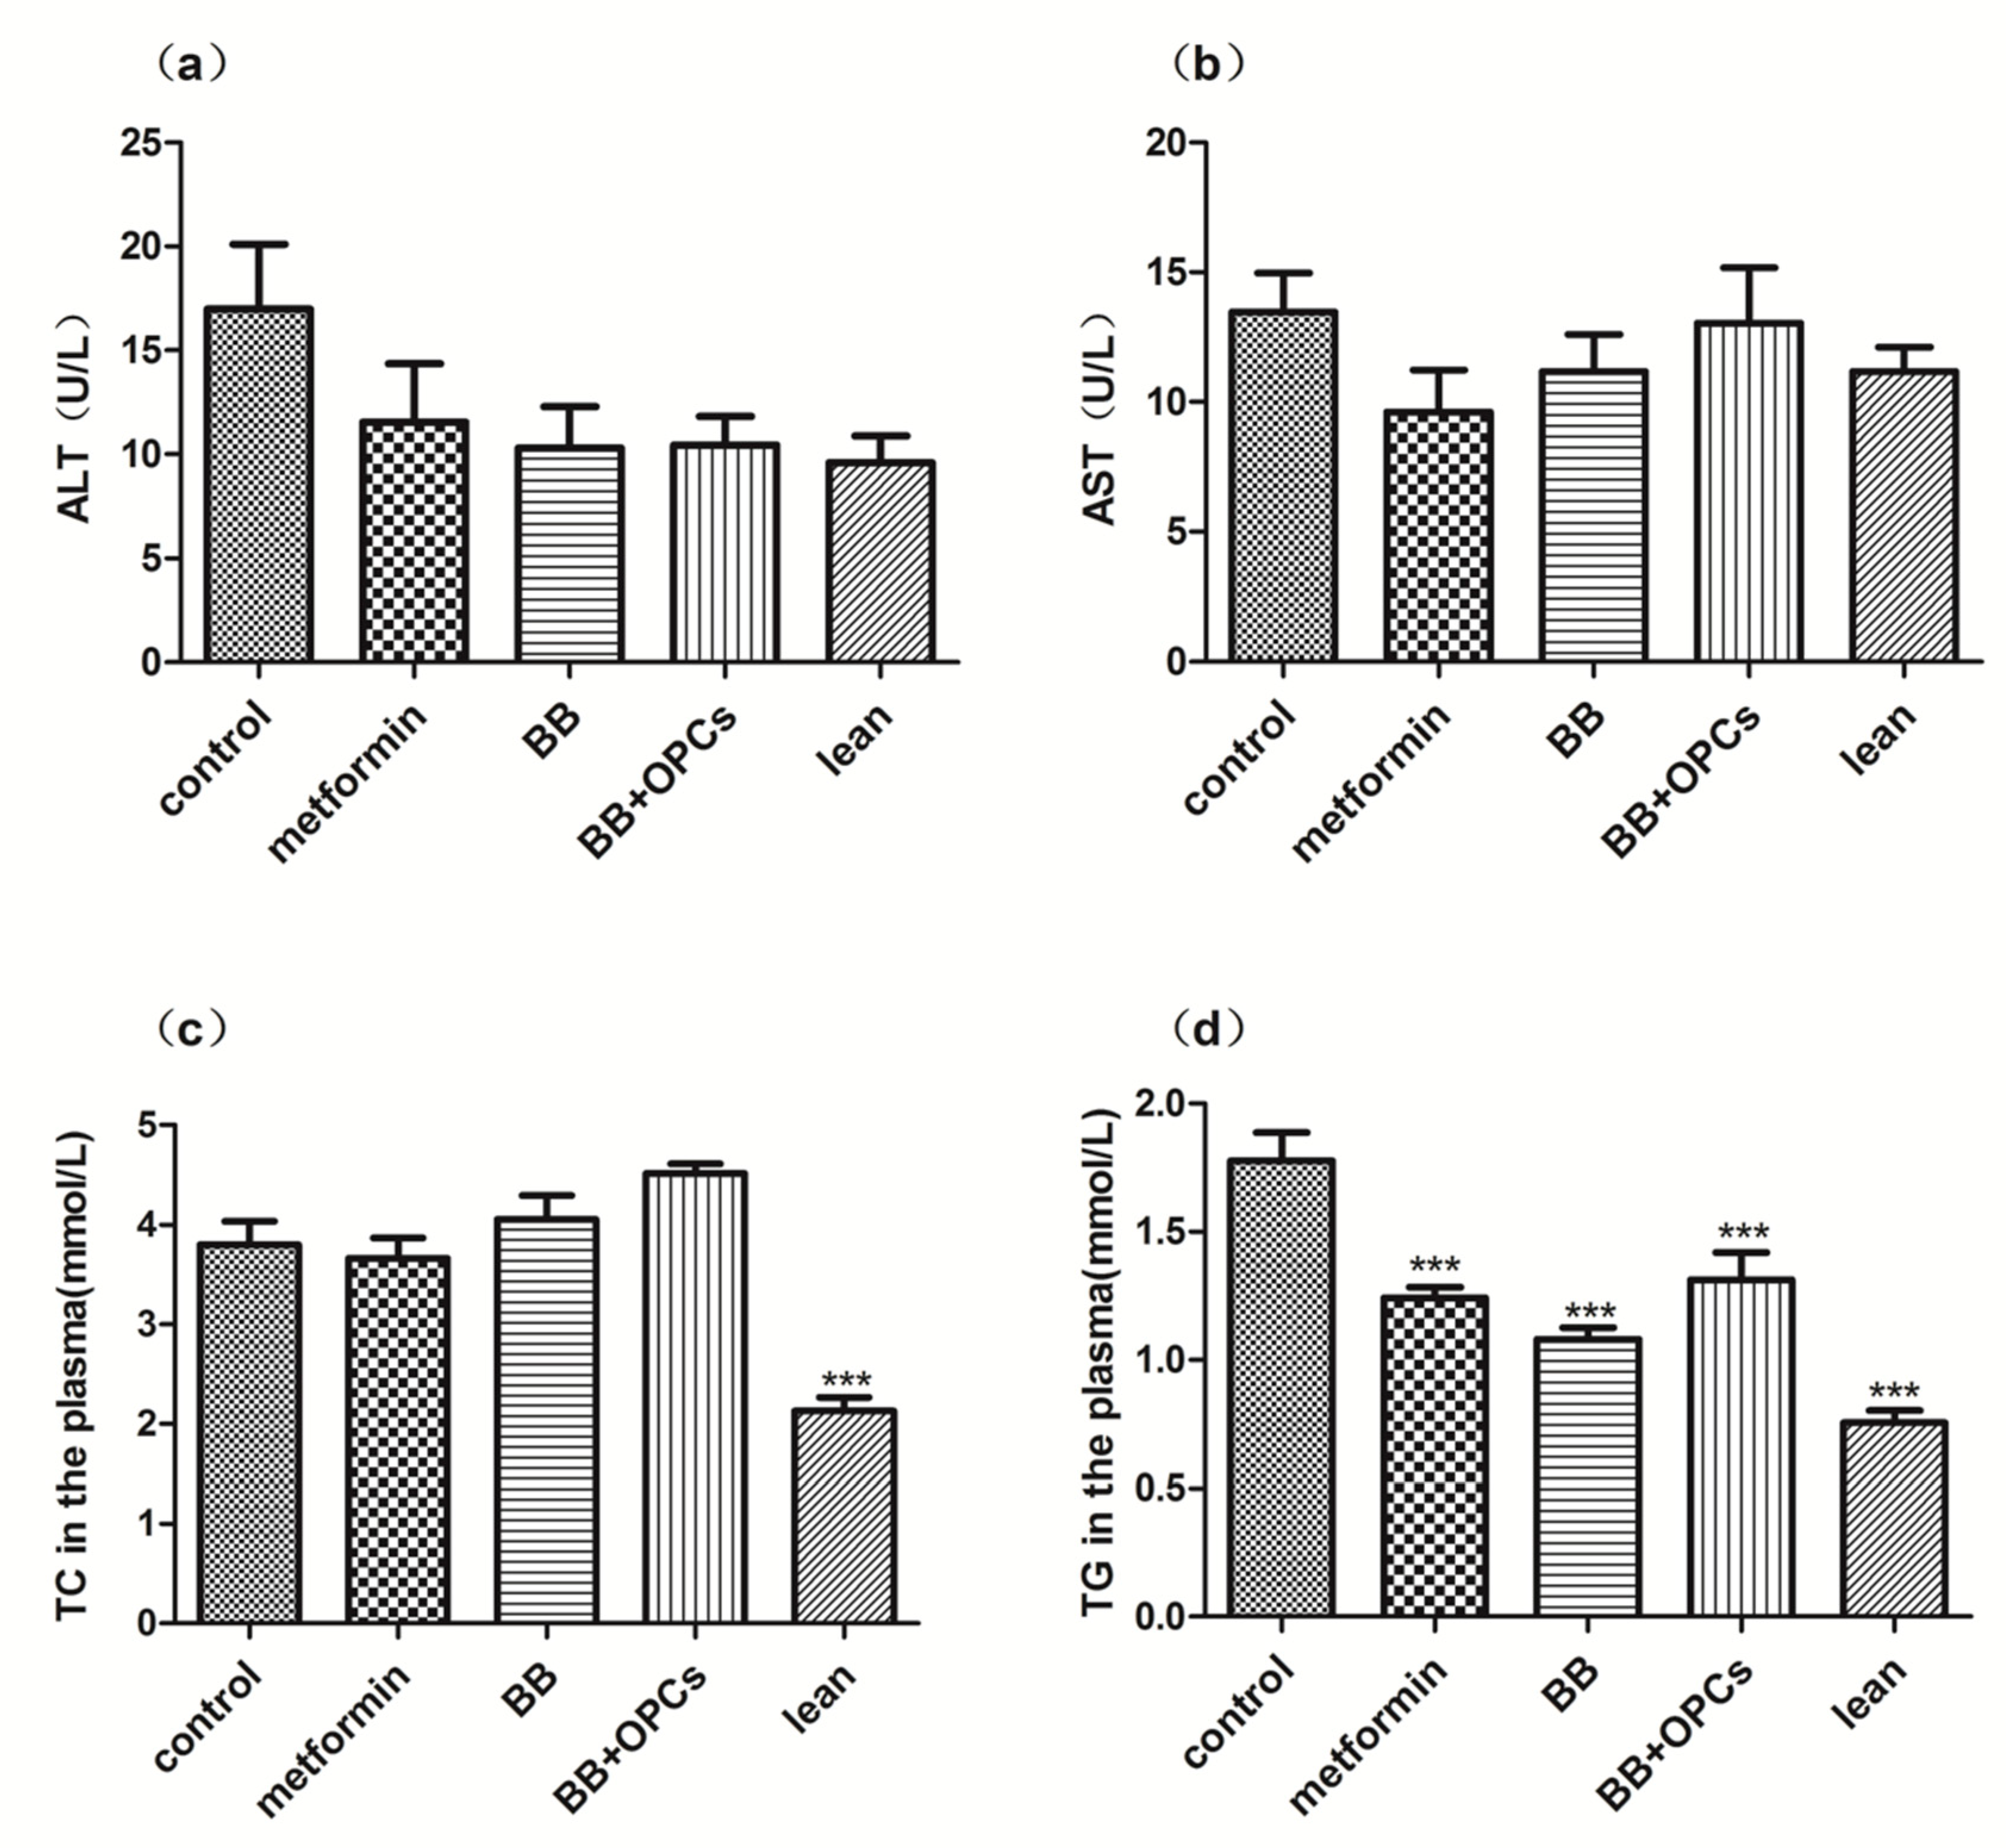
2.1. OPCs Notably Potentiates the Hypoglycemic Effect of BB in Diabetic Mice
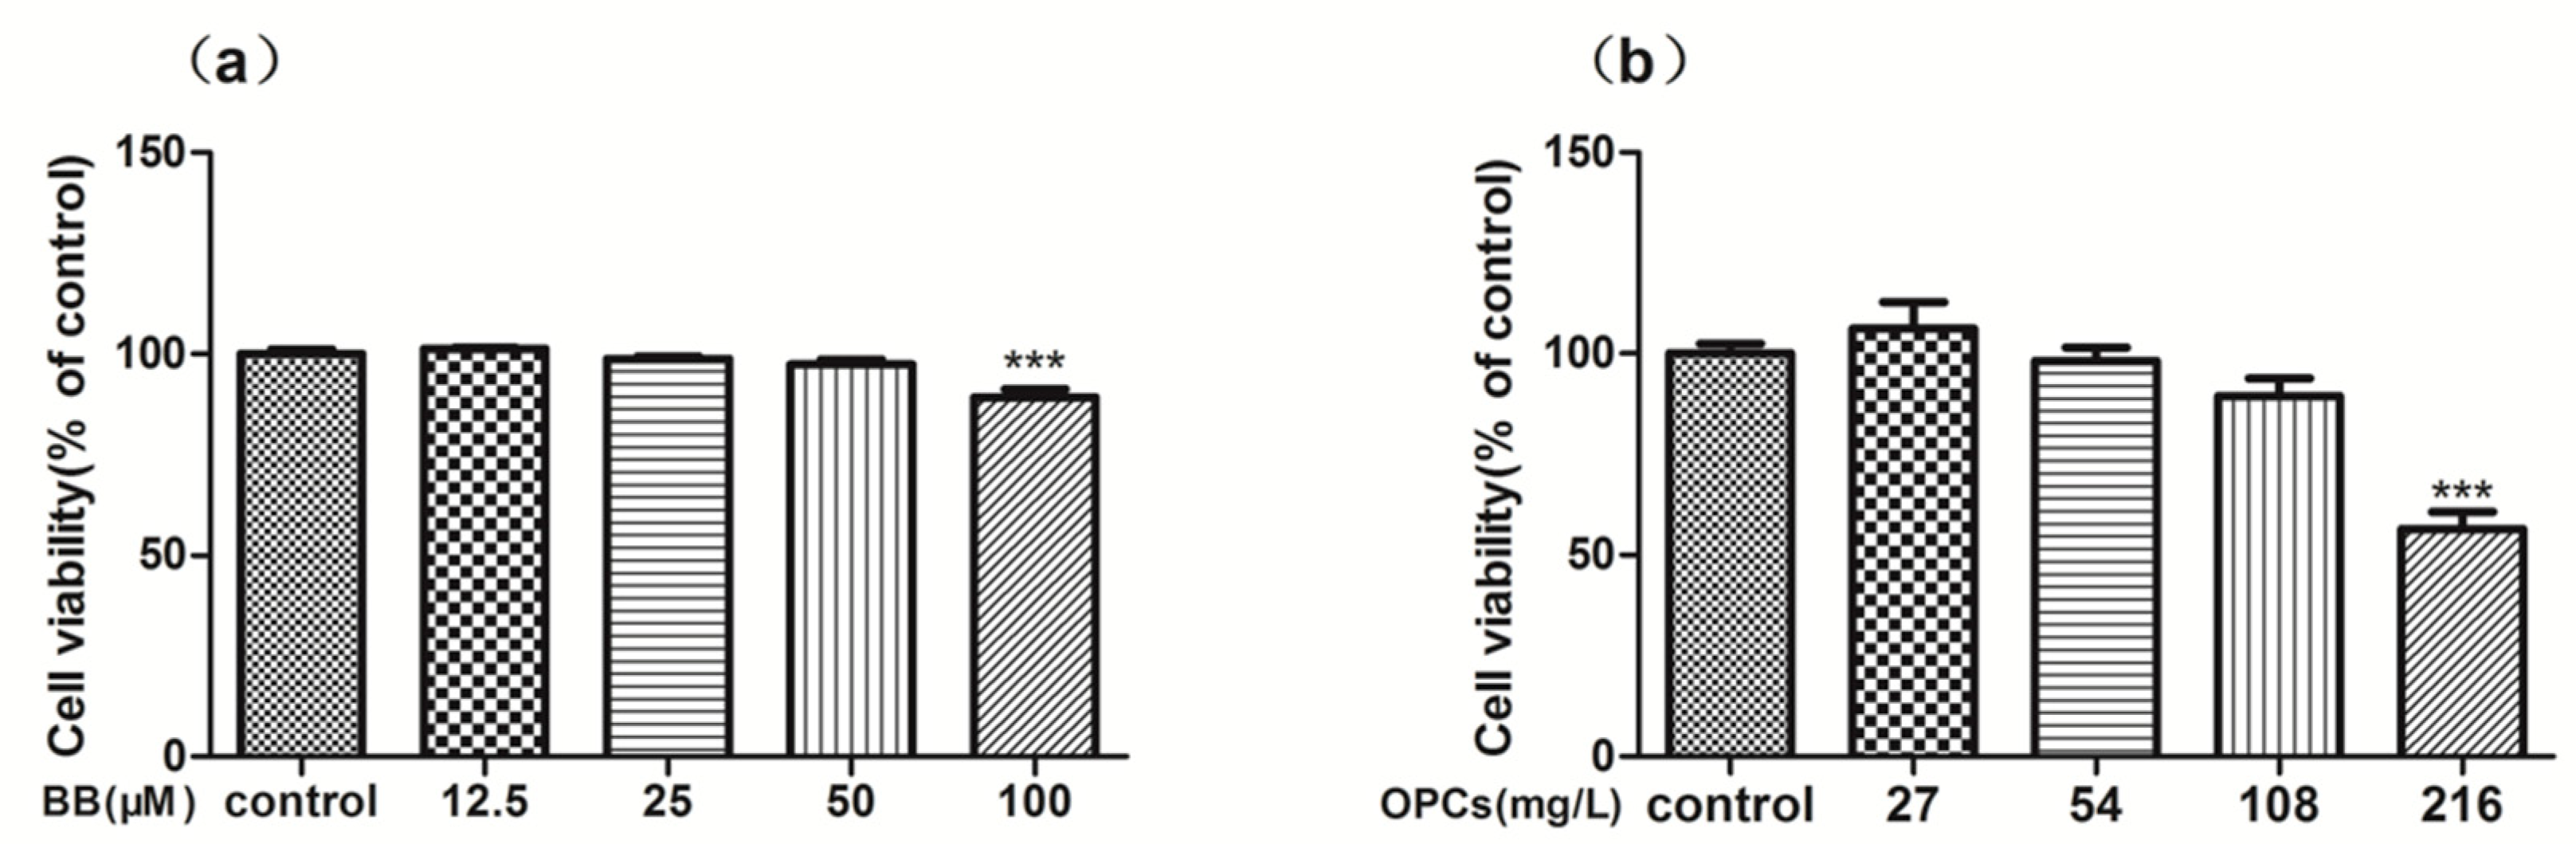
2.2. In Vitro Cytotoxicity and Reverse Effect of BB and OPCs on Caco-2 Cells
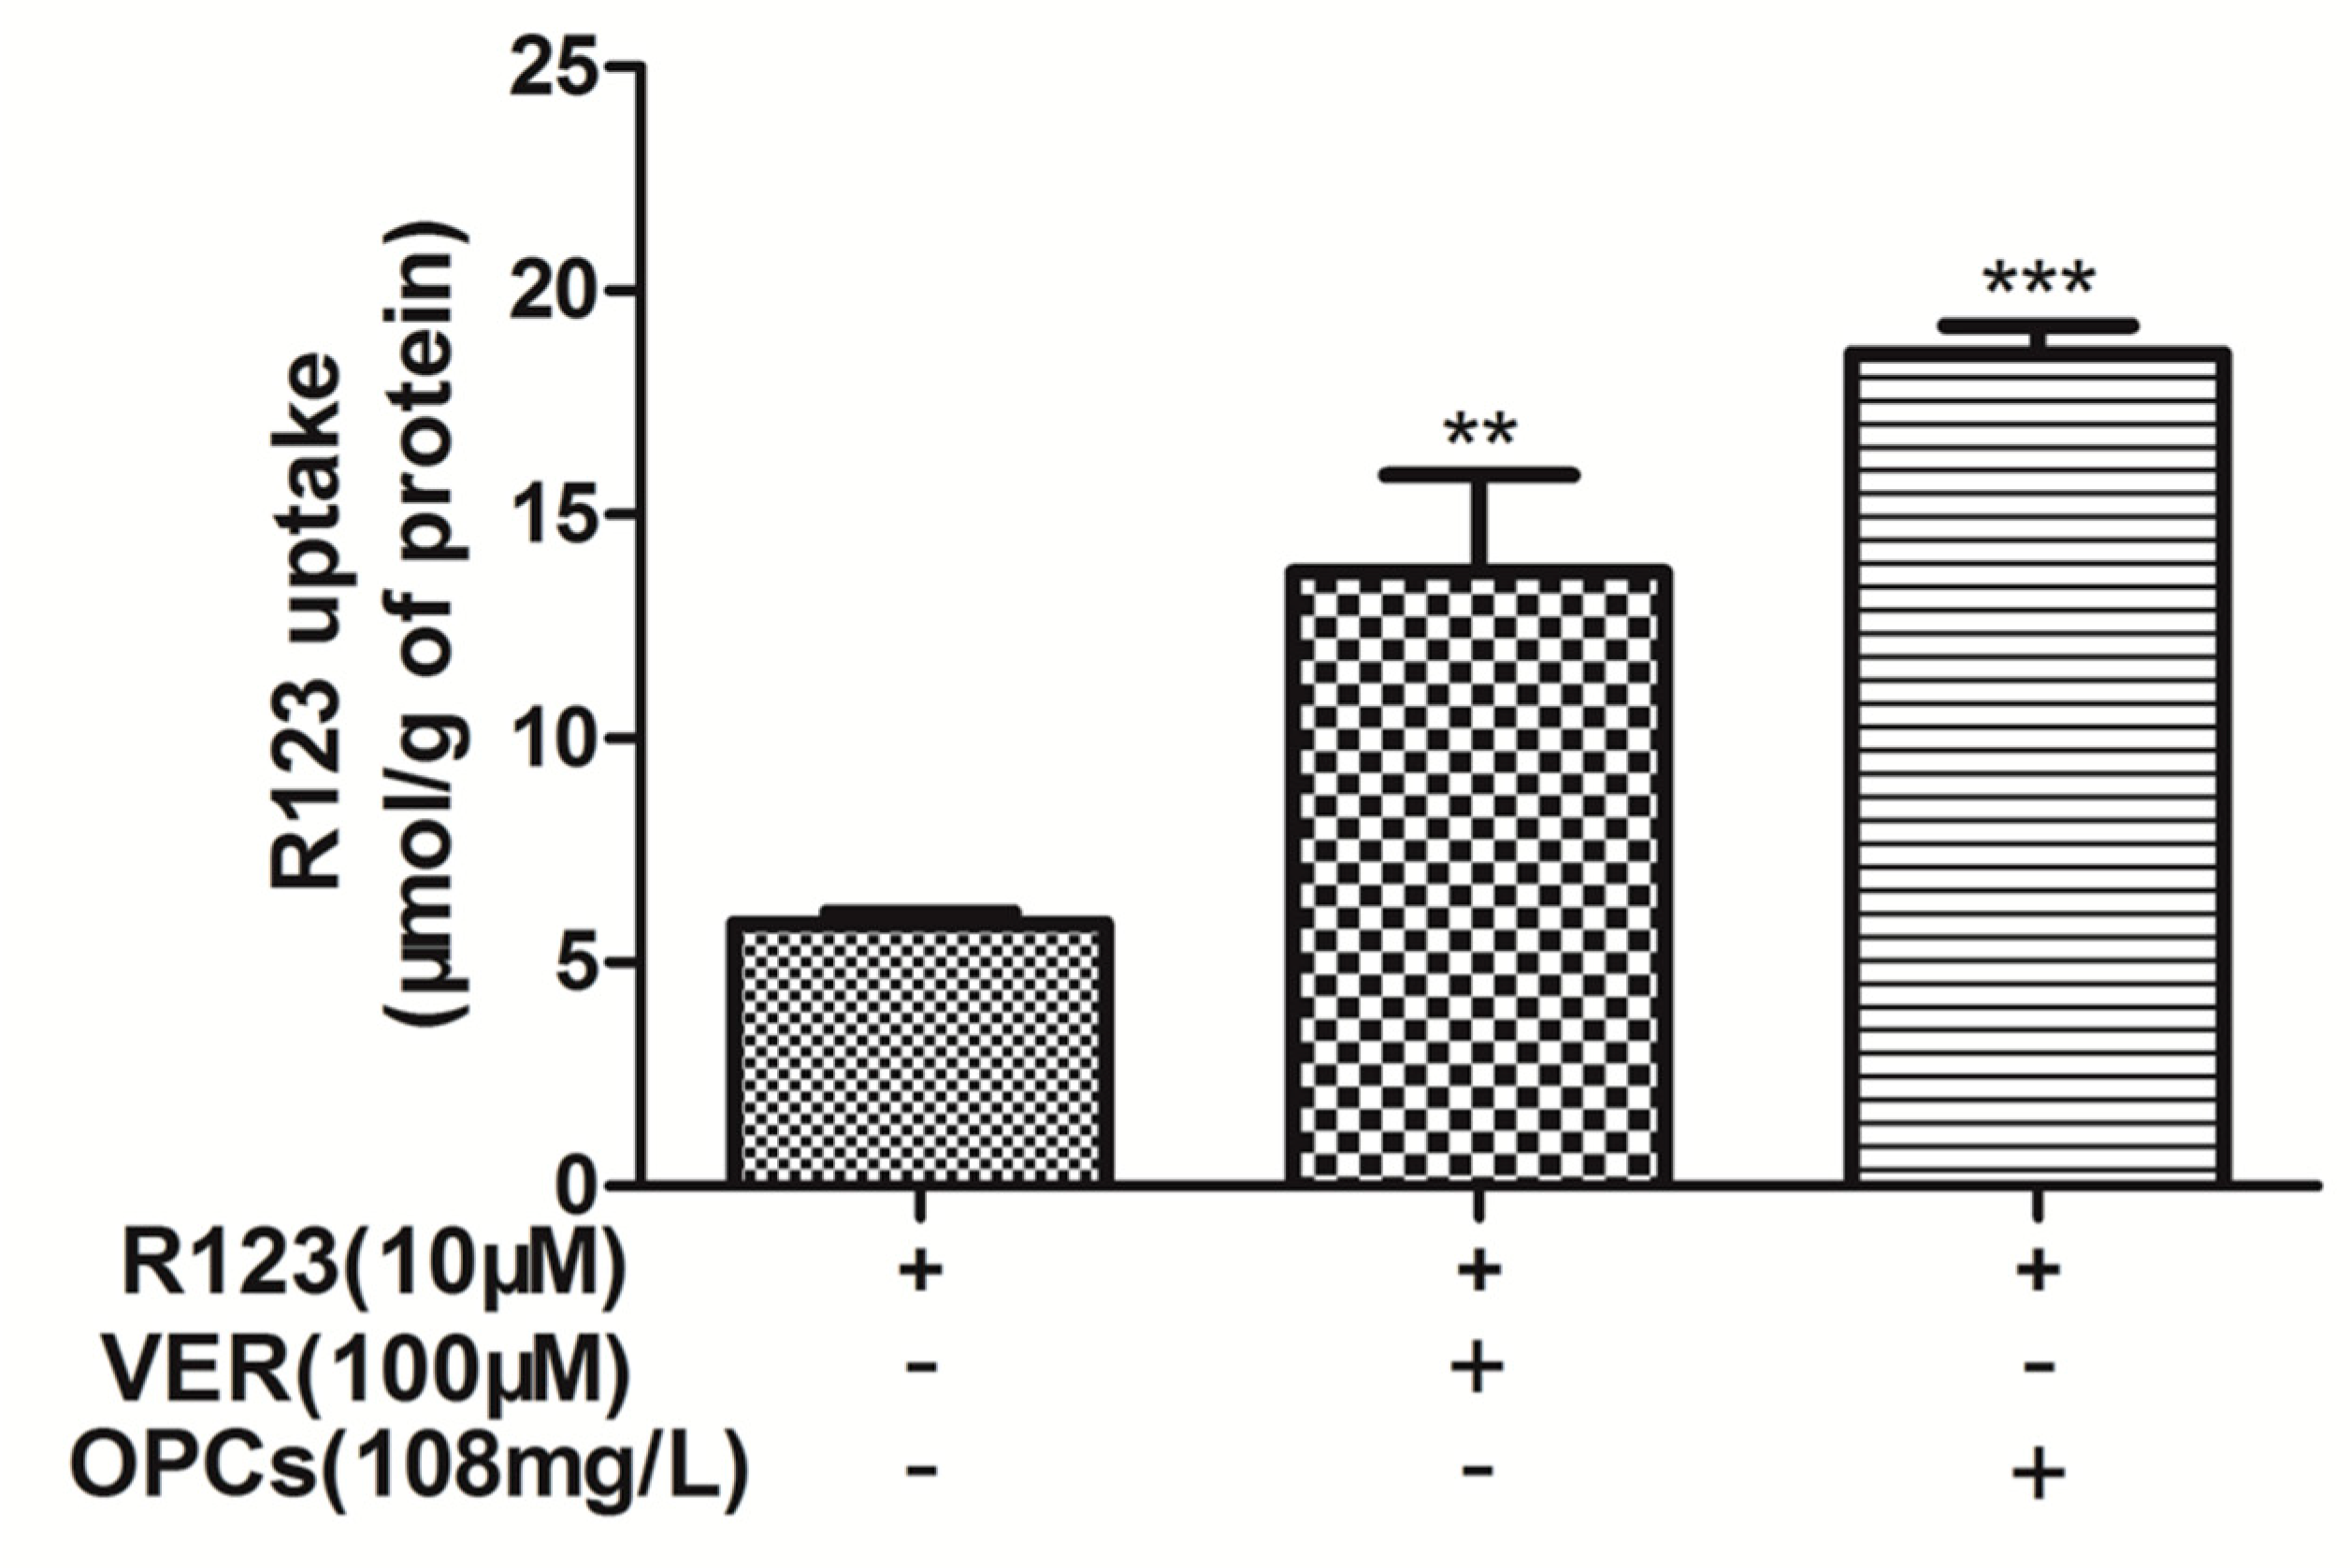
2.3. OPCs Enhanced Intracellular Accumulation of R123 in Caco-2 Cells
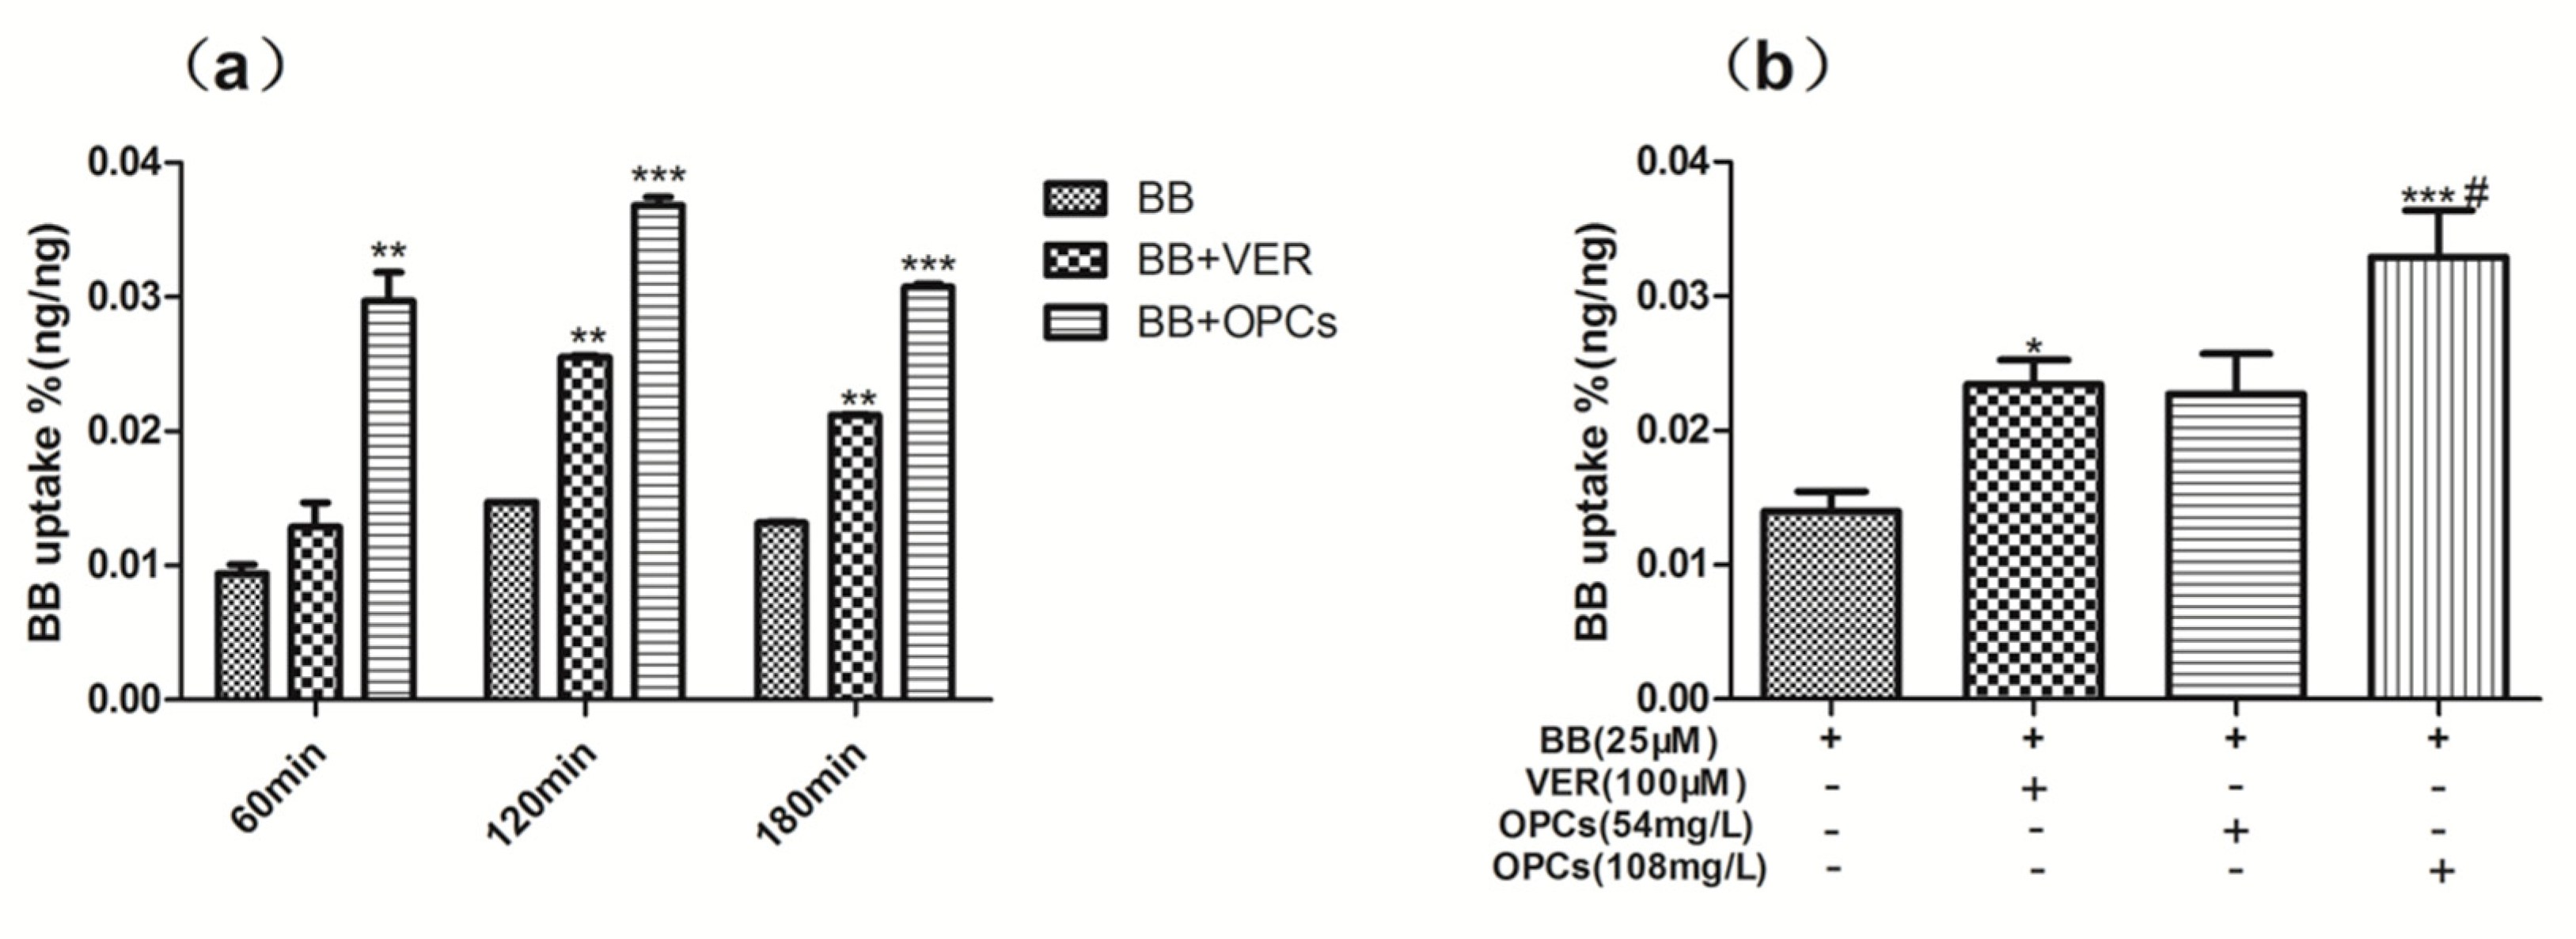
2.4. OPCs Increased the Uptake of BB in Caco-2 Cells
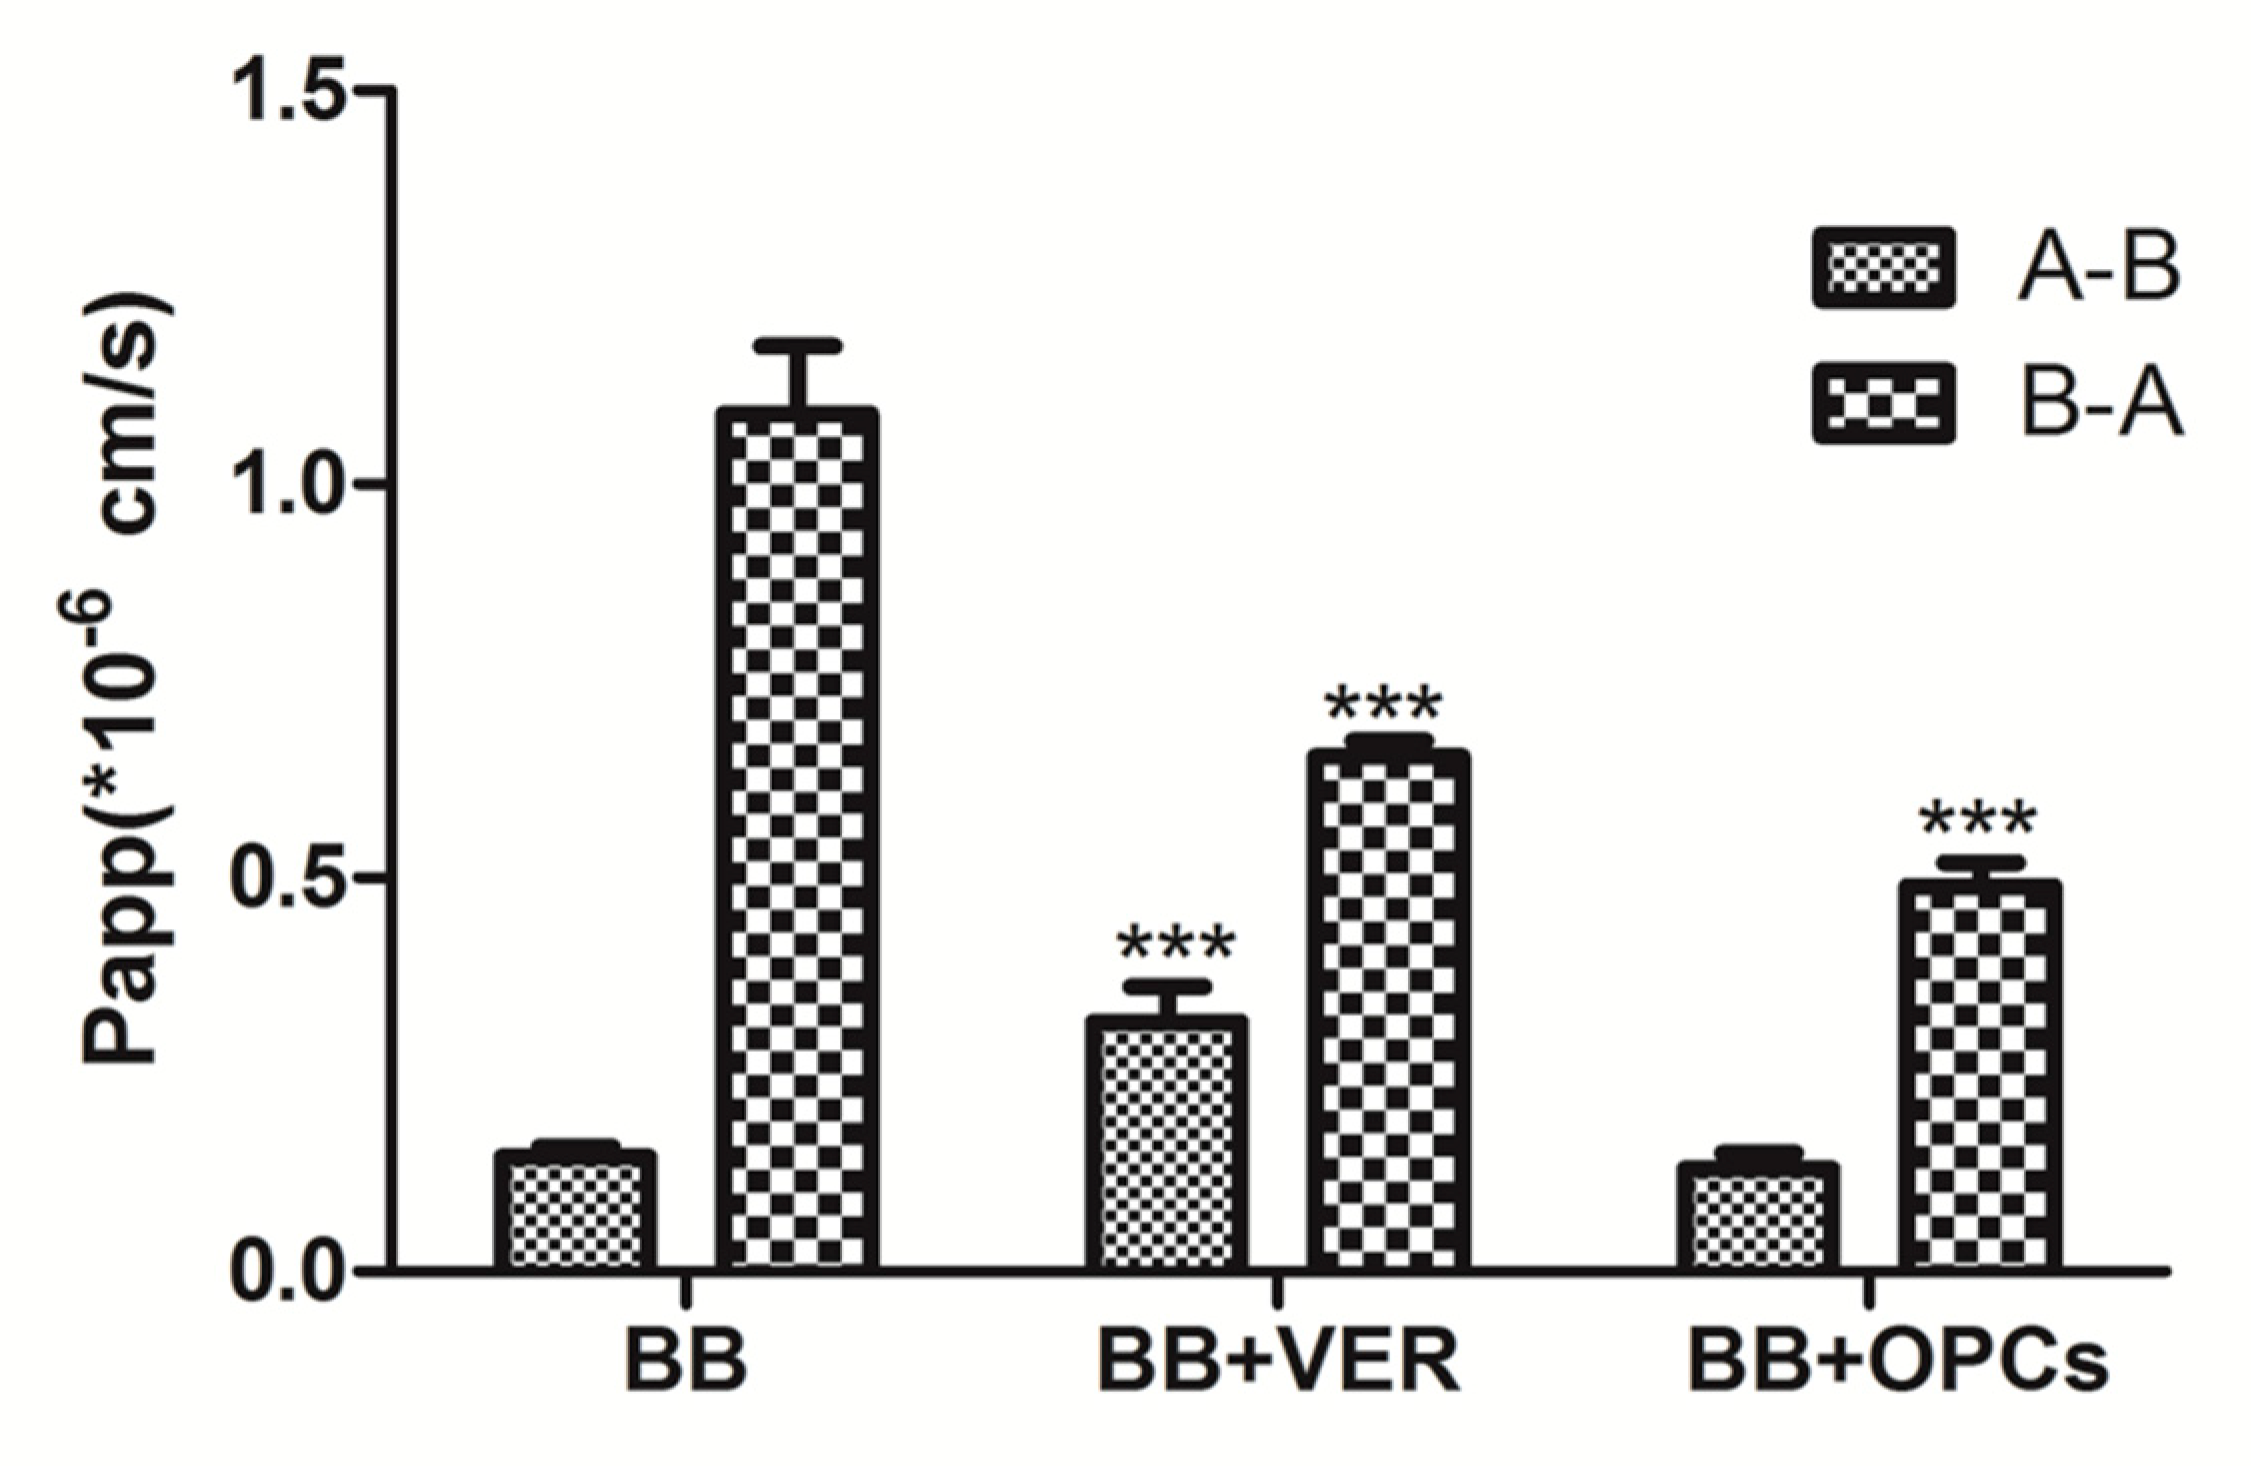
2.5. OPCs Inhibited the Efflux of BB in Caco-2 Cells
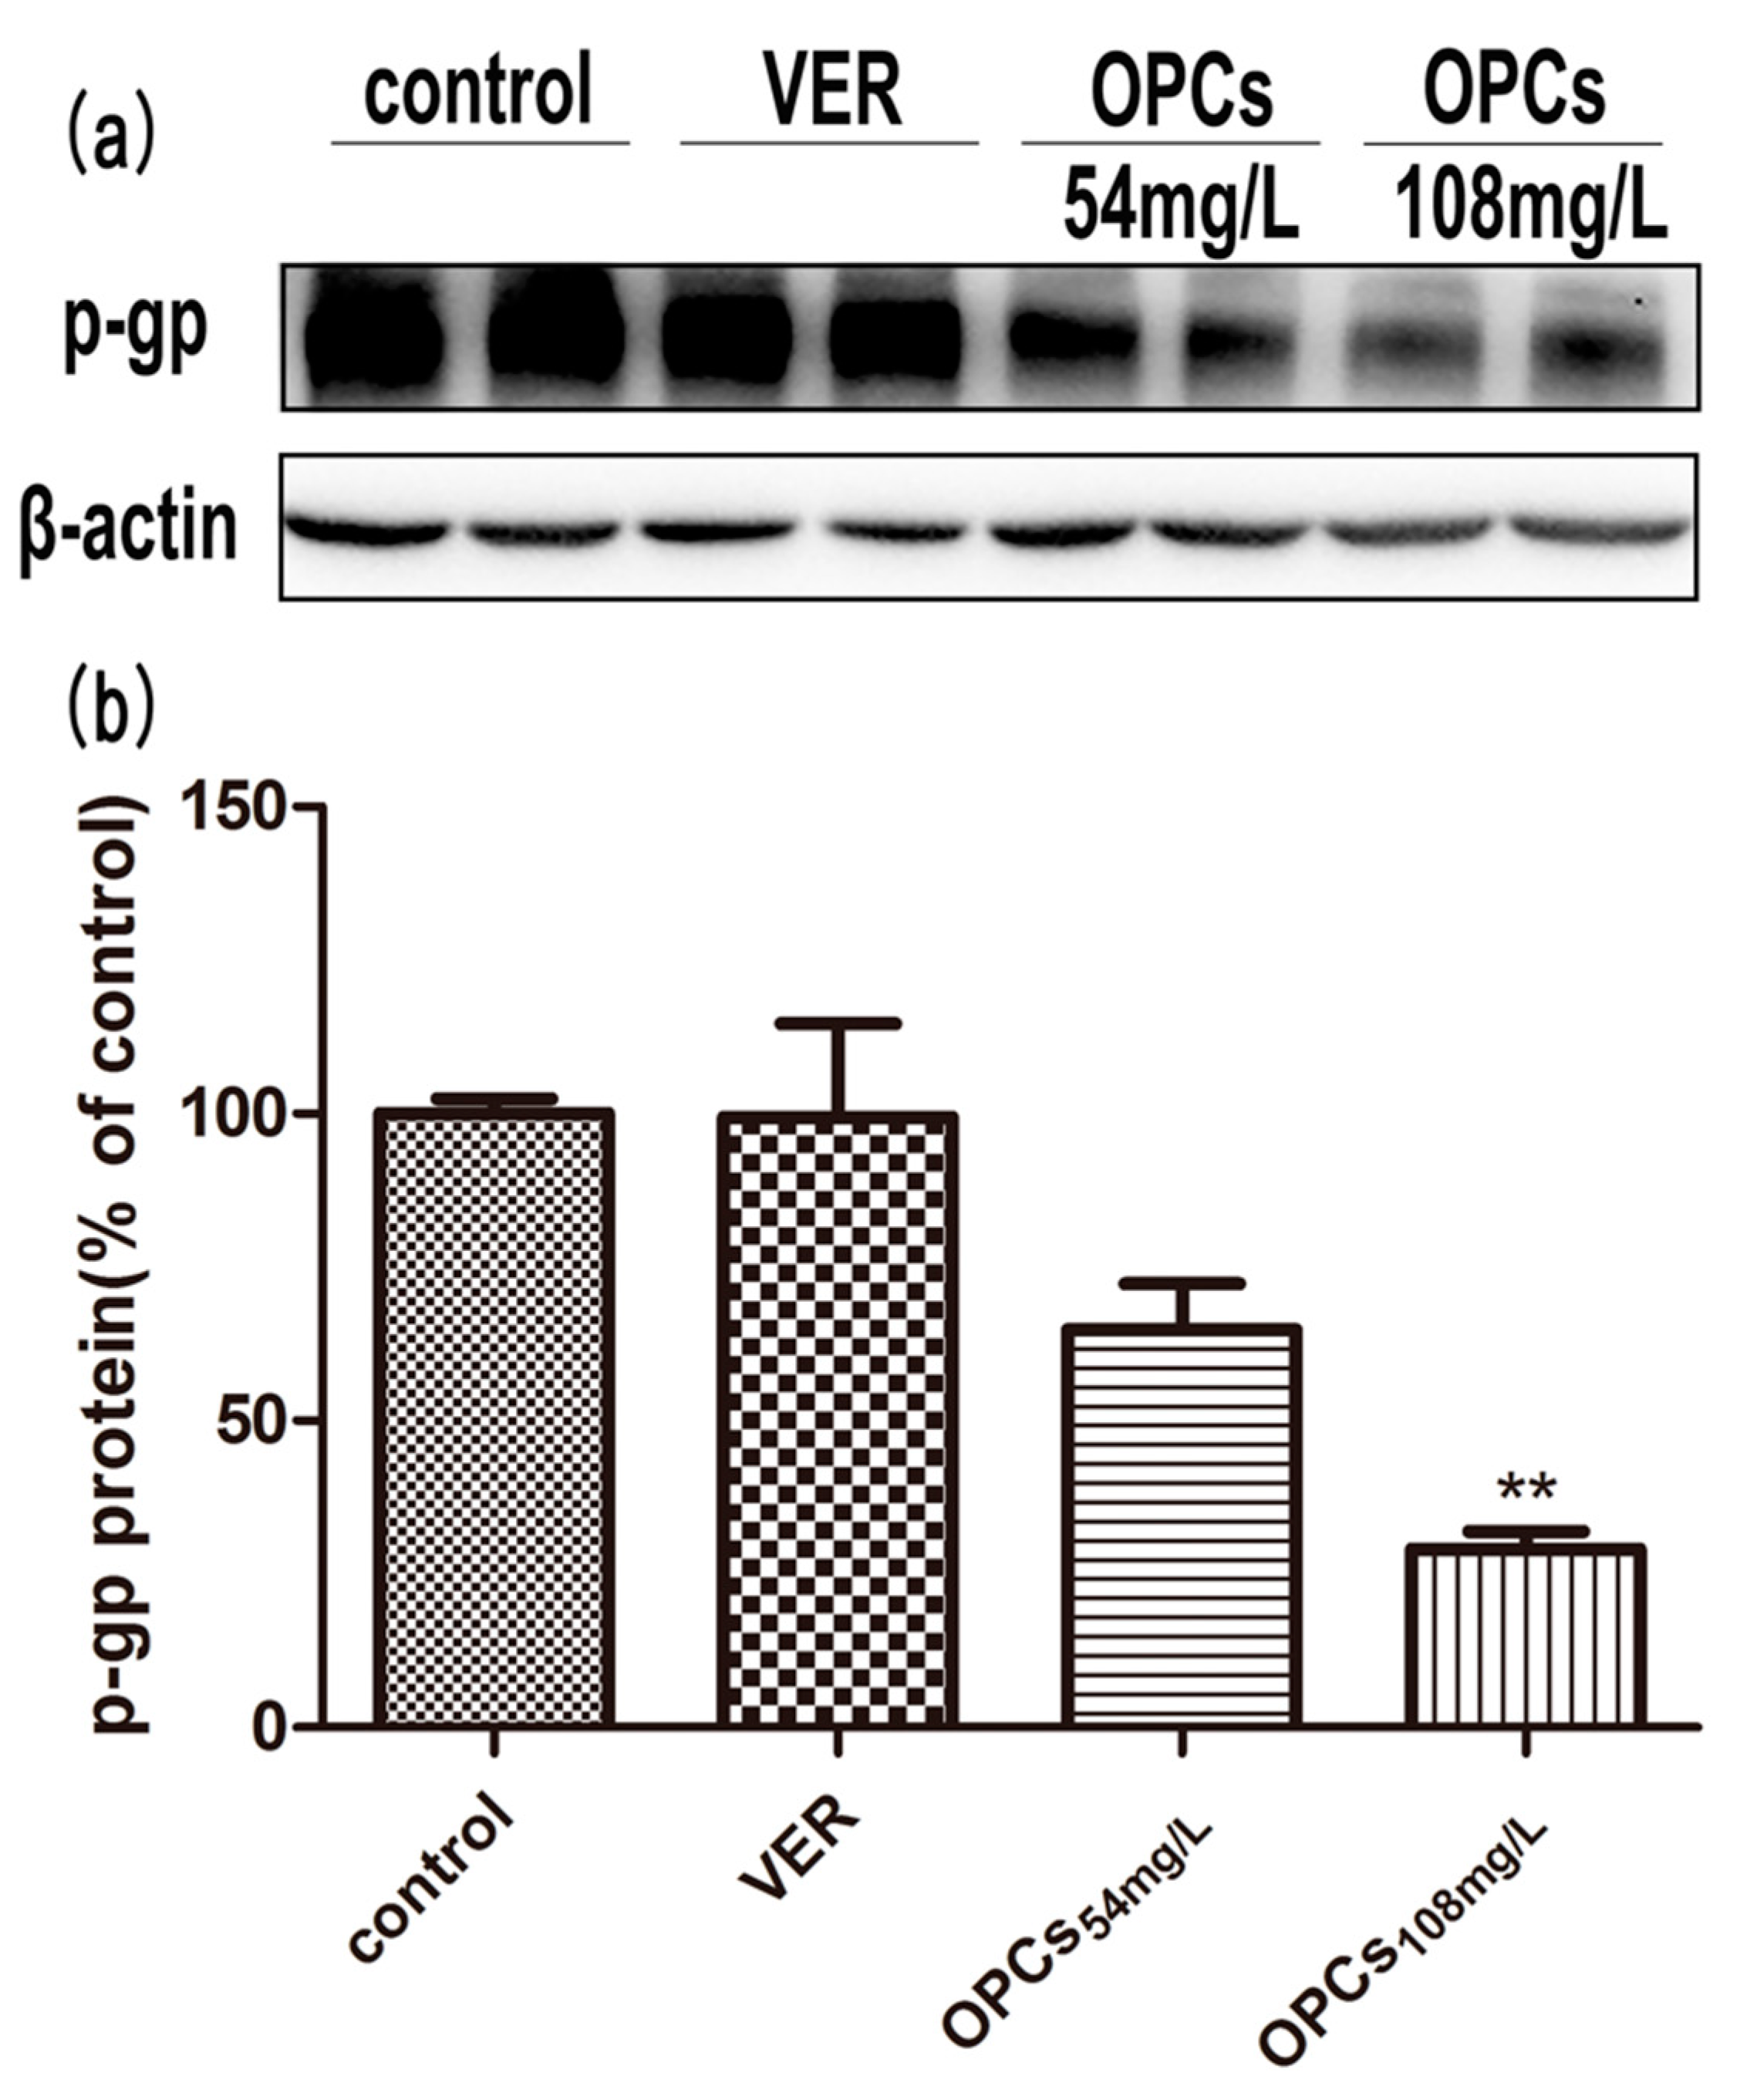
2.6. OPCs Downregulated the Expression of P-gp in Caco-2 Cells
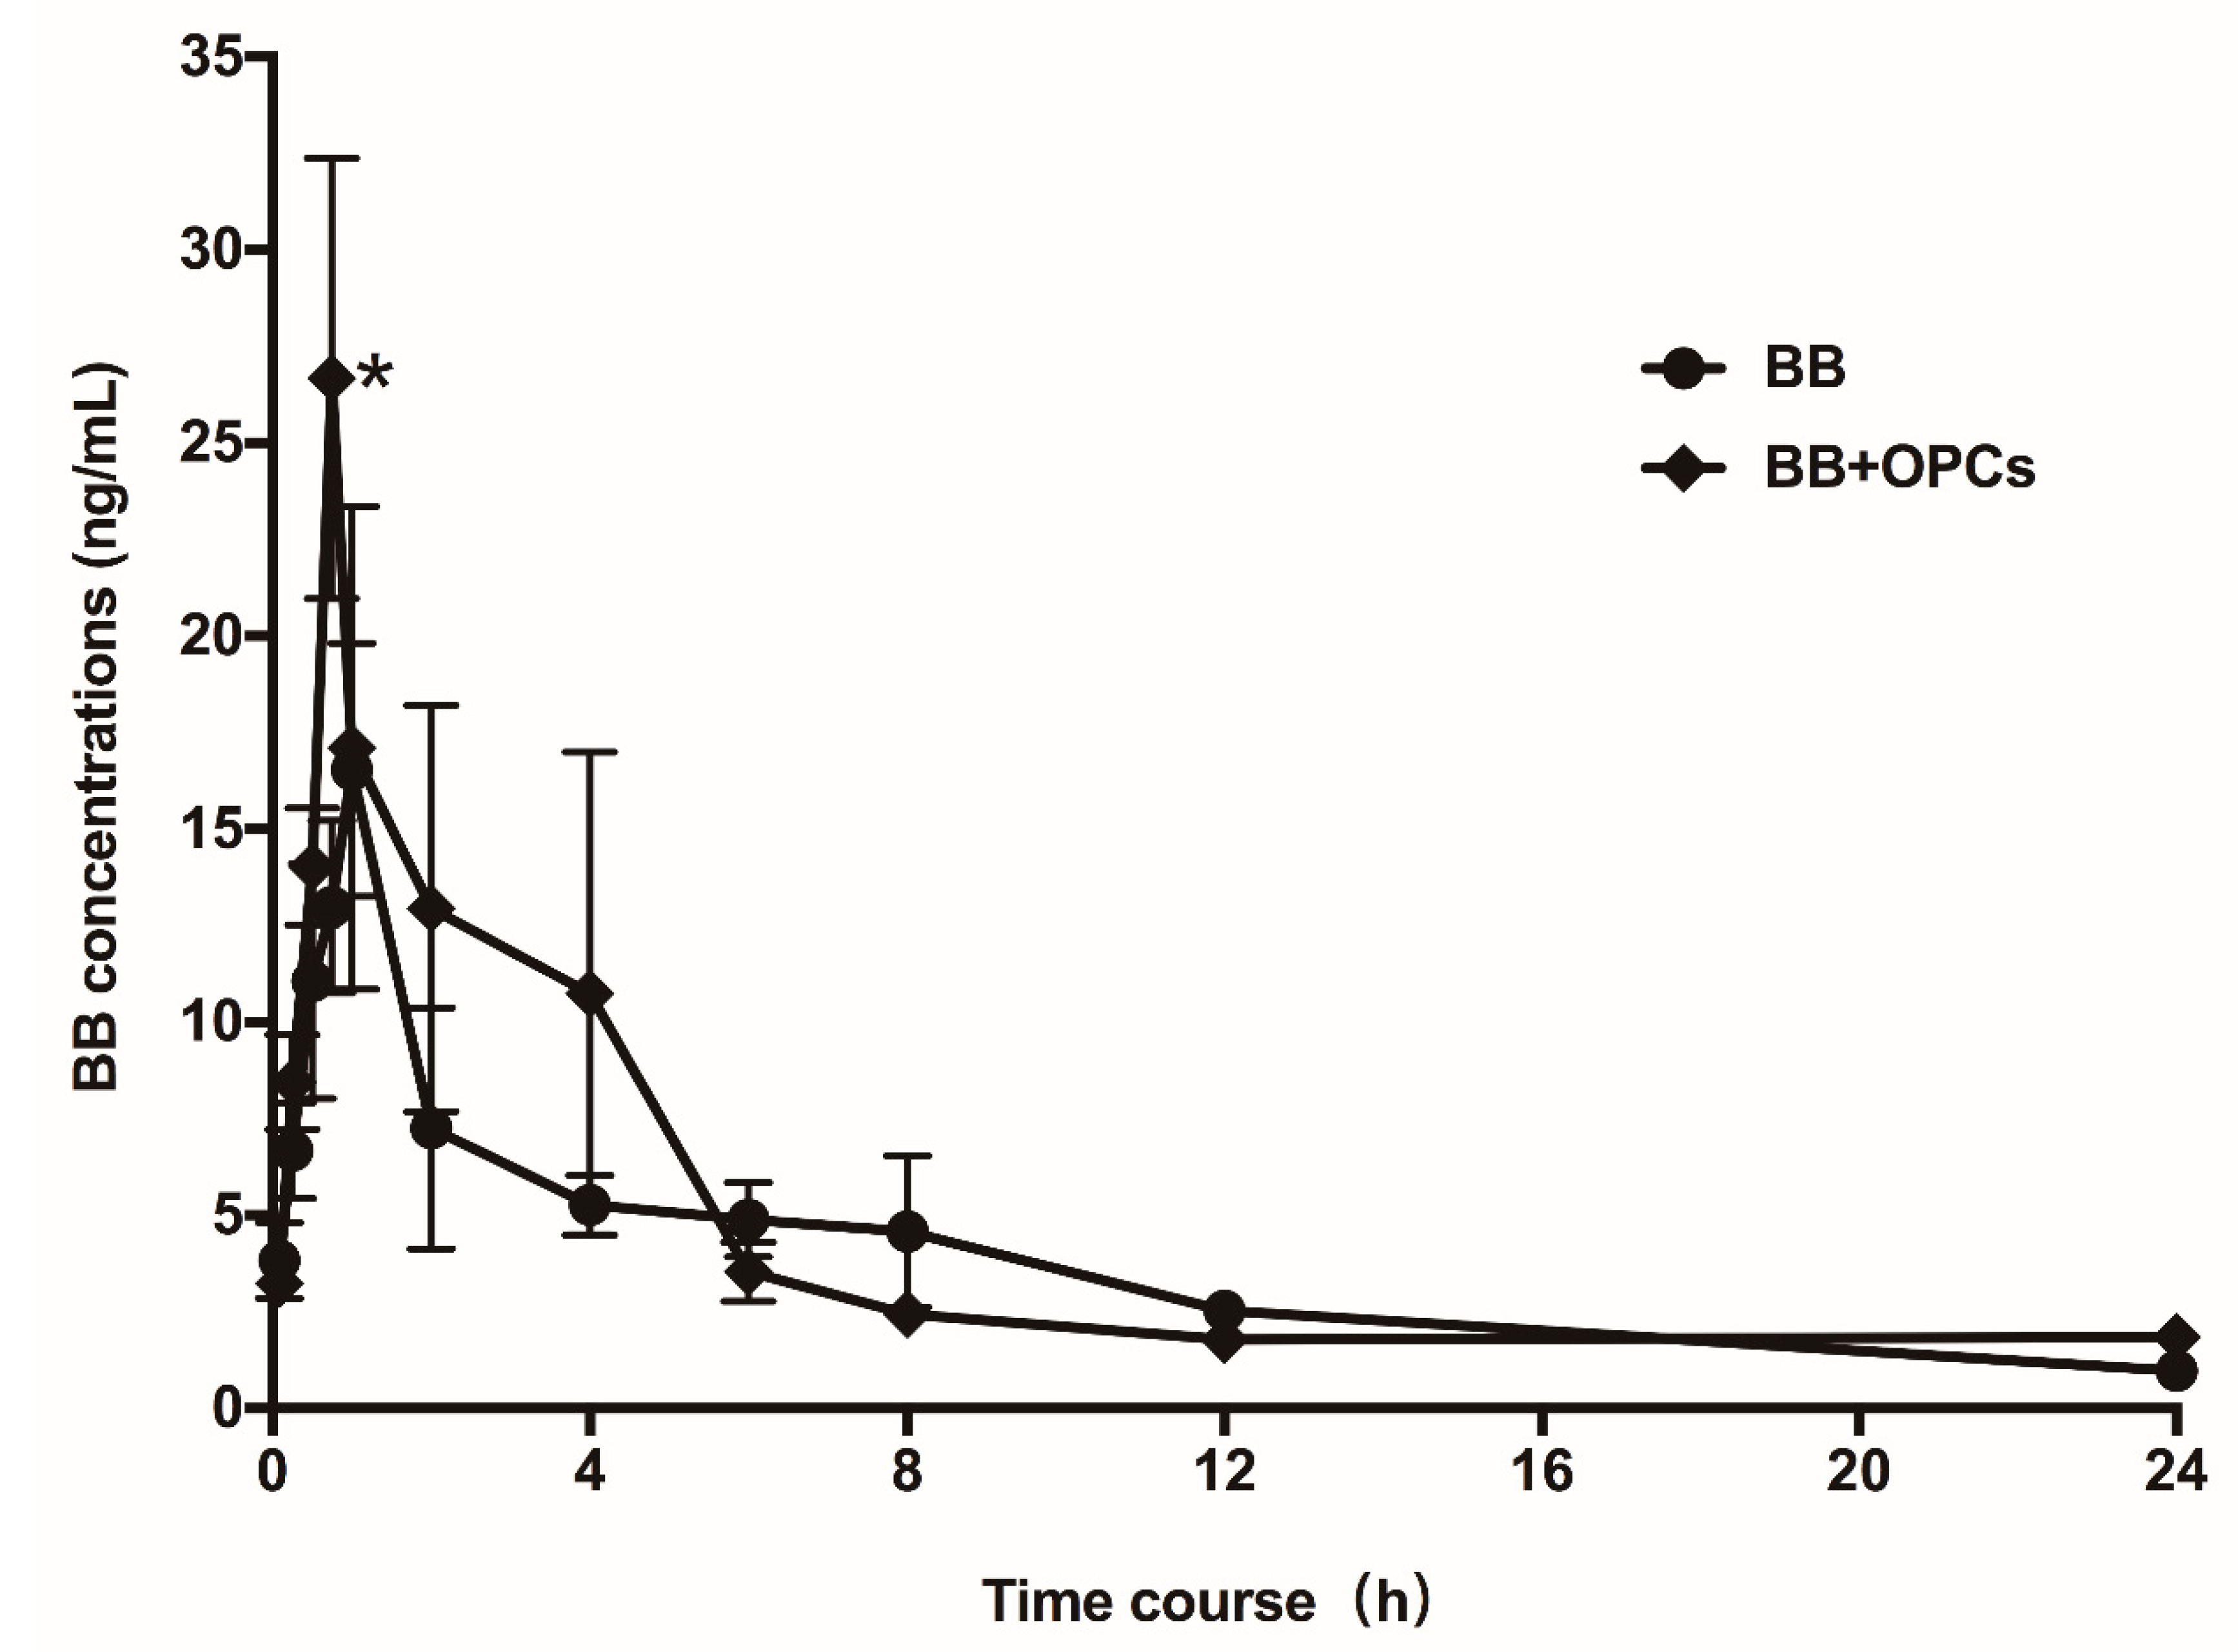
2.7. OPCs Improve the Pharmacokinetics of BB in Mice
3. Discussion
4. Materials and Methods
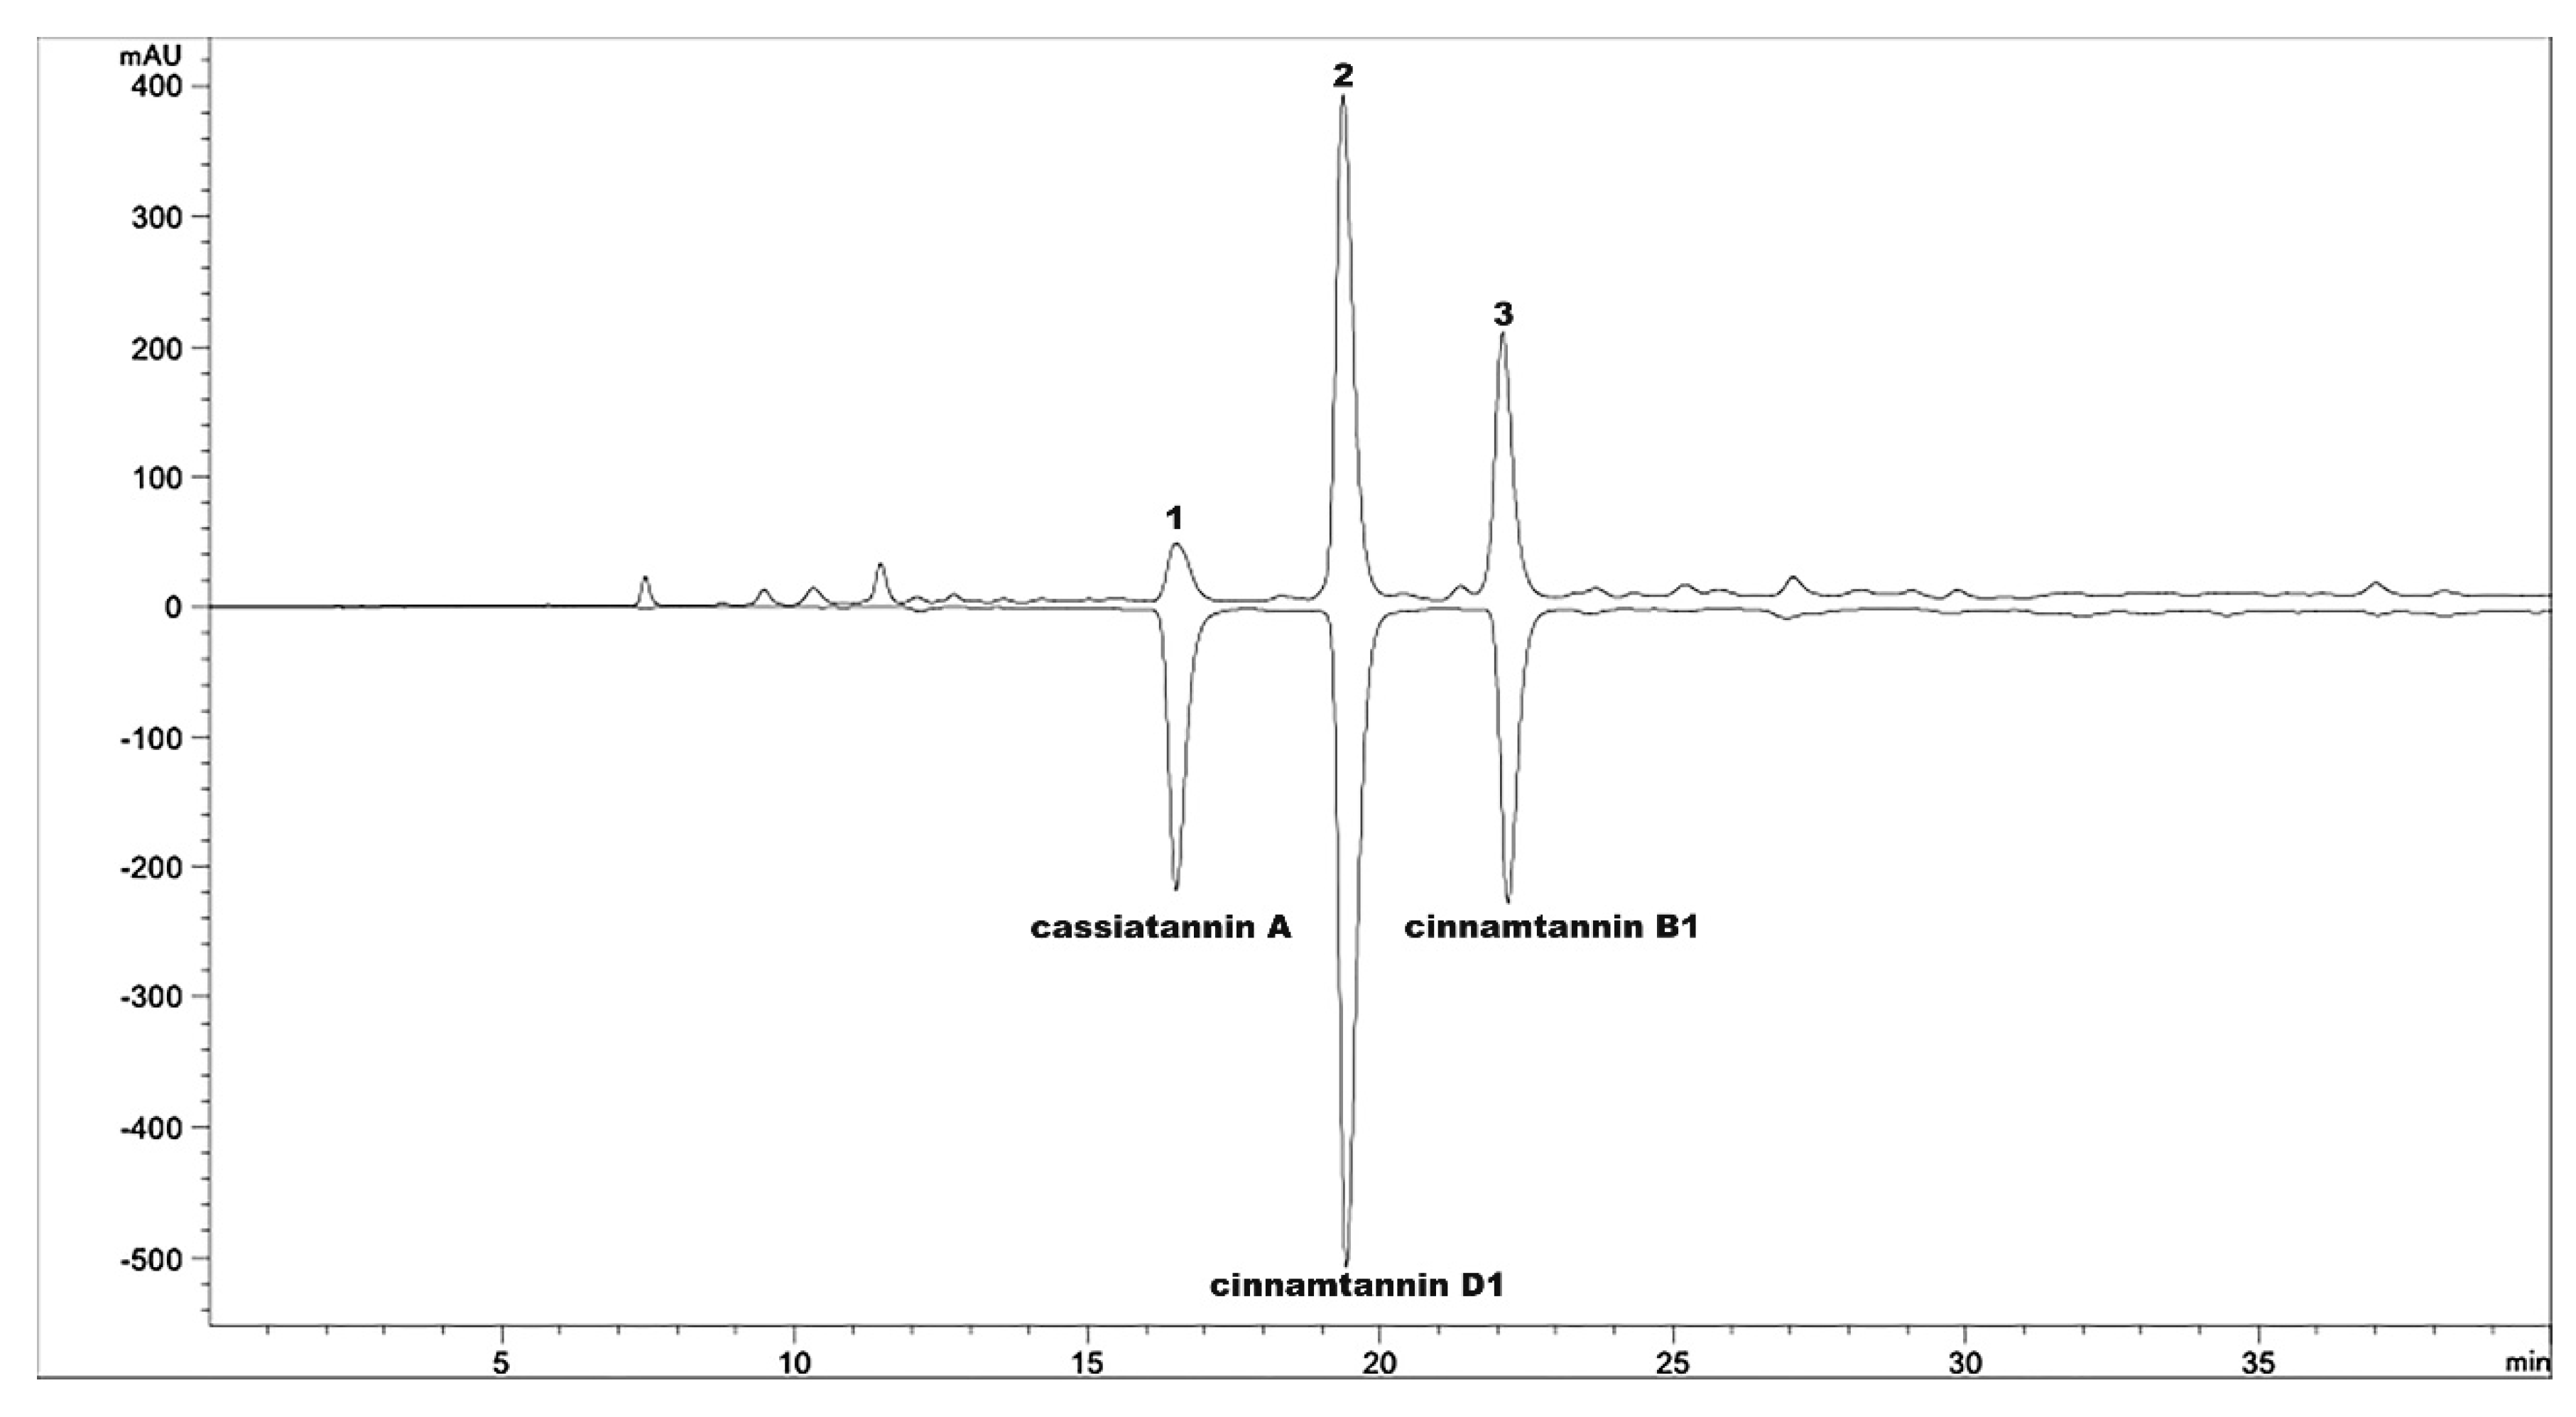
4.1. Preparation of OPCs
4.2. Hypoglycemic Study in Diabetic Mice
4.3. Cell Culture
4.4. Cell Viability Study
4.5. Intracellular Accumulation of Rhodamine 123
4.6. Cellular Uptake and Efflux Assays
4.6.1. Uptake Studies of BB
4.6.2. Transport Studies of BB
4.7. Immunoblot Analysis
4.8. Pharmacokinetic Study
4.9. LC–MS/MS Analysis
4.9.1. Cellular Samples
4.9.2. Serum Samples
4.10. Statistical Analysis
5. Conclusions
Author Contributions
Funding
Conflicts of Interest
Abbreviations
| BB | Berberine |
| OPCs | Oligomeric proanthocyanidins |
| SD mice | Sprague Dawley mice |
| LC–MS/MS | Liquid chromatography–tandem mass spectrometry |
| P-gp | P-glycoprotein |
| R123 | Rhodamine-123 |
| DM | Diabetes mellitus |
| T2DM | Type 2 diabetes mellitus |
| TCM | Traditional Chinese medicine |
| JTW | Jiaotaiwan |
| ACC | Acetyl coenzyme A carboxylase |
| AMPK | AMP-activated protein kinase |
| GLUT4 | Glucose transporter 4 |
| FBG | Fasting blood glucose |
| OGTT | Oral glucose tolerance test |
| IPTT | Intraperitoneal insulin tolerance test |
| TG | Total triglyceride |
| TC | Total cholesterol |
| ALT | Alanine transaminase |
| AST | Aspartate transaminase |
| AUC | Area under the curve |
| MTT | Methylthiazolyldiphenyl-tetrazolium bromide |
| DMEM | Dulbecco’s modified Eagle medium |
| HBSS | Hank’s balanced salt solution |
| HPLC | High-performance liquid chromatography |
| UPLC | Ultrahigh performance liquid chromatograph |
| ESI | Electrospray ionization |
| THP | Tetrahydropalmatine |
| TL | Tube lens voltage |
| CE | Collision energies |
| DP | Declustering potential |
| CEP | Cell exit potential |
| BL | Basolateral |
| AP | Apical |
| ACTB | β-Actin |
| BCA | Bicinchoninic acid |
References
- Zimmet, P.; Alberti, K.G.; Shaw, J. Global and societal implications of the diabetes epidemic. Nature 2001, 414, 782–787. [Google Scholar] [CrossRef] [PubMed]
- Thrasher, J. Pharmacologic Management of Type 2 Diabetes Mellitus: Available Therapies. Am. J. Cardiol. 2017, 120, S4–S16. [Google Scholar] [CrossRef] [PubMed]
- Rios, J.L.; Francini, F.; Schinella, G.R. Natural Products for the Treatment of Type 2 Diabetes Mellitus. Planta Med. 2015, 81, 975–994. [Google Scholar] [CrossRef] [Green Version]
- Seto, S.W.; Yang, G.Y.; Kiat, H.; Bensoussan, A.; Kwan, Y.W.; Chang, D. Diabetes Mellitus, Cognitive Impairment, and Traditional Chinese Medicine. Int. J. Endocrinol. 2015. [Google Scholar] [CrossRef]
- Li, W.L.; Zheng, H.C.; Bukuru, J.; De, N.K. Natural medicines used in the traditional Chinese medical system for therapy of diabetes mellitus. J. Ethnopharmacol. 2004, 92, 1–21. [Google Scholar] [CrossRef] [PubMed]
- Chang, W.; Chen, L.; Hatch, G.M. Berberine as a therapy for type 2 diabetes and its complications: From mechanism of action to clinical studies. Biochem. Cell. Biol. 2015, 93, 479–486. [Google Scholar] [CrossRef]
- Dong, H.; Wang, N.; Zhao, L.; Lu, F. Berberine in the treatment of type 2 diabetes mellitus: A systemic review and meta-analysis. Evid.-Based Complement. Altern. Med. 2012. [Google Scholar] [CrossRef] [PubMed]
- Pang, B.; Yu, X.T.; Zhou, Q.; Zhao, T.Y.; Wang, H.; Gu, C.J.; Tong, X.L. Effect of Rhizoma coptidis (Huang Lian) on Treating Diabetes Mellitus. Evid.-Based Complement. Altern. Med. 2015. [Google Scholar] [CrossRef] [PubMed]
- Pang, B.; Zhao, L.H.; Zhou, Q.; Zhao, T.Y.; Wang, H.; Gu, C.J.; Tong, X.L. Application of berberine on treating type 2 diabetes mellitus. Int. J. Endocrinol. 2015. [Google Scholar] [CrossRef]
- Chen, Q.M.; Xie, M.Z. Studies on the hypoglycemic effect of Coptis chinensis and berberine. Acta Pharm. Sin. 1986, 21, 401–406. [Google Scholar]
- Wang, F.L.; Tang, L.Q.; Yang, F.; Zhu, L.N.; Cai, M.; Wei, W. Renoprotective effects of berberine and its possible molecular mechanisms in combination of high-fat diet and low-dose streptozotocin-induced diabetic rats. Mol. Biol. Rep. 2013, 40, 2405–2418. [Google Scholar] [CrossRef] [PubMed]
- Kim, S.O.; Kim, H.J. Berberine ameliorates cold and mechanical allodynia in a rat model of diabetic neuropathy. J. Med. Food 2013, 16, 511–517. [Google Scholar] [CrossRef] [PubMed]
- Chang, W.; Zhang, M.; Meng, Z.; Yu, Y.; Yao, F.; Hatch, G.M.; Chen, L. Berberine treatment prevents cardiac dysfunction and remodeling through activation of 5′-adenosine monophosphate-activated protein kinase in type 2 diabetic rats and in palmitate-induced hypertrophic H9c2 cells. Eur. J. Pharmacol. 2015, 769, 55–63. [Google Scholar] [CrossRef]
- Chen, W.; Miao, Y.Q.; Fan, D.J.; Yang, S.S.; Lin, X.; Meng, L.K.; Tang, X. Bioavailability study of berberine and the enhancing effects of TPGS on intestinal absorption in rats. AAPS PharmSciTech 2011, 12, 705–711. [Google Scholar] [CrossRef] [PubMed]
- Maeng, H.J.; Yoo, H.J.; Kim, I.W.; Song, I.S.; Chung, S.J.; Shim, C.K. P-glycoprotein-mediated transport of berberine across Caco-2 cell monolayers. J. Pharm. Sci. 2002, 91, 2614–2621. [Google Scholar] [CrossRef] [PubMed]
- Pan, G.Y.; Wang, G.J.; Liu, X.D.; Fawcett, J.P.; Xie, Y.Y. The involvement of P-glycoprotein in berberine absorption. Pharmacol. Toxicol. 2002, 91, 193–197. [Google Scholar] [CrossRef] [PubMed]
- Zhe, Q.; Sulei, W.; Weiwei, T.; Hongyan, L.; Jianwei, W. Effects of Jiaotaiwan on depressive-like behavior in mice after lipopolysaccharide administration. Metab. Brain Dis. 2017, 32, 415–426. [Google Scholar] [CrossRef]
- Hu, N.; Yuan, L.; Li, H.J.; Huang, C.; Mao, Q.M.; Zhang, Y.Y.; Lin, M.; Sun, Y.Q.; Zhong, X.Y.; Tang, P.; Lu, X. Anti-Diabetic Activities of Jiaotaiwan in db/db Mice by Augmentation of AMPK Protein Activity and Upregulation of GLUT4 Expression. Evid.-Based Complement. Altern. Med. 2013. [Google Scholar] [CrossRef]
- Huang, Z.; Xu, X.; Lu, F.; Wang, N.; Chen, G.; Zhao, Y.; Zou, X.; Wang, K.; Dong, H.; Xu, L. Jiao tai wan attenuates hepatic lipid accumulation in type 2 diabetes mellitus. Evid.-Based Complement. Altern. Med. 2013. [Google Scholar] [CrossRef]
- Chen, G.; Lu, F.; Xu, L.; Dong, H.; Yi, P.; Wang, F.; Huang, Z.; Zou, X. The anti-diabetic effects and pharmacokinetic profiles of berberine in mice treated with Jiao-Tai-Wan and its compatibility. Phytomedicine 2013, 20, 780–786. [Google Scholar] [CrossRef]
- Gruenwald, J.; Freder, J.; Armbruester, N. Cinnamon and health. Crit. Rev. Food Sci. Nutr. 2010, 50, 822–834. [Google Scholar] [CrossRef] [PubMed]
- Ribeiro-Santos, R.; Andrade, M.; Madella, D.; Martinazzo, A.P.; Moura, L.D.G.; de Melo, N.R.; Sanches-Silva, A. Revisiting an ancient spice with medicinal purposes: Cinnamon. Trends Food Sci. Technol. 2017, 62, 154–169. [Google Scholar] [CrossRef]
- Hamidpour, R.; Hamidpour, M.; Hamidpour, S.; Shahlari, M. Cinnamon from the selection of traditional applications to its novel effects on the inhibition of angiogenesis in cancer cells and prevention of Alzheimer’s disease, and a series of functions such as antioxidant, anticholesterol, antidiabetes, antibacterial, antifungal, nematicidal, acaracidal, and repellent activities. J. Tradit. Complement. Med. 2015, 5, 66–70. [Google Scholar] [PubMed]
- Hariri, M.; Ghiasvand, R. Cinnamon and Chronic Diseases. Adv. Exp. Med. Biol. 2016, 929, 1–24. [Google Scholar] [PubMed]
- Kawatra, P.; Rajagopalan, R. Cinnamon: Mystic powers of a minute ingredient. Pharm. Res. 2015. [Google Scholar] [CrossRef] [PubMed]
- Rao, P.V.; Gan, S.H. Cinnamon: A Multifaceted Medicinal Plant. Evid.-Based Complement. Altern. Med. 2014. [Google Scholar] [CrossRef]
- Jia, Q.; Liu, X.; Wu, X.; Wang, R.; Hu, X.; Li, Y.; Huang, C. Hypoglycemic activity of a polyphenolic oligomer-rich extract of Cinnamomum parthenoxylon bark in normal and streptozotocin-induced diabetic rats. Phytomedicine 2009, 16, 744–750. [Google Scholar] [CrossRef] [PubMed]
- Jiao, L.; Zhang, X.; Huang, L.; Gong, H.; Cheng, B.; Sun, Y.; Li, Y.; Liu, Q.; Zheng, L.; Huang, K. Proanthocyanidins are the major anti-diabetic components of cinnamon water extract. Food Chem. Toxicol. 2013, 56, 398–405. [Google Scholar] [CrossRef]
- Li, R.; Liang, T.; Xu, L.; Li, Y.; Zhang, S.; Duan, X. Protective effect of cinnamon polyphenols against STZ-diabetic mice fed high-sugar, high-fat diet and its underlying mechanism. Food Chem. Toxicol. 2013, 51, 419–425. [Google Scholar] [CrossRef]
- Chen, L.; Sun, P.; Wang, T.; Chen, K.; Jia, Q.; Wang, H.; Li, Y. Diverse mechanisms of antidiabetic effects of the different procyanidin oligomer types of two different cinnamon species on db/db mice. J. Agric. Food Chem. 2012, 60, 9144–9150. [Google Scholar] [CrossRef]
- Lu, Z.; Jia, Q.; Wang, R.; Wu, X.; Wu, Y.; Huang, C.; Li, Y. Hypoglycemic activities of A- and B-type procyanidin oligomer-rich extracts from different Cinnamon barks. Phytomedicine 2011, 18, 298–302. [Google Scholar] [CrossRef] [PubMed]
- Zumdick, S.; Deters, A.; Hensel, A. In vitro intestinal transport of oligomeric procyanidins (DP 2 to 4) across monolayers of Caco-2 cells. Fitoterapia 2012, 83, 1210–1217. [Google Scholar] [CrossRef]
- Shan, Y.Q.; Zhu, Y.P.; Pang, J.; Wang, Y.X.; Song, D.Q.; Kong, W.J.; Jiang, J.D. Tetrandrine potentiates the hypoglycemic efficacy of berberine by inhibiting P-glycoprotein function. Biol. Pharm. Bull. 2013, 36, 1562–1569. [Google Scholar] [CrossRef] [PubMed]
- Tradtrantip, L.; Namkung, W.; Verkman, A.S. Crofelemer, an antisecretory antidiarrheal proanthocyanidin oligomer extracted from Croton lechleri, targets two distinct intestinal chloride channels. Mol. Pharmacol. 2010, 77, 69–78. [Google Scholar] [CrossRef] [PubMed]
- Derosa, G.; Maffioli, P.; Cicero, A.F.G. Berberine on metabolic and cardiovascular risk factors: An analysis from preclinical evidences to clinical trials. Expert Opin. Biol. Ther. 2012, 12, 1113–1124. [Google Scholar] [CrossRef]
- Luiza Andreazza, N.; Vevert-Bizet, C.; Bourg-Heckly, G.; Sureau, F.; Jose Salvador, M.; Bonneau, S. Berberine as a photosensitizing agent for antitumoral photodynamic therapy: Insights into its association to low density lipoproteins. Int. J. Pharm. 2016, 510, 240–249. [Google Scholar] [CrossRef]
- Singh, I.P.; Mahajan, S. Berberine and its derivatives: A patent review (2009–2012). Expert Opin. Biol. Ther. 2013, 23, 215–231. [Google Scholar] [CrossRef]
- Vuddanda, P.R.; Chakraborty, S.; Singh, S. Berberine: A potential phytochemical with multispectrum therapeutic activities. Expert Opin. Investig. Drugs 2010, 19, 1297–1307. [Google Scholar] [CrossRef]
- Sun, P.; Wang, T.; Chen, L.; Yu, B.W.; Jia, Q.; Chen, K.X.; Fan, H.M.; Li, Y.M.; Wang, H.Y. Trimer procyanidin oligomers contribute to the protective effects of cinnamon extracts on pancreatic beta-cells in vitro. Acta Pharmacol. Sin. 2016, 37, 1083–1090. [Google Scholar] [CrossRef]
- Martins, A.; Vasas, A.; Schelz, Z.; Viveiros, M.; Molnar, J.; Hohmann, J.; Amaral, L. Constituents of Carpobrotus edulis inhibit P-glycoprotein of MDR1-transfected mouse lymphoma cells. Anticancer Res. 2010, 30, 829–835. [Google Scholar]
- He, L.; Zhao, C.; Yan, M.; Zhang, L.Y.; Xia, Y.Z. Inhibition of P-glycoprotein function by procyanidine on blood-brain barrier. Phytother. Res. 2009, 23, 933–937. [Google Scholar] [CrossRef] [PubMed]
- Chen, L.; Sun, P.; Wang, T.; Xu, N.; Jia, Q.; Li, Y.M.; Chen, K.X. Hypoglycemic activity of polyphenol-rich extract from Cinnamomun japonicum Sieb. Chin. Tradit. Patent Med. 2014, 36, 229–235. [Google Scholar]
- Zhao, B.X.; Sun, Y.B.; Wang, S.Q.; Duan, L.; Huo, Q.L.; Ren, F.; Li, G.F. Grape seed procyanidin reversal of p-glycoprotein associated multi-drug resistance via down-regulation of NF-kappaB and MAPK/ERK mediated YB-1 activity in A2780/T cells. PLoS ONE 2013, 8, e71071. [Google Scholar]
- Shan, Y.Q.; Ren, G.; Wang, Y.X.; Pang, J.; Zhao, Z.Y.; Yao, J.; You, X.F.; Si, S.Y.; Kong, W.J.; Jiang, J.D. Berberine analogue IMB-Y53 improves glucose-lowering efficacy by averting cellular efflux especially P-glycoprotein efflux. Metabolism 2013, 62, 446–456. [Google Scholar] [CrossRef] [PubMed]
Sample Availability: Samples of the compounds are not available from the authors. |


| Papp(A-B, ×10−6) | Papp(B-A, ×10−6) | R = Papp(B-A)/Papp(A-B) | |
|---|---|---|---|
| BB | 0.146 ± 0.012 | 1.001 ± 0.049 | 7.74 ± 1.13 |
| BB + VER | 0.337 ± 0.040 *** | 0.654 ± 0.020 *** | 2.23 ± 0.41 *** |
| BB + OPCs | 0.137 ± 0.021 | 0.489 ± 0.030 *** | 4.10 ± 0.78 ** |
© 2018 by the authors. Licensee MDPI, Basel, Switzerland. This article is an open access article distributed under the terms and conditions of the Creative Commons Attribution (CC BY) license (http://creativecommons.org/licenses/by/4.0/).
Share and Cite
Zhang, H.; Wang, X.; Wang, T.; Chen, K.; Wang, H.; Jia, Q.; Li, Y. Enhancement of Berberine Hypoglycemic Activity by Oligomeric Proanthocyanidins. Molecules 2018, 23, 3318. https://doi.org/10.3390/molecules23123318
Zhang H, Wang X, Wang T, Chen K, Wang H, Jia Q, Li Y. Enhancement of Berberine Hypoglycemic Activity by Oligomeric Proanthocyanidins. Molecules. 2018; 23(12):3318. https://doi.org/10.3390/molecules23123318
Chicago/Turabian StyleZhang, Haoyue, Xueping Wang, Ting Wang, Kaixian Chen, Heyao Wang, Qi Jia, and Yiming Li. 2018. "Enhancement of Berberine Hypoglycemic Activity by Oligomeric Proanthocyanidins" Molecules 23, no. 12: 3318. https://doi.org/10.3390/molecules23123318
APA StyleZhang, H., Wang, X., Wang, T., Chen, K., Wang, H., Jia, Q., & Li, Y. (2018). Enhancement of Berberine Hypoglycemic Activity by Oligomeric Proanthocyanidins. Molecules, 23(12), 3318. https://doi.org/10.3390/molecules23123318