Article

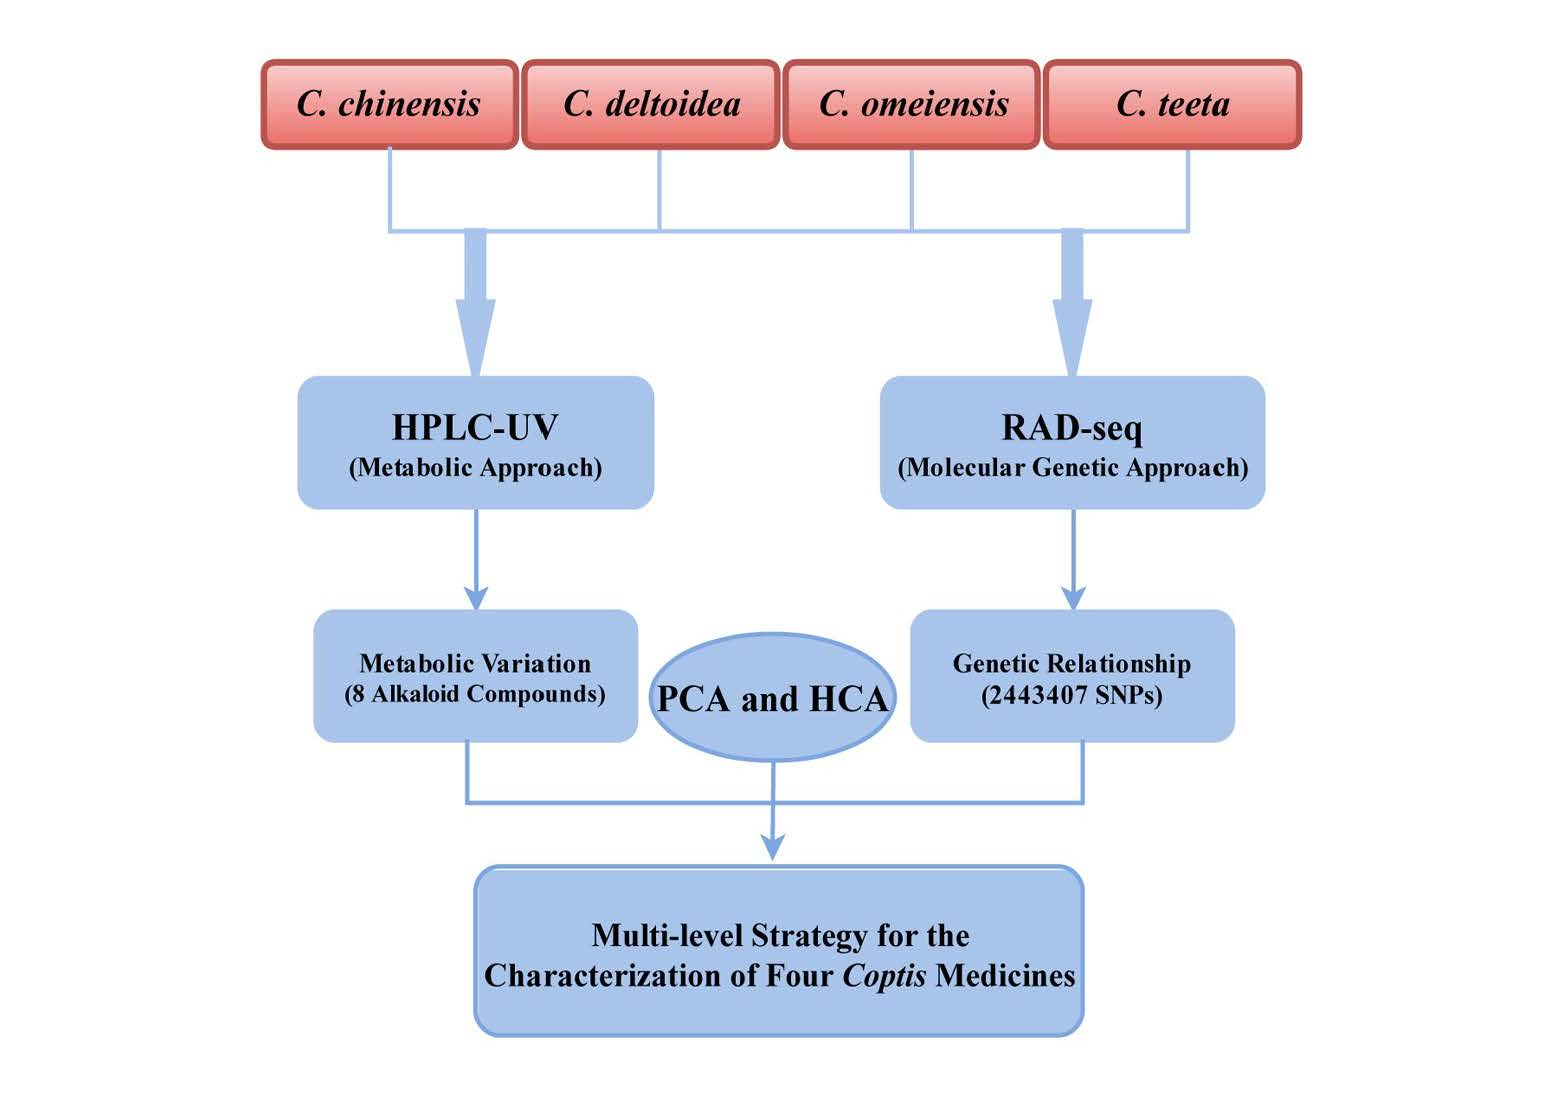
A Multi-Level Strategy Based on Metabolic and Molecular Genetic Approaches for the Characterization of Different Coptis Medicines Using HPLC-UV and RAD-seq Techniques

1
State Key Laboratory Breeding Base of Systematic Research, Development and Utilization of Chinese Medicine Resources, Chengdu University of Traditional Chinese Medicine, Chengdu 611137, China
2
School of Pharmacy, Chengdu University of Traditional Chinese Medicine, Chengdu 611137, China
3
The engineering and technology research center for the protection and development of Yalian resources in Sichuan Province, Meishan 620360, Sichuan, China
*
Author to whom correspondence should be addressed.
Molecules 2018, 23(12), 3090; https://doi.org/10.3390/molecules23123090
Submission received: 1 November 2018 / Revised: 23 November 2018 / Accepted: 24 November 2018 / Published: 27 November 2018

Abstract

:
Coptis plants (Ranunculaceae) to have played an important role in the prevention and treatment human diseases in Chinese history. In this study, a multi-level strategy based on metabolic and molecular genetic methods was performed for the characterization of four Coptis herbs (C. chinensis, C. deltoidea, C. omeiensis and C. teeta) using high performance liquid chromatography-ultraviolet (HPLC-UV) and restriction site-associated DNA sequencing (RAD-seq) techniques. Protoberberine alkaloids including berberine, palmatine, coptisine, epiberberine, columbamine, jatrorrhizine, magnoflorine and groenlandicine in rhizomes were identified and determined based on the HPLC-UV method. Among them, berberine was demonstrated as the most abundant compound in these plants. RAD-seq was applied to discover single nucleotide polymorphisms (SNPs) data. A total of 44,747,016 reads were generated and 2,443,407 SNPs were identified in regarding to four plants. Additionally, with respect to complicated metabolic and SNP data, multivariable statistical methods of principal component analysis (PCA) and hierarchical cluster analysis (HCA) were successively applied to interpret the structure characteristics. The metabolic variation and genetic relationship among different Coptis plants were successfully illustrated based on data visualization. Summarily, this comprehensive strategy has been proven as a reliable and effective approach to characterize Coptis plants, which can provide additional information for their quality assessment.

Graphical Abstract

1. Introduction

Traditional Chinese medicine which has a long application history is increasingly used and widely accepted at present [1,2]. Multiple studies have shown that they can be used for comprehensive and effective prevention, and also for treatment of many major diseases such as cardiovascular disease, diabetes mellitus, cancer, etc. [3,4,5]. Although they have good curative effects, many problems related to medicinal quality were noted, hindering their further application [6]. For example, in some traditional Chinese medicines multi-origin phenomena always exist, meaning that they originate from more than one species and share the same Chinese name [7]. In order to overcome these obstacles, researchers have paid much attention on the multi-aspect and multi-level characterization of traditional Chinese medicines based on diverse techniques and methods [8,9,10,11].
Medicinal Coptis plants (Ranunculaceae) have been widely used for preventing and treating human diseases for centuries in China. Their dried rhizomes, named Rhizoma Coptidis (Huanglian in Chinese) can be utilized as anti-inflammatory, antibacterial, and antidiabetic agents. [12,13]. Currently, Rhizoma Coptidis are mainly derived from several Coptis plants including Coptis chinensis Franch., C. deltoidea C.Y. Cheng et Hsiao., C. omeiensis C.Y. Cheng or C. teeta Wall., which are mostly distributed in Southwest China and the wild resources are almost endangered [14]. Comparatively, C. chinensis is a common raw material with a higher cultivated production. The other three species are always used as the substitutes because of their similar medicinal constituents and therapeutic effects, however, in order to perform a better-quality assessment, it is essential to develop a reliable strategy for characterizing the variation among these Coptis plants for a reasonable exploitation of these medicinal resources.
Nowadays, secondary metabolites have been demonstrated to product a variety of bioactivities for protecting human health. Phytochemical and pharmacological studies on Coptis plants have indicated that their metabolites are very similar and the major active components are protoberberine alkaloids including berberine, palmatine, jatrorrhizine, coptisine, columbamine and epiberberine [13,15]. These constituents display many medicinal properties such as antiviral, anti-inflammatory and antimicrobial activities [16,17,18]. In recent years, many analytical methods including high performance liquid chromatography-ultraviolet (HPLC-UV), ultra-performance liquid chromatography (UPLC) and proton nuclear magnetic resonance (1H-NMR) have been used to analyze these compounds in Coptis plants [19,20,21]. These studies have shown that their contents are obviously different among different species. For instance, the content of berberine which is regarded as a marker for quality control, is relatively higher in C. teeta and C. chinensis according to the research by He et al. [14]. However, these metabolic data from previous studies was not deeply interpreted, and multivariate statistical methods which contribute to search for the features of metabolic data should be appropriately applied for the characterization of main active metabolites in Coptis plants.
In addition to metabolic strategies, molecular genetics methods can perhaps further elucidate genetic divergence among different species, which is the foundation of phytochemical differentiation [22]. With the advent of next-generation sequencing (NGS) technologies, they have been proven useful for high-throughput genetic marker production and the large-scale discovery of genome-wide Single Nucleotide Polymorphisms (SNPs) in complex genomes [23]. SNPs are considered to be the most reliable genetic markers, with advantages of flexibility, rapidity and low error rate. Restriction site-associated DNA sequencing (RAD-seq) is one of the most recently developed genotyping methods based on NGS. It is a time and cost-effective technique which can generate sequence data adjacent to a large number of restriction enzyme digestion sites and reduce the complexity of large genomes for an easier SNP discovery. Moreover, this technique has been applied to identify genetic variants among different species with or without a published reference genome [24,25]. For example, different Citrus species have been analyzed by this method [26], which is able to discriminate citrus varieties from closely related species. In addition, it has been proven to provide SNP data for other aims such as population genetics [27], species identification [28] and genetic mapping [29]. To the best of our knowledge, no study has been conducted for the characterization of Coptis plants in terms of RAD-seq technique.
As the final response to gene expression, the levels of metabolic products is regulated by genes to some extent. The information from genetic and metabolic platforms may have some relevance. In present, the combination of multi-omics techniques were commonly used to interpret the molecular and chemical characterizations of medicinal plants. In view of these aspects, the combination of these approaches can provide a more powerful evidence to search for the relationships among Coptis plants with the aid of multivariate statistical methods. In this study, we applied two low-cost and time effective techniques (HPLC-UV and RAD-seq) for the identification and characterization of four Coptis plants (C. chinensis, C. deltoidea, C. omeiensis and C. teeta) based on metabolic and molecular methods. HPLC-UV was used for quantitative determination of eight key alkaloids in these plants. Meanwhile, RAD-seq was applied to generate SNP data to characterize the difference in genome with respect to four species. Applying this comprehensive strategy, the objective of this study was going to develop a reliable and effective approach for the characterization of Coptis medicines to better control their quality.

2. Results

2.1. Results of Validation for HPLC-UV Method

The results of calibration curves, r2, LOD and LOQ are shown in Table 1. For all alkaloids, the correlation coefficient values (r2 ≥ 0.999) indicate good linear regressions within the investigated ranges. The relative standard deviations (RSD) are in the range of 0.29–1.95%, indicating an excellent stability and repeatability of this method. Recovery test was carried out to evaluate the accuracy of this method. The result for alkaloid compounds are ranged from 97.52% to 103.35% with RSDs less than 2.16%. According to the results of precision, stability, repeatability and recovery test (Table S2), the method was appropriate for the simultaneous detection and quantification of the eight alkaloids in Coptis rhizomes.

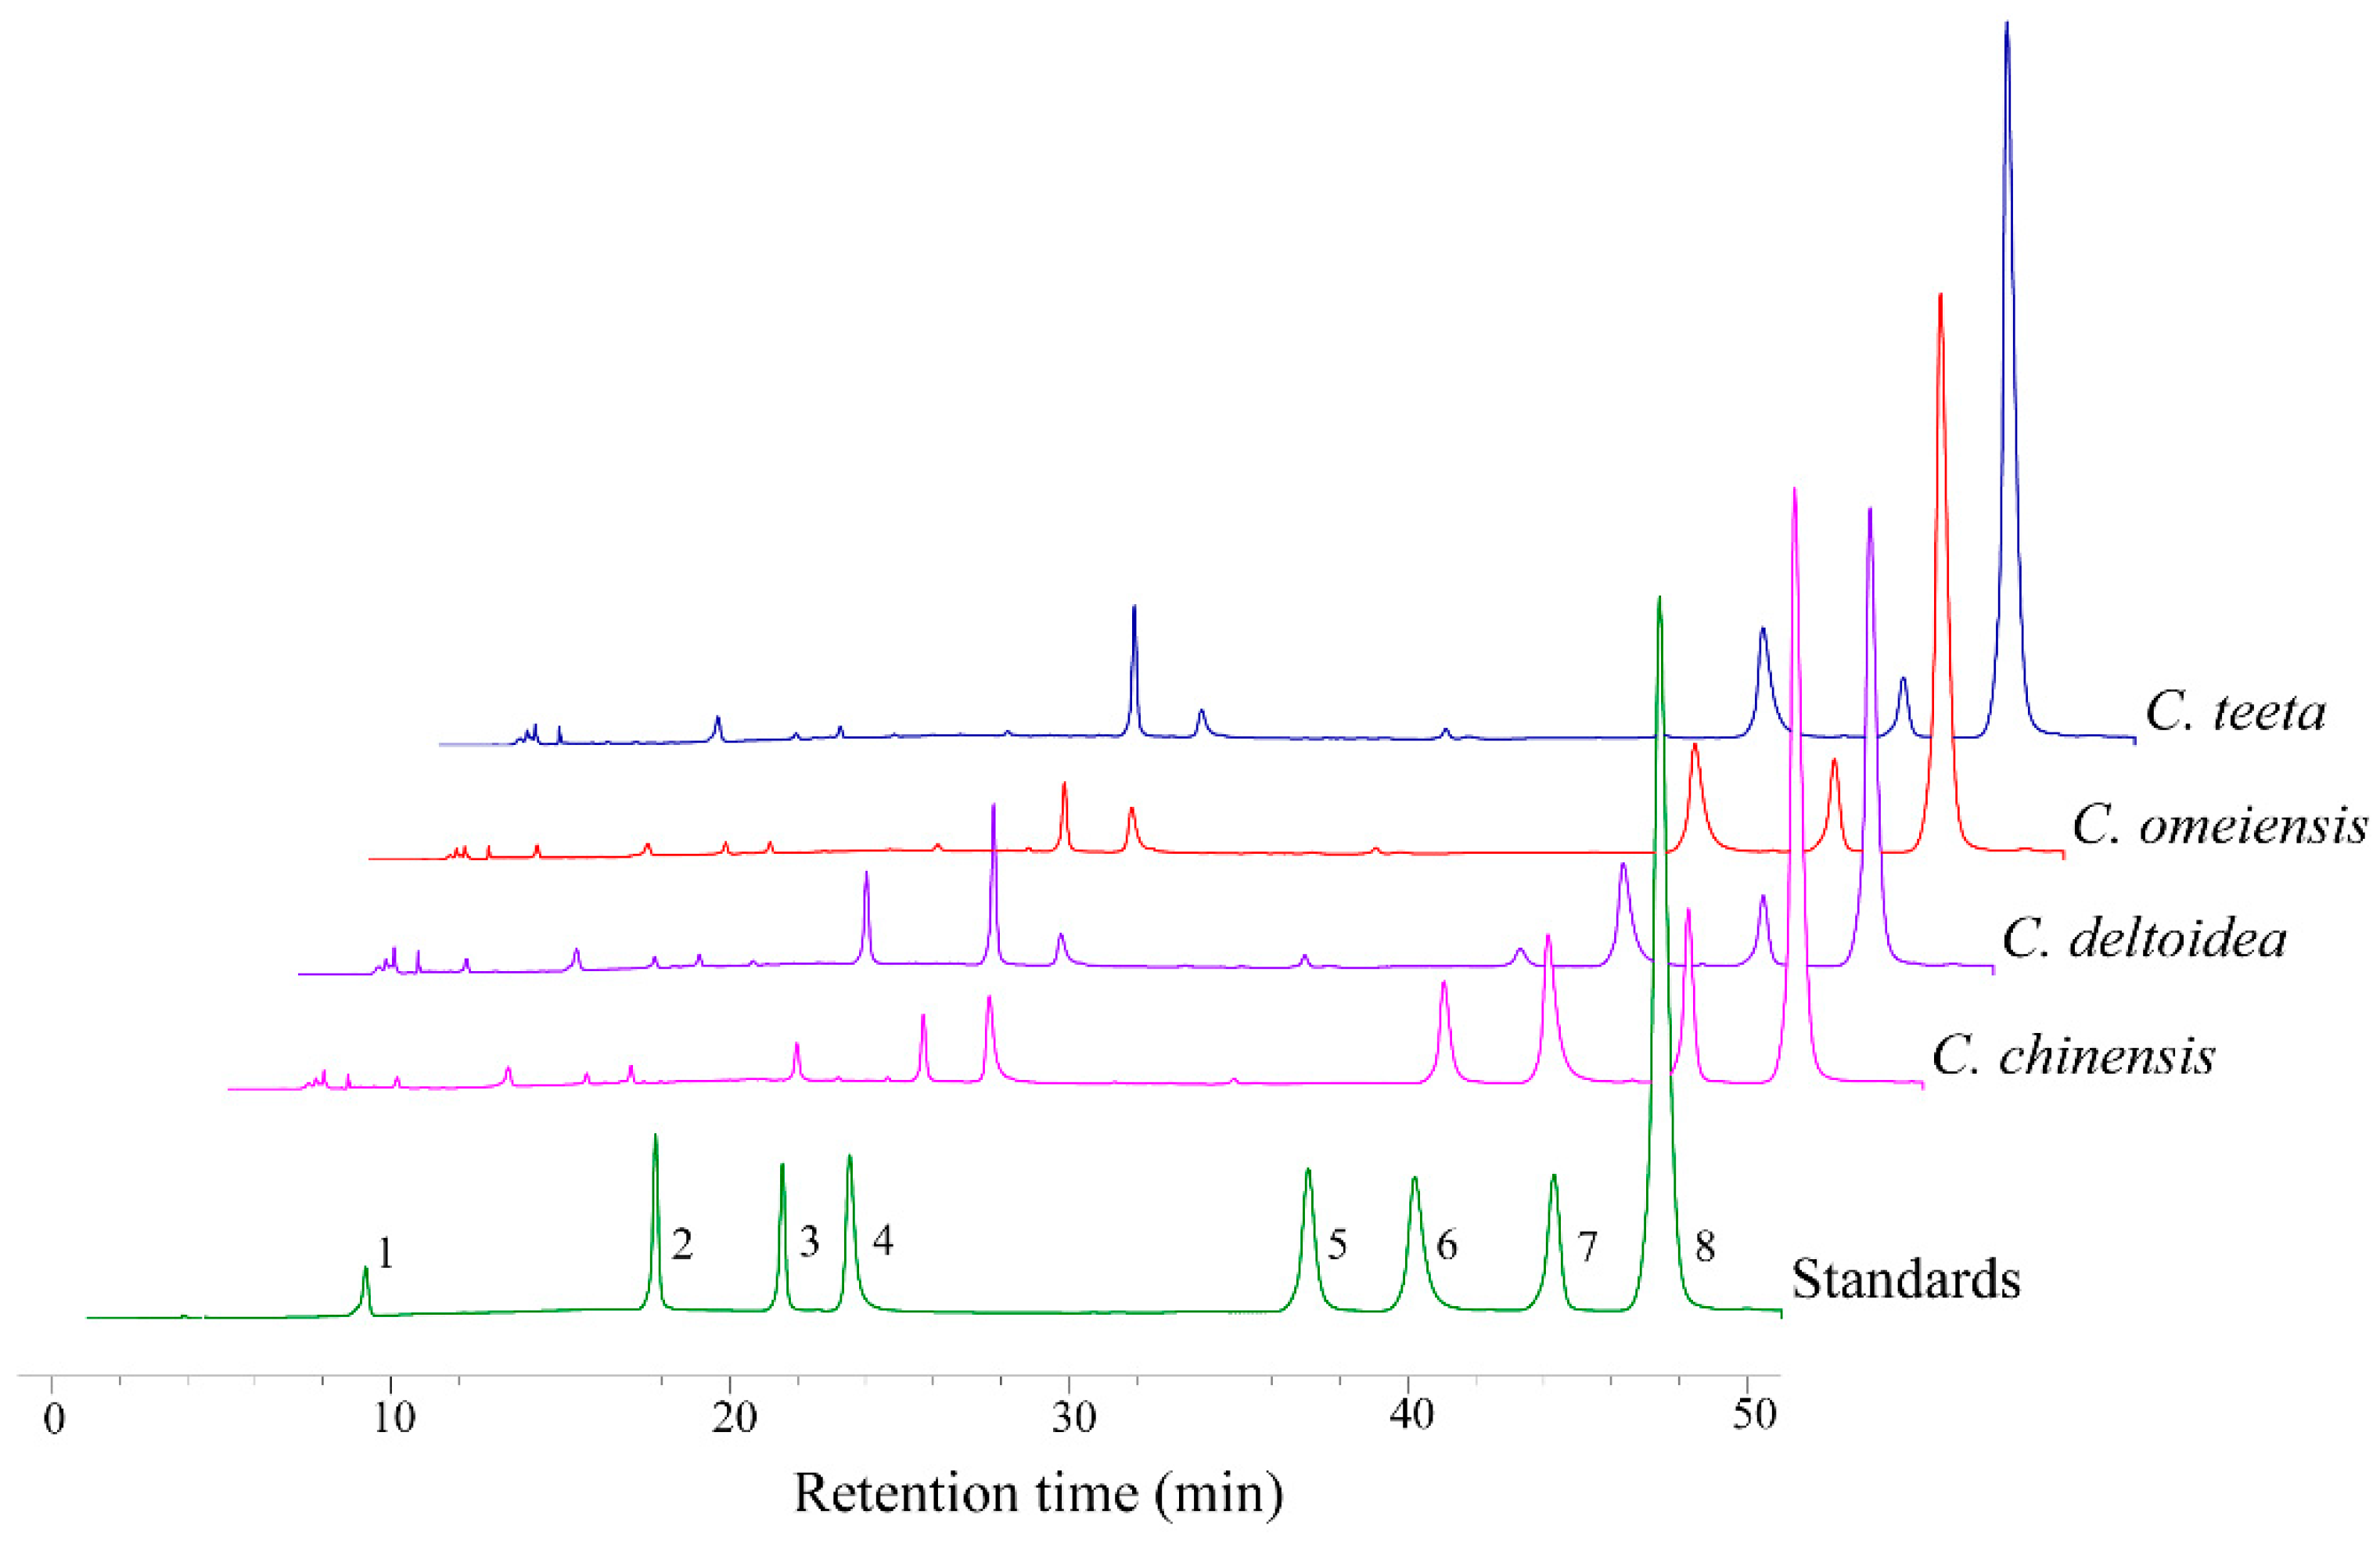
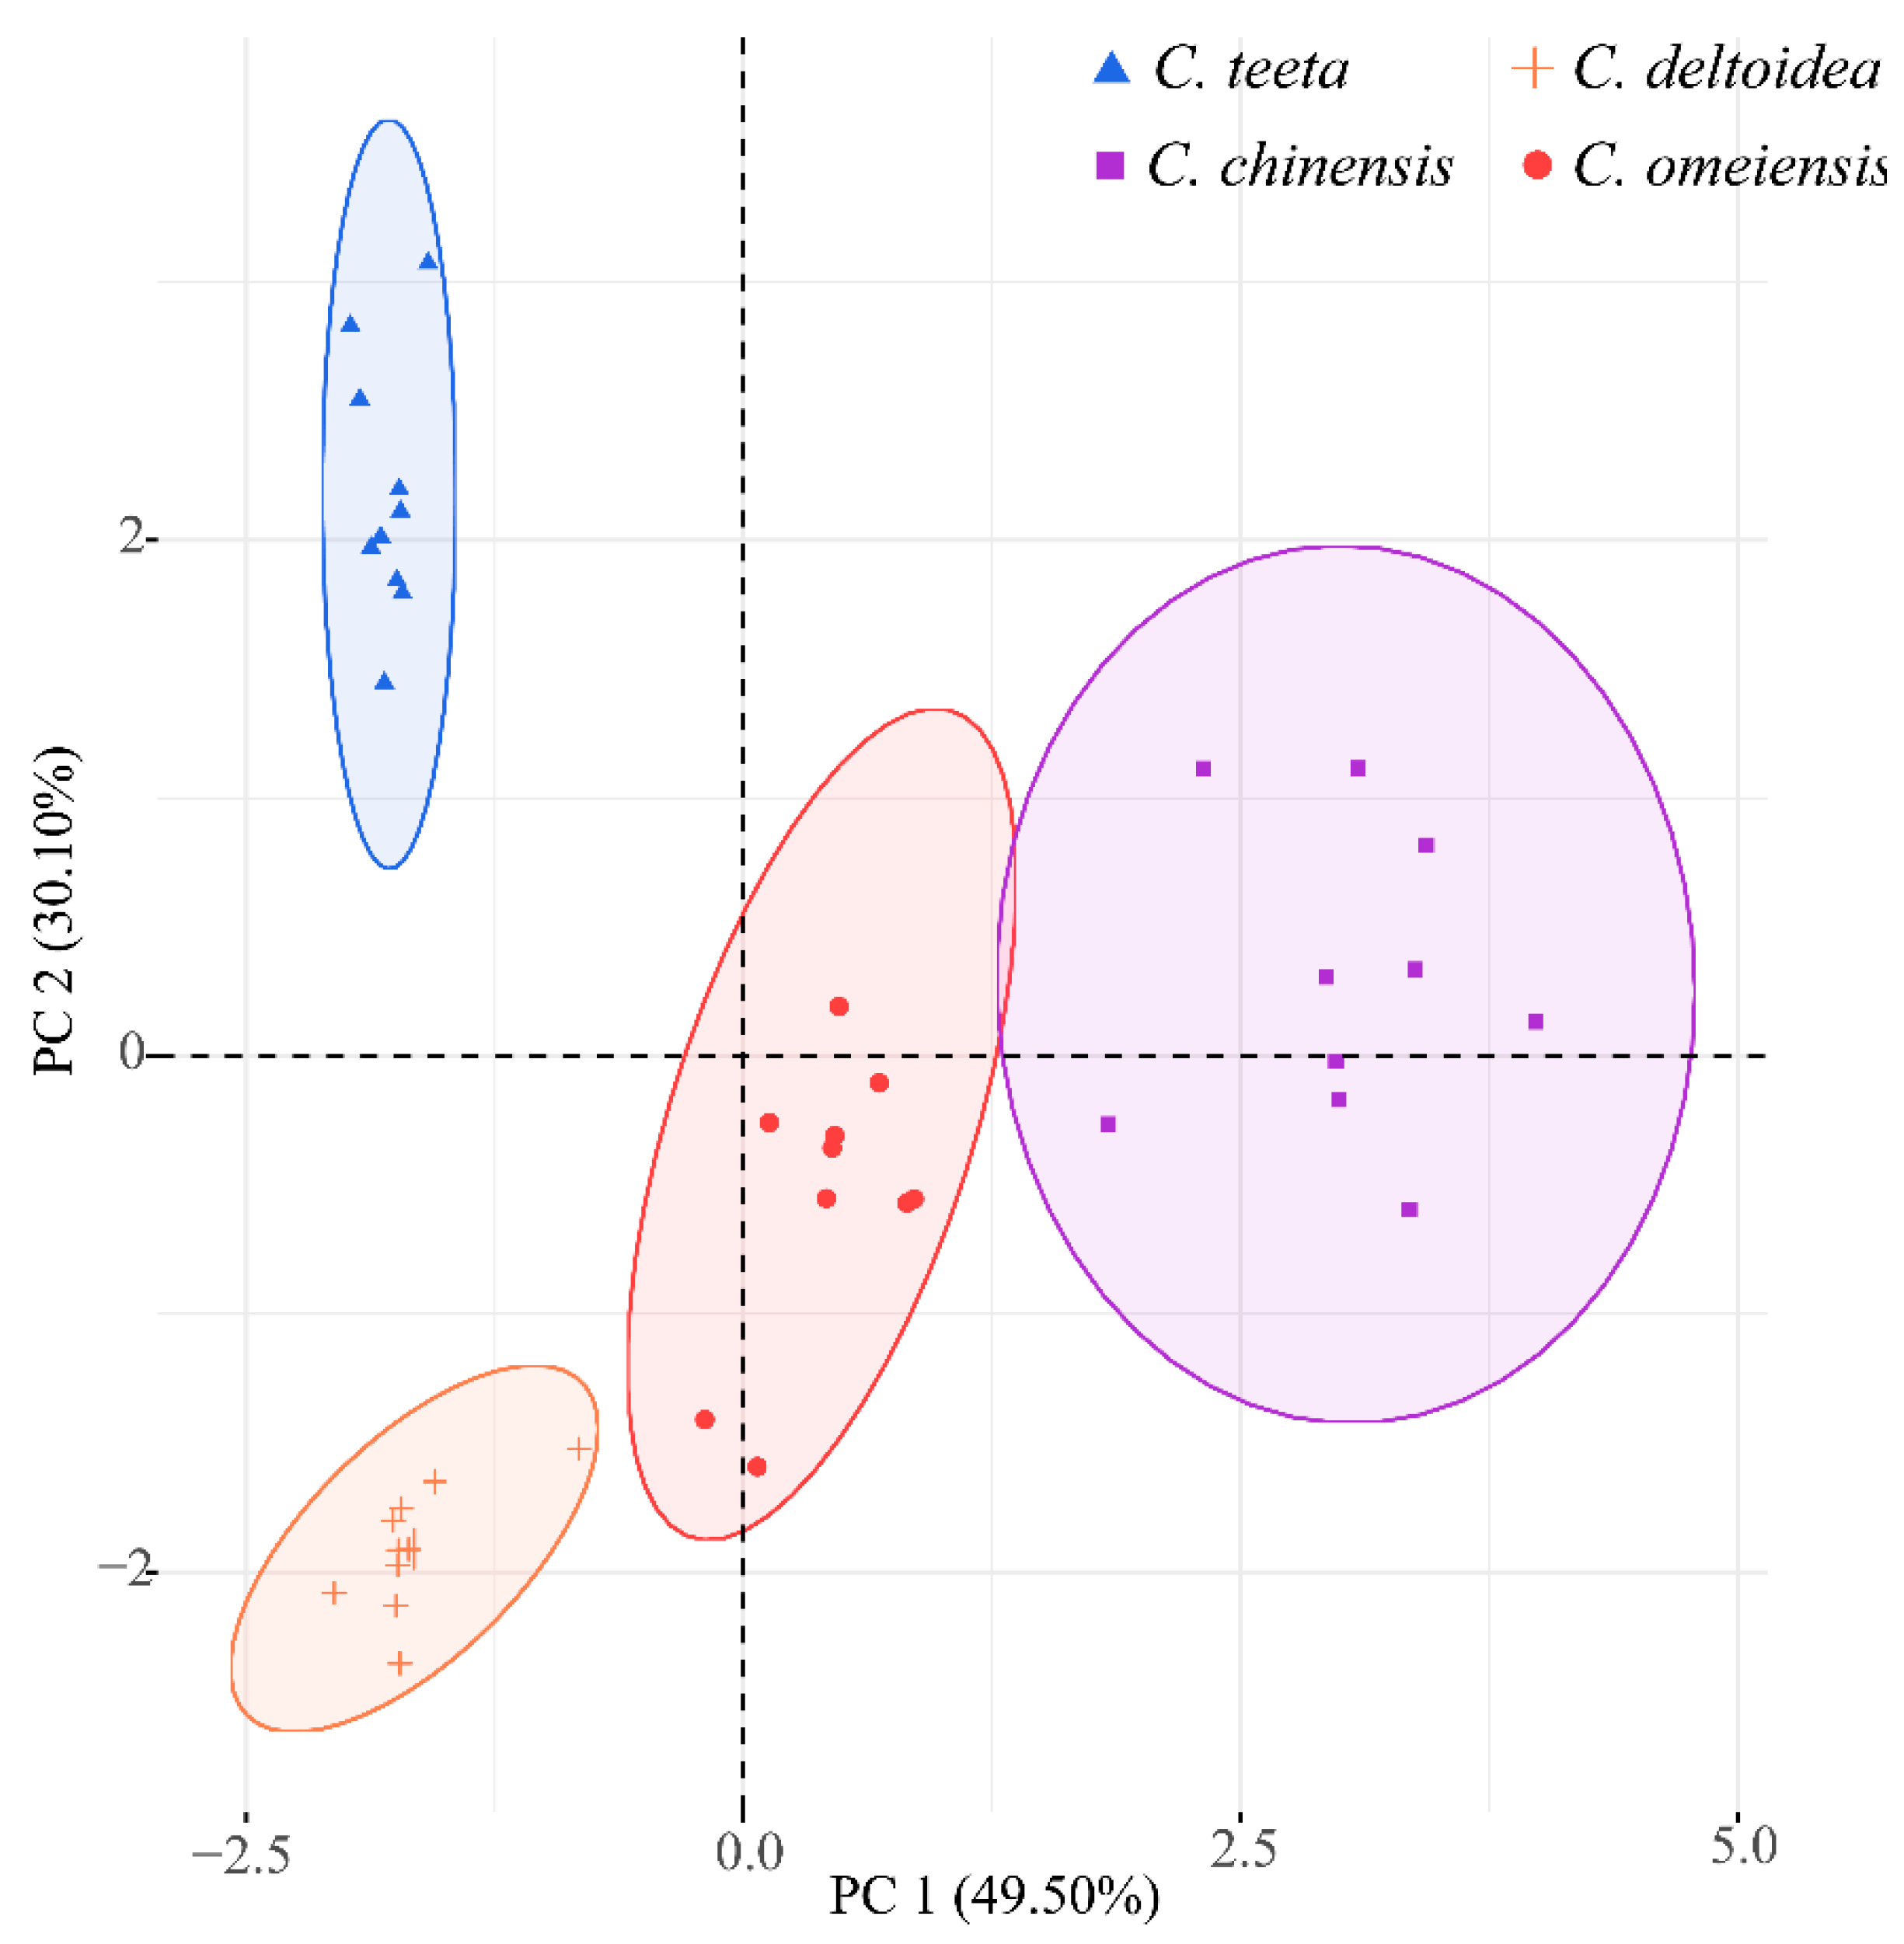
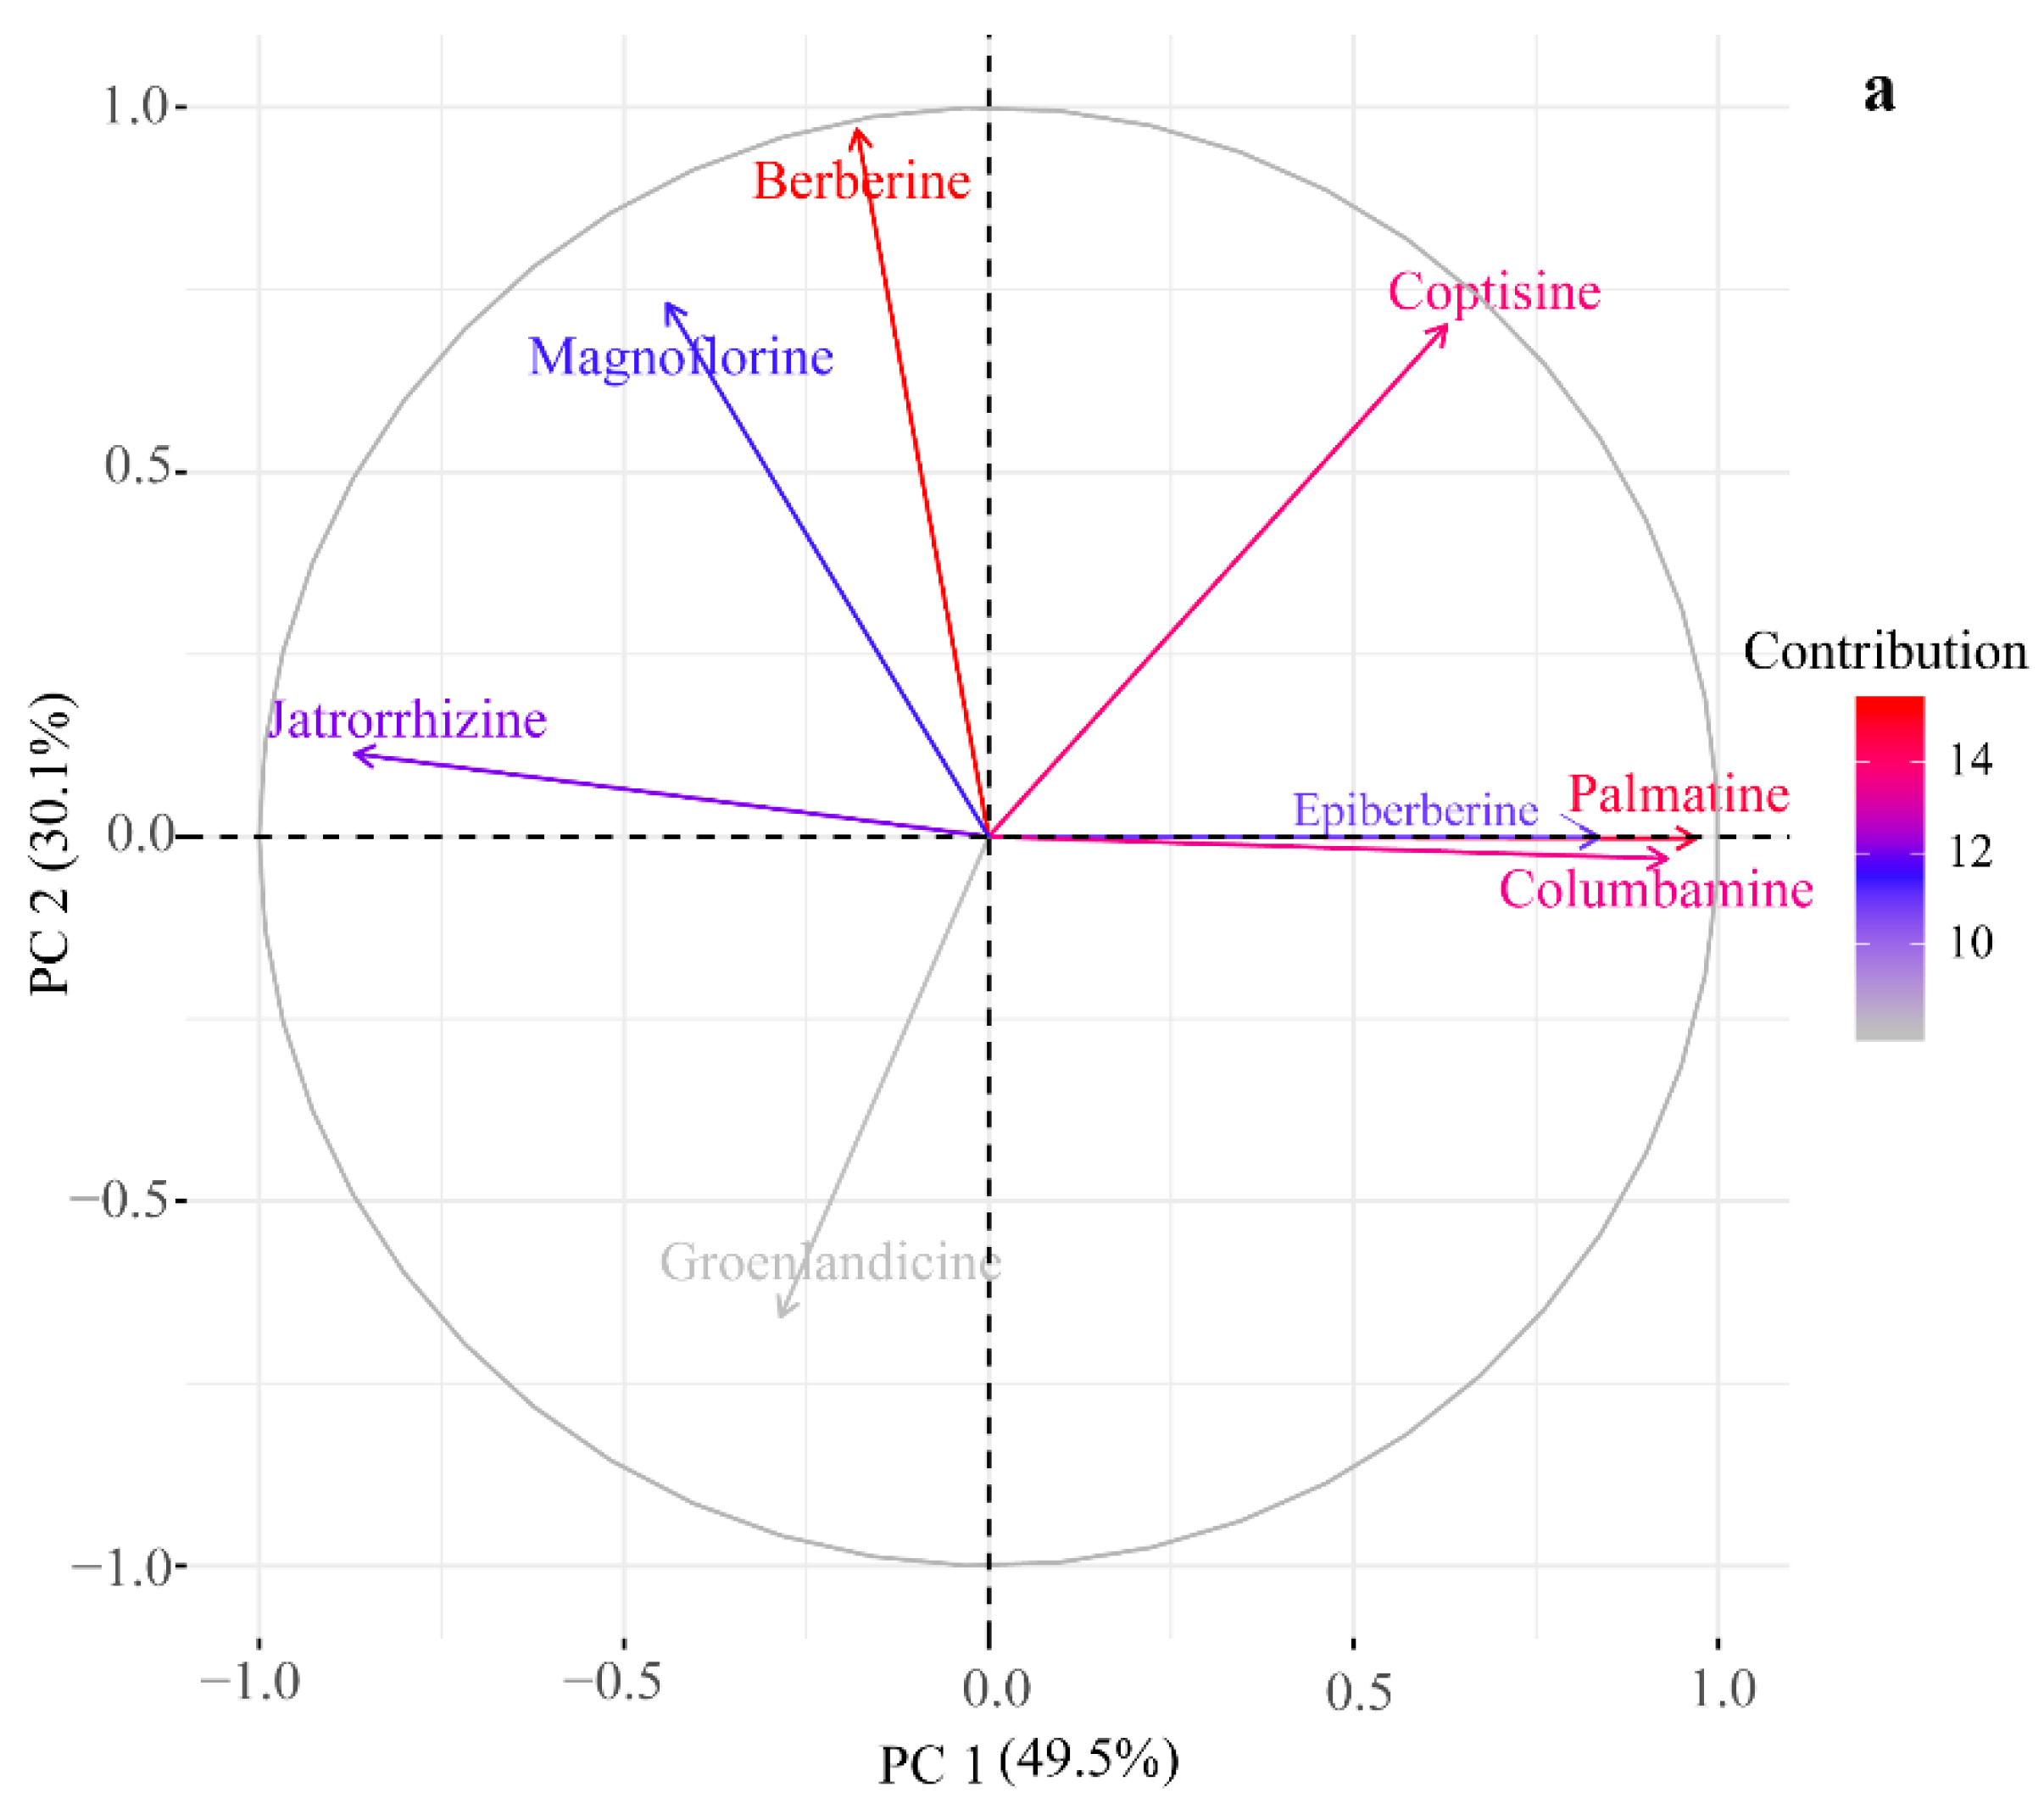
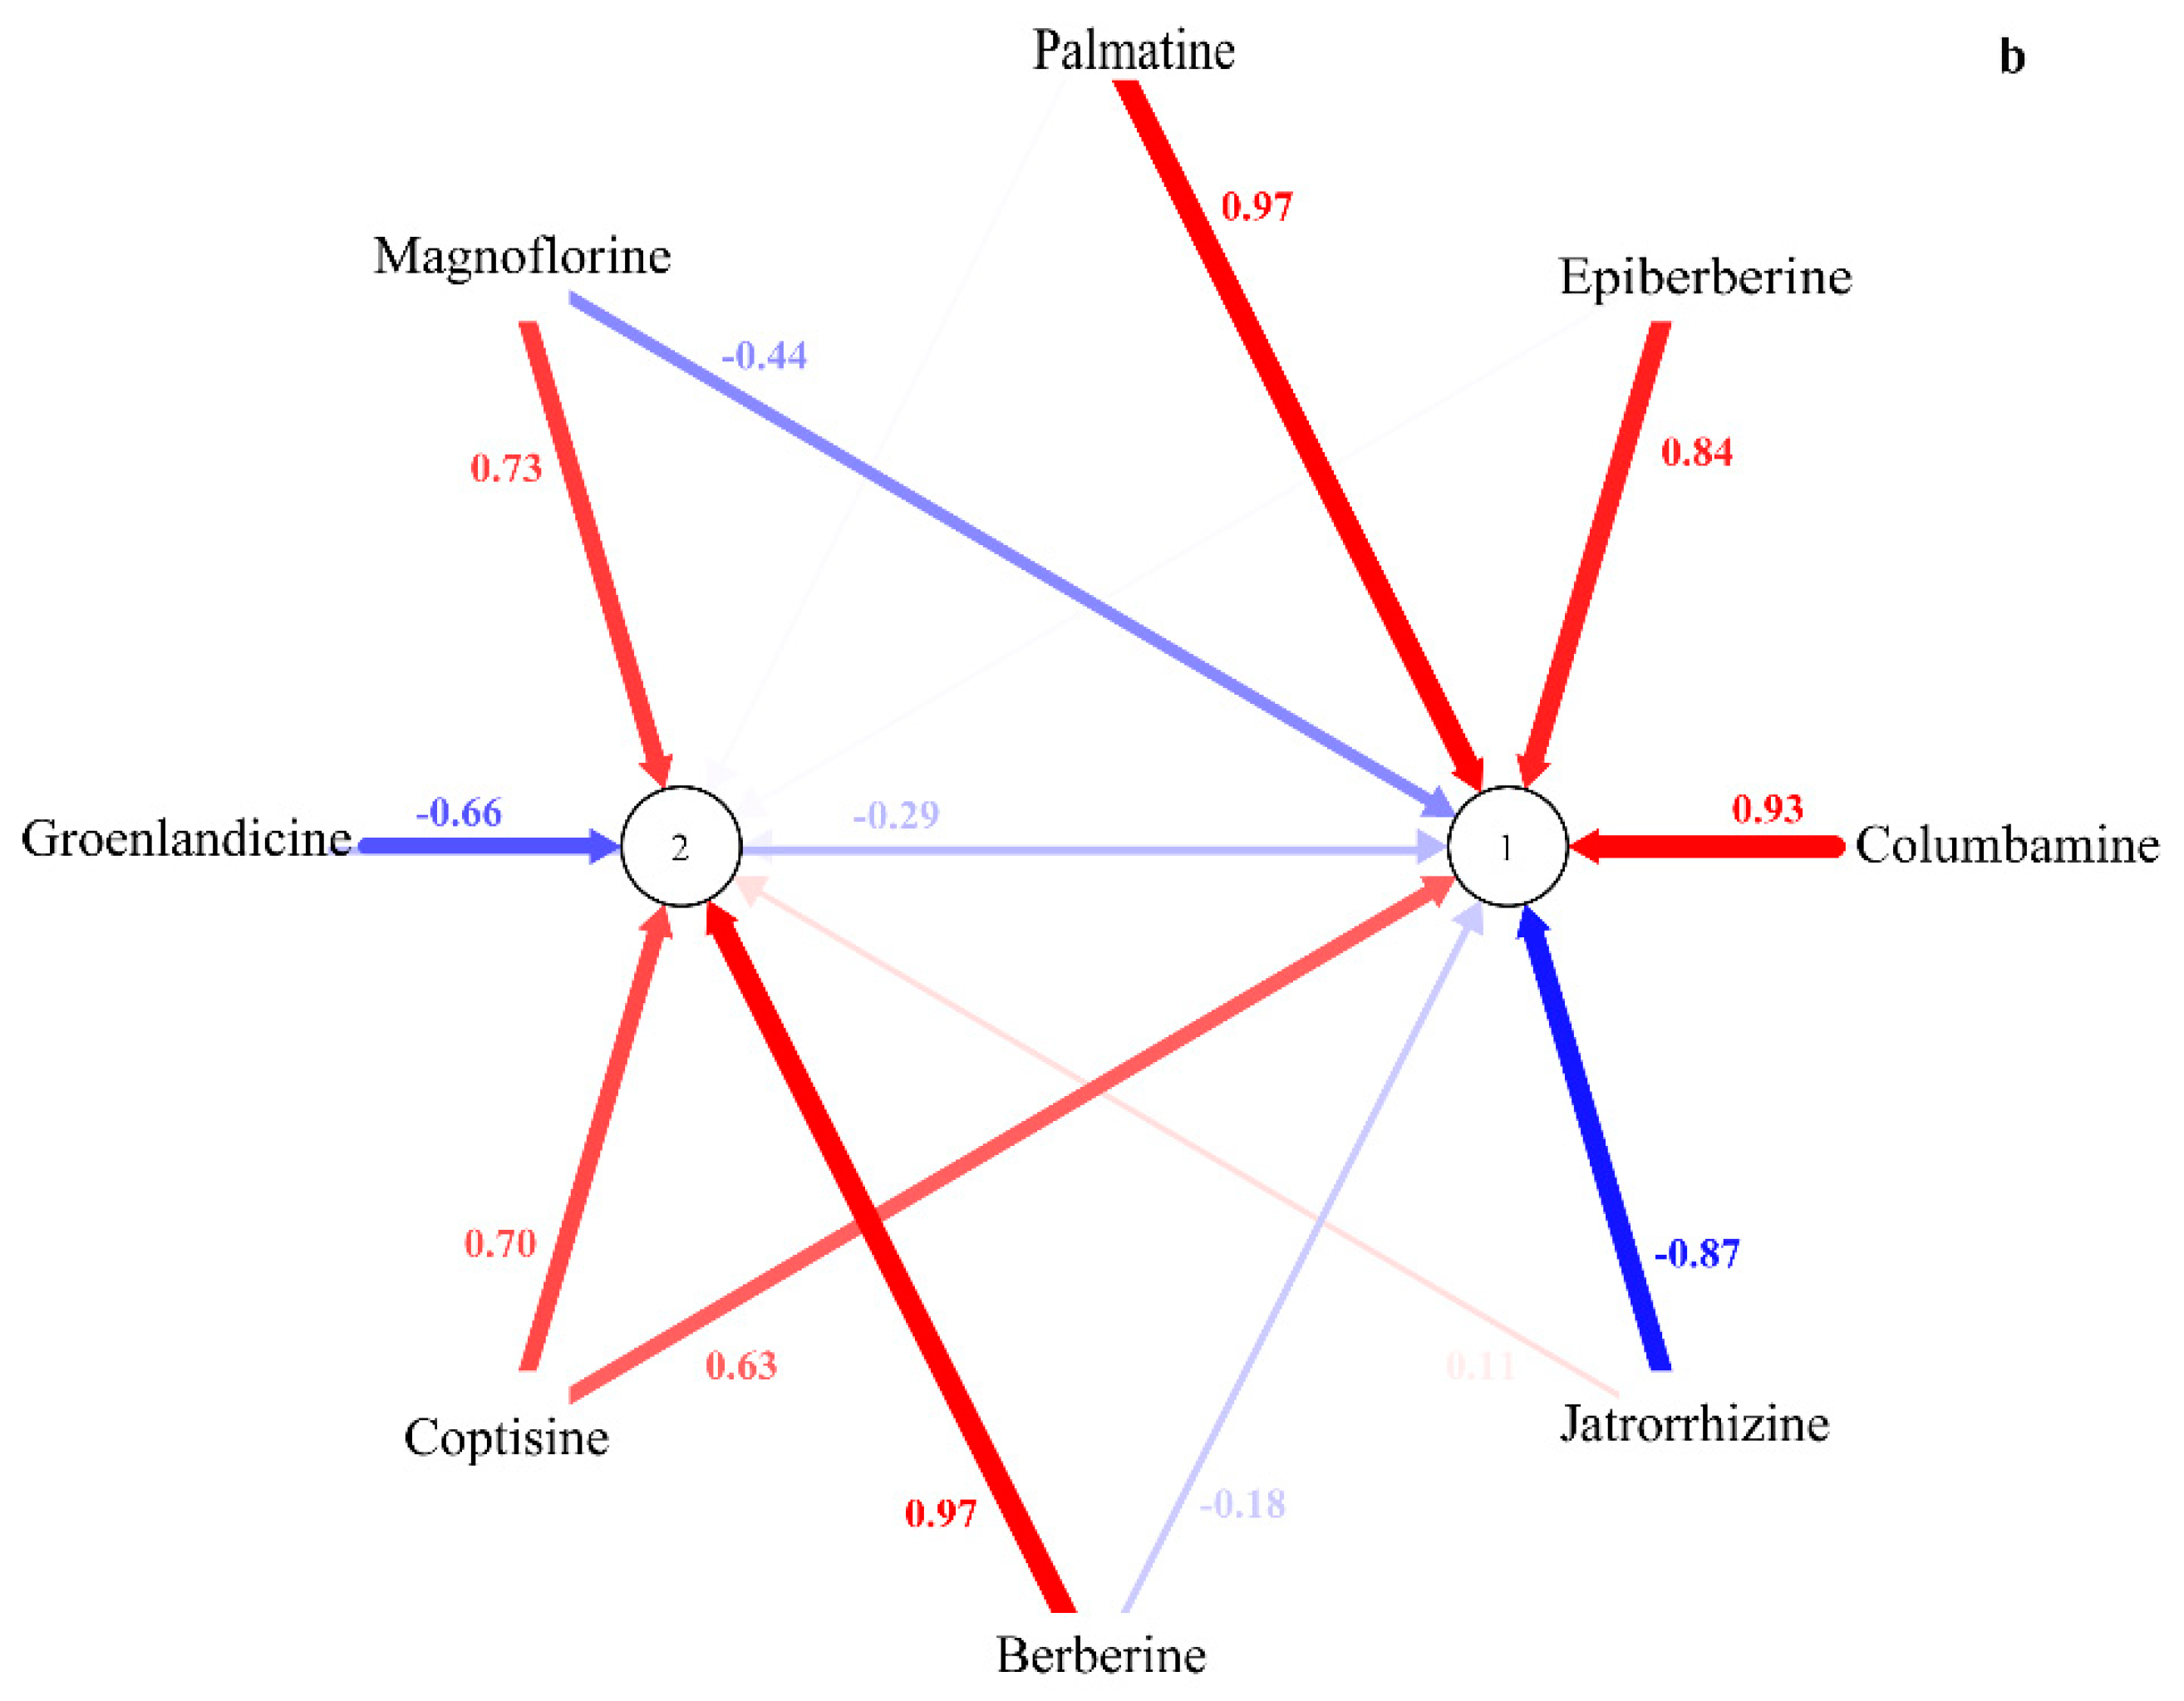
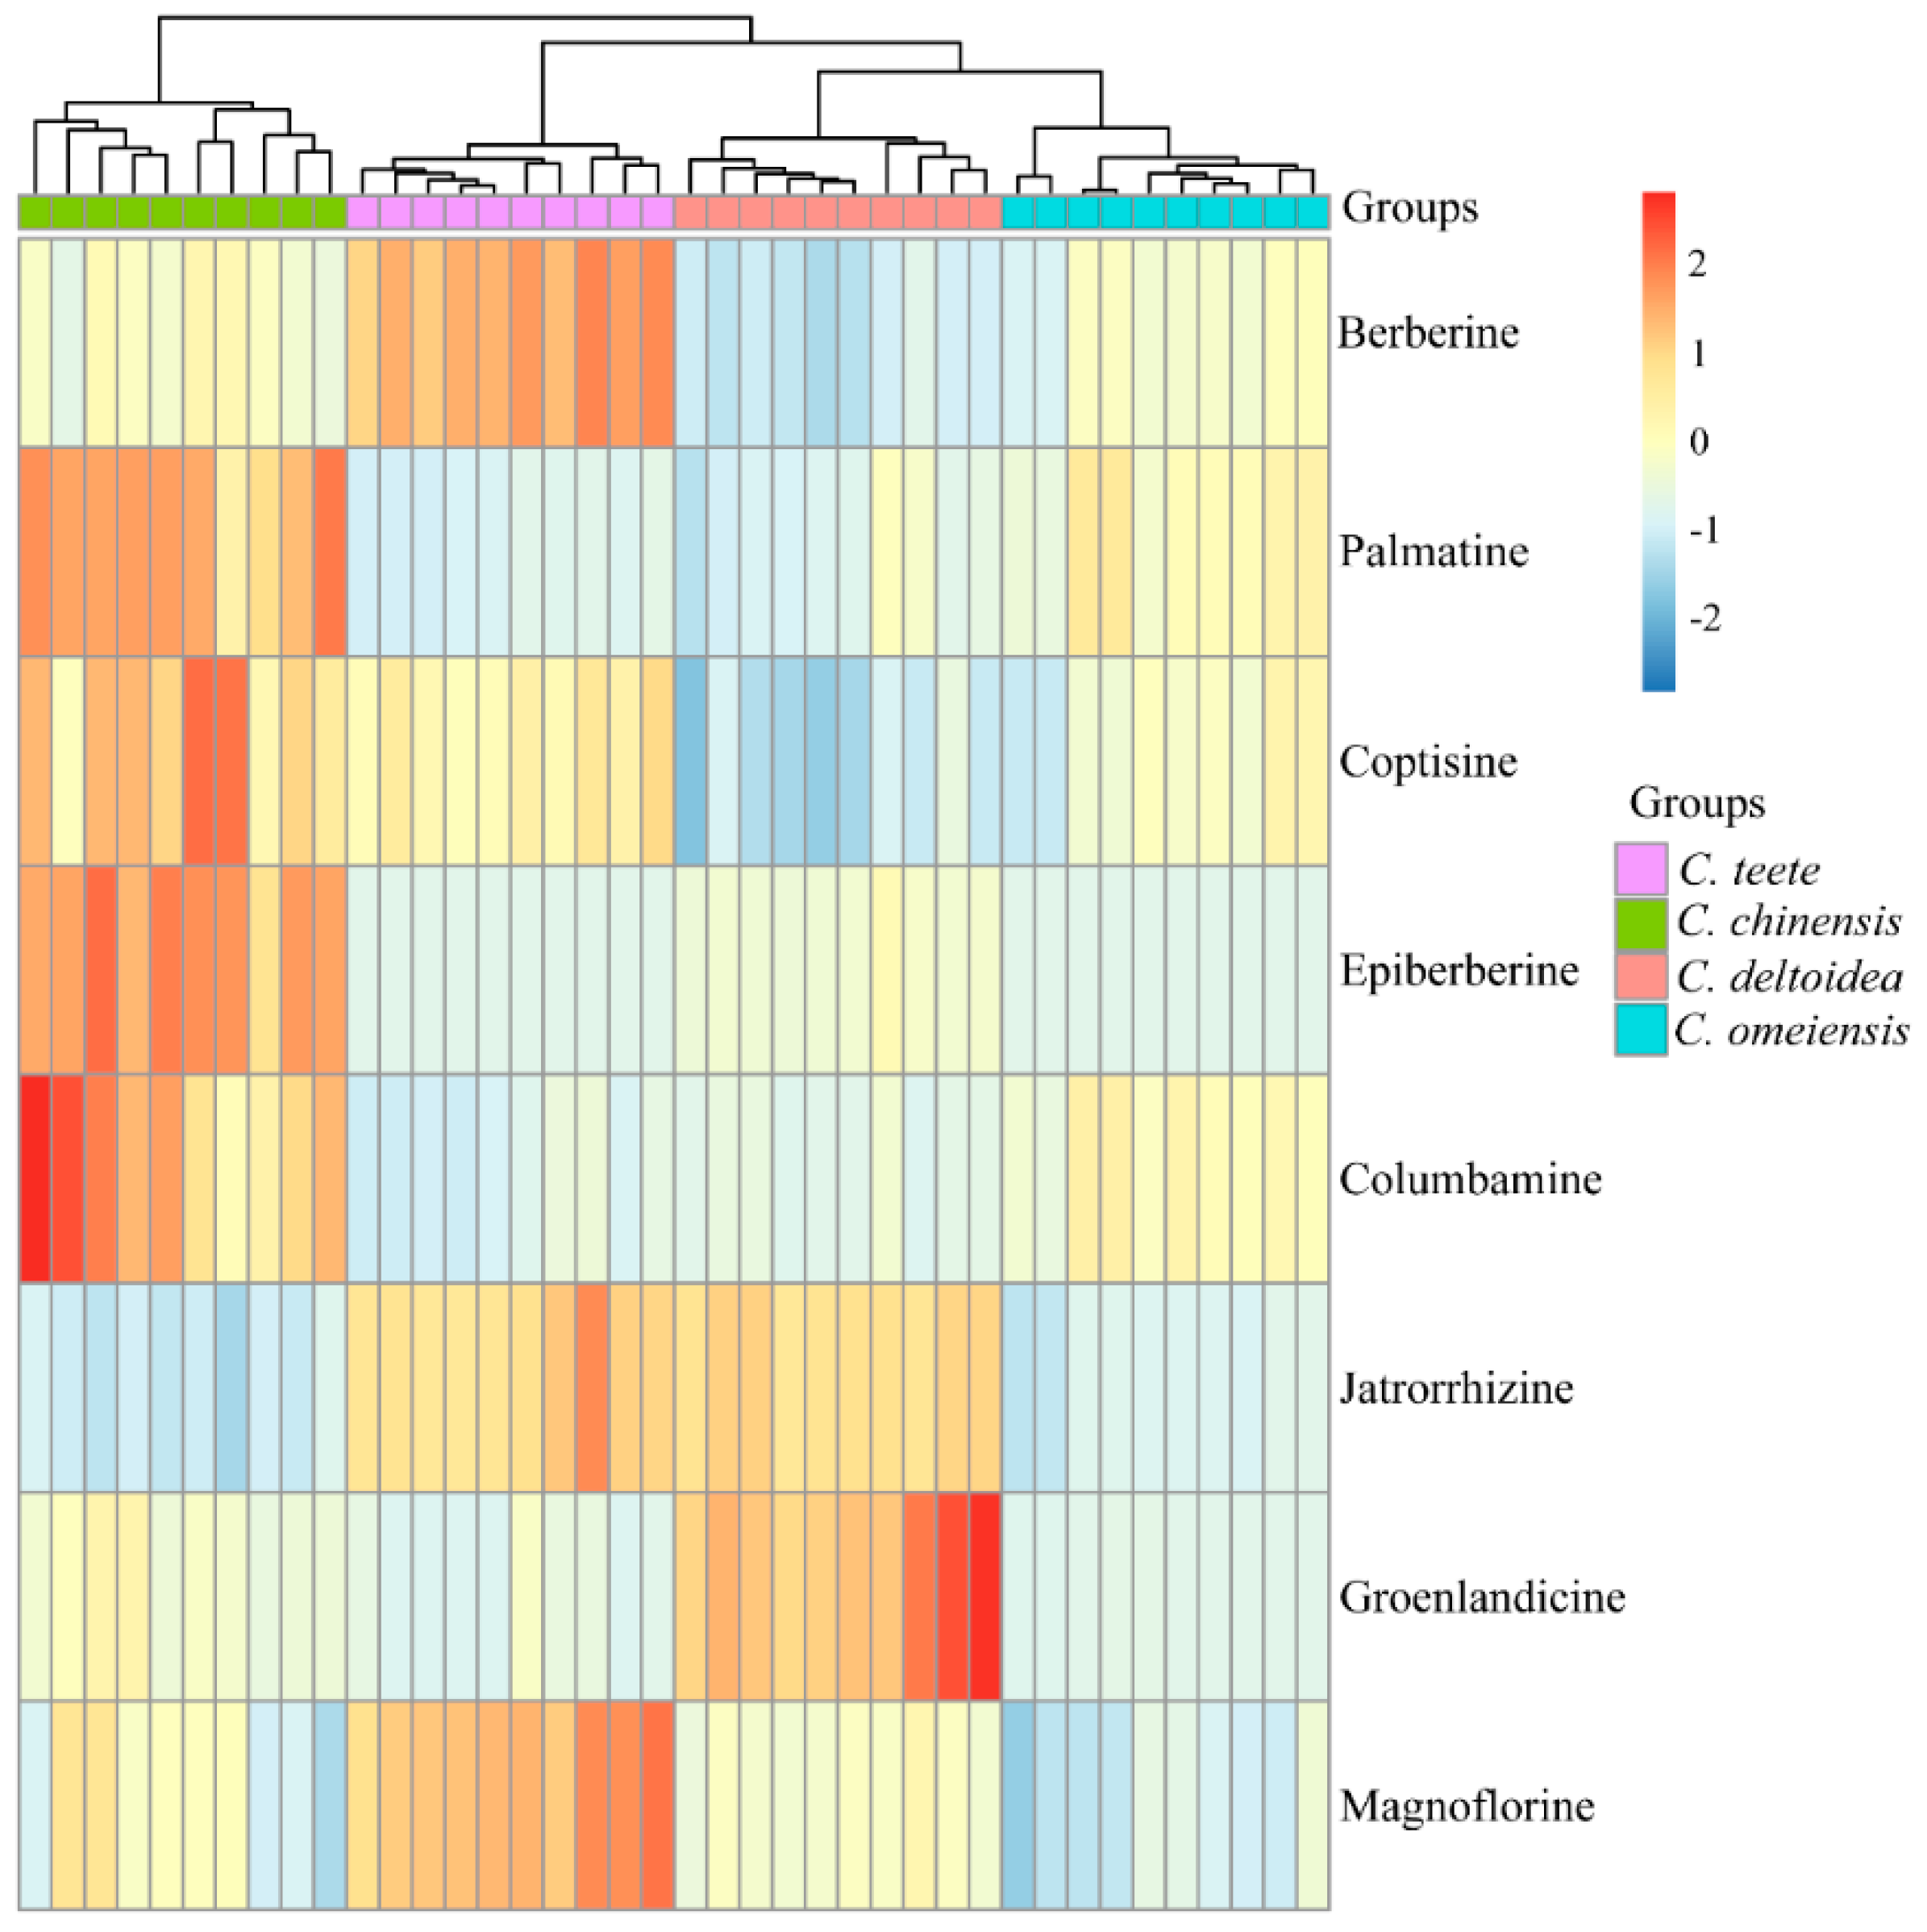
2.2. HPLC-UV Determination of Eight Alkaloids

As shown in Figure 1, the main eight peaks are evaluated and identified as magnoflorine, groenlandicine, jatrorrhizine, columbamine, epiberberine, coptisine, palmatine and berberine by the comparison with reference standards, respectively. The quantitative accumulations of these eight compounds are presented in Table 2. The result indicates that eight alkaloids can be found in all samples with the exception of epiberberine and their contents are obviously varied among different species. In the light of previous reports, berberine, coptisine, jatrorrhizine and palmatine constitute the main protoberberine alkaloids of C. chinensis, C. deltoidea, C. omeiensis and C. teeta [30,31,32]. Berberine is the most abundant alkaloid and its concentration is ranged from 48.66 ± 3.24 to 93.46 ± 5.12 mg/g. The extensive researches on this compound have demonstrated that it has many pharmacological properties and multi-aspect therapeutic effects such as antimicrobial, antiprotozoal, anticancer, antidiabetic, anti-inflammatory and cardiovascular activities [33]. With respect to other alkaloids, coptisine (12.02 ± 1.26–19.84 ± 2.40 mg/g), palmatine (6.21 ± 0.53–15.39 ± 1.92 mg/g) and jatrorrhizine (3.88 ± 0.55–10.06 ± 1.09 mg/g) are also the highly existed compounds.
In the rhizomes derived from C. omeiensis and C. teeta, epiberberine is not detected. Rhizome of C. teeta has the highest concentration of berberine (93.46 ± 5.12 mg/g). Besides, the accumulations of jatrorrhizine (10.06 ± 1.09 mg/g) and magnoflorine (7.33 ± 0.67 mg/g) are significantly higher than that from other three plants. With respect to C. chinensis, it is the best source for epiberberine (11.21 ± 1.75 mg/g), coptisine (19.84 ± 2.40 mg/g), palmatine (15.39 ± 1.92 mg/g) and columbamine (3.79 ± 0.92 mg/g). Notably, epiberberine is the most typical component of C. chinensis, and its content is significantly higher than that from other Coptis plants. For the rhizomes separated from C. deltoidea, the level of groenlandicine (9.11 ± 2.36 mg/g) is markedly higher, and the lowest level of berberine (48.66 ± 3.24 mg/g) is accumulated compared to the rhizomes from other three Coptis plants. In the recent studies related to different Coptis plants [14,34], the accumulated trends of these active components are consistent with our results although there are some small differences with respect to certain compounds. The content of berberine for C. chinensis in recent studies is slightly higher than that in this study, and berberine in C. teeta is less than that in our research. These differences may be caused by the different collected origins of plant materials.
Based on the distinct difference of quantitative determination in relation to the alkaloid compositions, principal component analysis (PCA) was carried out to visualize the differences regarding the rhizomes of different plants and further explore the relation between each compound and sample clustering, which was never discussed in the previous papers. The PCA result (Figure 2) exhibits an excellent separation tendency of samples related to the first two principal components (PCs) (79.6% of the total variance (Figure S5)). As shown in Figure 2, all samples are sorted into four groups. The sample clusters of C. teeta and C. deltoidea are located in negative PC 1 scores and PC 2 makes a major contribution to differentiate them. Most samples originated from C. omeiensis and C. chinensis are assigned into positive scores of PC 1 which can successfully separate these samples. The compounds of palmatine, epiberberine, columbamine, jatrorrhizine and coptisine are the dominant variables on PC 1, thereby causing greater variability among these samples. Magnoflorine, groenlandicine, coptisine and berberine are the dominant variables on PC 2 (Figure 3a).
As shown in Figure 3b, these metabolites play a different role for differentiating rhizomes originated from different plants. Comparatively, palmatine, epiberberine and columbamine are effective for distinguishing C. chinensis samples from others. Magnoflorine and berberine make a great contribution for clustering samples originated from C. teeta. The excellent separation of rhizome from C. deltoidea is closely related to the level of groenlandicine.
Referring HPLC-UV data, medicine from C. chinensis accumulates the highest level of palmatine, epiberberine and columbamine. Magnoflorine and berberine are mostly synthesized in samples from C. teeta, while C. deltoidea samples possess the highest accumulation of groenlandicine. Hence, these compounds can be used as the important index to differentiate corresponding Coptis medicines from others. To further elucidate the relationship among four Coptis species based on metabolic information clearly, HCA result was presented as a dendrogram plot (Figure 4). Four clear clusters are observed: cluster I corresponded to samples from C. omeiensis; cluster II to samples from C. deltoidea; cluster III to samples from C. teeta; and cluster IV to samples from C. chinensis, validating the observation in the PCA plot. In addition, there is a shorter distance between rhizomes originated from C. omeiensis and these from C. deltoidea. Then C. teeta samples cluster together with them, indicating that the metabolic characteristics of C. omeiensis samples are more similar to C. deltoidea than others and C. chinensis samples are more relatively different from other species.

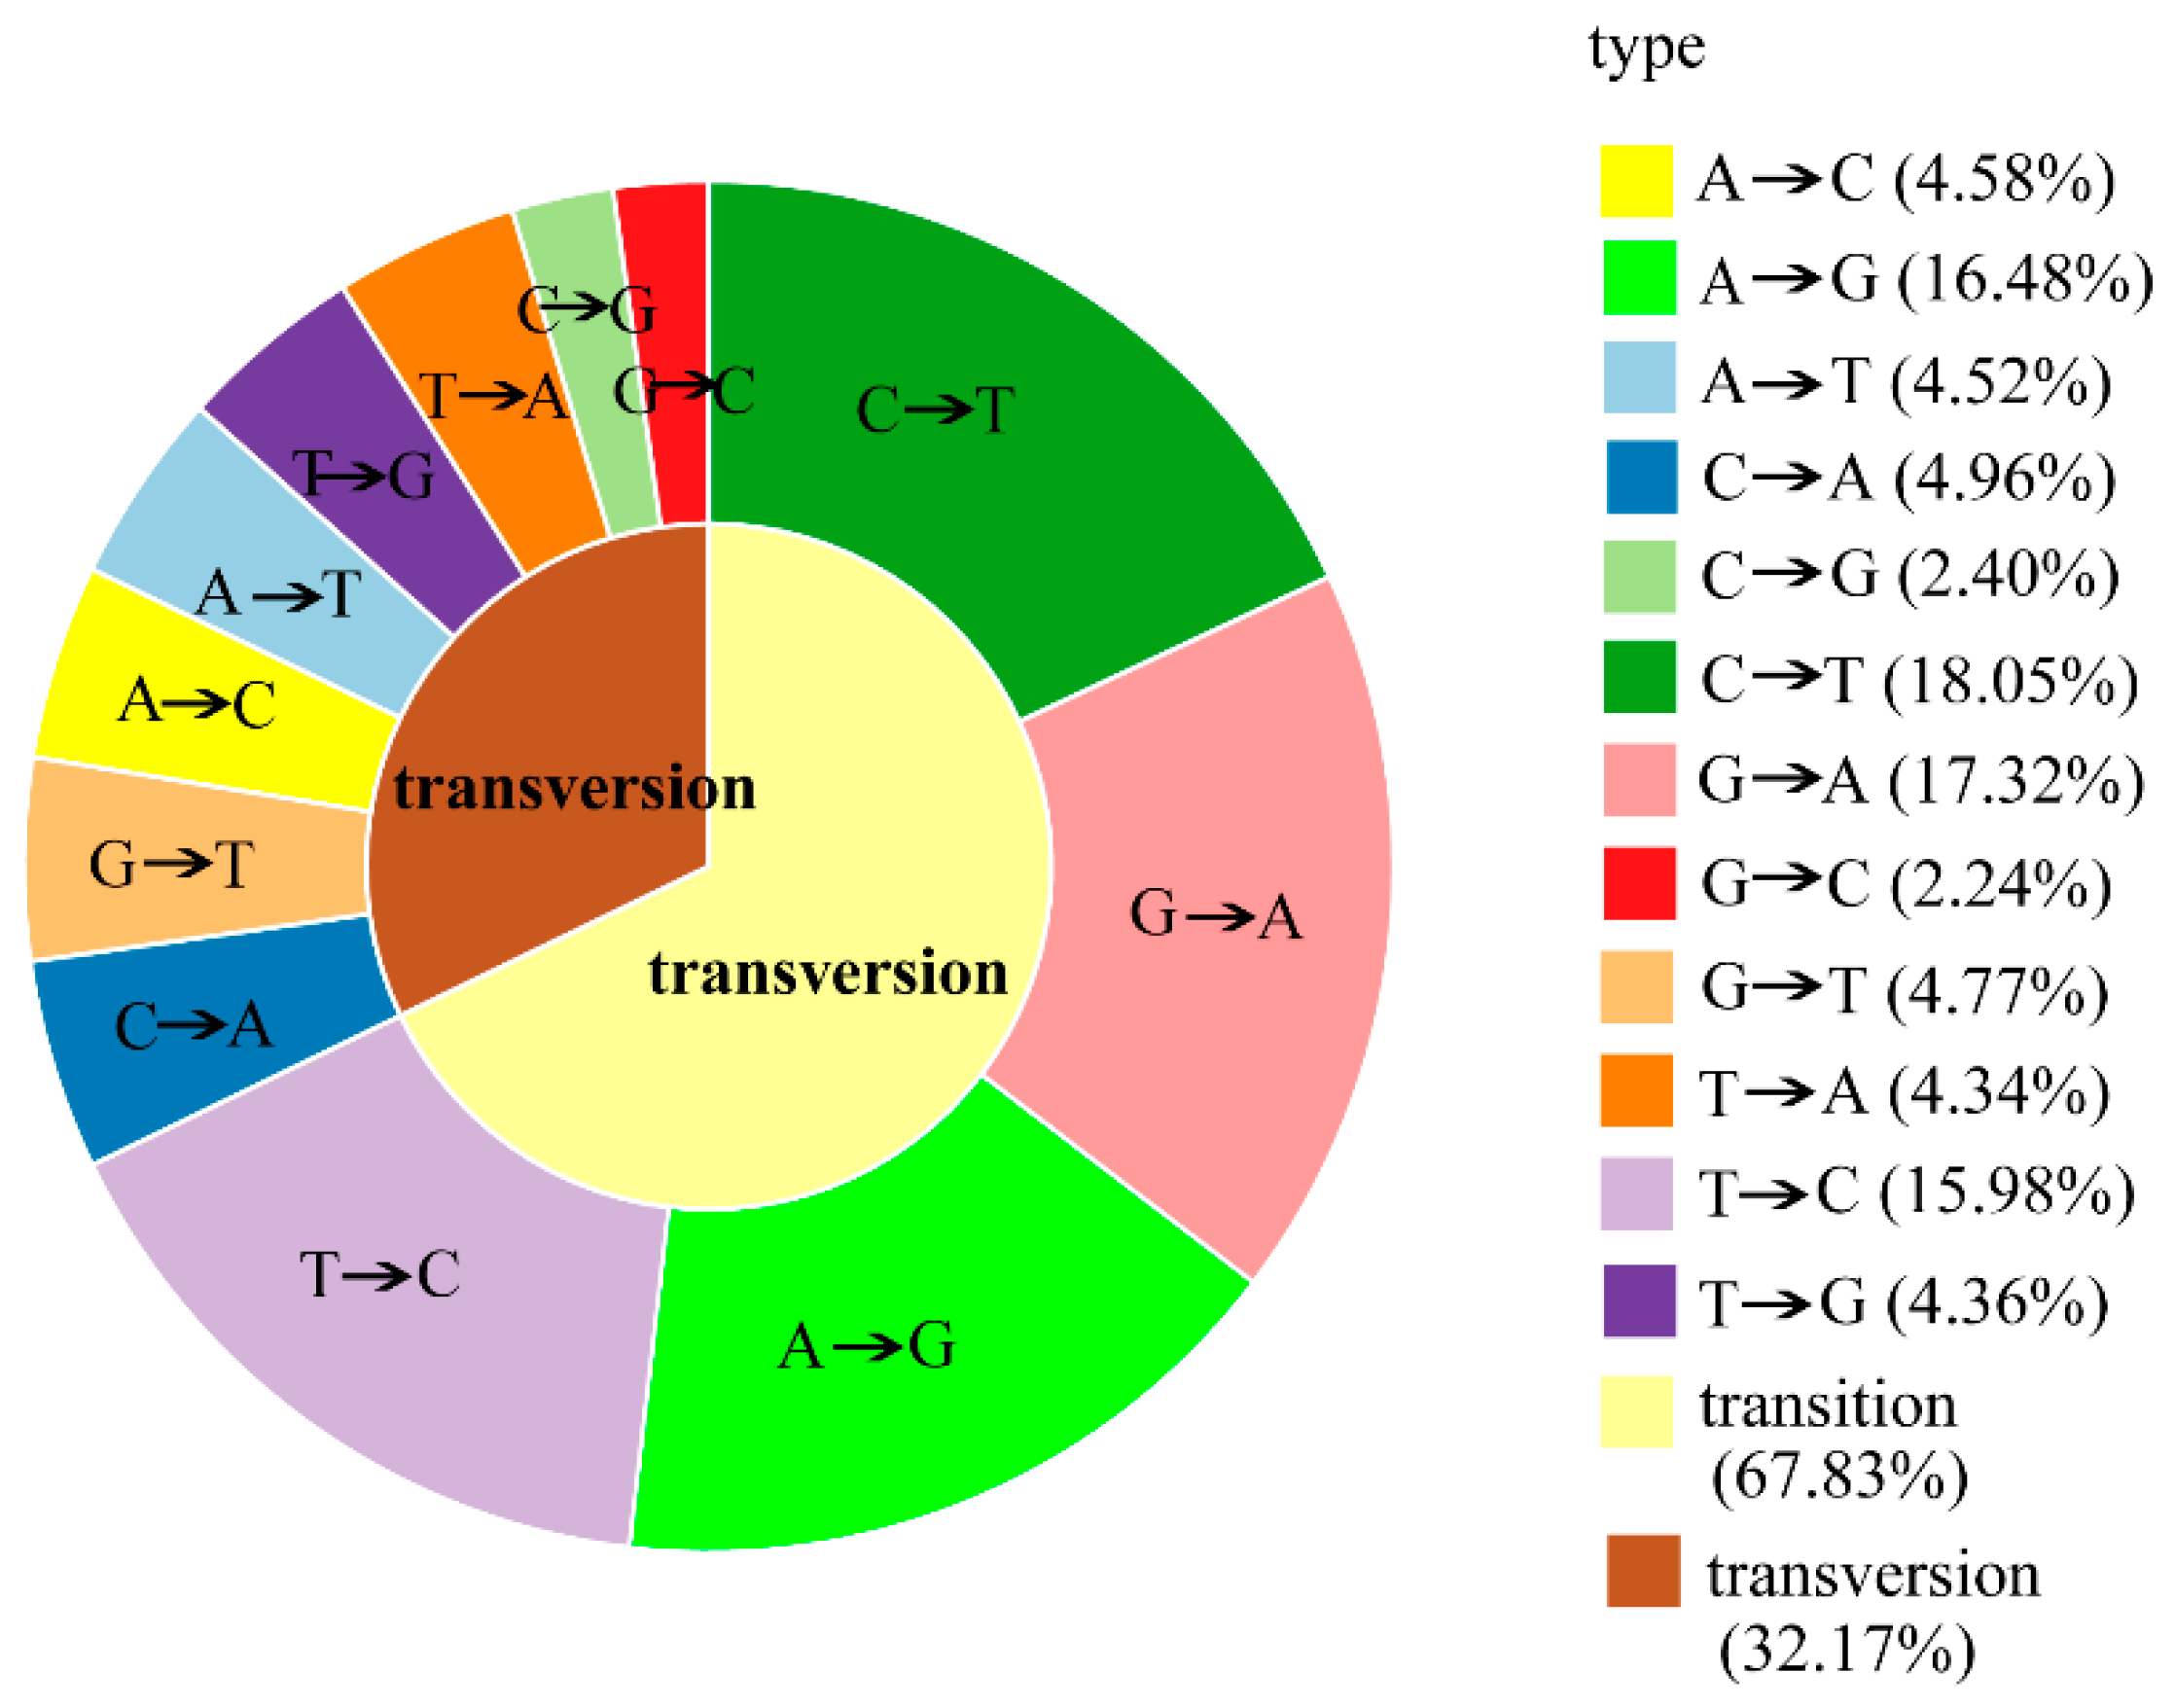
2.3. RAD-seq Data Analysis and SNP Discovery

With the respect to the metabolic composition analysis, the difference among samples originated from four species was obvious. To characterize these samples at the molecular level, their DNA were isolated from 10 mixed samples of each species to construct RAD libraries and then successfully sequenced by NGS platform.
A total of 44,747,016 reads are generated and 43,871,958 reads are retained after discarding reads with low-quality, containing unidentified nucleotides and adapters. Initial processing result for each plant is shown in Table 3 and Table S3. Due to the lack of reference genome information for Coptis plants, contigs were created by de novo assembly. The number of obtained contigs is 965,140 and the lengths for the assembly are ranged from 162 to 135,561 bp (Figure S6) with the N50 of 440 bp and an average length of 333 bp (Table 4). The GC dinucleotide content is 38.03% which is close to results from other paired-end RAD-seq studies in plant genomes [35,36].
The paired-end sequences of each sample were aligned to the assembled reference sequence and mapped reads were used to identify SNPs. Based on the unique characteristics of RAD-seq protocol, SNPs around restriction enzyme tag fragments were discovered, which may be related to the variations of metabolites among different species. The result indicates that a total of 2,443,407 SNPs are identified from RAD-sequence data among four Coptis plants. Of all the identified SNPs, 67.83% are identified as transitions (A/G or C/T) and 32.17% are classified as transversions (A/C, A/T, G/T, or C/G) (Figure 5). In general, transitions occurred more frequently than transversions due to the interchange between purine and pyrimidine nucleotide bases [37]. In addition, the observed SNP transition/transversion rate in this study is 2.11, which is similar to that reported in rice (2.3) [38].

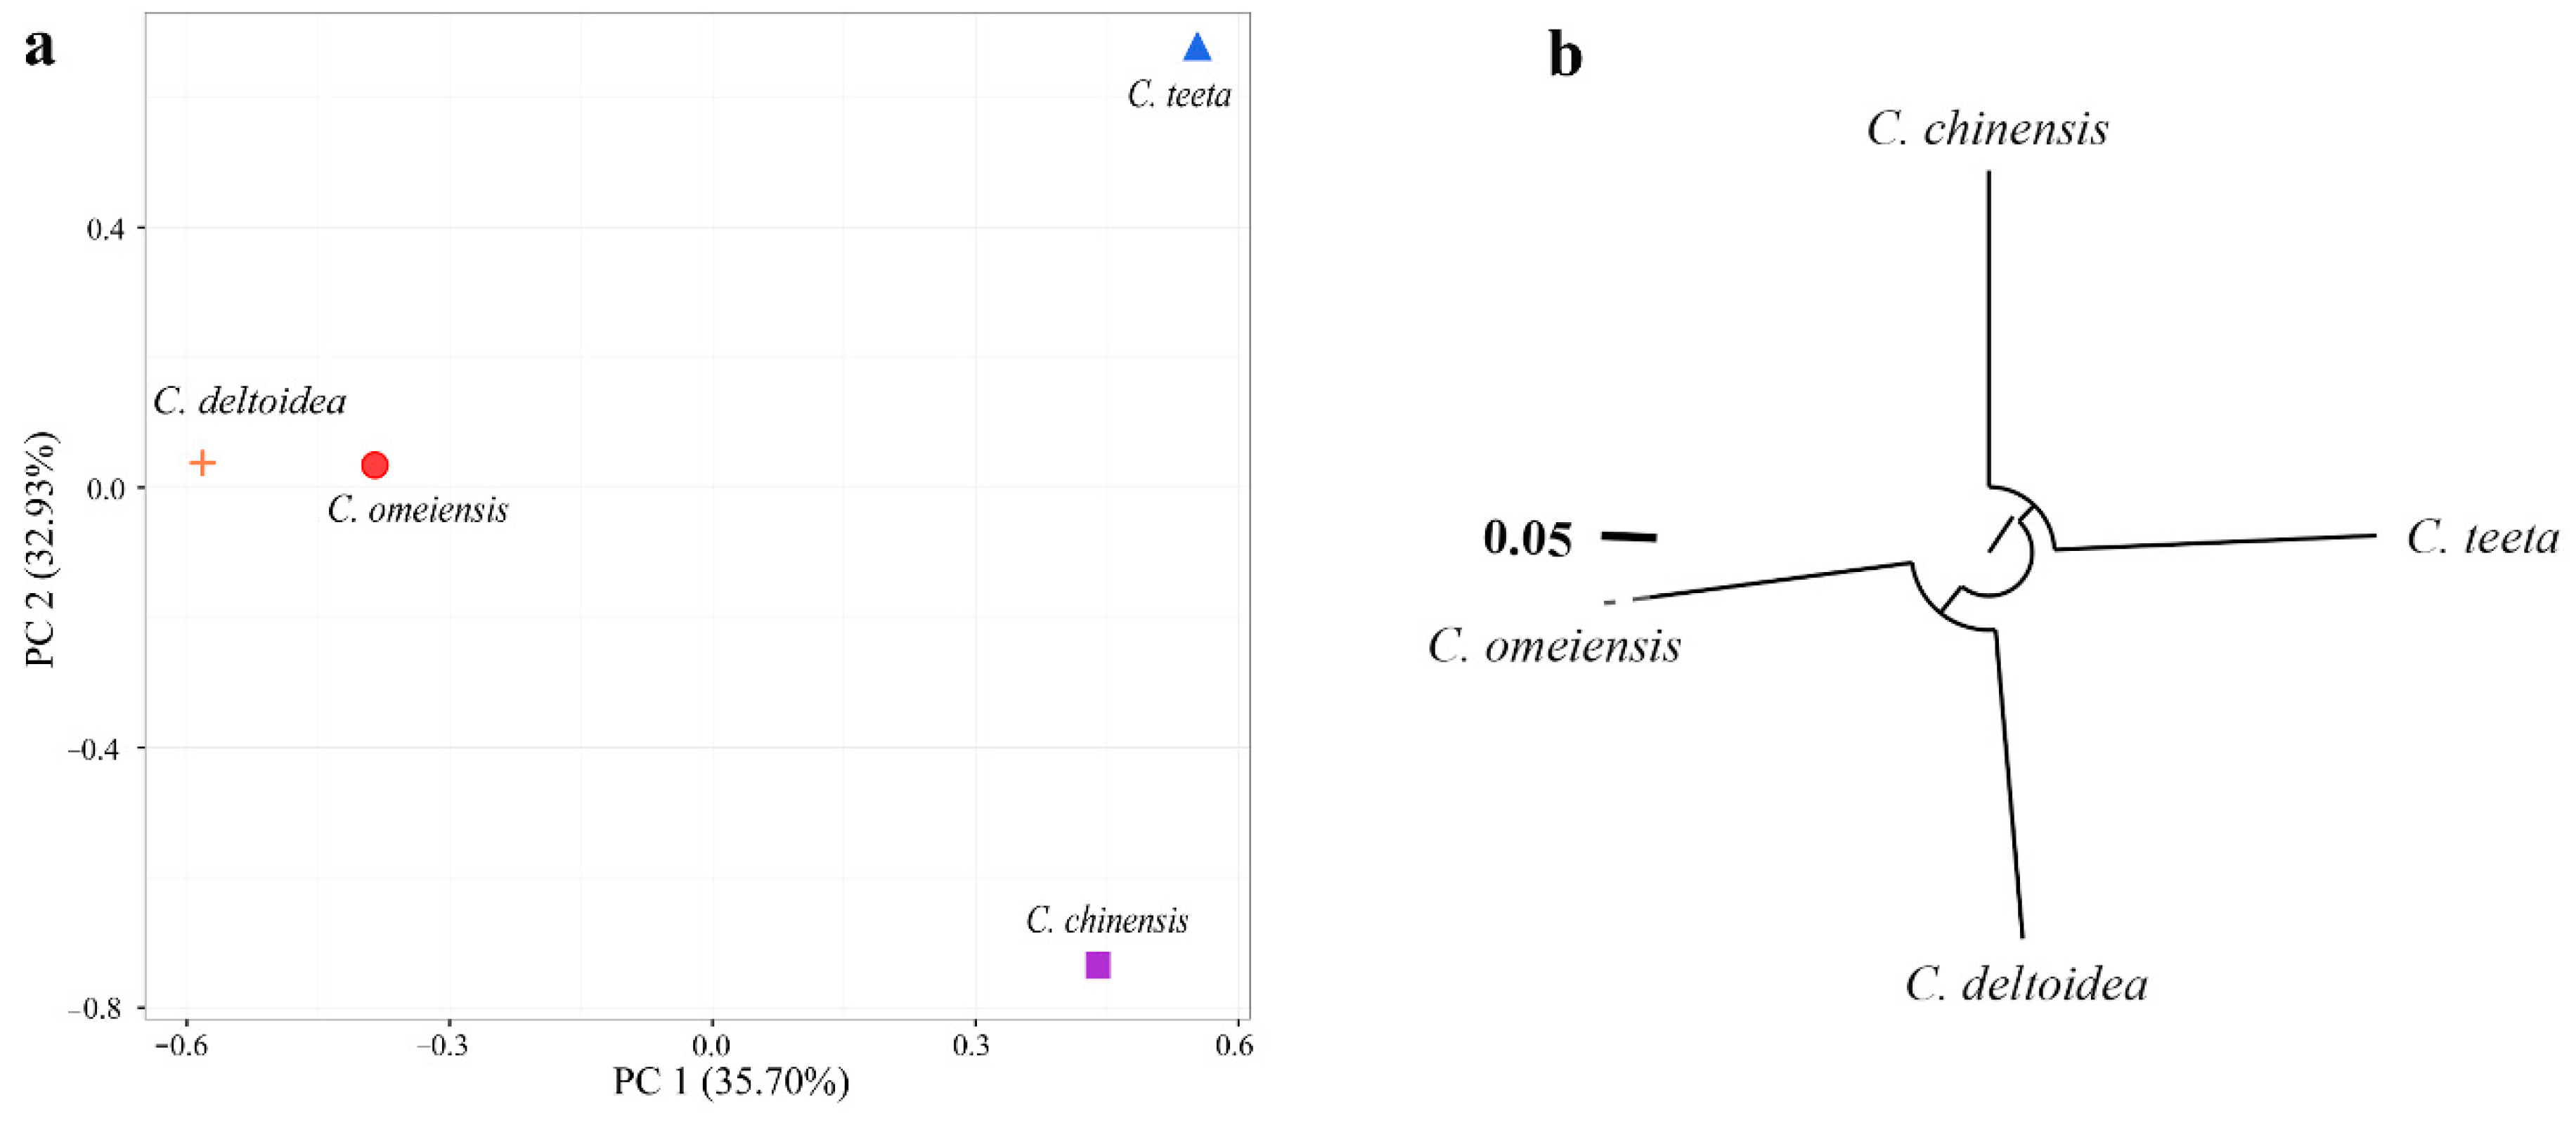
2.4. Genetic Relationship among Four Coptis Plants

To reveal the genetic relationships among four Coptis plants, PCA and HCA were also successively performed using SNP data. The PCA result exhibits that the first two PCs account for 68.63% of the total variance. PCA plot (Figure 6a) illuminates that C. deltoidea and C. omeiensis have a closer genetic relationship. Especially, based on the PC 1, the distance between C. deltoidea and C. omeiensis is relatively close while C. chinensis is more adjacent with C. teeta. The conclusion is consistent with the HCA result from the neighbor-joining phylogenetic analysis (Figure 6b).
Four Coptis plants are clearly classified into two clades (Figure 6b): one clade containing C. chinensis and C. teeta while the other clade containing C. deltoidea and C. omeiensis. The result mostly agreed with the metabolic conclusion and previous studies reporting that C. deltoidea and C. omeiensis had the closest genetic distance among Coptis plants [12].

3. Materials and Methods

3.1. Chemicals and Reagents

HPLC grade acetonitrile was purchased from Thermo Fisher Scientific Co, Ltd. (Shanghai, China). Deionized water used for chromatographic analysis was purified with a Milli-Qultra-pure water system (Millipore, Burlington, MA, USA). Reference standards of palmatine, coptisine, epiberberine, columbamine, jatrorrhizine, magnoflorine and groenlandicine were purchased from Chroma-Biotechnology Co., Ltd. (Chengdu, China), and berberine was provided by Chinese National Institute for Food and Drug Control (Beijing, China). The purities for all compounds are higher than 98%. CTAB used for DNA extraction was purchased from Guangzhou chemical reagent factory (Guangzhou, China). EcoR I was obtained from New England Biolabs (Ipswich, MA, USA). All other reagents were analytical grade from Chron Chemicals Co, Ltd. (Chengdu, China).

3.2. Plant Material and Sample Preparation

A sample collection of 40 specimens including four Coptis plants (C. chinensis; C. deltoidea; C. omeiensis and C. teeta) was processed, and 10 samples of each species were prepared (Table S1 and Figure S1). These 5-year plant materials were collected from wild habitats with the altitude over 2000 m and identified by Professor Yuntong Ma (College of Pharmacy, Chengdu University of Traditional Chinese Medicine, Chengdu, China). Young leaf tissues of each individual plant were firstly separated and frozen in liquid nitrogen for DNA extraction. Then, the rhizome (Figure S2) was carefully washed and dried at 60 °C to constant weight. Finally, these samples were ground into powder for the metabolite analysis.

3.3. HPLC-UV Analysis

Dried powder samples (0.02 g) were accurately weighed and extracted with hydrochloric acid-methanol solution (10 mL, 1:100, v/v) for 30 min in an ultrasonic bath at room temperature. Then, the decrease in weight was replenished with the extraction solvent. The sample solution was filtered through a 0.45 μm membrane filter prior to the HPLC-UV analysis. A Shimadzu HPLC system (Shimadzu, Kyoto, Japan) equipped with a LC-20AT quaternary pump, a SIL-20A XR autosampler, a CTO-20AC column oven and a SPD-20A UV/Vis detector was used to determine the objective compounds. The chromatographic column Xtimate C18 (250 × 4.6 mm, 5 μm, Welch, Shanghai, China) was applied to perform chromatographic separation and the column temperature was constantly kept at 25 °C The binary mobile phase consisted of acetonitrile (A) and 30 mmol/L ammonium bicarbonate solution containing 0.7% ammonia and 0.25% triethylamine (B) at a continuous flow rate of 1 mL/min in the following gradient program: 0–15 min, 10%–25% A; 15–25 min, 25%–30% A; 25–50 min, 30%–45% A. The injection volume was 5 μL and the detection wavelength was acquired at 270 nm. The contents of eight alkaloids (berberine, palmatine, coptisine, epiberberine, columbamine, jatrorrhizine, magnoflorine and groenlandicine) in each sample were calculated from standard curves.

3.4. Validation of HPLC–UV Method

The validation of HPLC-UV method in terms of linearity, precision, repeatability, stability and recovery test is an important process for quantitative determination of major active components. The calibration curves of eight alkaloids were established by plotting the peak areas against the standard concentrations, respectively. The precision of the HPLC-UV method was investigated by five replicate measurements of same mixed standard solution. For stability test, the same solution was analyzed at the time intervals of 0, 5, 10, 15 and 20 h, respectively. In order to evaluate the repeatability, five different sample solutions independently prepared from a same sample were analyzed. The limits of detection (LOD) and limits of quantitation (LOQ) were determined at a signal-to-noise ratio (S/N) of about 3 and 10, respectively.

3.5. DNA Isolation, RAD Library Construction and Sequencing

Genomic DNA was isolated from frozen leaf tissues of 10 mixed samples regarding to each Coptis plants, using a modified CTAB method [38]. The quality and quantity of DNA were detected by 1% agarose gel electrophoresis and NanoDrop 2000 (Thermo Scientific, Waltham, MA, USA). The genomic RAD libraries were constructed using a protocol adapted from Baird et al. [39]. Briefly, each genomic DNA pooled from four Coptis species was digested with the restriction endonuclease EcoR I and then the reaction was stopped by inactivating at 65 °C Each P1 adapters with a unique 8 bp multiplex identifier sequence (MID) was ligated to the products of restriction reaction. After ligations of P1 adaptors, the DNA samples containing the different MIDs were pooled in proportionate amounts. Then, the products were randomly sheared to DNA fragments. Subsequently, adaptor-ligated DNA amplicons were purified and electrophoresed through 1.5% agarose gel, and the DNA fragments in the range 300–500 bp were isolated. After end repair, purification and elution, dATP overhangs were added to the DNA fraction. A paired-end P2 adapter containing T overhangs was ligated to the P1-ligated DNA template with a specific adapter. Only the fragments with both P1 and P2 adapters could be successfully amplified. The ligated material was then subjected to PCR enrichment. And then, the constructed RAD libraries were sequenced by Illumina HiSeq4000 sequencing platform (Illumina, San Diego, CA, USA) and 150 bp paired-end reads were generated. Finally, the sequencing data for each sample was extracted according to the specific MID.

3.6. De Novo Assembly of RAD Tags and SNP Identification

All raw reads were checked for the presence of expected EcoR I motif (AATTC) following the sample-specific MID. To obtain clean and high quality reads, three stringent filtering standards (removing reads aligned to the barcode adapter, with more than 10% unidentified nucleotides and contained >50% low-quality bases (phred quality scores of ≤20)) were conducted. Retained first and second high quality reads were used for next downstream analysis.
Because of the unavailable reference of Coptis genome sequence, the identification of SNPs was implemented de novo [40,41]. Briefly, the primary steps were roughly as follows:
(1)
After removing the MID and the restriction site, the information of individual stacks was built by sorting and clustering similar first reads from each sample.
(2)
The individual stacks were clustered and the consensus sequences were obtained.
(3)
According to the clusters mentioned above, the second reads could be sorted into groups and separately assembled to contigs, which were joined with the first reads consensus sequences. The paired-end reads were used to construct scaffolds serving as a reference for the following analysis.
To identify SNPs, the clean reads from the paired-end sequences of each sample were aligned to the assembled reference sequence using Burrows-Wheeler Aligner (BWA) (version 0.7.16a–r1181; http://bio-bwa.sourceforge.net/bwa.shtml) [40]. Then the aligned reads were converted to Binary Alignment/Map (BAM) files using SAMtools (http://samtools.sourceforge.net/), and Picard program (version 1.129; http://broadinstitute.github.io/picard/) was used to sort, index and remove duplicates. SNPs were called out for each Coptis plants against the reference sequence using the GATK’s Unified Genotyper (version 3.4-46, https://software.broadinstitute.org/gatk/). And then, SNPs were further filtered using GATK’s Variant Filtration with proper standards.

3.7. Statistical Analysis

A one-way analysis of variance based on a Tukey’s multiple comparison test was firstly applied to determine the content variations of alkaloid compounds among the rhizomes from four Coptis plants. The statistical significance was determined on a 95% probability level (p < 0.05).
PCA is a non-parametric and unsupervised multivariate technique for reducing the dimensionality of original datasets, increasing interpretability but minimizing information loss at the same time [42]. It can do so by creating several new uncorrelated variables called PCs [43]. Generally, the relevant information from the complex data can be mostly obtained using the first two PCs. Hence, a two-dimensional projection was constructed to obtain an overview of samples from four plants. Meanwhile, in order to further explore the data characteristics, a loading plot was developed to visualize the relevance between each PC and studied objectives.
HCA is also an exploratory technique where the groups are sequentially created by systematically merging similar clusters together. According to metabolic or molecular data, the property of samples in the same group is similar whereas the samples in different groups are different. Because it only refers a distance parameter (Mahalanobis distance in our study), it is more visualized to elucidate relationship among different samples by clustering samples into a one-dimensional dendrogram. Currently, this method has been extensively used to evaluate the multivariate association between bioactive compounds and samples [44]. In this study, HCA was applied to validate PCA result and further elucidate the inter-species relationship among different Coptis plants according to the metabolic data. Additionally, this method was also used to calculate the genetic distances among different species based on SNPs from the RAD data, and a phylogenetic tree was constructed using a neighbor-joining method in terms of the generated distance matrix, with bootstrap values at the default setting of 100 trials. The data analysis flow chart of this study is shown in Figure S3.

4. Conclusions

In this study, HPLC-UV and RAD-seq were applied together for a metabolic and molecular characterization of four Coptis medicinal plants. On the basis of metabolic profiles, the accumulation of main alkaloid compounds among rhizomes originated from different Coptis plants obviously varies and berberine is the most abundant alkaloid compound in all samples. PCA and HCA were used to deeply explore data characters and successfully visualize the metabolic variation and relationship among rhizomes from four Coptis plants. In addition, we have demonstrated paired-end RAD-seq is an efficient approach for SNP discovery. From Illumina paired-end sequence data, over 90,000 high-quality sequence contigs with an N50 length of 440 bp were assembled and 2,443,407 SNPs from four Coptis plants were identified. Based on SNP data, genetic relationship was also illuminated that C. deltoidea and C. omeiensis had the closest genetic relationship. In summary, results from this study can provide a comprehensive metabolic and molecular genetic profiling for the characterization of different Coptis plants. Furthermore, it will contribute to more stringent quality control and reasonable exploitation of these resources.

Supplementary Materials

The following are available online. Figure S1: Plant morphology and leaf tissues of four Coptis plants (1: C. chinensis; 2: C. deltoidea; 3: C. teeta; 4: C. omeiensis). Figure S2: Rhizomes of different Coptis plants (1: C. chinensis; 2: C. deltoidea; 3: C. teeta; 4: C. omeiensis). Figure S3: Data analysis flow chart of this study. Figure S4: Principal components explaining variances used in PCA according to quantitative determination of alkaloid compounds. Figure S5: Length distribution of RAD-seq contigs. Table S1: Materials of four Coptis plants used in this study. Table S2: The validation of HPLC-UV method. Table S3: Statistical summary of MIDs, raw reads, filtered reads of each Coptis plants from RAD-seq.

Author Contributions

F.Z. and Y.M. conceived and designed the experiments; F.Z. performed the experiments and wrote the manuscript; F.Z., C.S. and L.Q. analyzed the data and prepared the Figures and Tables.

Funding

This work was financially supported by the National Wild Plant Germplasm Resources Infrastructure which was the follow-up work of a project called Standardization and Community for the Collection and Preservation of Important Wild Plant Germplasm Resources (2005DKA21006).

Conflicts of Interest

The authors declare no conflict of interest.

References

  1. Coghlan, M.L.; Maker, G.; Crighton, E.; Haile, J.; Murray, D.C.; White, N.E.; Byard, R.W.; Bellgard, M.I.; Mullaney, I.; Trengove, R.; et al. Combined DNA, toxicological and heavy metal analyses provides an auditing toolkit to improve pharmacovigilance of traditional Chinese medicine (TCM). Sci. Rep. 2015, 5, 17475. [Google Scholar] [CrossRef] [PubMed] [Green Version]
  2. Tang, J.; Liu, B.; Ma, K. Traditional Chinese medicine. Lancet 2008, 372, 1938–1940. [Google Scholar] [CrossRef] [Green Version]
  3. Hao, P.; Jiang, F.; Chen, Y.; Yang, J.; Zhang, K.; Zhang, M.; Zhang, C.; Zhao, Y.; Zhang, Y. Traditional Chinese medication for cardiovascular disease. Nat. Rev. Cardiol. 2015, 12, 115–122. [Google Scholar] [CrossRef] [PubMed]
  4. Li, W.L.; Zheng, H.C.; Bukuru, J.; de Kimpe, N. Natural medicines used in the traditional Chinese medical system for therapy of diabetes mellitus. J. Ethnopharmacol. 2004, 92, 1–21. [Google Scholar] [CrossRef] [PubMed]
  5. Cai, Y.; Luo, Q.; Sun, M.; Corke, H. Antioxidant activity and phenolic compounds of 112 traditional Chinese medicinal plants associated with anticancer. Life Sci. 2004, 74, 2157–2184. [Google Scholar] [CrossRef] [PubMed]
  6. Li, X.; Chen, Y.; Lai, Y.; Yang, Q.; Hu, H.; Wang, Y. Sustainable utilization of traditional Chinese medicine resources: Systematic evaluation on different production modes. Evid-Based Compl. Alt. 2015, 2015, 1–10. [Google Scholar] [CrossRef] [PubMed]
  7. Chan, K.; Shaw, D.; Simmonds, M.S.J.; Leon, C.J.; Xu, Q.; Lu, A.; Sutherland, I.; Ignatova, S.; Zhu, Y.; Verpoorte, R.; et al. Good practice in reviewing and publishing studies on herbal medicine, with special emphasis on traditional Chinese medicine and Chinese materia medica. J. Ethnopharmacol. 2012, 140, 469–475. [Google Scholar] [CrossRef] [PubMed]
  8. Zhu, M.; Jiang, Y.; Cui, B.; Jiang, Y.; Cao, H.; Zhang, W. Determination of the Heavy Metal Levels in Panax notoginseng and the Implications for Human Health Risk Assessment. Hum. Ecol. Risk Assess. 2015, 21, 1218–1229. [Google Scholar] [CrossRef]
  9. Zhong, X.; Li, D.; Jiang, J. Identification and quality control of Chinese medicine based on the fingerprint techniques. Curr. Med. Chem. 2009, 16, 3064–3075. [Google Scholar] [CrossRef] [PubMed]
  10. Qi, L.; Zhang, J.; Zuo, Z.; Zhao, Y.; Wang, Y.; Hang, J. Determination of Iridoids in Gentiana rigescens by Infrared Spectroscopy and Multivariate Analysis. Anal. Lett. 2017, 50, 389–401. [Google Scholar] [CrossRef]
  11. Chen, C.; Yan, H.; Han, B. Rapid identification of three varieties of Chrysanthemum with near infrared spectroscopy. Rev. Bras. Farmacogn. 2014, 24, 33–37. [Google Scholar] [CrossRef]
  12. Xiang, K.; Wu, S.; Yu, S.; Liu, Y.; Jabbour, F.; Erst, A.S.; Zhao, L.; Wang, W.; Chen, Z. The first comprehensive phylogeny of Coptis (Ranunculaceae) and its implications for character evolution and classification. PLoS ONE 2016, 11, e153127. [Google Scholar] [CrossRef] [PubMed]
  13. Qiao, Y.L.; Sheng, Y.X.; Wang, L.Q.; Zhang, J.L. Development of a rapid resolution liquid chromatographic method for simultaneous analysis of four alkaloids in Rhizoma Coptidis under different cultivation conditions. J. AOAC Int. 2009, 92, 663–671. [Google Scholar] [PubMed]
  14. He, Y.; Hou, P.; Fan, G.; Arain, S.; Peng, C. Comprehensive analyses of molecular phylogeny and main alkaloids for Coptis (Ranunculaceae) species identification. Biochem. Syst. Ecol. 2014, 56, 88–94. [Google Scholar] [CrossRef]
  15. Yang, Y.; Peng, J.; Li, F.; Liu, X.; Deng, M.; Wu, H. Determination of alkaloid contents in various tissues of Coptis Chinensis Franch by reversed phase-high performance liquid chromatography and ultraviolet spectrophotometry. J. Chromatogr. Sci. 2017, 55, 556–563. [Google Scholar] [CrossRef] [PubMed]
  16. Tjong, Y.; Ip, S.; Lao, L.; Fong, H.H.S.; Sung, J.J.Y.; Berman, B.; Che, C. Analgesic effect of Coptis chinensis rhizomes (Coptidis Rhizoma) extract on rat model of irritable bowel syndrome. J. Ethnopharmacol. 2011, 135, 754–761. [Google Scholar] [CrossRef] [PubMed]
  17. Zhang, Q.; Piao, X.; Piao, X.; Lu, T.; Wang, D.; Kim, S.W. Preventive effect of Coptis chinensis and berberine on intestinal injury in rats challenged with lipopolysaccharides. Food Chem. Toxicol. 2011, 49, 61–69. [Google Scholar] [CrossRef] [PubMed]
  18. Cui, L.; Liu, M.; Chang, X.; Sun, K. The inhibiting effect of the Coptis chinensis polysaccharide on the type II diabetic mice. Biomed. Pharmacother. 2016, 81, 111–119. [Google Scholar] [CrossRef] [PubMed]
  19. He, Y.; Fan, G.; Gao, J.; Peng, C. Correlation analyses between molecular perspective and phytochemical variations in Coptis chinensis Franch. Biochem. Syst. Ecol. 2015, 61, 143–148. [Google Scholar] [CrossRef]
  20. Gao, X.; Yang, X.W.; Marriott, P.J. Simultaneous analysis of seven alkaloids in Coptis-Evodia herb couple and Zuojin pill by UPLC with accelerated solvent extraction. J. Sep. Sci. 2010, 33, 2714–2722. [Google Scholar] [CrossRef] [PubMed]
  21. Fan, G.; Tao, L.H.; Yue, Q.H.; Kuang, T.T.; Tang, C.; Yang, Y.D.; Luo, W.Z.; Zhou, X.D.; Zhang, Y. Metabolic discrimination of Rhizoma Coptidis from different species using 1H-NMR spectroscopy and principal component analysis. Planta Med. 2012, 78, 641–648. [Google Scholar] [CrossRef] [PubMed]
  22. Yang, H.; Wei, C.; Liu, H.; Wu, J.; Li, Z.; Zhang, L.; Jian, J.; Li, Y.; Tai, Y.; Zhang, J.; et al. Genetic divergence between Camellia sinensis and its wild relatives revealed via genome-wide SNPs from RAD sequencing. PLoS ONE 2016, 11, e151424. [Google Scholar] [CrossRef] [PubMed]
  23. Davey, J.W.; Hohenlohe, P.A.; Etter, P.D.; Boone, J.Q.; Catchen, J.M.; Blaxter, M.L. Genome-wide genetic marker discovery and genotyping using next-generation sequencing. Nat. Rev. Genet. 2011, 12, 499–510. [Google Scholar] [CrossRef] [PubMed]
  24. Pegadaraju, V.; Nipper, R.; Hulke, B.; Qi, L.; Schultz, Q. De novo sequencing of sunflower genome for SNP discovery using RAD (Restriction site Associated DNA) approach. BMC Genom. 2013, 14, 556. [Google Scholar] [CrossRef] [PubMed]
  25. Karam, M.J.; Lefèvre, F.; Dagher-Kharrat, M.B.; Pinosio, S.; Vendramin, G.G. Genomic exploration and molecular marker development in a large and complex conifer genome using RADseq and mRNAseq. Mol. Ecol. Resour. 2015, 15, 601–612. [Google Scholar] [CrossRef] [PubMed]
  26. Penjor, T.; Mimura, T.; Kotoda, N.; Matsumoto, R.; Nagano, A.J.; Honjo, M.N.; Kudoh, H.; Yamamoto, M.; Nagano, Y. RAD-Seq analysis of typical and minor Citrus accessions, including Bhutanese varieties. Breeding Sci. 2016, 66, 797–807. [Google Scholar] [CrossRef] [PubMed]
  27. Arnold, B.; Corbett-Detig, R.B.; Hartl, D.; Bomblies, K. RADseq underestimates diversity and introduces genealogical biases due to nonrandom haplotype sampling. Mol. Ecol. 2013, 22, 3179–3190. [Google Scholar] [CrossRef] [PubMed]
  28. Wagner, C.E.; Keller, I.; Wittwer, S.; Selz, O.M.; Mwaiko, S.; Greuter, L.; Sivasundar, A.; Seehausen, O. Genome-wide RAD sequence data provide unprecedented resolution of species boundaries and relationships in the Lake Victoria cichlid adaptive radiation. Mol. Ecol. 2013, 22, 787–798. [Google Scholar] [CrossRef] [PubMed]
  29. Pfender, W.F.; Saha, M.C.; Johnson, E.A.; Slabaugh, M.B. Mapping with RAD (restriction-site associated DNA) markers to rapidly identify QTL for stem rust resistance in Lolium perenne. Theor. Appl. Genet. 2011, 122, 1467–1480. [Google Scholar] [CrossRef] [PubMed]
  30. Chen, H.; Fan, G.; He, Y. Species evolution and quality evaluation of four Coptis herbal medicinal materials in Southwest China. 3 Biotech 2017, 7, 62. [Google Scholar] [CrossRef] [PubMed]
  31. He, S.; Liang, Y.; Cong, K.; Chen, G.; Zhao, X.; Zhao, Q.; Zhang, J.; Wang, X.; Dong, Y.; Yang, J.; et al. Identification and characterization of genes involved in benzylisoquinoline alkaloid biosynthesis in Coptis Species. Front. Plant Sci. 2018, 9. [Google Scholar] [CrossRef] [PubMed]
  32. Chen, H.; Deng, C.; Nie, H.; Fan, G.; He, Y. Transcriptome analyses provide insights into the difference of alkaloids biosynthesis in the Chinese goldthread (Coptis chinensis Franch.) from different biotopes. PeerJ. 2017, 5, e3303. [Google Scholar] [CrossRef] [PubMed]
  33. Parameswara, R.V.; Subhashis, C.; Sanjay, S. Berberine: A potential phytochemical with multispectrum therapeutic activities. Expert Opin. Investig. Drugs 2010, 19, 1297–1307. [Google Scholar]
  34. Lv, X.; Li, Y.; Tang, C.; Zhang, Y.; Zhang, J.; Fan, G. Integration of HPLC-based fingerprint and quantitative analyses for differentiating botanical species and geographical growing origins of Rhizoma Coptidis. Pharm. Biol. 2016, 54, 3264–3271. [Google Scholar] [CrossRef] [PubMed]
  35. Scaglione, D.; Acquadro, A.; Portis, E.; Tirone, M.; Knapp, S.J.; Lanteri, S. RAD tag sequencing as a source of SNP markers in Cynara cardunculus L. BMC Genom. 2012, 13, 3. [Google Scholar] [CrossRef] [PubMed]
  36. Lee, J.; Natarajan, S.; Biswas, M.K.; Shirasawa, K.; Isobe, S.; Kim, H.; Park, J.; Seong, C.; Nou, I. SNP discovery of Korean short day onion inbred lines using double digest restriction site-associated DNA sequencing. PLoS ONE 2018, 13, e201229. [Google Scholar] [CrossRef] [PubMed]
  37. Huang, L.; Li, Z.; Wu, J.; Xu, Y.; Yang, X.; Fan, L.; Fang, R.; Zhou, X. Analysis of genetic variation and diversity of Rice stripe virus populations through high-throughput sequencing. Front. Plant Sci. 2015, 6, 176. [Google Scholar] [CrossRef] [PubMed]
  38. Doyle, J.J.; Doyle, J.L. A rapid DNA isolation procedure for small quantities of fresh leaf tissue. Phytochem. Bull. 1987, 19, 11–15. [Google Scholar]
  39. Baird, N.A.; Etter, P.D.; Atwood, T.S.; Currey, M.C.; Shiver, A.L.; Lewis, Z.A.; Selker, E.U.; Cresko, W.A.; Johnson, E.A. Rapid SNP discovery and genetic mapping using sequenced RAD markers. PLoS ONE 2008, 3, e3376. [Google Scholar] [CrossRef] [PubMed]
  40. Catchen, J.M.; Amores, A.; Hohenlohe, P.; Cresko, W.; Postlethwait, J.H. Stacks: Building and genotyping loci de novo from short-read sequences. G3 Genes Genomes Genet. 2011, 1, 171–182. [Google Scholar] [CrossRef] [PubMed]
  41. Willing, E.; Hoffmann, M.; Klein, J.D.; Weigel, D.; Dreyer, C. Paired-end RAD-seq for de novo assembly and marker design without available reference. Bioinformatics 2011, 27, 2187–2193. [Google Scholar] [CrossRef] [PubMed]
  42. Anunciação, D.S.; Leao, D.J.; de Jesus, R.M.; Ferreira, S.L.C. Use of multivariate analysis techniques for evaluation of analytical data-determination of the mineral composition of cabbage (Brassica oleracea). Food Anal. Method 2011, 4, 286–292. [Google Scholar] [CrossRef]
  43. Dos Santos, W.N.L.; da silva Sauthier, M.C.; dos santos, A.M.P.; de Andrade Santana, D.; Almeida Azevedo, R.S.; Da Cruz Caldas, J. Simultaneous determination of 13 phenolic bioactive compounds in guava (Psidium guajava L.) by HPLC-PAD with evaluation using PCA and Neural Network Analysis (NNA). Microchem. J. 2017, 133, 583–592. [Google Scholar] [CrossRef]
  44. Zhang, Y.; Zhang, Z.; Liu, H.; Zhang, B.; Liao, Y.; Zhang, Z. Quantitative and chemical fingerprint analysis for quality evaluation of the dried bark of wild Phellodendron amurense Rupr based on HPLC-DAD-MS combined with chemometrics methods. Anal. Methods 2015, 7, 2041–2049. [Google Scholar] [CrossRef]
Sample Availability: Samples of the compounds are not available from the authors.
Figure 1. HPLC-UV chromatogram of eight alkaloid compounds in rhizomes separated from different Coptis species (Peaks 1–8 indicate magnoflorine, groenlandicine, jatrorrhizine, columbamine, epiberberine, coptisine, palmatine and berberine, respectively).
Molecules 23 03090 g001
Figure 2. PCA score plot of different Coptis medicines based on quantitative determination of alkaloid compounds.
Molecules 23 03090 g002
Figure 3. (a) Loading plot of PCA; (b) Score of each variable on PC 1 and PC 2.
Molecules 23 03090 g003aMolecules 23 03090 g003b
Figure 4. Result of HCA according to the concentration of eight alkaloids.
Molecules 23 03090 g004
Figure 5. Ratio of SNP transitions and transversions observed in Coptis plants.
Molecules 23 03090 g005
Figure 6. (a) Principal component analysis of the four Coptis plants based on identified SNPs; (b) Neighbor-joining tree based on identified SNPs.
Molecules 23 03090 g006
Table 1. Levels of alkaloid compounds in rhizomes originated from four Coptis plants.
StandardCalibration CurveLinearity (μg/mL)r2LOD (μg/mL)LOQ (μg/mL)
Berberiney = 18906563.4500 x − 18038.641755.29–470.000.99987.2424.13
Palmatiney = 19332328.3900 x + 6058.28804.47–54.320.99980.692.32
Jatrorrhiziney = 14849036.3600 x + 241.11222.95–35.840.99980.511.69
Coptisiney = 19176427.8100 x − 2518.83345.69–69.160.99990.612.04
Columbaminey = 31118373.4300 x − 2025.85882.42–29.400.99980.391.31
Epiberberiney = 19026602.7700 x + 4470.78735.01–86.810.99991.113.70
Magnofloriney = 4769076.5410 x + 293.86343.25–56.400.99980.822.73
Groenlandiciney = 13999875.3500 x − 6591.25412.63–65.200.99990.662.19
Table 2. Contents of alkaloid compounds (mg/g) in rhizomes originated from four Coptis plants.
AlkaloidSpecies
C. omeiensisC. teetaC. chinensisC. deltoidea
Ber62.17 ± 5.36a93.46 ± 5.12b 64.93 ± 4.97a48.66 ± 3.24c
Pal9.94 ± 1.65a6.21 ± 0.53b15.39 ± 1.92c6.72 ± 1.45b
Jat4.51 ± 0.56a10.06 ± 1.09b3.88 ± 0.55a9.84 ± 0.44b
Cop15.07 ± 1.65a17.23 ± 1.07b19.84 ± 2.40c12.02 ± 1.26d
Col2.37 ± 0.33a1.44 ± 0.26b3.79 ± 0.92c1.64 ± 0.16b
EpiNN11.21 ± 1.75a1.95 ± 0.74b
Mag3.17 ± 0.63a7.33 ± 0.67b4.40 ± 1.26c4.57 ± 0.35c
Gro0.74 ± 0.09a0.95 ± 0.80a2.66 ± 1.11b9.11 ± 2.36c
Different superscript letters within the same row or column indicate significant differences at p < 0.05 according to a Tukey’s multiple comparison test. Undetected compound is marked as N. (Ber: berberine; Pal: palmatine; Jat: jatrorrhizine; Cop: coptisine; Col: columbamine; Epi: epiberberine; Mag: magnoflorine; Gro: groenlandicine).
Table 3. Number of reads retained after initial quality filtering process for each Coptis plants sequenced.
SpeciesRaw Reads NumberClean Reads Number (%)Read LengthAdapter (%)Low Quality (%)
C. omeiensis10,872,35810,655,424 (98%)150/150114,860 (1.06%)98,434 (0.91%)
C. teeta11,100,21810,874,838 (97.97%)150/150125,744 (1.13%)95,970 (0.86%)
C. chinensis11,795,00811,548,500 (97.91%)150/150110,340 (0.94%)132,294 (1.12%)
C. deltoidea10,979,43210,793,194 (98.3%)150/15064,318 (0.59%)118,454 (1.08%)
Total44,747,01643,871,958-415,262445,152
Table 4. Result of paired-end RAD-seq assembly statistics.
FeatureValue
Number of assembled reference sequence contigs965,140
Total assembly length (bp)321,905,653
Minimum contig length (bp)162
Maximum contig length (bp)135,561
GC%38.03
N50 Contig Length (bp)440
N90 Contig Length (bp)170

