Article

A Genomic Survey of Angiotensin-Converting Enzymes Provides Novel Insights into Their Molecular Evolution in Vertebrates

1
School of Applied Chemistry and Biotechnology, Shenzhen Polytechnic, Shenzhen 518055, China
2
BGI Education Center, University of Chinese Academy of Sciences, Shenzhen 518083, China
3
Shenzhen Key Lab of Marine Genomics, Guangdong Provincial Key Lab of Molecular Breeding in Marine Economic Animals, BGI Academy of Marine Sciences, BGI Marine, BGI, Shenzhen 518083, China
*
Authors to whom correspondence should be addressed.
Molecules 2018, 23(11), 2923; https://doi.org/10.3390/molecules23112923
Submission received: 18 October 2018 / Revised: 2 November 2018 / Accepted: 4 November 2018 / Published: 9 November 2018

Abstract

:
Angiotensin-converting enzymes, ACE and ACE2, are two main elements in the renin–angiotensin system, with a crucial role in the regulation of blood pressure in vertebrates. Previous studies paid much attention to their physiological functions in model organisms, whereas the studies on other animals and related evolution have been sparse. Our present study performed a comprehensive genomic investigation on ace and ace2 genes in vertebrates. We successfully extracted the nucleotide sequences of ace and ace2 genes from high-quality genome assemblies of 36 representative vertebrates. After construction of their evolutionary tree, we observed that most of the phylogenetic positions are consistent with the species tree; however, certain differences appear in coelacanths and frogs, which may suggest a very slow evolutionary rate in the initial evolution of ace and ace2 in vertebrates. We further compared evolutionary rates within the entire sequences of ace and ace2, and determined that ace2 evolved slightly faster than ace. Meanwhile, we counted that the exon numbers of ace and ace2 in vertebrates are usually 25 and 18 respectively, while certain species may occur exon fusion or disruption to decrease or increase their exon numbers. Interestingly, we found three homologous regions between ace and ace2, suggesting existence of gene duplication during their evolutionary process. In summary, this report provides novel insights into vertebrate ace and ace2 genes through a series of genomic and molecular comparisons.

1. Introduction

Serving as a principal volume-regulatory effector, the renin–angiotensin system (RAS) is one of the most important volume regulators in vertebrates. In human, it is a major regulator of blood pressure within the body. Therefore, the RAS could be a target biological system for the treatment of hypertension and other cardiovascular diseases [1]. As we know, the initial effective precursor molecule in the RAS is angiotensinogen (AGT), which has been generated mainly in the liver [2]. Angiotensinogen is cleaved to a 10-amino acid (aa) peptide named as angiotensin (Ang I) by a unique aspartyl protease termed renin, which is processing in the kidney [2,3]. Subsequently, angiotensin-converting enzyme (ACE) cleaves Ang I to a shorter-length (8 aa) while high-active peptide, angiotensin II (Ang II), plays a crucial role in causing vasoconstriction [4]. Meanwhile, Ang I and Ang II can alternatively be cleaved to other products such as Ang (1–9) and Ang (1–7), which displayed inactivity for vasoconstriction [5]. These two cleavage processes are regulated by the recently discovered angiotensin-converting enzyme-2 (ACE2) [5].
Contrary to the slow Ang I, Ang II is fast with signaling through two receptors, angiotensin II receptor type 1 (AT1R) and type 2 (AT2R); however, Ang (1–7) can signal through a unique G protein-coupled receptor, encoded by the MAS1 proto-oncogene (Mas) [6] (see more details in Figure 1). Thus, ACE plays an important role in the elevation of blood pressure, but ACE2 serves as an ACE-inhibitor to ease the function of ACE and regulate cardiac functions. Therefore, ACE2 can also be a potential target for treatment of hypertension and cardiovascular diseases.
The N and C domains in the ACE proteins are similar in sequence (Figure S1). Both of them contain a catalytically active site, characterized by a consensus zinc-binding motif (HEXXH in the single-letter aa code, where X is any other aa) and a glutamine near the carboxyl terminus that also binds zinc [7]. It is interesting to determine that ACE2 serves as an ACE-inhibitor and displays a homologous feature in its encoding regions with a single zinc-binding catalytic domain, and it is a carboxypeptidase with preference for carboxy-terminal hydrophobic or basic residues [8]. Gene structural comparisons indicated that ace and ace2 arose by duplication from a common ancestor [8]; ace and ace2 are identified in vertebrates, but also exist in primitive chordates and tunicates, suggesting an early origin of the RAS [9].
However, all major components of the RAS, with an exception of the Mas receptor, are presented at the divergence of bony fish [9]. In previous reports, ACE and ACE2 have been studied with comparative physiological techniques as their important functions in the regulation of blood pressure [10,11,12]. A comprehensive and systematic investigation of their evolution in vertebrates, however, has been absent, although a few reports had examined ace and ace2 in limited vertebrate species.
In our present study, we aimed to provide a comprehensive investigation on ace and ace2 genes in vertebrates. Recently published genomes of representative vertebrates with high quality were downloaded for screening. Through gene extractions, we successfully collected encoding nucleotide sequences of ace and ace2 from target species. Subsequently, we performed extensive comparisons between ace and the homologous ace2, including phylogenetic construction, gene structural comparison, investigation of exon-length distribution, evolutionary rate comparison and sequence identity within each homologous exon. For this project, we would like to answer the following questions: (1) Are the phylogenetic relationships of vertebrate ace and ace2 consistent with the species tree? (2) Do the ace and ace2 gene structures in certain vertebrates present some variations? (3) Are the evolutionary rates of vertebrate ace and ace2 similar? (4) Are exons in ace and ace2 homologous or not?

2. Results

2.1. Collection of ace and ace2 Sequences

We successfully collected 35 entire ace and ace2 coding sequences (CDS) from their genomes or corresponding predicted gene sets (Table 1). Combing with the verified sequences of human ace and ace2, we performed multiple sequence alignment of these 36 pairs of ace and ace2 CDS and generated a total of 4107 and 2850 aligned sites for ace (Figure S2) and ace2 (Figure S3), respectively. Meanwhile, ace and ace2 CDS from a cavefish (Sinocyclocheilus anshuiensis; Sa) and amphibious blue-spotted mudskipper (Boleophthalmus pectinirostris; Bp) were well supported by corresponding transcriptome assemblies, which were published in our previous papers [13,14]. Thus, our data suggest a good reliability of these extracted CDS.

2.2. Phylogenetic Topologies of ace and ace2 Genes

Phylogenetic topologies of ace and ace2 genes, predicted by the Bayesian inference (BI) method, were robust and highly supported as most of the branches displayed high Bayesian posterior probabilities (BPP = 1; see corresponding nodes in Figure 2 and Figure 3). These topologies were also confirmed by the maximum likelihood (ML) method (Figures S4 and S5). It seems that these topologies of ace and ace2 were mostly similar, while some differences between them were also presented.
For the ace2 genes, two main groups of vertebrates were divided, including tetrapods and ray-finned fishes (Figure 3); while for the ace genes, the tropical clawed frog (Xenopus tropicalis) located at the outer position of the common ancestor of tetrapods and ray-finned fishes (Figure 2). In addition, coelacanth (Latimeria chalumnae) should cluster with tetrapods according to their species tree [15,16]; however, for both ace and ace2, coelacanth located at the outer of the main clades (Figure 2 and Figure 3). This displayed a discordance between the gene trees of ace & ace2 and their corresponding species trees, which may suggest slow evolutionary rates of ace and ace2 during the early speciation of vertebrates.
Meanwhile, the phylogenetic positions of the tiger seahorse (Hippocampus comes) between ace and ace2 are distinct. In the ace gene topology, the tiger seahorse located at the closest position with the representative mudskipper Bp, but it is not consistent with the ace2 gene topology. According to their species tree [17], however, the topologies of ace and ace2 should keep in agreement. This difference may be caused by a special evolutionary episode, which led to an exceptional appearance of the branch for the tiger seahorse ace2.

2.3. Conserved Synteny of ace and ace2 Genes

In searching the conserved synteny of ace, we found no overlaps of ace adjacent genes among tetrapods, ray-finned fishes, the elephant shark (Callorhinchus milii) and the coelacanth (Figure 2). Thus, we treated tetrapods and ray-finned fishes differently, and then selected eight adjacent genes (mettl2a, mrc2, ace, kcnh6, dcaf7, map3k3, ddx42 and strada) for tetrapods and another eight adjacent genes (dlx3b, dlx4b, kat7b, ace, itga3b, mpp2b, tut1 and top2a) for ray-finned fishes.
In their conserved synteny, most of the ace adjacent genes were identified in the 36 vertebrate genomes, but with few failures that could be generated by incomplete assembling of these regions (Figure 3). For the ace2, however, we found that two adjacent genes (vegfd and grpr) are overlapped between tetrapods and ray-finned fishes; while five adjacent genes including ap1s2, cltrn, mbx, mospd2, and glra2 are specific for tetrapods and another five adjacent genes (ppef1, rs1a, cdkl5, pir and cybb) are specific for the genomes of ray-finned fishes (Figure 2). Interestingly, we observed that the elephant shark or coelacanth shared more ace2 adjacent genes with ray-finned fishes (Figure 3) than tetrapods. In summary, the differences of conserved synteny in both ace and ace2 genes between tetrapods and ray-finned fishes strongly support rearrangements of their adjacent regions.

2.4. Substitution Rate Variations and Gene Structural Changes

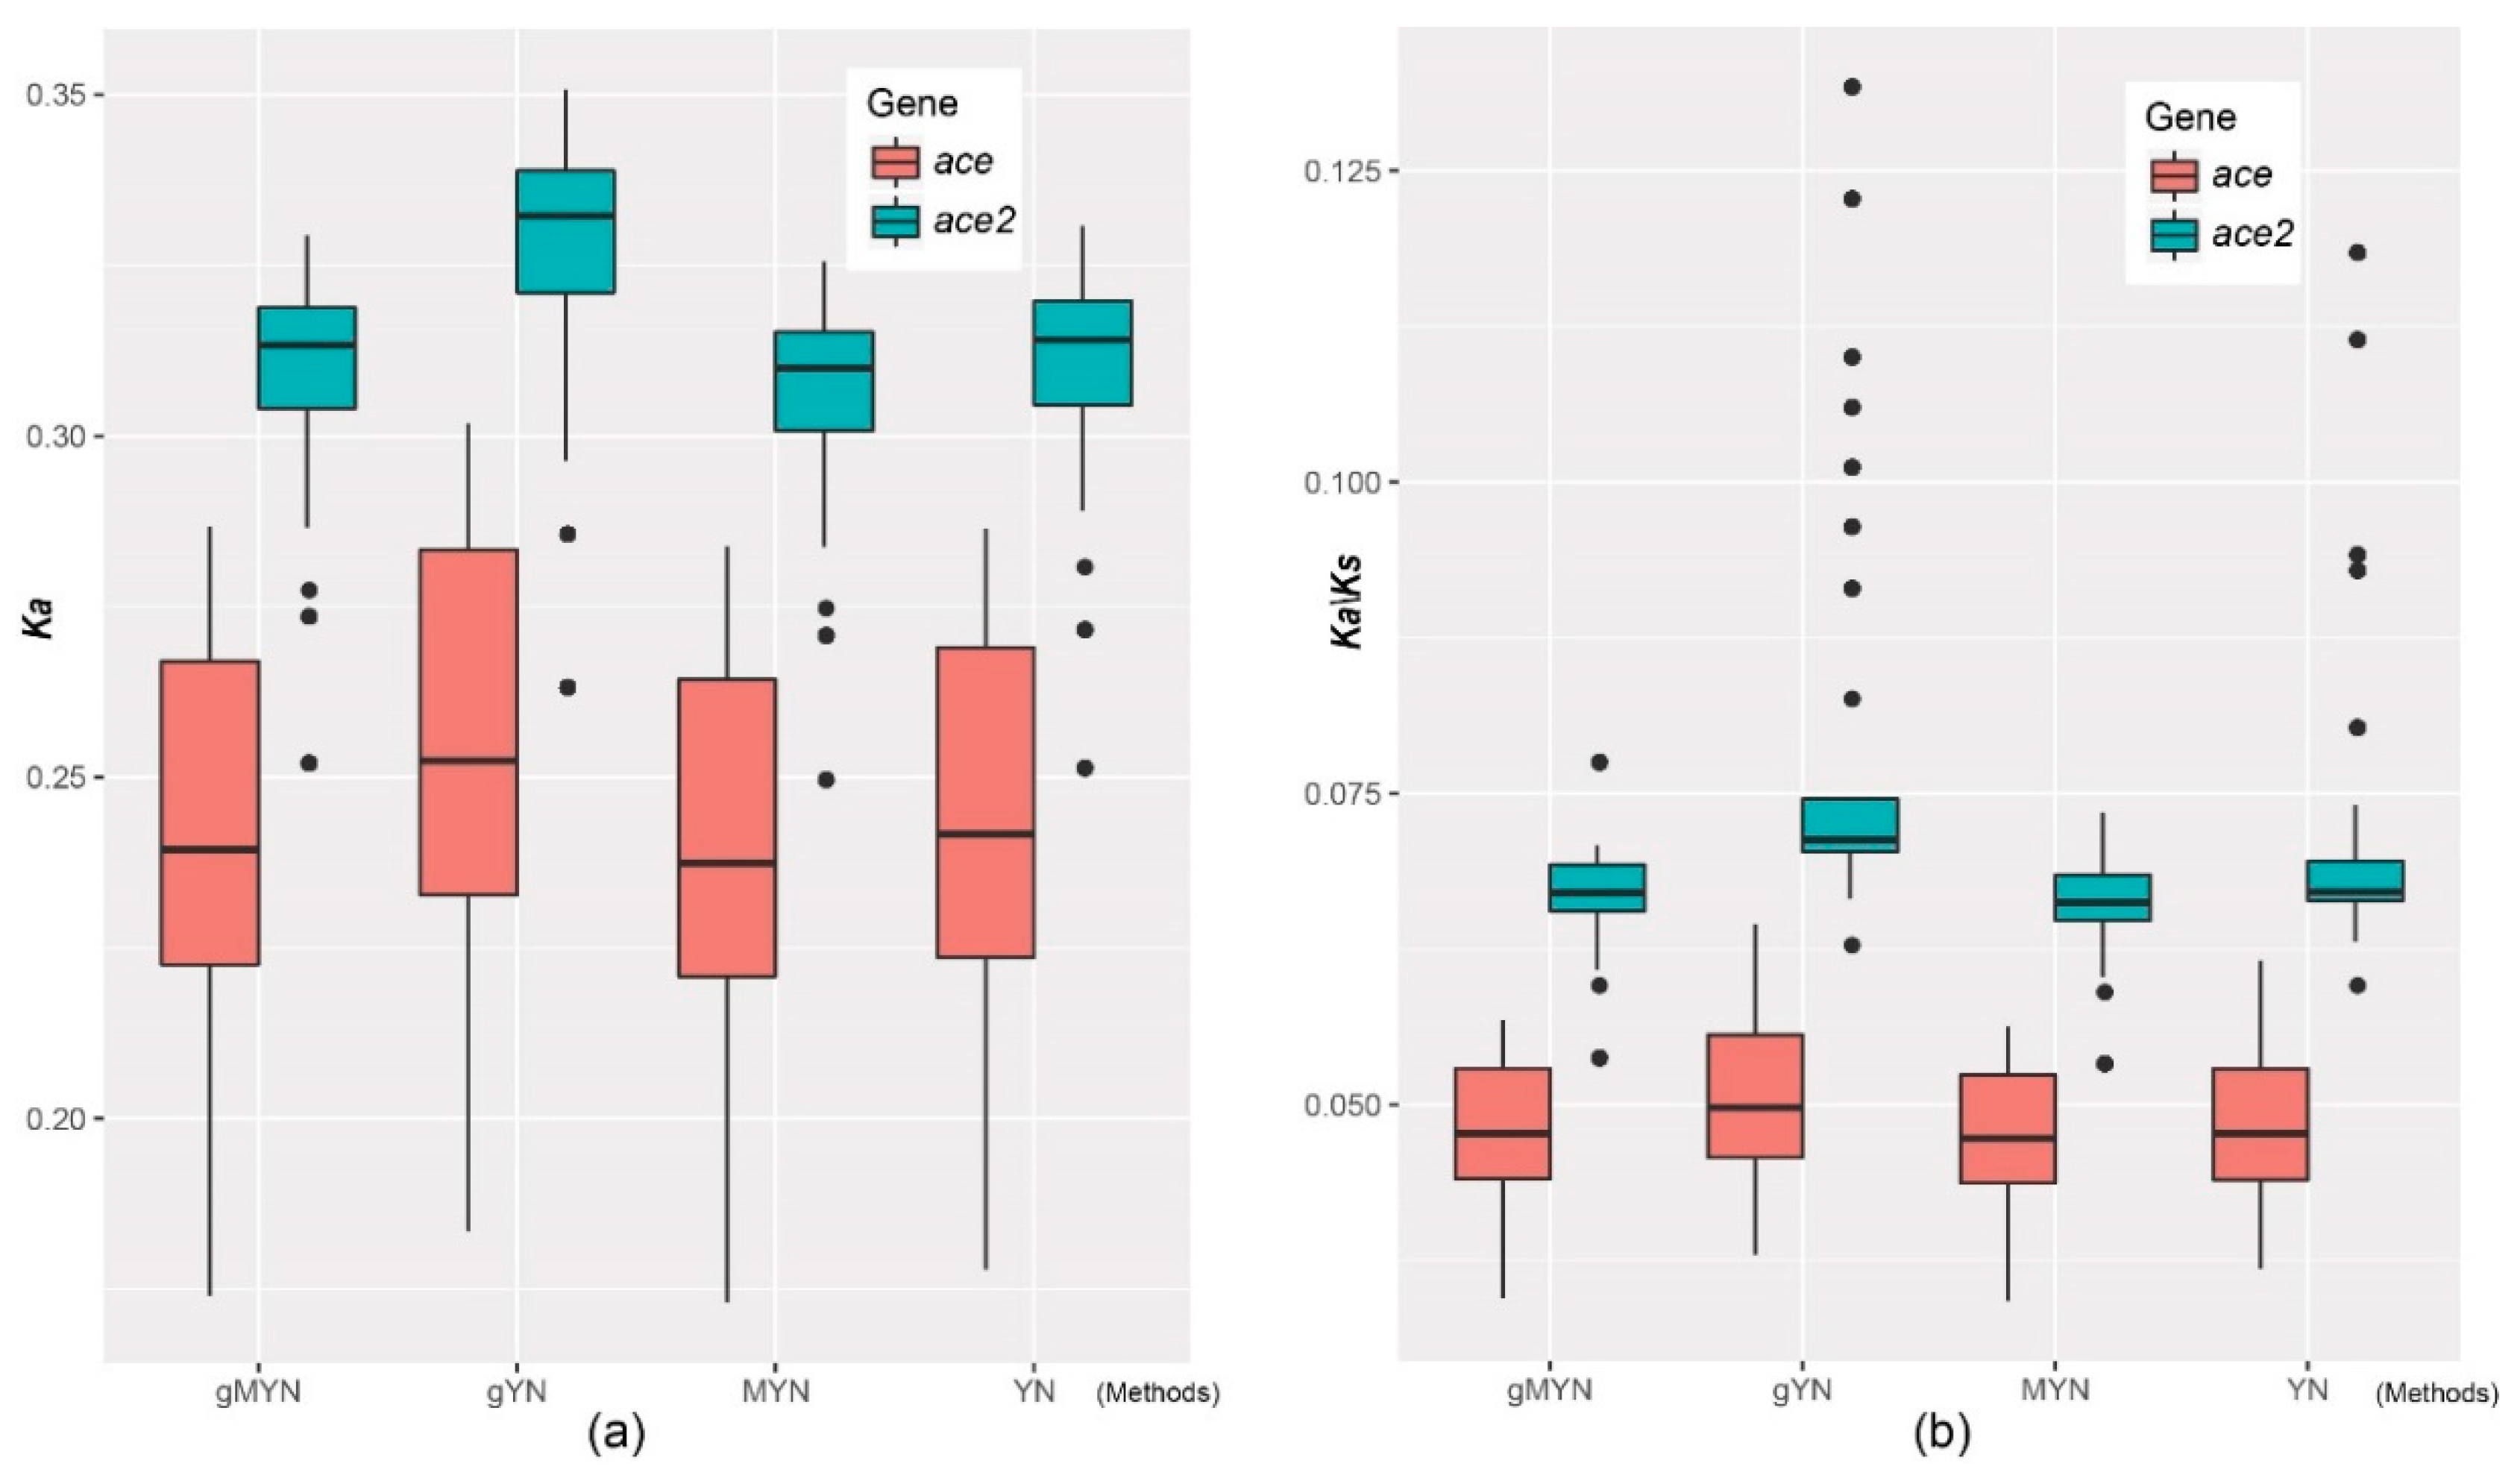
Through comparing nonsynonymous substitution (Ka) and the ratio of non-synonymous to synonymous substitutions (Ka/Ks) based on four methods, including gMYN (Gamma-MYN) [18], gYN (Gamma-YN) [19], MYN (Modified YN) [20] and YN (Yang Z. and Nielsen R. 2000) [21], we found a conserved substitution rate in both ace and ace2, in which most of their Ka/Ks values are less than 0.1. However, ace displayed a lower Ka/Ks average value than ace2 (Figure 4), suggesting that the evolution of ace in vertebrates could be more conservative than ace2.
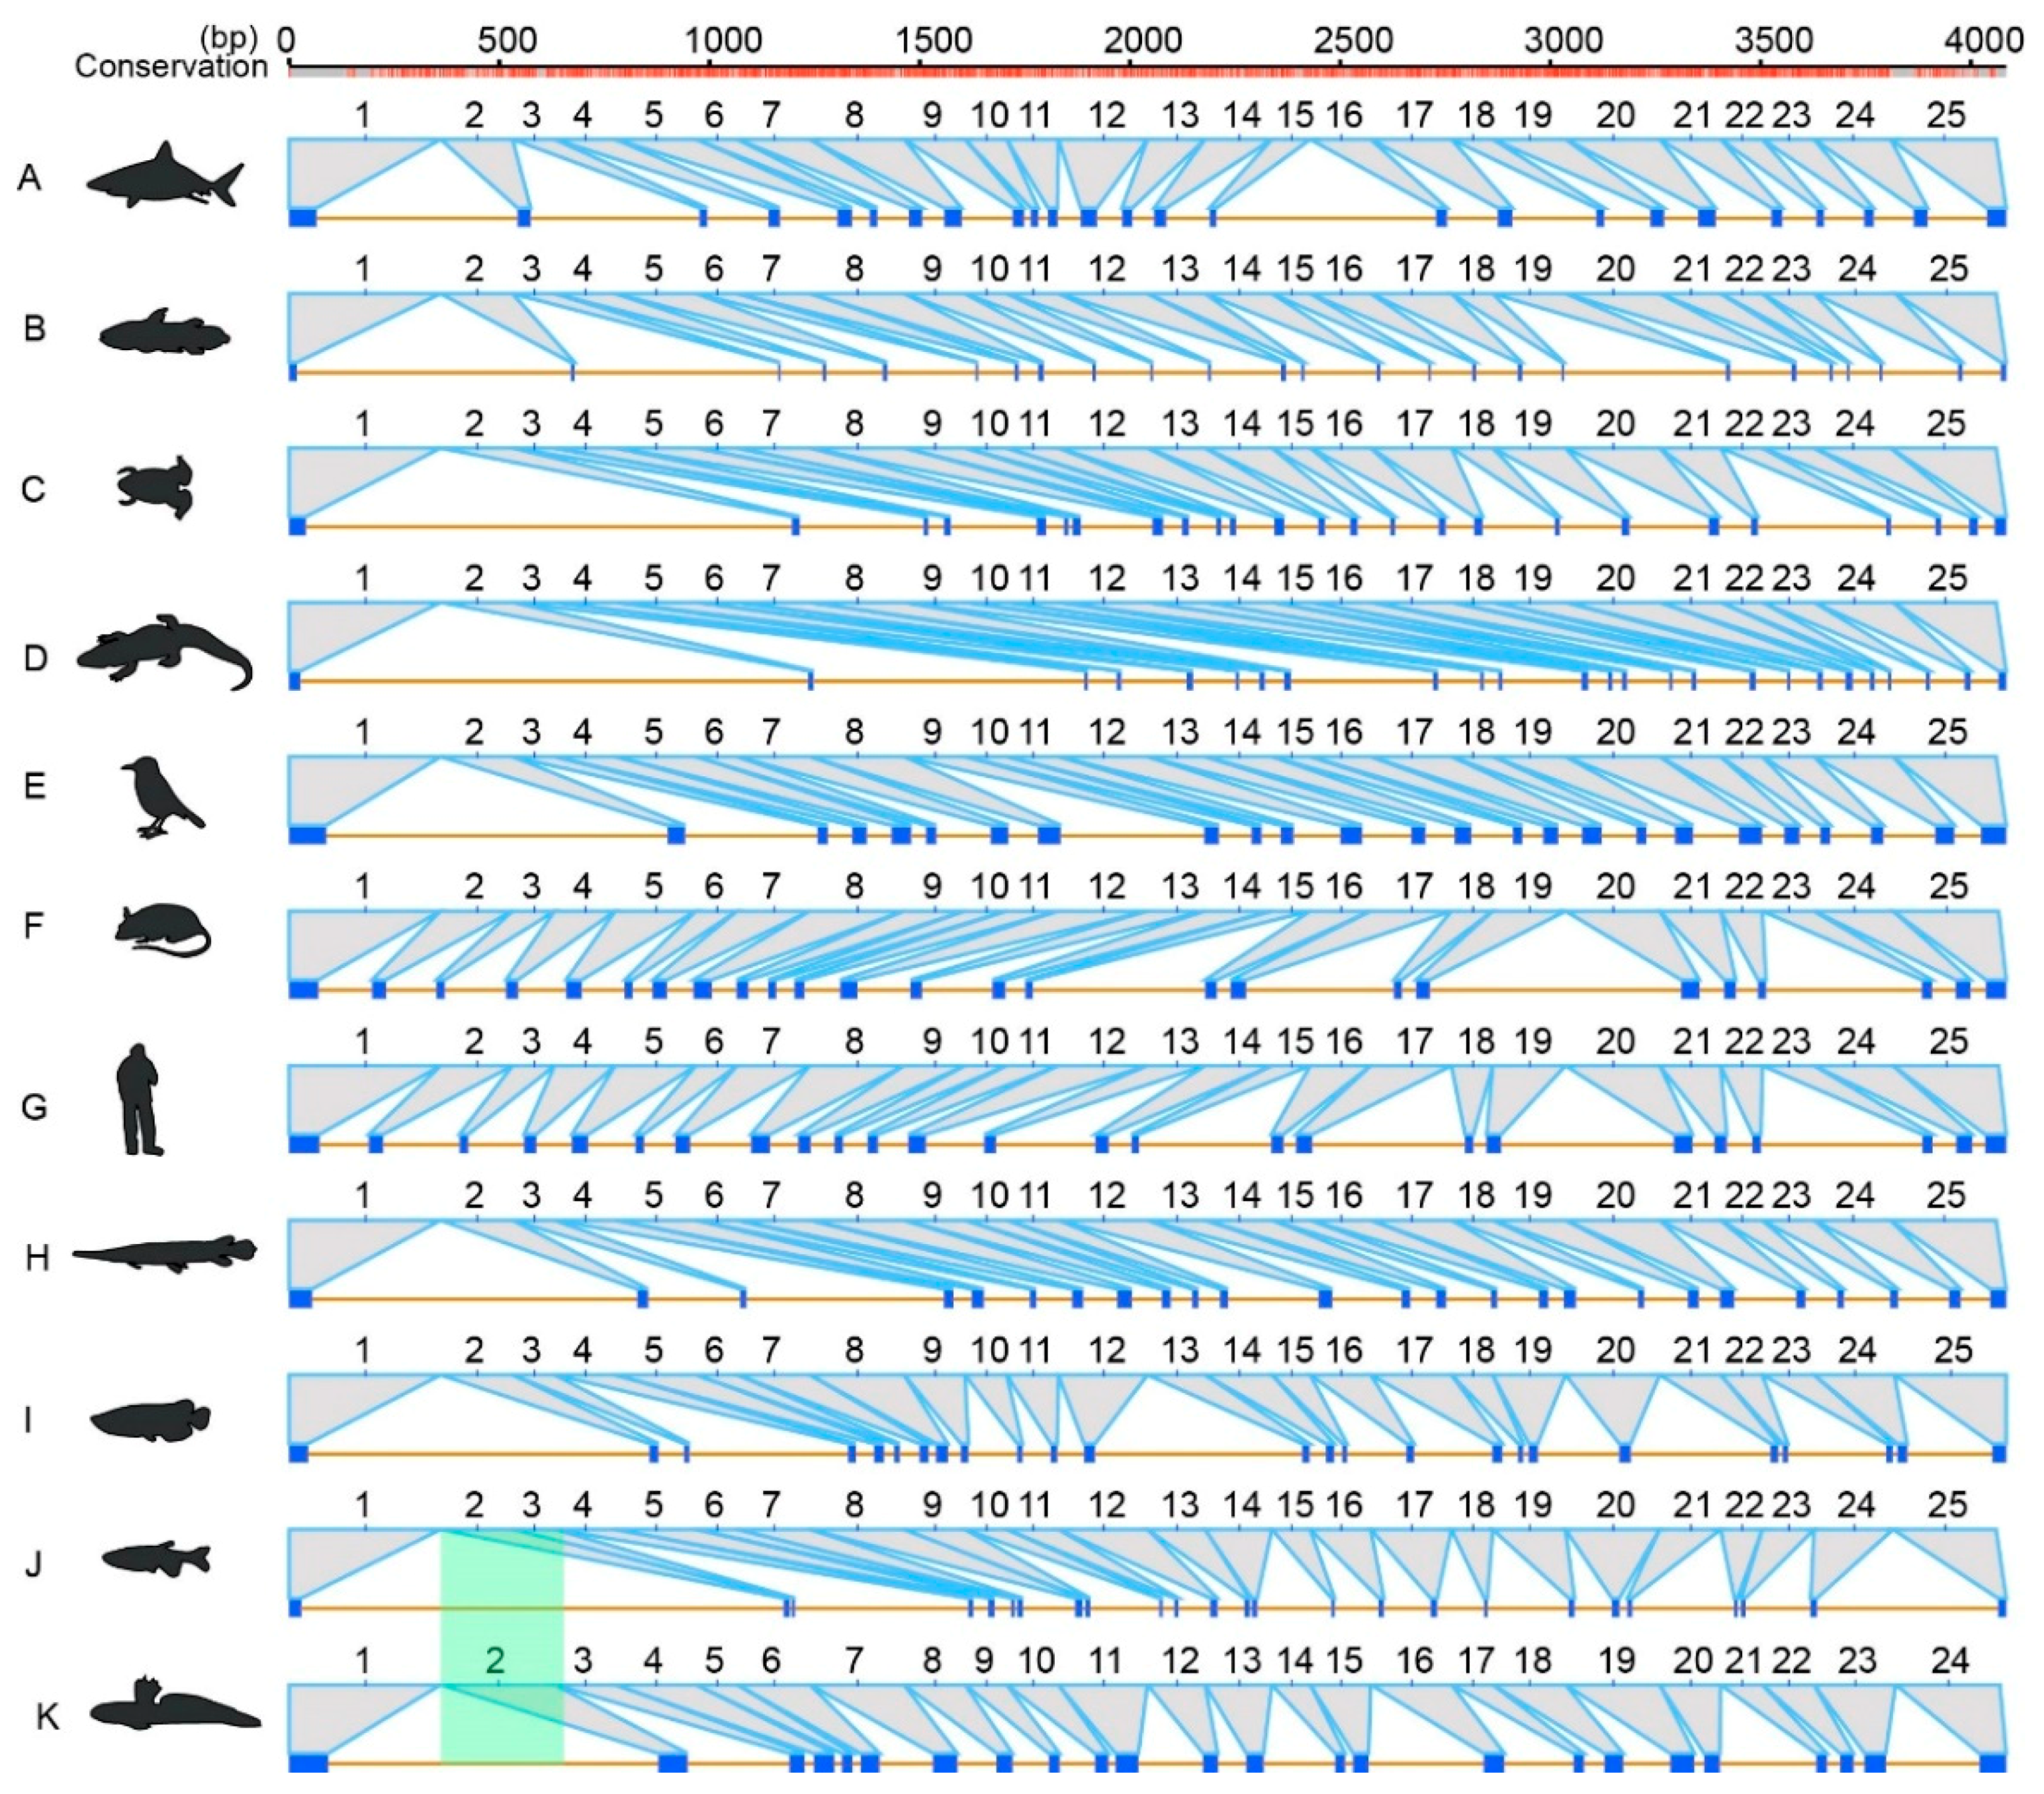
For the gene structures in 11 representatives, including elephant shark, coelacanth, tropical clawed frog, American alligator (Alligator mississippiensis), Tibetan ground-tit (Pseudopodoces humilis), mouse (Mus musculus), human (Homo sapies), spotted gar (Lepisosteus oculatus), Asian arowana (Scleropages formosus), zebrafish (Danio rerio) and the mudskipper Bp, we predicted 25 exons for ace and 18 exons for ace2 (Figure 5 and Figure 6). These exons are mostly shared, but with certain species-special structural variations, such as 24 exons for ace in Bp (Figure 5), 20 exons for ace2 in the elephant shark, and 19 exons for ace2 in the coelacanth (Figure 6). Through further exon alignments and mapping onto corresponding genome assemblies, we determined that the disappearance of one exon in Bp was due to fusion of the exons 2 and 3 (Figure 5); the appearance of two additional exons in the elephant shark was due to disruption of the exon 14; and one additional exon in coelacanth was caused by disruption of the exon 2 (Figure 6).

2.5. Exon Comparisons and Homologous Region Variations

Seven species, including the American alligator, zebrafish, human, spotted gar, house mouse, Tibetan ground-tit and Asian arowana, with similar gene structures were selected for comparison of their exon-length in ace and ace2. We found that the length distribution of exons 3–11 (Block 1) in ace was similar to its exons 15–23 (Block 3; Figure 7a). The length distribution of exons 6–11 (Block 5 in Figure 7b) in ace2 was also similar to the exons 6–11 (Block 2 in Figure 7a) and exons 18–23 (Block 4 in Figure 7a) in ace.
Therefore, we inferred two possible homologous blocks (Blocks 1 and 3) inside the ace genes and three possible homologous blocks (Blocks 2, 4 and 5) that resided throughout ace and ace2. Alignments of protein sequences of the corresponding codons in Blocks 2, 4 and 5 indicated a high similarity among these regions (Figure S6). Interestingly, 13 special amino acid sites were consistent in two conserved blocks (Blocks 2 and 4) of ace, but they were variable in ace2 (see more details in Figure S6).
These data suggest a functional divergence in the initial evolution of ace and ace2. However, the calculation of average Ka/Ks of those corresponding codons based on the four methods (gMYN, gYN, MYN and YN) presented similar levels (Figure 7c), suggesting no apparent difference of evolutionary rates among the three homologous regions (Blocks 2, 4 and 5).
We also examined the sequence identity within each exon among Blocks 2, 4 and 5 in the seven representatives. In general, the Blocks 2 and 4 in ace displayed higher sequence identity values (ranged from 0.6 to 0.8 in Figure S7a) than others (ranged from 0.4 to 0.6; Figure S7b,c). The uneven identity of these homologous regions between ace and ace2 may imply the asynchronous appearance of their ancestors.

3. Discussion

Cardiovascular diseases have been the leading reasons for death in humans worldwide [1,4,11]. The RAS acts as a critical systemic circle to regulate blood pressure, thus maintaining a whole stable blood circulation in our body [2,4]. However, long-time high blood pressure would lead to hypertension to cause related cardiovascular diseases. ACE and ACE2 are pairs of antagonists, in which ACE activates the generation of Ang II, but ACE2 inactivates AngII to reduce the blood pressure; thus ACE2 serves as an ACE inhibitor [1,4] and could be a potential target for neurogenic hypertension [22]. To accelerate the understanding of ACE and ACE2, we investigated ace and ace2 genes from genome assemblies of 36 representative vertebrates, covering cartilaginous fish, ray-finned fishes, amphibians, reptiles, birds and mammals. This study is the first comprehensive investigation of ace and ace2 evolution in vertebrates.

3.1. Early Evolution of ace and ace2 Genes in Vertebrates

Homologs of ace are extensively distributed in animals [7], including vertebrates (such as chimpanzee, cow, rabbit, mouse, chicken, goldfish and electric eel) and invertebrates (such as house fly, mosquito, horn fly, silk worm, fruit fly, Caenorhabditis elegans and bacteria). Similarly, ace2 homologs have also been identified in both vertebrates [23] and invertebrates [9]. This coincidence indicates a very early origin of ace and ace2 in the biological world.
In vertebrates, we proved a conserved evolution of ace and ace2, since their phylogenetic tree is mostly consistent with the species tree, with average Ka/Ks values far less than 1. However, some evolutionary episodes occurred during the evolution of ace and ace2 in vertebrates, mainly reflected by the conflicts of the phylogenetic positions for frog ace and sea horse ace2. In addition, we also determined uneven evolving rates of ace and ace2, with a slightly greater average Ka/Ks values in the former. The gene structures of ace and ace2 are also conserved in vertebrates, and most of them have 25 and 18 exons respectively. However, we also found some special structural variations in the mudskipper Bp, elephant shark and coelacanth, with existence of exon fusion or disruption to decrease or increase the exon numbers (Figure 5 and Figure 6). These interesting findings therefore improve our understanding of ace and ace2 in vertebrates.

3.2. Rearrangements of ace and ace2 Adjacent Regions

In vertebrates, as we know, two rounds of whole-genome duplication (WGD) occurred in the common ancestor [24,25]. More specifically, the two rounds of WGD happened before the agnatha–gnatostoma and chrondrichthyes–osteichthyes split, respectively. In ray-finned fishes, the teleost experienced additional special whole-genome duplication (TSGD), which was regarded as the third round of WGD in vertebrates [26,27]. In our analysis, all examined species should have experienced the first and second rounds of WGD, and the teleost experienced the third one (TSGD).
In general, WGD duplications can generate pseudogenization, subfunctionalization or neofunctionalization [28]. In our present study, we found only one orthologous ace and ace2 in these representative species as evidenced by our synteny analysis. Thus, we assume that the fate of originally duplicated ace and ace2 genes should have experienced fast loss after the genome duplications. In addition, we identified rearrangements of ace and ace2 adjacent regions in tetrapods and ray-finned fishes (Figure 2 and Figure 3). It seems that the rearrangement around ace was more serious than ace2, as there is no overlapped adjacent gene around ace, while sharing two genes in the ace2 adjacent regions.

3.3. Evolution of Homologous Regions between ace and ace2

Based on the similarity of their protein sequences, ace and ace2 are identified as homologous. ACE2 contains only a single 600-aa peptidase domain, whereas ACE orthologs have two such domains [29]. We confirmed that these domains correspond to the conserved exons such as Blocks 2, 4 and 5 (Figure 7a,b). Thus, we deduce that these regions also displayed coincident gene structures.
It is interesting to know the evolutionary changes among these conserved blocks in ace and ace2. However, we found no significant difference among the homologous blocks based on different methods, although a slight difference of average Ka/Ks values was determined between the entire ace and ace2. This indicates the natural selection between entire ace and ace2 and their conserved blocks was slightly different.
In addition, we distinguished a closer similarity between Blocks 2 and 4, which both came from ace. It suggests that the ancestor of ace and ace2 may appear at different times. Through the protein sequence alignments of the conserved regions (Figure S6), we observed some special sites in ACE2, which are different from those in ACE. These data suggest functional divergence of ace and ace2 during their evolution.

4. Materials and Methods

4.1. Gene Extraction, Collection and Confirmation

Firstly, the coding DNA sequences (CDS) of human ace (NM_000789.3) and ace2 (NM_021804.2) were downloaded from the National Center for Biotechnology Information (NCBI). Secondly, genome assemblies of 36 representative vertebrates with high-quality (scaffold N50 values over 1 Mb) were selected to realize gene extraction (Table 1). These species are chosen from chondrichthyes, ray-finned fishes, amphibians, reptiles, birds and mammals. Meanwhile, the corresponding whole-genome CDS datasets for the selected vertebrates were download from NCBI to construct a local database. The ace and ace2 CDS from each species were extracted based on the best hits using BLAST (version 2.2.28, NCBI, Bethesda, MD, USA) [30], with the human ace and ace2 CDS as the queries. We also provided further confirmation of the extracted nucleotide sequences by transcriptome data from the mudskipper Bp and cavefish Sa, which were generated previously by our lab [13,14].

4.2. Conserved Synteny Identification and Phylogenetic Inference

To evaluate the conservation of ace and ace2 genes, we investigated several genes residing in the upstream and the downstream sequences within tetrapod and teleost genomes, respectively. Through the initial search, we found that the adjacent genes of ace and ace2 in tetrapods and teleost were distinct. Thus, we selected different genes in tetrapods and teleosts to perform further synteny analysis respectively. The sequences served as queries for our synteny analysis were from human and zebrafish.
Meanwhile, all collected nucleotide sequences of ace and ace2 were processed for alignments based on a codon-based mode, which was implemented in MEGA (version 7.0 [31], Temple university, Philadelphia, PA, USA) with the Muscle module. The outcome of alignments was subsequently adjusted manually. The final aligned nucleotide sequences were employed to predict their best nucleotide substitution model under the Akaike Infromation Criterion (AIC) by Jmodeltest (version 2.0 [32], University of Vigo, Vigo, Spain). The parameters within the best nucleotide substitution models (TIM2 + I + G for ace and GTR + I + G for ace2) were applied using BI in MrBayes (version 3.2.2 [33], Swedish Museum of Natural History, Stockholm, Sweden). We performed two parallel runs for 2-M generations (four chains per run), sampling every 500 generations. The initial 25% runs were discarded for unreliability. Finally, the maximum clade credibility tree from the remaining topologies was identified by using TreeAnnotator (version 1.7.5 [34], University of Auckland, Auckland, New Zealand). Meanwhile, we also employed the maximum likelihood (ML) method to confirm the topology generated by BI. ML was conducted with RAxML 8.0.17 [35] using a GTR + I + G model for our final likelihood search, and switched to the per-site rate category model during fast bootstrapping with 1000 replicates. To avoid the effect of the third site from each aligned codon, we performed the ML analysis again with the protein sequences that were translated from ace and ace2 nucleotide sequences. Their best amino acid substitution models (WAG + I + G for ACE and JTT + I + G for ACE2) were determined under the Akaike Information Criterion (AIC) [36], which were implemented in ProtTest (version 3.4.2 [37], University of Vigo, Vigo, Spain). The ML analysis and 1000 bootstraps were replicated to infer their node supports in PhyML (version 3.1, University of Montpellier, Montpelier, France [38]).

4.3. Substitution Rate Estimation and Comparison

Considering the Ka/Ks values may differ between ace and ace2 over the evolutionary process, we performed comparisons of the average Ka and Ka/Ks values between the two genes. The pairwise Ka and Ka/Ks values were calculated between each pair with codon-based alignments of ace and ace2 under four methods (gMYN [18], gYN [19], MYN [20] and YN [21]) in KaKs_Calculator (version 2.0, Chinese Academy of Sciences, Beijing, China [39]). The average values of Ka and Ka/Ks were obtained in R language [40] to represent evolutionary rate differences between ace and ace2.

4.4. Examination of Gene Structural Variations

To detect the possible gene structural variations of ace and ace2 in vertebrates, we aligned the collected ace and ace2 CDS onto their corresponding genome assemblies. We selected 11 species to represent the main groups of vertebrates, including the elephant shark, coelacanth, tropical clawed frog, American alligator, Tibetan ground-tit, house mouse, human, spotted gar, Asian arowana, zebrafish and the representative mudskipper Bp. The alignment was performed on NCBI Splign [41] (https://www.ncbi.nlm.nih.gov/sutils/splign/). The generated results of gene structures were integrated and presented on their genome locations. Meanwhile, each coding exon was compared with multiple sequence alignment by a local Perl script. We further chose those ace and ace2 genes without structural variations to compare exon-length distribution. In the homologous regions between ace and ace2, we extracted the codons to compare their average Ka/Ks values as mentioned above. Finally, we compared sequence identity among the exons within homologous regions, which was implemented by a local Perl script and displayed by R language [40].

5. Conclusions

This is the first comprehensive investigation and systematic comparisons of ace and ace2 genes in vertebrates. In our present study, extraction of ace and ace2 genes from 36 vertebrate genomes were realized. In their phylogenetic topology, we observed most consistence with the species tree; however, certain differences appear in coelacanths and frogs, which may suggest a very slow evolutionary rate in the initial evolution of ace and ace2 in vertebrates. We further compared the evolutionary rates within the entire ace and ace2, and found that ace2 evolved slightly faster than ace.
Meanwhile, we counted that exon numbers of ace and ace2 in vertebrates are usually 25 and 18 respectively, whereas certain species exon fusion or disruption may occur to decrease or increase their exon numbers. Interestingly, we determined three homologous regions between ace and ace2, suggesting their origination from gene duplication. However, their uneven sequence identity may suggest that they evolved at different times. In summary, this report provided novel insights into ace and ace2 genes in vertebrates through a series of genomic and molecular comparisons.

Supplementary Materials

The following supplementary materials are available online. Figure S1: Alignment of human ace and ace2 sequences. Figure S2: Alignment of ace sequences from human and other 35 vertebrates. Figure S3: Alignment of ace2 sequences from human and other 35 vertebrates. Figure S4: A phylogenetic tree based on the translated 36 protein sequences of ace encoding regions. Number in each node represents the node support generated by the maximum likelihood (ML) method, and the scale bar stands for amino acid substitutions per site. Figure S5: A phylogenetic tree based on the translated 36 protein sequences of ace2 encoding regions. Figure S6: Protein sequence alignments of the three conserved blocks (2, 4 and 5) in Figure 7 for ace and ace2. Dots with different hot colors indicate the conservation of each site. The red-line frames and arrows indicate the 13 special sites that displayed consistence in the two conserved blocks (2 and 4) in ace, but variable in ace2. Figure S7: Identity comparisons between blocks 1 and 3 & 2 and 4 in ace respectively (a), between Block 2 of ace and Block 5 of ace2 (b), or between Block 4 of ace and Block 5 of ace2 (c).

Author Contributions

J.Y., Q.S. and Y.L. (Yunyun Lv) conceived and designed the experiments. Y.L. (Yunyun Lv), Y.L. (Yanping Li), Y.Y. and L.Z. analyzed the data. Y.L. (Yunyun Lv) wrote the manuscript. Q.S. and J.Y. revised the manuscript.

Funding

This research was supported by the Science and Technology Project of Shenzhen [No. JCYJ20170413155047512], Shenzhen High Technology Research and Development Program [No. JSGG20150916140818695], and Yunnan Innovation and Enhancement Program of Provincial Science and Technology Department [No. 2016AB024].

Acknowledgments

We are grateful for these previously published genomes that are associated with the main content of this article. The instructive comments from two anonymous reviewers are also appreciated.

Conflicts of Interest

The authors declare no conflict of interest.

References

  1. Cushman, D.W.; Ondetti, M.A. Design of angiotensin converting enzyme inhibitors. Nat. Med. 1999, 5, 1110–1113. [Google Scholar] [CrossRef] [PubMed]
  2. Sparks, M.A.; Crowley, S.D.; Gurley, S.B.; Mirotsou, M.; Coffman, T.M. Classical renin-angiotensin system in kidney physiology. Compr. Physiol. 2014, 4, 1201–1228. [Google Scholar] [PubMed]
  3. Chappell, M.C. Biochemical evaluation of the renin-angiotensin system: The good, bad, and absolute? Am. J. Physiol. Heart Circ. Physiol. 2016, 310, 137–152. [Google Scholar] [CrossRef] [PubMed]
  4. Atlas, S.A. The renin-angiotensin aldosterone system: Pathophysiological role and pharmacologic inhibition. J. Manag. Care Pharm. 2007, 13, 9–20. [Google Scholar] [CrossRef] [PubMed]
  5. Yim, H.E.; Yoo, K.H. Renin-angiotensin system-considerations for hypertension and kidney. Electrolyte Blood Press 2008, 6, 42–50. [Google Scholar] [CrossRef] [PubMed]
  6. Ouali, R.; Berthelon, M.C.; Begeot, M.; Saez, J.M. Angiotensin Ii receptor subtypes At1 and At2 are down-regulated by angiotensin Ii through At1 receptor by different mechanisms. Endocrinology 1997, 138, 725–733. [Google Scholar] [CrossRef] [PubMed]
  7. Corvol, P.; Eyries, M.; Soubrier, F. Peptidyl-dipeptidase A/angiotensin I-converting enzyme. In Handbook of Proteolytic Enzymes (Second Edition); Elsevier: Paris, France, 2004; Volume 1, pp. 332–346. [Google Scholar]
  8. Riordan, J.F. Angiotensin-I-converting enzyme and its relatives. Genome Biol. 2003, 4, 225. [Google Scholar] [CrossRef] [PubMed] [Green Version]
  9. Fournier, D.; Luft, F.C.; Bader, M.; Ganten, D.; Andrade-Navarro, M.A. Emergence and evolution of the renin–angiotensin–aldosterone system. J. Mol. Med. 2012, 90, 495–508. [Google Scholar] [CrossRef] [PubMed] [Green Version]
  10. Roca-Ho, H.; Riera, M.; Palau, V.; Pascual, J.; Soler, M.J. Characterization of Ace and Ace2 expression within different organs of the nod mouse. Int. J. Mol. Sci. 2017, 18, 563. [Google Scholar] [CrossRef] [PubMed]
  11. Xia, H.; Lazartigues, E. Angiotensin-converting enzyme 2 in the brain: Properties and future directions. J. Neurochem. 2008, 107, 1482–1494. [Google Scholar] [CrossRef] [PubMed]
  12. Tikellis, C.; Thomas, M. Angiotensin-converting enzyme 2 (ACE2) is a key modulator of the renin angiotensin system in health and disease. Int. J. Pept. 2012, 2012, 256–294. [Google Scholar] [CrossRef] [PubMed]
  13. Yang, J.; Chen, X.; Bai, J.; Fang, D.; Qiu, Y.; Jiang, W.; Yuan, H.; Bian, C.; Lu, J.; He, S. The Sinocyclocheilus cavefish genome provides insights into cave adaptation. BMC Biol. 2016, 14, 1. [Google Scholar] [CrossRef] [PubMed]
  14. You, X.; Bian, C.; Zan, Q.; Xu, X.; Liu, X.; Chen, J.; Wang, J.; Qiu, Y.; Li, W.; Zhang, X. Mudskipper genomes provide insights into the terrestrial adaptation of amphibious fishes. Nat. Commun. 2014, 5, 5594. [Google Scholar] [CrossRef] [PubMed] [Green Version]
  15. Amemiya, C.T.; Alfoldi, J.; Lee, A.P.; Fan, S.; Philippe, H.; Maccallum, I.; Braasch, I.; Manousaki, T.; Schneider, I.; Rohner, N. The African coelacanth genome provides insights into tetrapod evolution. Nature 2013, 496, 311–316. [Google Scholar] [CrossRef] [PubMed] [Green Version]
  16. Braasch, I.; Gehrke, A.R.; Smith, J.J.; Kawasaki, K.; Manousaki, T.; Pasquier, J.; Amores, A.; Desvignes, T.; Batzel, P.; Catchen, J.; et al. The spotted gar genome illuminates vertebrate evolution and facilitates human-teleost comparisons. Nat. Genet. 2016, 48, 427–437. [Google Scholar] [CrossRef] [PubMed] [Green Version]
  17. Lin, Q.; Fan, S.; Zhang, Y.; Xu, M.; Zhang, H.; Yang, Y.; Lee, A.P.; Woltering, J.M.; Ravi, V.; Gunter, H.M.; et al. The seahorse genome and the evolution of Its specialized morphology. Nature 2016, 540, 395–399. [Google Scholar] [CrossRef] [PubMed]
  18. Wang, D.P.; Wan, H.L.; Zhang, S.; Yu, J. Gamma-MYN: A new algorithm for estimating Ka and Ks with consideration of variable substitution rates. Biol. Direct. 2009, 4, 20. [Google Scholar] [CrossRef] [PubMed]
  19. Wang, D.; Zhang, S.; He, F.; Zhu, J.; Hu, S.; Yu, J. How do variable substitution rates influence Ka and Ks calculations? Genom. Proteom. Bioinf. 2009, 7, 116–127. [Google Scholar] [CrossRef]
  20. Zhang, Z.; Li, J.; Yu, J. Computing Ka and Ks with a consideration of unequal transitional substitutions. BMC Evol. Biol. 2006, 6, 44. [Google Scholar] [CrossRef] [PubMed]
  21. Yang, Z.H.; Nielsen, R. Estimating synonymous and nonsynonymous substitution rates under realistic evolutionary models. Mol. Biol. Evol. 2000, 17, 32–43. [Google Scholar] [CrossRef] [PubMed]
  22. Feng, Y.; Xia, H.; Santos, R.A.; Speth, R.; Lazartigues, E. Angiotensin-converting enzyme 2: A new target for neurogenic hypertension. Exp. Physiol. 2010, 95, 601–606. [Google Scholar] [CrossRef] [PubMed]
  23. Chou, C.-F.; Loh, C.B.; Foo, Y.K.; Shen, S.; Fielding, B.C.; Tan, T.H.; Khan, S.; Wang, Y.; Lim, S.G.; Hong, W. Ace2 orthologues in non-mammalian vertebrates (Danio, Gallus, Fugu, Tetraodon and Xenopus). Gene 2006, 377, 46–55. [Google Scholar] [CrossRef] [PubMed]
  24. Guyomard, R.; Boussaha, M.; Krieg, F.; Hervet, C.; Quillet, E. A synthetic rainbow trout linkage map provides new insights into the salmonid whole genome duplication and the conservation of synteny among teleosts. BMC Genet. 2012, 13, 15. [Google Scholar] [CrossRef] [PubMed]
  25. Glasauer, S.M.; Neuhauss, S.C. Whole-genome duplication in teleost fishes and its evolutionary consequences. Mol. Genet. Genomics 2014, 289, 1045–1060. [Google Scholar] [CrossRef] [PubMed] [Green Version]
  26. Kasahara, M.; Naruse, K.; Sasaki, S.; Nakatani, Y.; Qu, W.; Ahsan, B.; Yamada, T.; Nagayasu, Y.; Doi, K.; Kasai, Y. The medaka draft genome and insights into vertebrate genome evolution. Nature 2007, 447, 714. [Google Scholar] [CrossRef] [PubMed]
  27. Meyer, A.; Van de Peer, Y. From 2R to 3R: Evidence for a fish-specific genome duplication (FSGD). Bioessays 2005, 27, 937–945. [Google Scholar] [CrossRef] [PubMed]
  28. Inoue, J.; Sato, Y.; Sinclair, R.; Tsukamoto, K.; Nishida, M. Rapid genome reshaping by multiple-gene loss after whole-genome duplication in teleost fish suggested by mathematical modeling. Proc. Natl. Acad. Sci. USA 2015, 112, 14918–14923. [Google Scholar] [CrossRef] [PubMed] [Green Version]
  29. Cornell, M.J.; Williams, T.A.; Lamango, N.S.; Coates, D.; Corvol, P.; Soubrier, F.; Hoheisel, J.; Lehrach, H.; Isaac, R.E. Cloning and expression of an evolutionary conserved single-domain angiotensin converting enzyme from drosophila melanogaster. J. Biol. Chem. 1995, 270, 13613–13619. [Google Scholar] [CrossRef] [PubMed]
  30. Lobo, I. Basic local alignment search tool (Blast). J. Mol. Biol. 2012, 215, 403–410. [Google Scholar]
  31. Kumar, S.; Stecher, G.; Tamura, K. Mega7: Molecular evolutionary genetics analysis version 7.0 for bigger datasets. Mol. Biol. Evol. 2016, 33, 1870–1874. [Google Scholar] [CrossRef] [PubMed]
  32. Darriba, D.; Taboada, G.L.; Doallo, R.; Posada, D. Jmodeltest 2: More models, new heuristics and parallel computing. Nat. Methods 2012, 9, 772. [Google Scholar] [CrossRef] [PubMed]
  33. Ronquist, F.; Teslenko, M.; Van Der Mark, P.; Ayres, D.L.; Darling, A.; Hohna, S.; Larget, B.; Liu, L.; Suchard, M.A.; Huelsenbeck, J.P. Mrbayes 3.2: Efficient bayesian phylogenetic inference and model choice across a large model space. Syst. Biol. 2012, 61, 539–542. [Google Scholar] [CrossRef] [PubMed]
  34. Drummond, A.J.; Rambaut, A. Beast: Bayesian evolutionary analysis by sampling trees. BMC Evol. Biol. 2007, 7, 214. [Google Scholar] [CrossRef] [PubMed] [Green Version]
  35. Stamatakis, A. Stamatakis A. RAxML-VI-HPC: Maximum likelihood-based phylogenetic analyses with thousands of taxa and mixed models, v. 7.03. Bioinformation 2006, 22, 2688–2690. [Google Scholar] [CrossRef] [PubMed]
  36. Posada, D.; Buckley, T.R. Model selection and model averaging in phylogenetics: Advantages of akaike information criterion and bayesian approaches over likelihood ratio tests. Syst. Biol. 2004, 53, 793–808. [Google Scholar] [CrossRef] [PubMed]
  37. Darriba, D.; Taboada, G.L.; Doallo, R.; Posada, D. ProtTest 3: Fast selection of best-fit models of protein evolution. Bioinformatics 2011, 27, 1164–1165. [Google Scholar] [CrossRef] [PubMed]
  38. Guindon, S.; Dufayard, J.F.; Lefort, V.; Anisimova, M.; Hordijk, W.; Gascuel, O. New algorithms and methods to estimate maximum-likelihood phylogenies: Assessing the performance of PhyML 3.0. Syst. Biol. 2010, 59, 307–321. [Google Scholar] [CrossRef] [PubMed]
  39. Zhang, Z.; Li, J.; Zhao, X.Q.; Wang, J.; Wong, G.K.S.; Yu, J. Kaks_calculator: Calculating Ka and Ks through model selection and model averaging. Genom. Proteom. Bioinf. 2006, 4, 259–263. [Google Scholar] [CrossRef]
  40. R Development Core Team. R: A Language and Environment for Statistical Computing; The R Foundation for Statistical Computing: Vienna, Austria, 2013. [Google Scholar]
  41. Kapustin, Y.; Souvorov, A.; Tatusova, T.; Lipman, D. Splign: Algorithms for computing spliced alignments with identification of paralogs. Biol. Direct. 2008, 3, 20. [Google Scholar] [CrossRef] [PubMed]
Figure 1. The classical pathway of vertebrate renin–angiotensin system (RAS). Grey arrows emphasize the enzymes that catalyze related reactions. Red words stand for the products, and the “|” between red and black words indicate the cleavage sites.
Molecules 23 02923 g001
Figure 2. A phylogenetic tree based on 36 ace synteny sequences. The left and the right numbers in each node indicate the Bayesian posterior probability (BPP = 1) and the node supports (generated by the ML method), respectively. The scale bar represents nucleotide substitutions per site.
Molecules 23 02923 g002
Figure 3. A phylogenetic tree based on 36 ace2 synteny sequences.
Molecules 23 02923 g003
Figure 4. Ka and Ka/Ks values for ace and ace2 coding sequences. The average values of Ka (a) and Ka/Ks (b) in ace2 using any of the four methods are greater than those of ace.
Molecules 23 02923 g004
Figure 5. Sequence alignments of the ace gene structures in 11 representative vertebrates. Numbers in the top stand for the length of nucleotide base pairs (bp). Red bars in the top indicate the conservation status of the ace alignments. The green color shaded region indicates the species-special variations. The representatives include elephant shark (A), coelacanth (B), tropical clawed frog (C), American alligator (D), Tibetan ground-tit (E), house mouse (F), human (G), spotted gar (H), Asian arowana (I), zebrafish (J) and the representative mudskipper Bp (K).
Molecules 23 02923 g005
Figure 6. Sequence alignments of the ace2 gene structures in 11 representative vertebrates. The green color shaded regions indicate the species-special variations. Find corresponding species names (AK) in the legend of Figure 5.
Molecules 23 02923 g006
Figure 7. Exon-length distribution in seven representative vertebrates. (a) ace genes. (b) ace2 genes. (c) Comparisons of average Ka/Ks values among the three homologous blocks using four methods. The red color shaded regions indicate the two homologous blocks (1 and 3) in ace, and the light-blue color shaded regions indicate the three homologous blocks (2, 4 and 5) among ace and ace2.
Molecules 23 02923 g007
Table 1. Selected 36 vertebrates and corresponding Genebank ID for their sequenced genomes.
ClassCommon NameSpecies NameGenBank ID
ChondrichthyesElephant sharkCallorhynchus miliiGCA_000165045.2
SarcopterygiiCoelacanthLatimeria chalumnaeGCF_000225785.1
AmphibiansTropical clawed frogXenopus tropicalisGCA_000004195.3
AvesGolden-collared manakinManacus vitellinusGCA_001715985.2
Tibetan ground-titPseudopodoces humilisGCA_000331425.1
ReptilesAmerican alligatorAlligator mississippiensisGCF_000281125.3
GekkoGekko japonicusGCA_001447785.1
Green anoleAnolis carolinensisGCA_000090745.2
Python bivittatusPython bivittatusGCA_000186305.2
MammalsHouse mouseMus musculusGCF_000001635.25
Norway ratRattus norvegicusGCF_000001895.5
Yangtze River dolphinLipotes vexilliferGCA_000442215.1
Killer whaleOrcinus orcaGCA_000331955.2
Crab eating macaqueMacaca fascicularisGCF_000364345.1
HumanHomo sapiensGCF_000001405.37
ActinopterygiiSpotter garLepisosteus oculatusGCF_000242695.1
Asian arowanaScleropages formosusGCF_001624265.1
ZebrafishDanio rerioGCF_000002035.4
Chinese golden-line fish (Sa)Sinocyclocheilus anshuiensisGCF_001515605.1
Channel catfishIctalurus punctatusGCF_001660625.1
Mexican tetraAstyanax mexicanusGCF_000372685.1
Red-bellied piranhaPygocentrus nattereriGCF_001682695.1
Northern pikeEsox luciusGCA_000721915.3
Rainbow troutOncorhynchus mykissGCF_002163495.1
Blue-spotted mudskipper (Bp)Boleophthalmus pectinirostrisGCF_000788275.1
Tiger seahorseHippocampus comesGCF_001891065.1
MummichogFundulus heteroclitusGCA_000826765.1
Amazon mollyPoecilia formosaGCA_000485575.1
Sailfin mollyPoecilia latipinnaGCA_001443285.1
Tongue soleCynoglossus semilaevisGCF_000523025.1
Barramundi perchLates calcariferGCF_001640805.1
Large yellow croakerLarimichthys croceaGCF_000972845.1
TilapiaOreochromis niloticusGCF_001858045.1
African cichlidNeolamprologus brichardiGCF_000239395.1
Burton mouth brooderHaplochromis burtoniGCF_000239415.1
Nyerrrei cichlidPundamilia nyerereiGCF_000239375.1