1. Introduction
1-Triacontanol (TRIA), a fatty alcohol composed of 30 atoms of carbon, acts as a natural growth regulator in plants. It can be found in the epicuticular waxes of a widely diverse range of genera, such as California croton (
Croton californicus), blueberry (
Vaccinium ashei), Brazilian palm (
Copernicia cerifera), runner bean (
Phaseolus multiflorus), white clover (
Trifolium repens), alfalfa (
Medicago sativa) and in physic nut (
Jatropha curcas), for example. It is used to enhance the crop production in millions of hectares, particularly in Asia [
1,
2,
3,
4,
5,
6,
7,
8]. Several researchers have reported the TRIA-mediated improvement of several parameters in various crops, such as growth, yield, photosynthesis, protein synthesis, uptake of water and nutrients, nitrogen-fixation, enzymatic activities and contents of free amino acids, reducing sugars, soluble proteins, and active constituents as essential oil. Furthermore, TRIA could enhance the physiological efficiency of the cells and, thus, could exploit the genetic potential of the plants to a large extent [
1,
9,
10].
To assess the effects of TRIA-containing products on plants, accurate determinations of the concentration of TRIA and quantification of the doses are needed. Several published methods for the analysis of fatty alcohols are based on GC approaches that include a derivatization step, which is required to enhance the volatility of these compounds. Recently, a method for the determination of TRIA and other lipophilic constituents in vegetables based on saponification, liquid-liquid extraction and derivatization with TMS and GC-MS analysis was proposed. Despite the sensitivity and specificity that can be achieved with GC-MS, the main drawbacks of these determinations are related to the derivatization procedure and to the relative high cost and complex management of GC-MS equipment [
5,
11,
12,
13,
14]. Furthermore, although sample derivatization can be quite easily managed for dried vegetable samples, it can be difficult for aqueous solutions or for complex formulated products containing emulsifiers, since additional drying steps are required. Furthermore, the methods using derivatization can suffer from the presence of a strong matrix effect, due to the fact that also interfering constituents can react with the silanization or esterification reagents. Liquid chromatography (LC)-based techniques may offer the opportunity to perform chromatographic analyses without derivatization.
Few data about the HPLC analysis of TRIA have been found in literature to date [
6]. This may be addressed to the fact that TRIA does not contain a chromophore in its structure, hence UV detection could not be used. An alternative to overcome this issue and to avoid MS spectrometry is the use Refractive Index (RI) or Evaporative Light Scattering Detection (ELSD). ELSD offers the opportunity to use gradient elution and, to the best of our knowledge, no specific application to the analysis of TRIA has been reported in literature yet. In fact, only Hwang and Coll [
6]. proposed an HPLC-ELSD method for the analysis of total policosanols in grain sorghum kernels and dried distilled grains, using silica as stationary phase. However, the authors reported that the separation of policosanols was not sufficient, hence their characterization was performed by GC. Due to the diffusion of TRIA-containing products for agricultural purposes, the development of a validated analytical method that allows its determination in different types of matrices is increasingly needed. As a matter of fact, TRIA may be present in these products at concentrations of 10–1000 ppm or dispersed in water for fertilization at low concentrations (10–50 ppm). Furthermore, it may be obtained in high amounts (up to 1–3% of dried extracts) by lipophilic extraction from vegetable matrices. For quantitative purposes and for the development of the method we used as plant source of TRIA
Medicago sativa. Dried plant materials, enzymatic extracts, supercritical CO
2 as well as pure TRIA were used as samples.
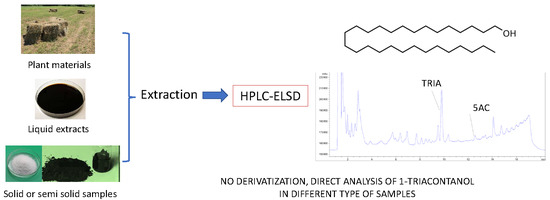
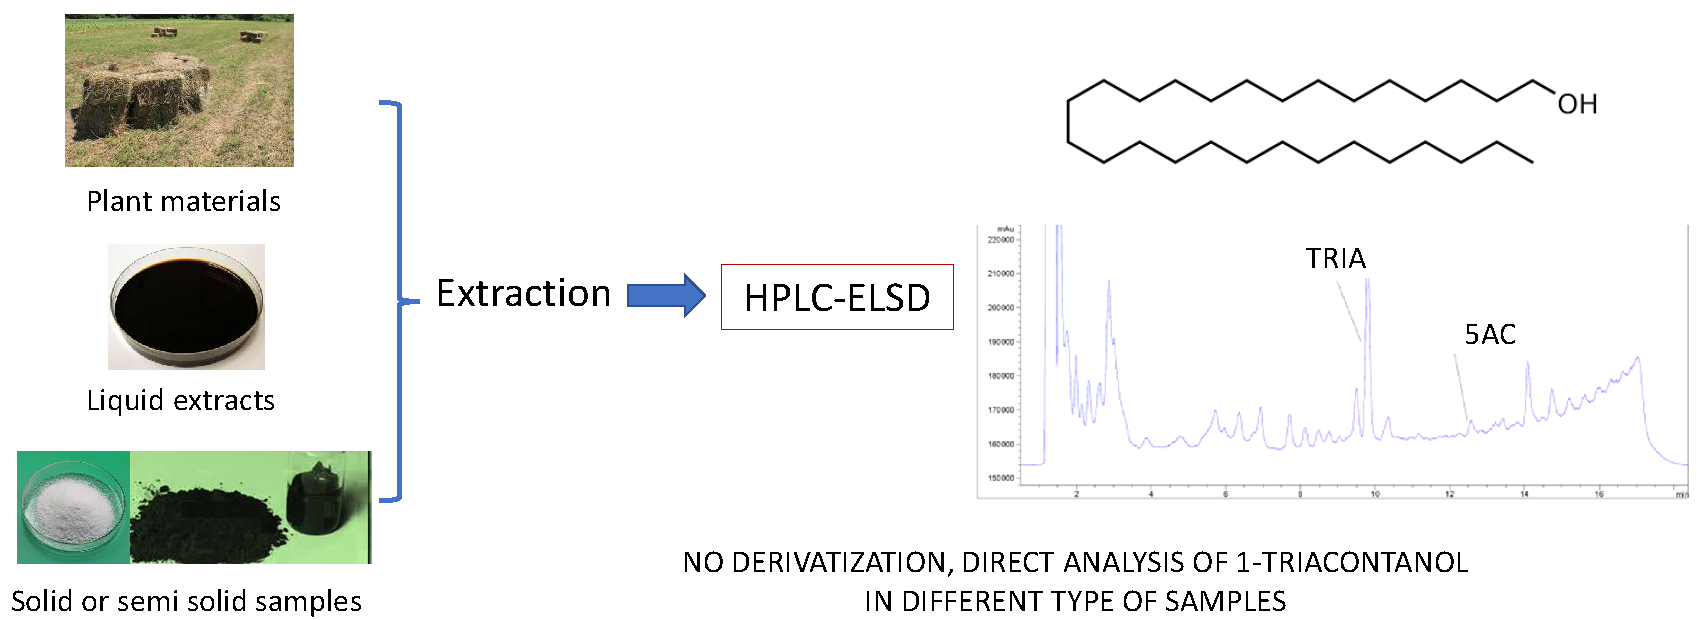
In this paper we present a new approach for the analysis of TRIA in plant materials and in formulated products using 5-α-cholestane (5AC) as internal standard (IS). The method, which allows the determination of TRIA up to 0.6 mg/L, doesn’t involve any derivatization neither the use of mass spectrometry. Extraction, ELSD parameters and chromatographic conditions were optimized and validated. The method is easily applicable and compared to conventional GC approaches allow direct analysis of TRIA without derivatization.
2. Results and Discussion
The method allows the determination and quantification of TRIA in several types of matrices, being useful for the analysis of the different types of products used in the agricultural field. The method is sufficiently sensitive to allow to detect TRIA in aqueous solutions up to 0.6 mg/L and is feasible also for the analysis of pure materials or highly concentrated lipophilic extracts. GC-based methods require derivatization [
5,
6,
11,
12], which can be problematic in the presence of heavy matrices containing interfering compounds that can react with the derivatizing agents. Furthermore, liquid products containing low amounts of TRIA (as many biostimulant formulations that are nowadays present on the market) may be critical for GC sample preparation due to high water contents or due to the presence of other formulants like surfactants. Thus, the proposed approach can be useful for the analysis of such products. Due to sensitivity, simple dilutions can be performed, if the sample contains sufficient TRIA amounts. On the other hand, extraction with dichloromethane in the presence of ISTD can be used with any type of liquid product and formulations. In the proposed method we used the Evaporative Light Scattering Detector (ELSD), which is a cheap instrument widely available on the market and easier to use compared to mass spectrometry. Furthermore, compared to refractive index detectors, ELSD is more versatile, given the possibility to perform gradient elutions that allow one to improve sample separation. Compared with a previously published HPLC method [
6] the approach described in the present work uses a reverse phase column instead of direct phase chromatography.
2.1. Extraction of TRIA from Dried and Liquid Materials
Due to the lipophilic nature of TRIA, dichloromethane was revealed to be the most suitable solvent for its extraction from different matrices. Extraction from liquid samples can be performed by liquid/liquid partition, while extraction from plant material requires a 15 min extraction in an ultrasoonic bath. Due to the poor solubility of TRIA in water, its concentration in solution can be low. However, using surfactants, suspensions or colloidal suspensions can be obtained, and higher concentrations of TRIA in water could be achieved.
2.2. Specificity, Linearity, LOQ and LOD
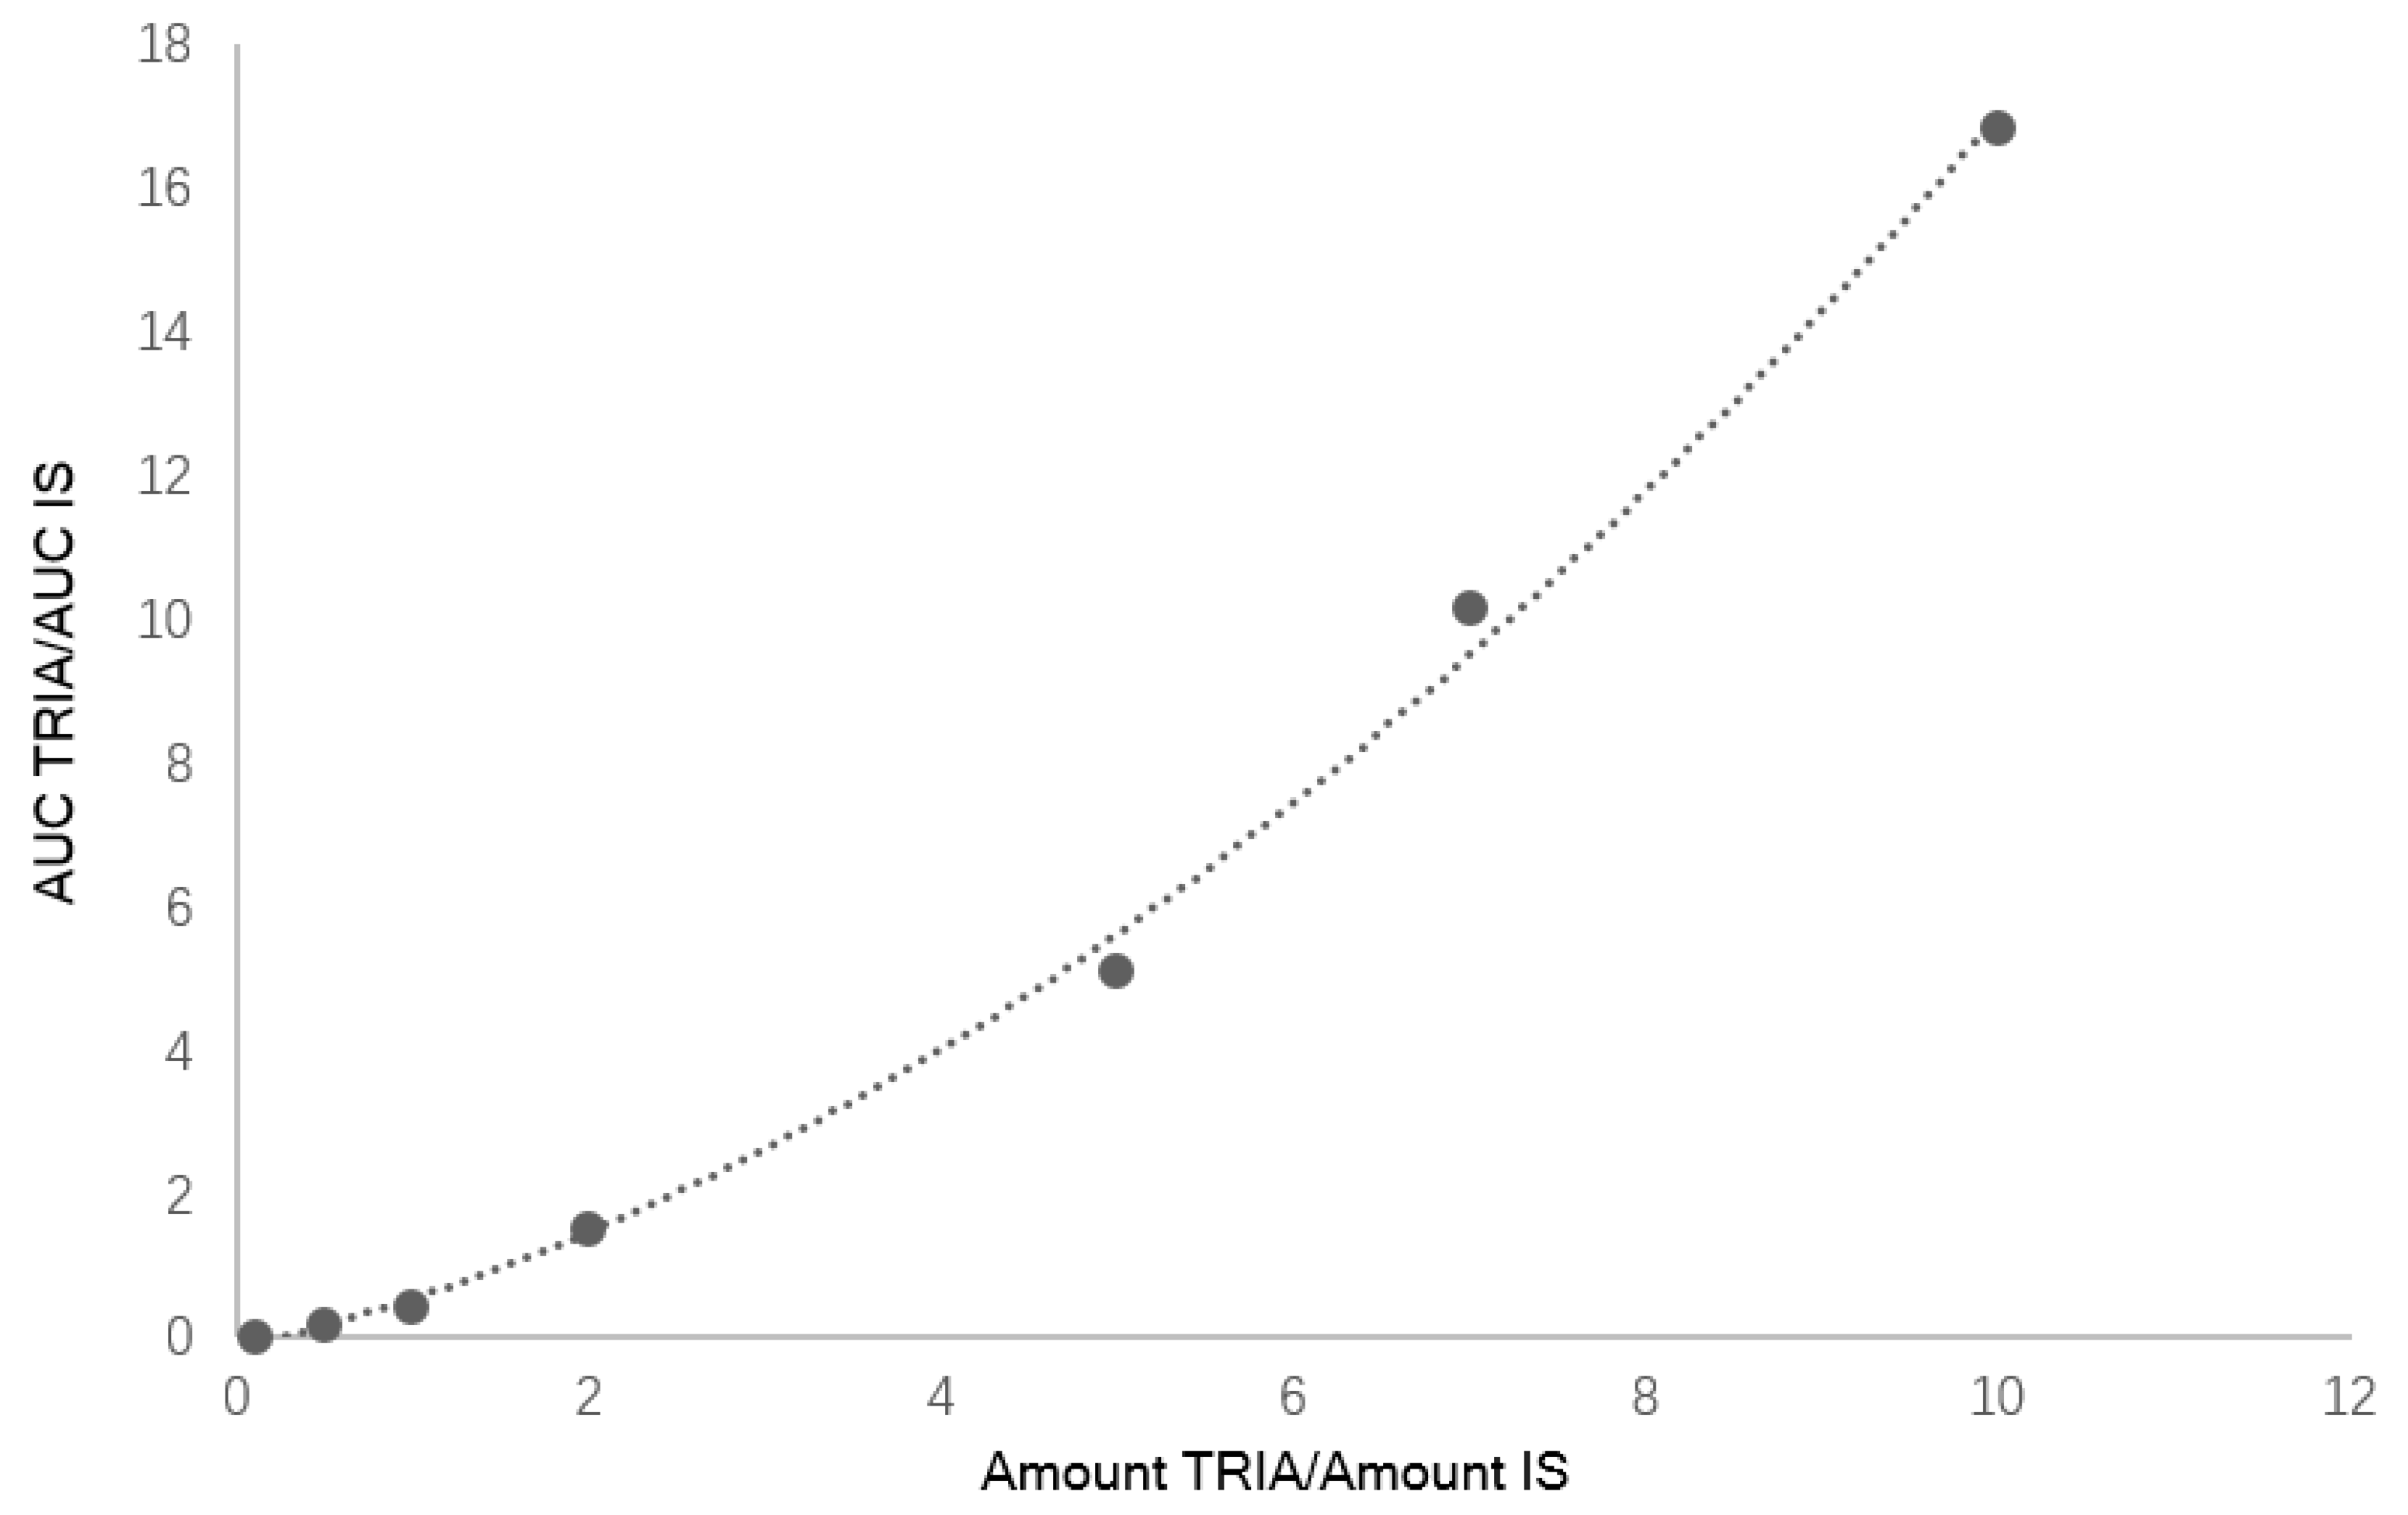
Seven calibration mixtures prepared mixing different ratios of TRIA/IS (see
Table 1) were used to create a calibration curve with a quadratic behavior in the considered calibration range (
Figure 1). The obtained curve was
y = 0.441
x2 + 0.8212
x + 0.004. The retention times of standards of TRIA (8.9 min) and 5AC used as IS (11.5 min) allowed the identification of compounds. LOD and LOQ for TRIA were 0.2 mg/L and 0.6 mg/L, respectively.
2.3. Recovery, Accuracy and Precision
To estimate the recovery of TRIA two different sets of samples were prepared.
Echinacea root was used as dried vegetal material for recovery test due to the non-detectable content of TRIA.
Table 2 reports the results related to recovery. The mean recovery of TRIA in Echinacea was 98.7%. The TRIA amounts used for spiking were ranging from 120 to 540 µg/g. Different Medicago sativa samples were extracted and assayed with and without spiking. The results, reported in
Table 3, showed recovery ranging from 98.3% (spiked samples) to 100% (non-spiked samples). Furthermore, solutions containing different TRIA concentrations ranging from 5 to 100 mg/L of TRIA were prepared and analyzed (
Table 3).
Precision was evaluated by analyzing TRIA samples spiked at four concentration levels, five times within the same day (intra-day precision) as well as on two consecutive days (inter-day precision). Results are reported in
Table 2. Relative standard deviations (RSDs) varied in the range 1.7–11.2% and 1.1–10.2% for the intra-day and inter-day precision, respectively, being within the acceptance criteria of FDA [
15].
2.4. Method Application
The robustness of the extraction protocol and of the analytical method were tested analyzing the different TRIA contents of dried samples of
M. sativa leaves and leaves and stems. Furthermore, extracts obtained by supercritical CO
2 containing 5000 and 28,000 mg/kg of TRIA were analyzed. Enzymatic extracts containing 10 mg/kg of TRIA were quantified, as well as enzymatic extracts with added TRIA at final concentrations of 15 and 40 mg/kg. A comparison of the amounts revealed by GC-MS [
12] and the developed HPLC-ELSD method is reported in
Table 4. The measured values were comparable between the different methods, showing that HPLC-ELSD is a suitable technique for the analysis of TRIA in different matrices.
4. Experimental
4.1. Solvents and Materials
1-Triacontanol (TRIA), 5α-cholestane (5AC) and the silanization reagent (Sil-A) were purchased from Sigma Chemicals Co. (Milan, Italy). Sodium hydroxide (NaOH), hydrochloric acid (HCl), ethanol and dichloromethane were obtained from Merck KGaA (Darmstadt, Germany). HPLC-grade methyl tert-butyl ether, acetonitrile and methanol were obtained from Scharlab (Barcelona, Spain). Plant materials, supercritical CO2 extracts and enzymatic extracts from Medicago sativa L. were kindly gifted by the ILSA group S.P.A. (Vicenza, Italy).
4.2. Preparation of Standard Solutions
The development and validation of the procedure were carried out in model samples subjected to the procedure described below. 5AC was used as internal standard (IS), whereas 1-triacontanol was the target analyte. Stock solutions were prepared by dissolving 3 mg of the analytes in 10 mL of dichloromethane. Samples for calibration curves were finally prepared by diluting aliquots of stock solution to yield concentrations in the range of 10–100 µg/mL.
4.3. Preparation of Samples
The samples were weighted on the basis of the expected triacontanol content. Detailed procedures depending on the different types of starting materials are reported below.
4.3.1. Dried or Fresh Plant Material, Solid Products
For plant material or formulated solid products containing less than 0.1% of TRIA, 1000 mg of material were weighted, added of the IS solution (1000 µL of a 500 µg/mL solution or absolute amounts of 300 to 500 μg of IS) and extracted in a flask with 50 mL of dichloromethane. Extraction was performed in ultrasound bath for 15 min. For solid samples containing 0.1% < TRIA < 1%, 100 mg of material were weighted and extracted with 500 μL of dimethyl sulfoxide and 25 mL of dichloromethane. After the adding of the IS, the solution was sonicated for 10 min. Extraction was performed twice, with further 20 mL of dichloromethane. If an aqueous layer was present, this was discharged using a separation funnel, and the organic layers were collected together. Finally, the organic phase was dried under vacuum at 45 °C and the solution was then dissolved in 5 mL of dichloromethane. For dried or fresh samples containing more than 1% of TRIA, 50 mg of material were weighed and, after the adding of IS, they were extracted with 500 μL of dimethyl sulfoxide and 25 mL of dichloromethane, as previously described. Finally, the organic layers were collected, dried under vacuum at 45 °C and the residue dissolved in 5 mL of dichloromethane.
4.3.2. Aqueous Liquid Products
For aqueous samples containing less than 0.1% of TRIA, 50 mL of liquid were put in a separation funnel, added of the IS solution (100 μL of 500 µg/mL solution or absolute amounts of 300 to 500 μg of IS) and then extracted in a flask with dichloromethane (20 mL) for three times. The organic layer was collected, dried with sodium sulfate and finally evaporated under vacuum to 2 mL. For liquid samples with content of triacontanol > 0.1%, 10 mL of liquid were used, following the same protocol.
4.4. Chromatographic Conditions
An Agilent 1100 HPLC system (Agilent Technologies, Santa Clara, CA, USA) coupled to a Sedere Sedex 60 ELSD detector (Olivet, France) was used. In order to elute highly lipophilic compounds from the reverse phase column used as stationary phase (Agilent Extend C-18 4.6 × 150 mm, 5 µm), a gradient of acetonitrile (A) and methanol/methyl tertbutyl ether 10/90 (B) was used as mobile phase. Gradient conditions were optimized in order to perform the analysis in 30 min and to reach the best separation of TRIA and the IS. The gradient is reported in
Table 5. Flow was 1 mL/min, injection volume was 10 µL.
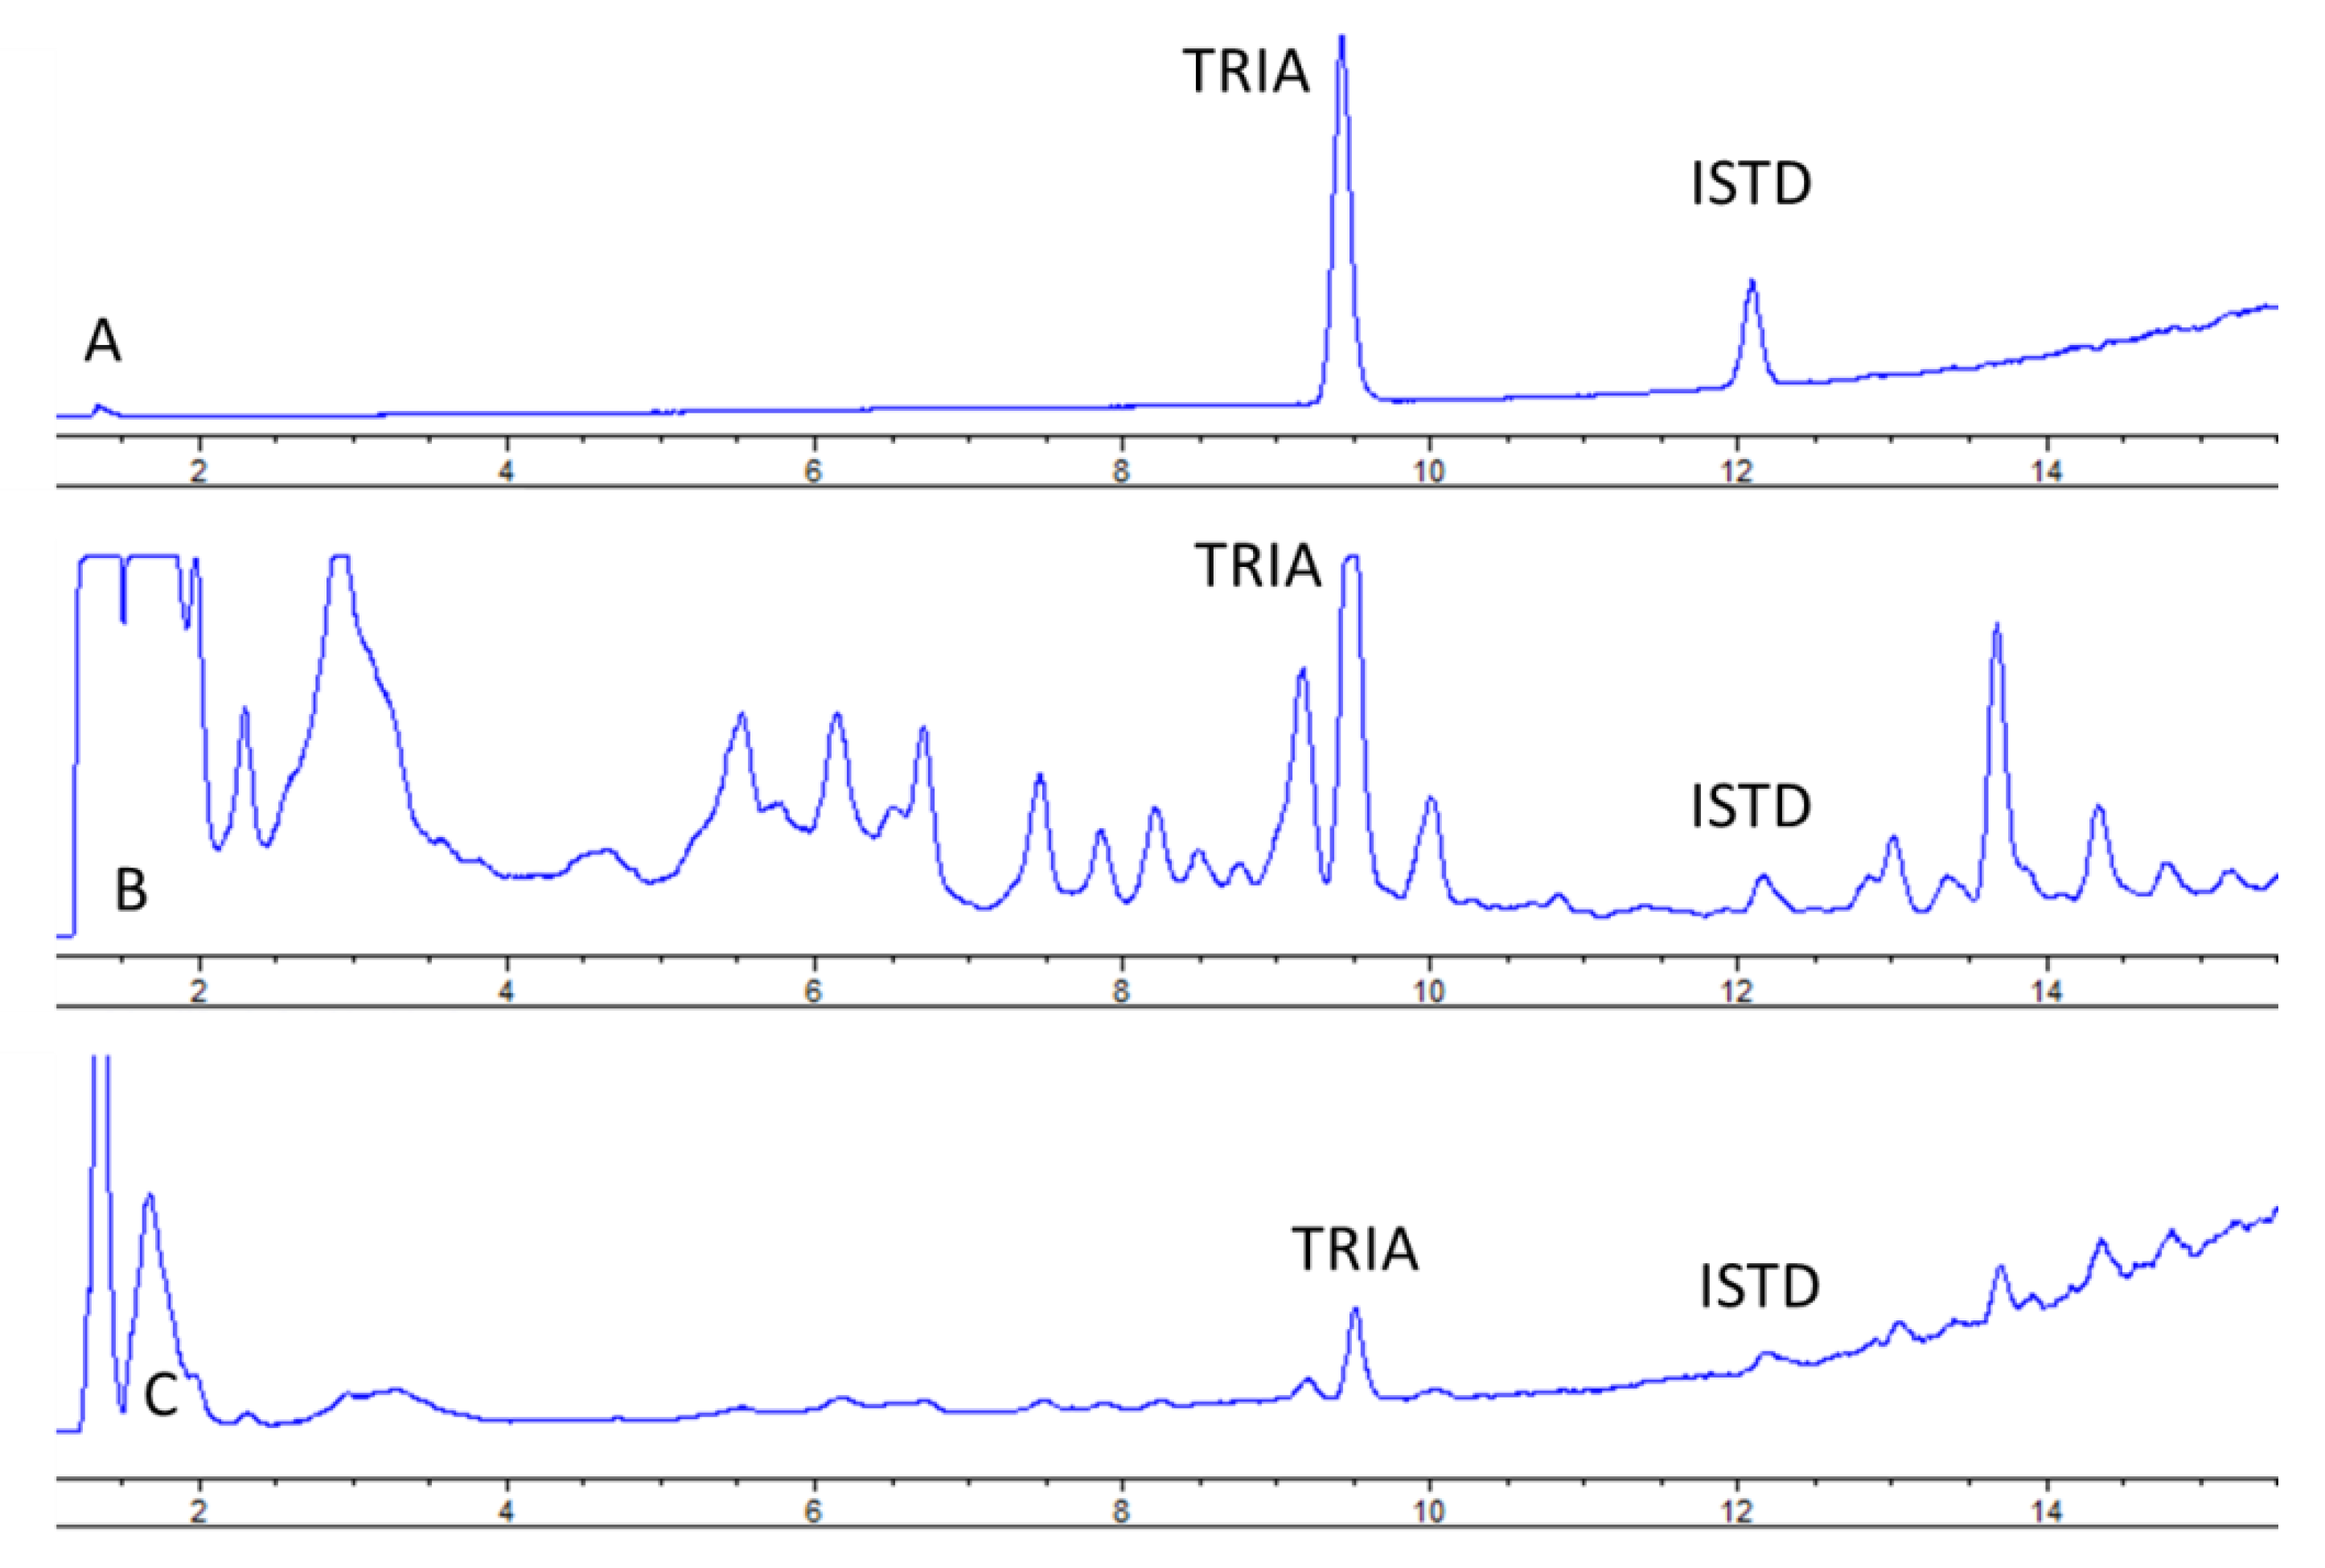
Under the proposed conditions, TRIA was eluted at 8.9 min (
Figure 2) and peaks of both TRIA and IS were well resolved.
4.5. ELSD Conditions
Signal intensity in ELSD is influenced by pressure and temperature of nebulizer gas. Decreasing the temperature of the nebulizer from 70 °C to 40 °C yielded the improvement of signal-to-noise (S/N) ratio. Due to the low boiling point of the elution solvents used, a temperature of 40 °C appeared to be the best condition. Furthermore, the decrement of the nitrogen pressure from 2.2 to 1.1 bar also reduced the baseline noise, allowing the increase of the Limit of Detection (LOD) of all the analytes. At these conditions, TRIA and ISTD could be revealed up to 2 µg/mL.
4.6. Method Validation
The optimized method was validated according to the guidelines defined by the US Food and Drug Administration (FDA) [
15]. Assay specificity was evaluated comparing the chromatograms of standard-spiked samples with standard solutions. Calibration curves were fitted by least square regression analysis to plot peak area ratio of TRIA/ISTD relatively to the ratio of the amount of TRIA/ISTD. Limit of Quantification (LOQ) was calculated as the lowest amount with a relative standard deviation < 20%. Intra and inter day stability, extraction recovery and matrix effects were measured. Precision and accuracy were evaluated using samples (n = 5) containing 10 to 5000 mg/kg of TRIA.
Calibration curves were prepared analyzing samples containing 0.10 < amount TRIA/IS < 10 in dichloromethane and plotting TRIA/IS AUC ratio versus TRIA/IS amount ratio. The ELSD response is not linear but follows a quadratic relationship, hence a quadratic calibration curve was obtained. The limit of detection (LOD) was established analyzing samples with known concentration of TRIA/IS and estimating the minimum concentration at which TRIA could be reliably detected (S/N ratio > 3, with RSD < 20%). On the other hand, LOQ for TRIA was estimated as the lowest concentration that gave an average S/N ratio > 10 (RSD < 20%). Intra-day and inter-day precisions were evaluated by analyzing TRIA/IS samples at TRIA concentration levels of 0.14–0.5% and 10 µg/kg five times within the same day as well as on two consecutive days, respectively.


 ,
, 
