Abstract
Herein, the polyphenolic content in extracts of Ruppia cirrhosa (Petagna) Grande and Ruppia maritima L.was fully characterized for the first time. High amounts of the main compound chicoric acid (CA) (≤30.2 ± 4.3 mg/g) were found in both Ruppia species. In addition, eight flavonoids, namely the 3-O-glucopyranosides and 3-O-galactopyranosides, as well as malonylated 3-O-glycosides of quercetin and isorhamnetin, were isolated and identified. The antioxidant activity of Ruppia cirrhosa extracts and isolated compounds was investigated spectrophotometrically by a 1,1-diphenyl-2-picrylhydrazyl (DPPH·) radical scavenging assay. IC50 values were 31.8–175.7 μg/mL for Ruppia cirrhosa extracts and 12.1–88.4 μg/mL for isolated flavonoids. Both individual and total phenolic and flavonoid content were quantified in crude extracts using analytical HPLC. The relative high amount of total flavonoids ranged from 5.9 to 14.7 mg/g in both species, with concentrations of individual flavonoids ranging from 0.4 to 2.9 mg/g dry weight. The content of chicoric acid was twofold more in Ruppia maritima than in Ruppia cirrhosa. Seasonal variation of the quantitative content in Ruppia cirrhosa was examined. Total flavonoid content ranged from 8.4 mg/g in October to 14.7 mg/g in August, whereas the highest concentration of chicoric acid was observed in March (29.2 mg/g).
1. Introduction
The marine environment is a potential source for a wide variety of nutritional natural products. Seaweeds are used as human food or as raw materials for the production of compounds of nutritional interest [1]. On the other hand, marine angiosperms, such as seagrasses, are known for their content of secondary metabolites [2,3]; however, these are very little exploited to find commercially valuable natural products. A few seagrass species, especially of the genus Zostera, Halophila, Posidonia, Thalassia and Syringodium, have been investigated for their content of phenolics and flavonoids [3,4,5,6,7,8,9,10,11,12,13].
The widgeon grass family (Ruppiaceae) is a submersed aquatic angiosperm widely distributed in temperate and tropical regions all over the world. Ruppia species usually occur in brackish or saline waters, but can also be found in diluted fresh water or fresh water with high salinity, and only rarely under marine conditions [14,15,16]. In Norwegian coastal waters, two Ruppia species have been found, namely Ruppia maritima L. and Ruppia cirrhosa (Petagna) Grande, the latter occasionally synonymized under R. spiralis L. ex Dumort. Both species can be found in single populations with no other vascular plants present, and they are hardly ever found together. R. maritima can sometimes be found in proximity of Zostera noltii populations, while R. cirrhosa can be found with or close to Zostera marina L. populations.
The number of studies investigating secondary metabolites in Ruppia species are limited, and a full analysis of polyphenolic content is lacking [7,10,17]. In 1973 Boutard et al. [7] analyzed and identified two flavonoids in R. maritima based on chrysoeriol and possibly luteolin. Harborne and Williams reported in 1976 an unidentified glycosylflavone, as well as three caffeoyl conjugates in R. maritima, whereas no phenolic derivatives were found in R. cirrhosa [10]. Haynes and Roberts indicated later the presence of flavonols in one Ruppia species [17], yet these results remain unpublished, and no accurate identification of the flavonols has been concluded. The previous identification work is based on TLC retention times and electrophoretic surveys [7,10].
The aim of this work was to characterize the phenolic content of R. cirrhosa and R. maritima collected from Norwegian coastal waters with the aims of finding a new source of nutritional natural products. To our knowledge, this is the first report on complete structural characterization of both flavonoids and one phenolic acid in these two species and our quantitative studies revealed high amounts of the potent chicoric acid (CA) [18].
2. Results and Discussion
2.1. Characterization of Polyphenolic Compounds in Ruppia cirrhosa
The HPLC profile (Figure 1) of the crude extract of R. cirrhosa detected at 360 ± 10 nm revealed one phenolic acid and eight flavonoids (Figure 2). After purification of the concentrated extract by Amberlite XAD-7 (Sigma-Aldrich, St. Louis, MO, USA) chromatography, the compounds were isolated by preparative HPLC and analyzed using high resolution LC‒MS and 1D and 2D NMR spectroscopy. Their physiochemical and spectral data were compared to previously reported values in literature, and the compounds were identified as quercetin 3-O-β-d-galactopyranoside (1) [19,20,21], quercetin 3-O-β-d-glucopyranoside (2) [19,21,22], quercetin 3-O-β-d-(6″-O-malonyl)galactopyranoside (4) [23], isorhamnetin 3-O-β-d-galactopyranoside (5) [24,25], isorhamnetin 3-O-β-d-glucopyranoside (6) [22,25,26], isorhamnetin 3-O-β-d-(6″-O-malonyl)galactopyranoside (7) [23,27], isorhamnetin 3-O-β-d-(6″-O-malonyl)-glucopyranoside (8) [27] and chicoric acid (CA) [28]. Quercetin 3-O-β-d-(6″-O-malonyl)-glucopyranoside (3) was identified by comparison with an analytical standard (≥85% (HPLC), Sigma-Aldrich).
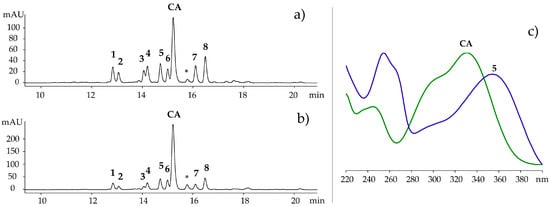
Figure 1.
(a–c) HPLC chromatogram of Ruppia cirrhosa (a) and Ruppia maritima (b) recorded at 360 ± 10 nm; (c) UV-Vis spectrum of isorhamnetin 3-O-β-d-galactopyranoside (5) and chicoric acid (CA). See Figure 2 for structures, 1–8 and CA. * unidentified caffeoyl unit.
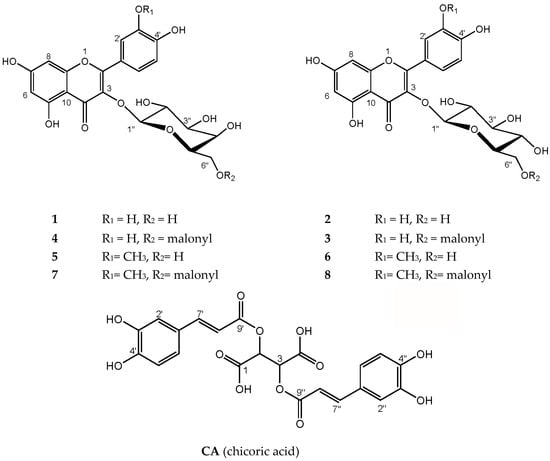
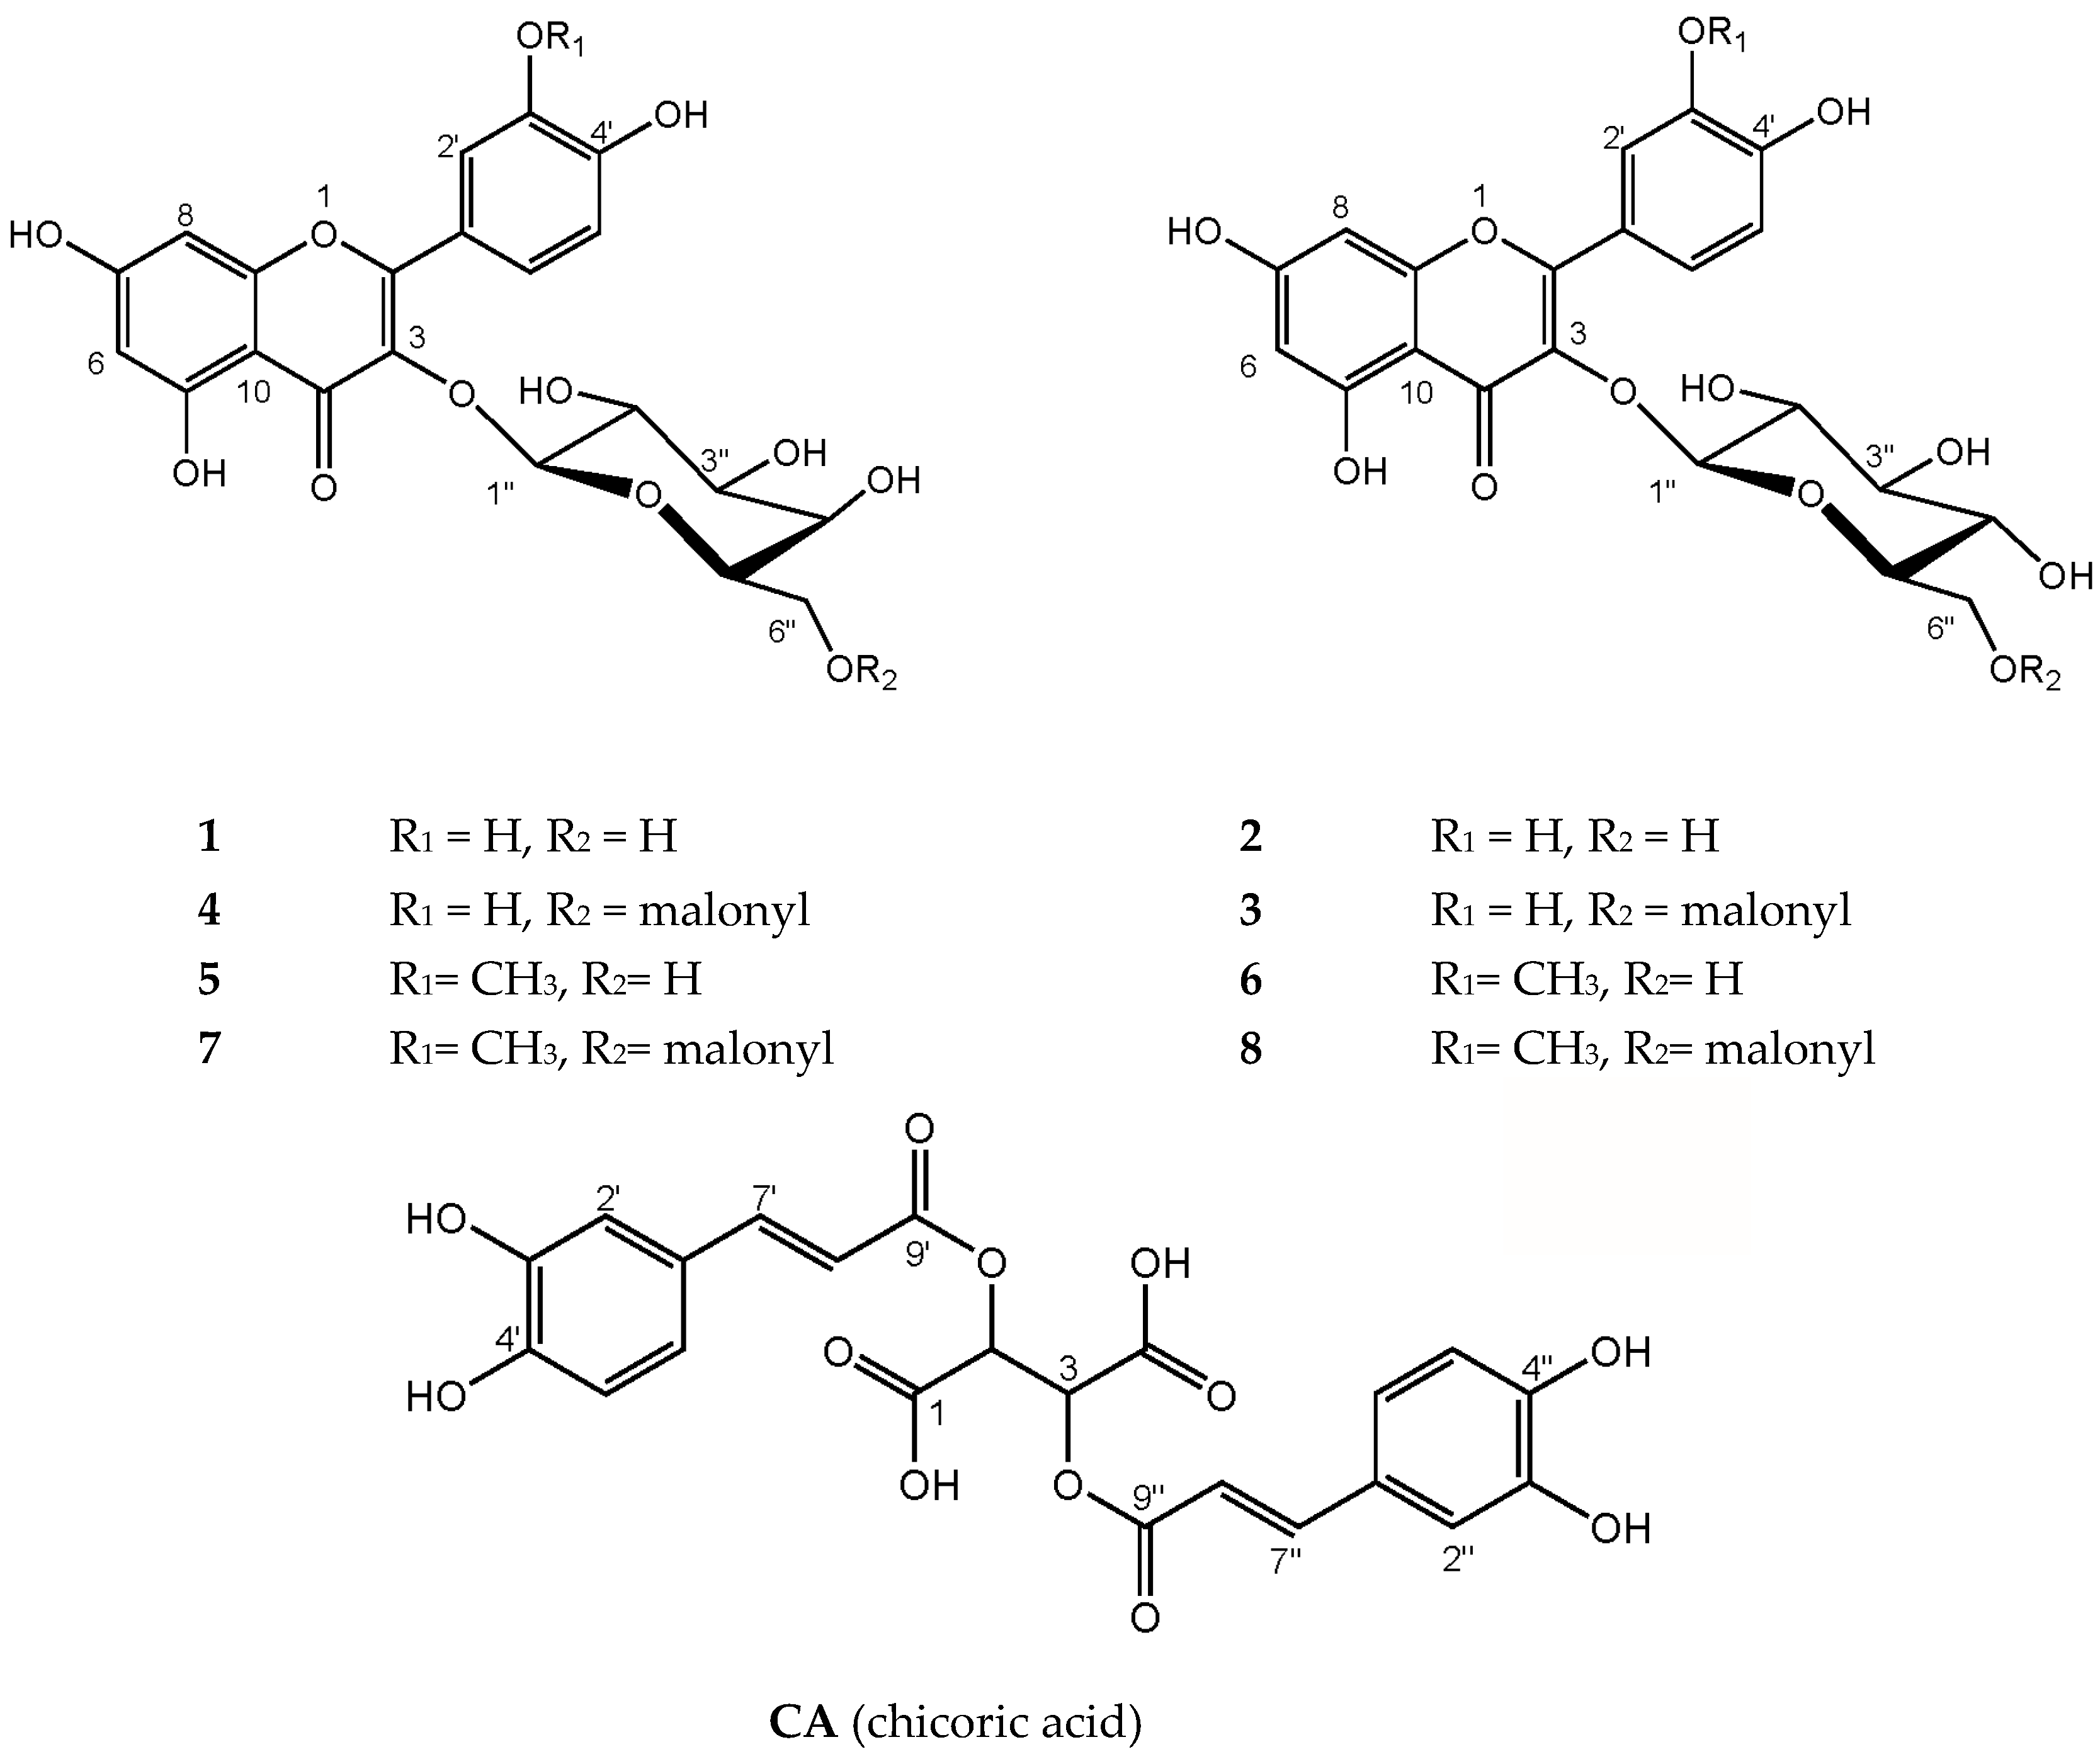
Figure 2.
Structures of the main phenolic compounds found in Ruppia cirrhosa and Ruppia maritima. 1 = quercetin 3-O-β-d-galactopyranoside, 2 = quercetin 3-O-β-d-glucopyranoisde, 3 = quercetin 3-O-β-d-(6″-O-malonyl)glucopyranoside, 4 = quercetin 3-O-β-d-(6″-O-malonyl)galactopyranoside, 5 = isorhamnetin 3-O-β-d-galactopyranoside, 6 = isorhamnetin 3-O-β-d-glucopyranoside, 7 = isorhamnetin 3-O-β-d-(6″-O-malonyl)galactopyranoside, 8 = isorhamnetin 3-O-β-d-(6″-O-malonyl)-glucopyranoside, CA = chicoric acid.
The main phenolic acid in both Ruppia species was chicoric acid (CA), which has been found previously in the seagrasses Cymodocea nodosa U. [29], Syringodium filiforme K [12], Posidionia oceanica L. [30,31,32] and Thalassia hemprichii (Ehrenb.) Ash. [33]. This is the first time flavonoids 1–8 and chicoric acid have been identified in R. cirrhosa and R. maritima. The flavonoids quercetin 3-O-β-d-glucopyranoside and isorhamnetin 3-O-β-d-glucopyranoside have previously been identified in the seagrass C. nodosa [29]. As far as we know, this is the first report of 3-O-galactopyranosides and malonylated glycosides of quercetin and isorhamnetin in aquatic plants.
2.2. DPPH Radical Scavenging of Ruppia Polyphenols
DPPH is a stable free radical with a maximum absorbance at 517 nm (deep purple colour). When reacting with a radical scavenger it donates a hydrogen and acquires a colorless reduced form. The loss of purple colour correlates with scavenging activity of the compound, and IC50 values are commonly used to determine the compounds ability to scavenge radicals. The IC50 values of R. cirrhosa extracts and isolated compounds are shown in Table 1. Due to insufficient amounts of sample material, DPPH· scavenging activity of R. maritima was not tested. The R. cirrhosa extract exhibited an IC50 value of 152.9–175.7 μg/mL, which is considered low to moderate radical scavenging activity [34]. These results are comparable to antioxidant activities of crude extracts of the seagrasses Halodule ovalis (IC50 130 μg/mL) [35], Syringodium isoetifolium (IC50 96.34 μg/mL), Enhalus acoroides (IC50 115.79 μg/mL), Cymodocea rotundata (IC50 123.72 μg/mL) and Thalassia hemprichii (IC50 214.68 μg/mL) [36]. However, after partition with ethyl acetate, the aqueous phase of R. cirrhosa exhibited very strong radical scavenging activity, with an IC50 value of 31.8 ± 3.2 μg/mL. To our knowledge, this is the first reported results on DPPH· scavenging activity of R. cirrhosa extracts.

Table 1.
IC50 values of extract of Ruppia cirrhosa and isolated compounds from R. cirrhosa.
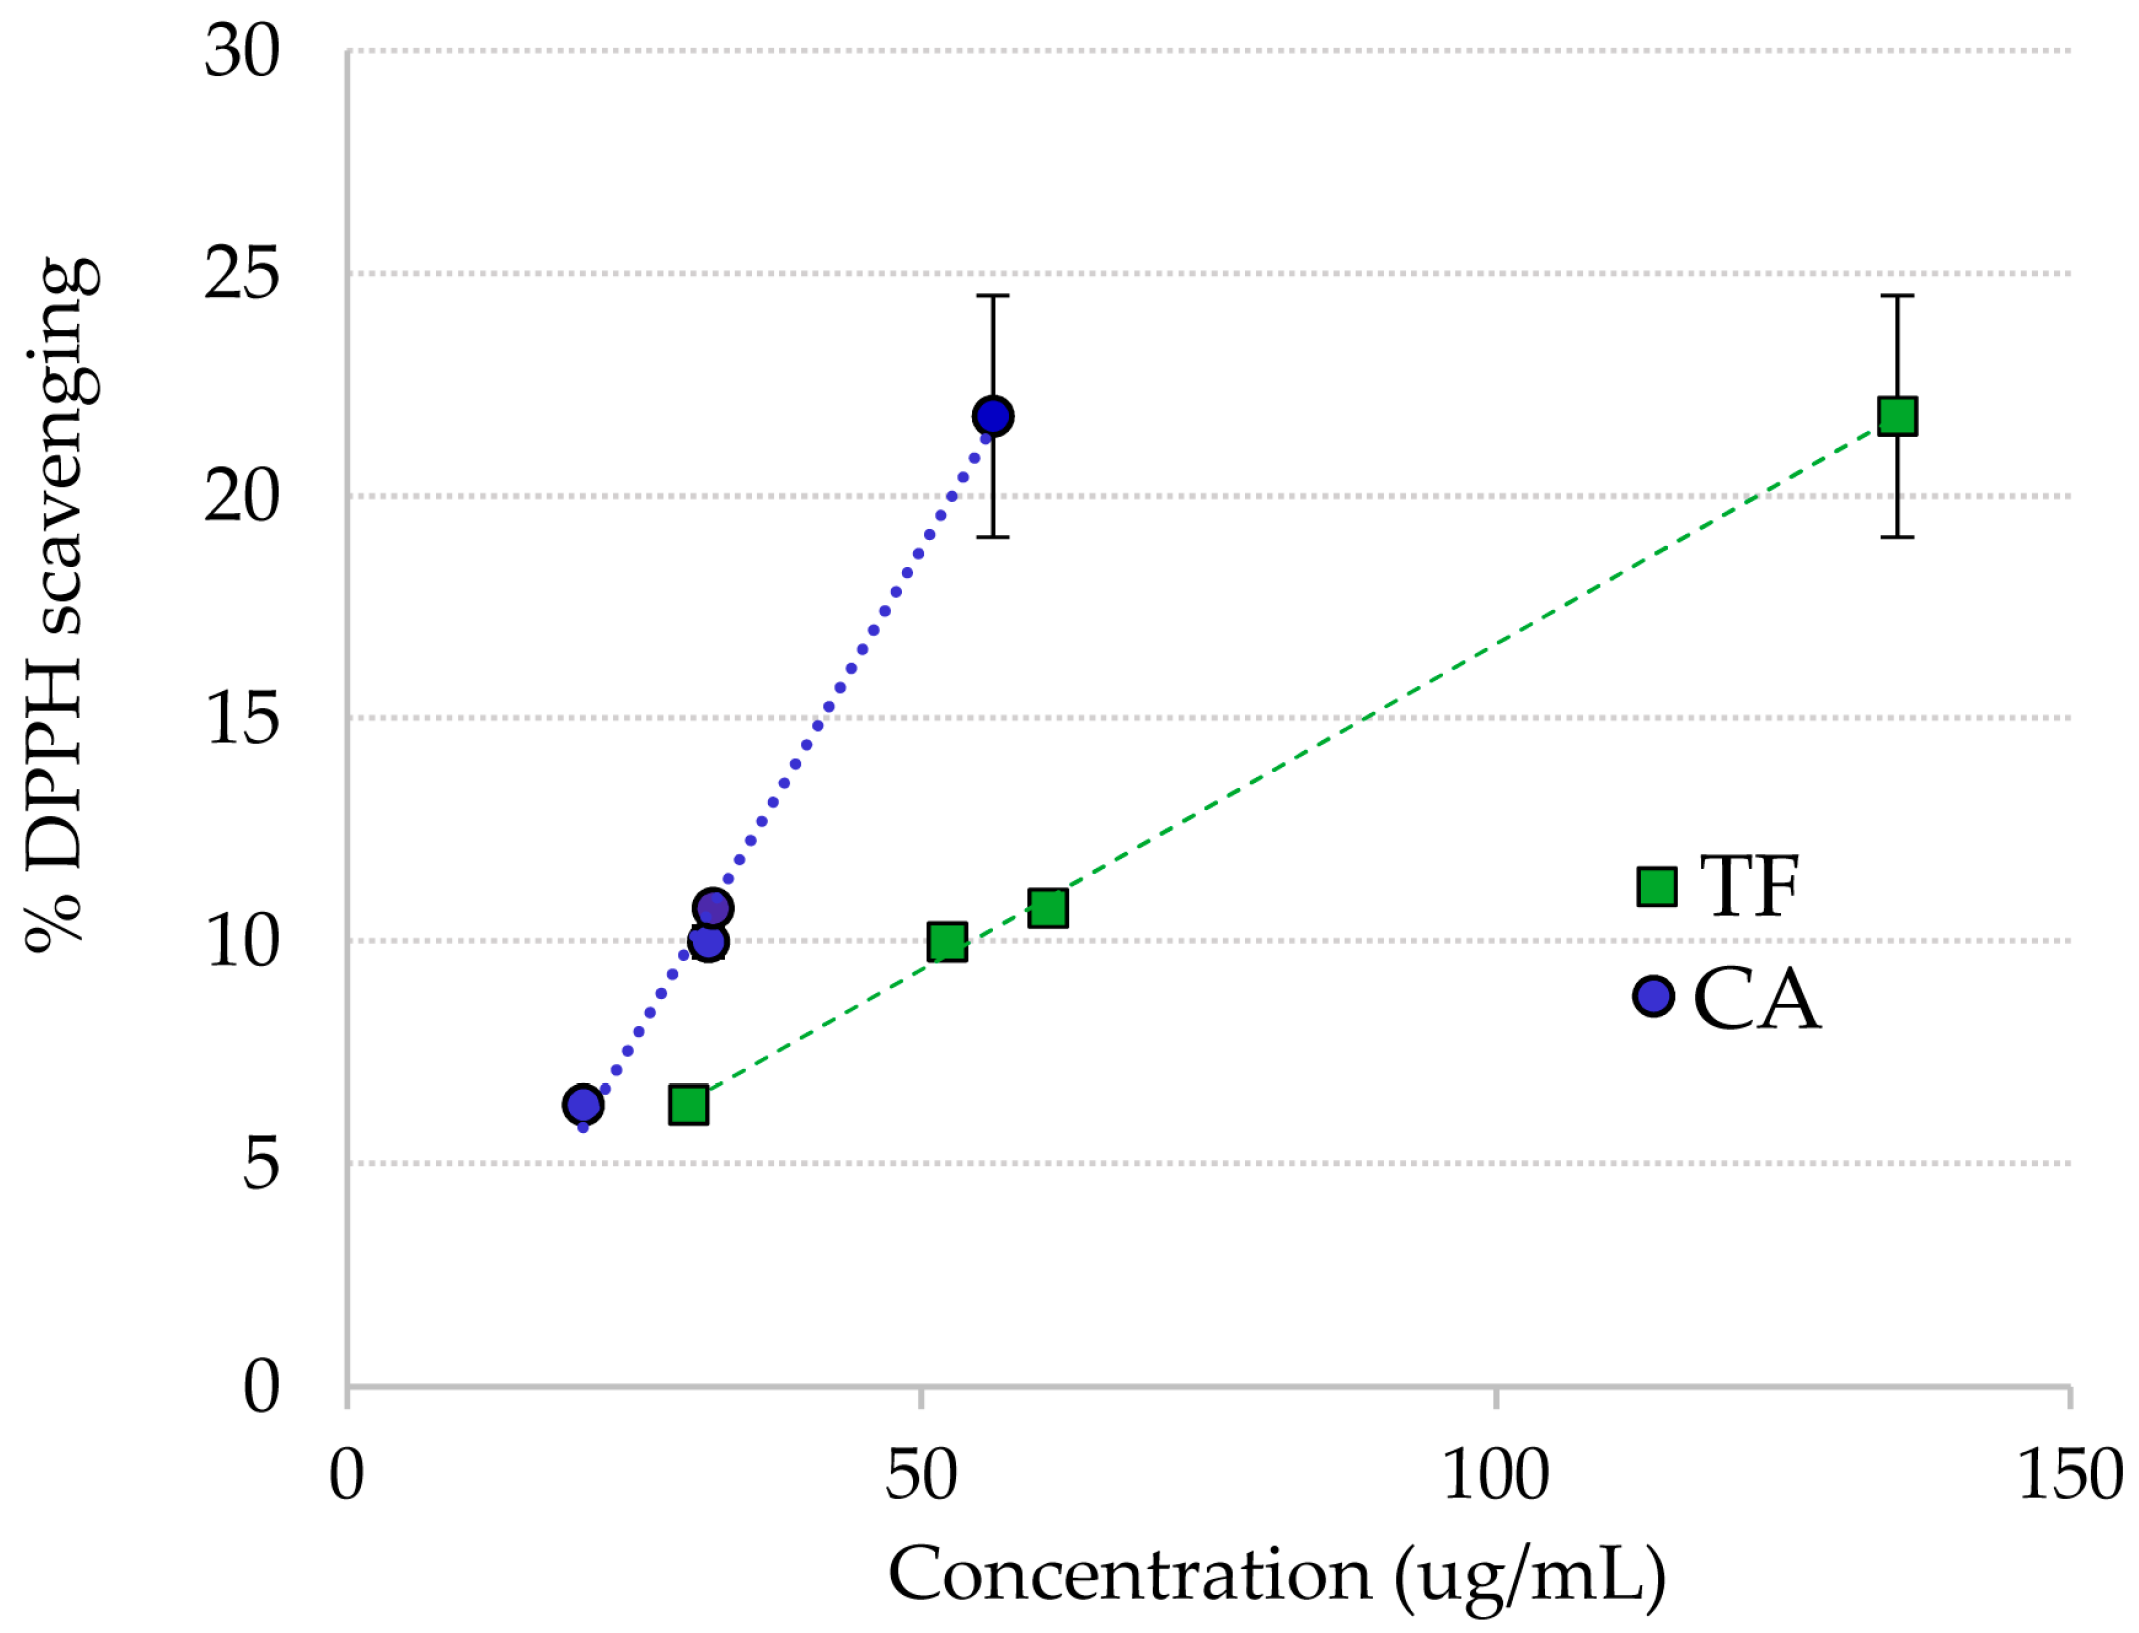
The extract from the plant material collected in October had a slightly lower scavenging activity than the R. cirrhosa extract from August. This may be related to the lower phenolic content found (Table 4). In addition, the percent scavenging of four crude extracts of R. cirrhosa with known concentrations of both flavonoids and chicoric acid was examined (Figure 3), revealing a correlation between antioxidant scavenging and concentration of total flavonoids and chicoric acid.

Figure 3.
DPPH· radical scavenging vs. concentration of chicoric acid (CA) and total flavonoids (TF) in Ruppia cirrhosa crude extracts.
The individual flavonoids were isolated in pairs on preparative HPLC. DPPH· radical scavenging assays were performed to test the antioxidant activities of the flavonoids. The IC50 values of the isolated flavonoids and reference compounds are shown in Table 1 and Table 2, respectively.
Table 2.
IC50 values of reference standards.
Purified mixture of quercetin 3-O-β-d-(6″-O-malonyl)glucopyranoside (3) and quercetin 3-O-β-d-(6″-O-malonyl)galactopyranoside (4) showed very strong antioxidant activity, with an IC50 value of 12.1 ± 3.3 μg/mL. The measured value is similar to the IC50 values obtained for the reference standards quercetin (5.5 ± 0.3 μg/mL), quercetin 3-O-β-d-glucopyranoside (11.0 ± 1.0 μg/mL) and rutin (13.9 ± 0.7 μg/mL), once molar mass is accounted for. Flavonoids with an isorhamnetin aglycone (compounds 5–8) showed lower antioxidant activity than the quercetin-based flavonoids (3 and 4), explained by the number of free hydroxyl groups on the aglycone B-ring [37]. Interestingly, the malonylated isorhamnetin O-glycosides 7 and 8 showed much higher antioxidant activity than the corresponding isorhamnetin O-glycosides 5 and 6, with IC50 values of 51.7 ± 6.8 μg/mL and 88.4 ± 7.0 μg/mL, respectively.
DPPH· scavenging with chicoric acid (CA), isolated from R. cirrhosa, resulted in a higher IC50 value (23.0 ± 3.2 μg/mL) than the one seen for the mixture of quercetin 3-O-β-d-(6″-O-malonyl)glucopyranoside (3) and quercetin 3-O-β-d-(6″-O-malonyl)galactopyranoside (4). Compared to the isolated isorhamnetin-based flavonoids (5 & 6 and 7 & 8) however, CA showed stronger scavenging and lower IC50 value. The chicoric acid (CA) isolated in this study had a higher IC50 value (23.0 ± 3.2 μg/mL) (Table 1) than the one measured for the reference compound (9.7 ± 1.7 μg/mL) (Table 2). Since DPPH is a highly concentration sensitive method, variations in IC50 values for the same compound is often seen [38,39,40,41,42,43,44,45]. No significant impurities were observed for the isolated sample of CA in the present study using HPLC and NMR for purity determination. However, water content, especially if the compound is hygroscopic, and inorganic salt content will normally not be determined by these methods [46]. Nonetheless, both the isolated CA and reference compound showed very strong antioxidant activity.
2.3. Quantitative Analysis of Polyphenolic Content in Ruppia
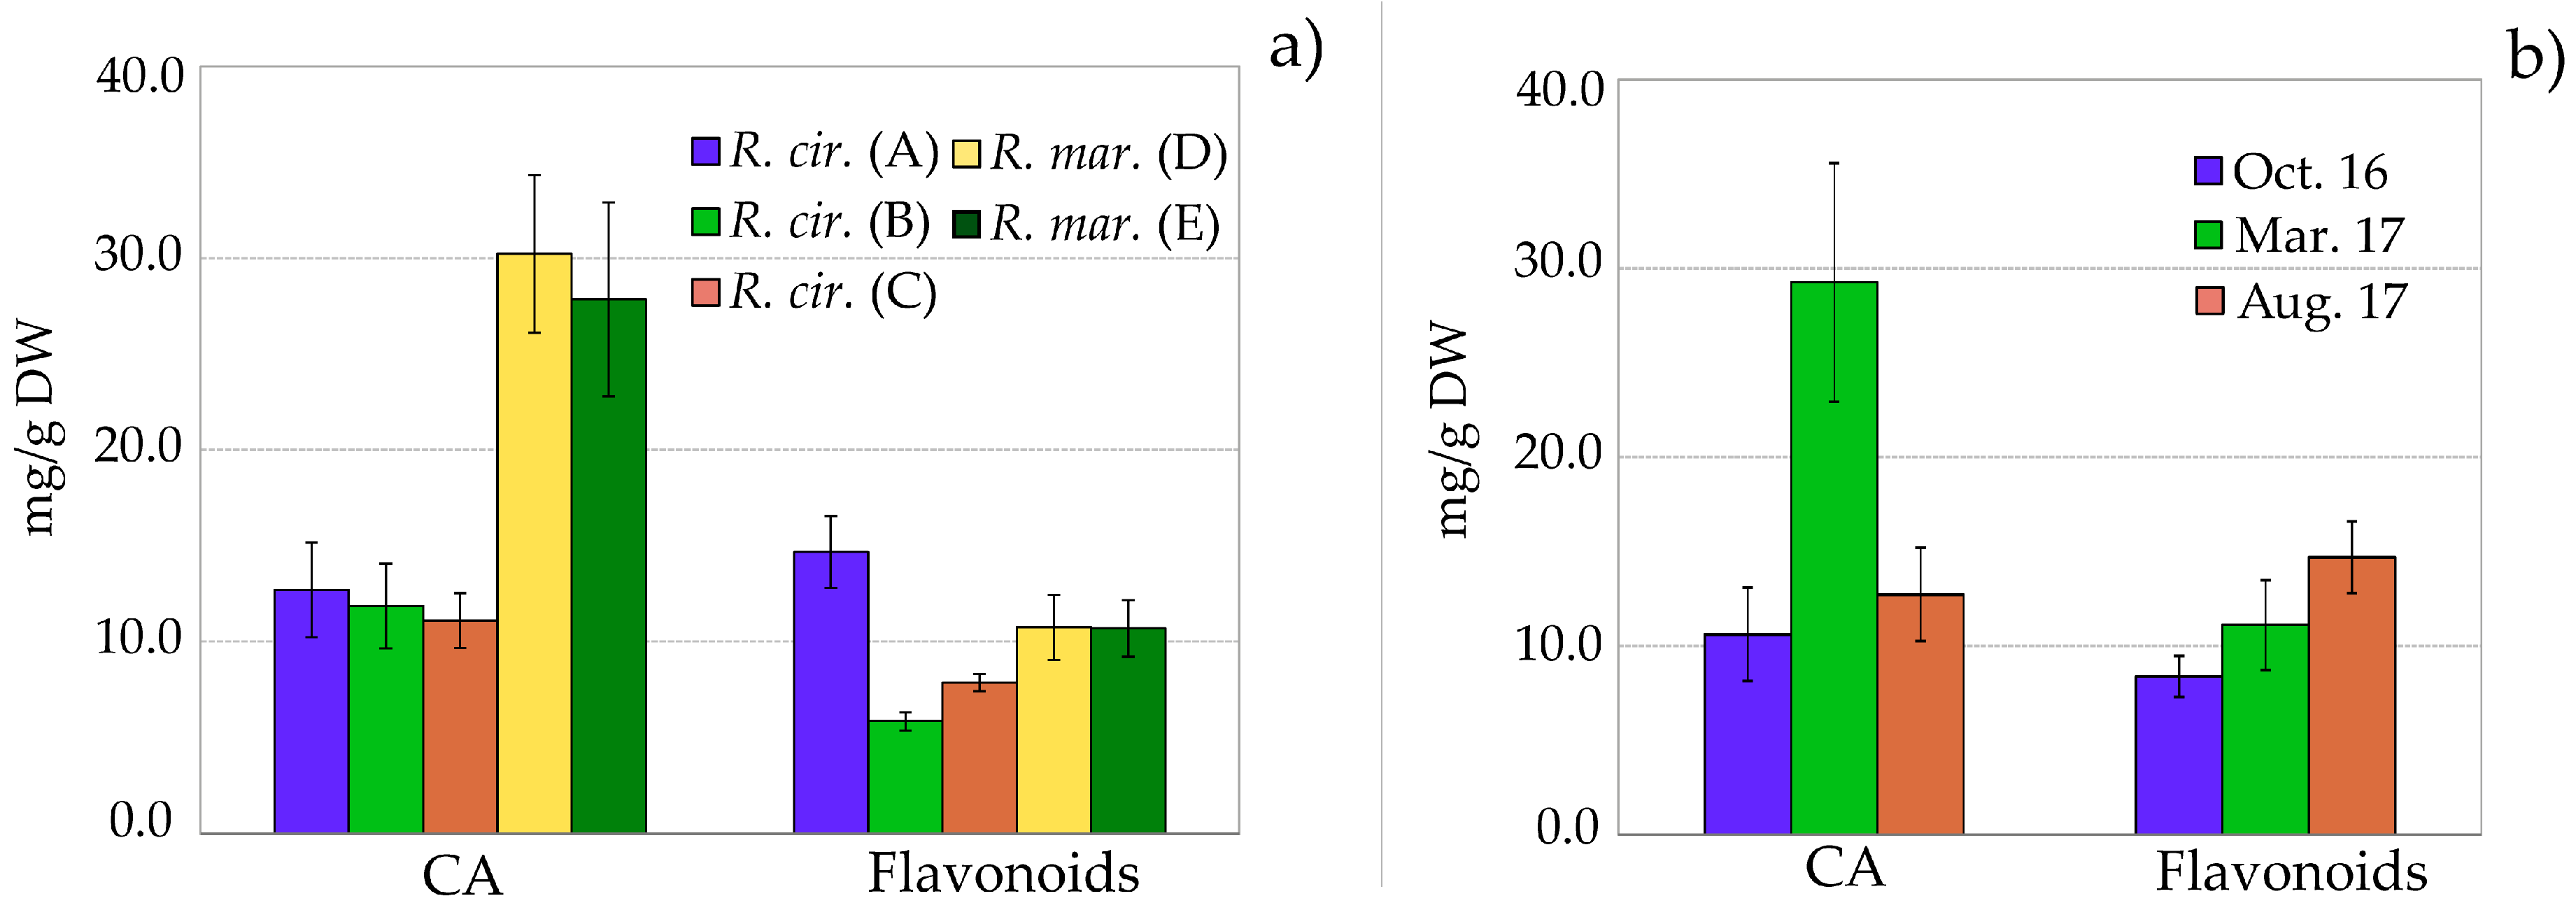
The quantitative content of individual flavonoids 1–8 and chicoric acid was characterized in three R. cirrhosa and two R. maritima populations, collected from different localities at the east and west coast of Norway (A–E) (Table 3). As seen in Figure 4a, the flavonoid content was significantly higher in R. cirrhosa from the Bergen location (A) compared to the other R. cirrhosa populations from the west coast of Norway (B and C).
Table 3.
Quantitative amounts of individual flavonoids and phenolic acids in leaves of Ruppia cirrhosa (R. cirr.) and Ruppia maritima (R. mar.) collected in summer 2017 from five localities (A–E). 1,2
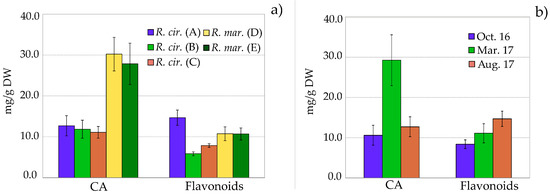
Figure 4.
(a) Flavonoid and chicoric acid (CA) content in leaves of Ruppia cirrhosa (R. cirr.) and Ruppia maritima (R. mar.) collected from different localities; (b) Flavonoid and chicoric acid (CA) content in leaves of Ruppia cirrhosa collected in October 2016, March 2017 and August 2017. Amounts are expressed in mg/g (mean value ± SD, n = 4) dry weight, based on quercetin 3-O-β-d-glucopyranoside (flavonoids) or caffeic acid (CA) equivalents.
No significant differences in the total flavonoid or phenolic content of the two R. maritima populations from the east coast were observed (D and E). However, significant differences in the distribution of the individual flavonoids were seen. The R. maritima samples from Tønsberg (D) showed a higher content of the quercetin O-glycosides 1 and 2, whereas R. maritima samples from the Råde (E) location contained higher amounts of the malonylated isorhamnetin O-glycosides (7) and (8).
The total flavonoid content was 5.9–14.7 mg/g (DW) for R. cirrhosa and 10.7 mg/g (DW) for R. maritima, respectively (Table 3). These amounts are in the same scale as the amounts reported for common edible flavonoid sources such as Allium (≤5.08 mg/g DW), cranberry (2.15 mg/g DW) and dried oregano (15.46 mg/g DW) [47,48,49,50]. In marine European seagrass species as Zostera marina and Zostera noltii flavonoid amounts in the range of 13.5–24.5 mg/g (DW) and 3.38–34.3 mg/g (DW) have been found, respectively [9,51].
The concentrations of chicoric acid (CA) were significantly higher in R. maritima (30.2 and 27.9 mg/g) than in R. cirrhosa (11.1–12.7 mg/g). It seems natural to conclude that R. maritima generally have a higher production of CA although, although it should be taken into consideration that the R. maritima samples were collected from a different part of Norway. Differences in chicoric acid accumulation may be a function of nutritional and/or environmental stress, but there is a need for more research on how chicoric acid accumulation in plants is regulated [18]. In leaves of Cymodocea nodosa and Syringodium filiforme, the amounts of chicoric acid have been reported to range from 8.13–27.4 mg/g and 0.94–5.26 mg/g, respectively [12,29]. Chicoric acid has also been found in Posidionia oceania from the Mediterranean Sea, however, the quantitative content varied greatly. The maximum content of chicoric acid was 0.1386 mg/g in young leaves of P. oceanica collected in the Aegean sea outside Turkey, whereas both detrital and fresh leaves of P. oceanica from four different localities in the western part of the Mediterranean sea were found to contain up to 12.78 mg/g chicoric acid [31,32]. The high level of CA (≤30.2 ± 4.3 mg) found in this study is comparable to the content of CA in the known source Echinacea purpura [52,53,54], proposing Ruppia to be a new and valuable source of chicoric acid (CA). Chicoric acid is high value-added on the nutraceutical market, due to its possible health benefits and its relative rare occurrence in the plant kingdom [12,18].
Fluctuations in natural product concentrations should be taken into consideration before scheduling harvest dates or planning herbal product manufacturing [18]. In order to get an impression of the seasonal fluctuations of phenolics in Ruppia, the total flavonoid and CA content in R. cirrhosa collected from the Bergen location (A) in October, March and August were analyzed (Table 4, Figure 4b). During the winter season (December-February) the biomass on the examined locality was scarce.
Table 4.
Quantitative amounts of individual flavonoids and chicoric acid in leaves of Ruppia cirrhosa collected in October 2016, March 2017 and August 2017. 1,2
The concentration of flavonoids in R. cirrhosa was significantly higher in August (14.7 ± 1.9 mg) compared to October (8.4 ± 1.1 mg) and March (11.1± 2.4 mg). The concentration of CA in R. cirrhosa measured in March (29.2 ± 6.3 mg) was over twice the amounts found in August (12.7 ± 2.5) and October (10.6 ± 2.5). The observed seasonal variation of flavonoids and phenolic acid indicates a similar pattern as we have previously seen in Zostera marina [51], with higher concentrations in spring and summer. These trends are associated with environmental stress factors, mainly UV radiation—as seen for terrestrial plants [55,56]. It is also likely that because the young leaves are still growing, they are consequently more vulnerable for microbial/fungal and herbivory attacks, which will result in an increased production of phenolics [57]. Yet, to achieve more accurate and reliable data on the seasonal variation in relation to environmental factors, a more comprehensive study of the content of both flavonoids and chicoric acid in R. maritima and R. cirrhosa is needed.
3. Experimental
3.1. General Instrumentation
3.1.1. Analytical HPLC
Agilent 1100 HPLC system (Agilent Technologies, Santa Clara, CA, USA) equipped with a HP 1050 diode array detector and a 200 × 4.6 mm inside diameter, 5 μm ODS Hypersil column (Supelco, Bellefonte, PA, USA). Two solvents, (A) water (0.5% TFA) and (B) acetonitrile (0.5% TFA), were used for elution. The elution profile for HPLC consisted of initial conditions with 90% A and 10% B followed by a linear gradient elution to 50% B. The flow rate was 1.0 mL/min, and aliquots of 15 μL were injected with an Agilent 1100 series microautosampler. The UV-Vis absorption spectra were recorded online during HPLC analysis over the wavelength range of 240–600 nm in steps of 2 nm.
3.1.2. Preparative HPLC
The preparative HPLC system used a Gilson 321 pump (Gilson S. A., Villiers-le-Bel, France), equipped with an Ultimate 3000 variable wavelength detector (Dionex, Thermo Fisher Scientific, Sunnyvale, CA, USA), a 25 × 2.12 cm (10 μm) UniverSil C18 column (Fortis Technologies Ltd., Neston, UK), and the solvents (A) water (0.1% formic acid) and (B) acetonitrile (0.1% formic acid). The elution profile for HPLC consisted of initial conditions with 90% A and 10% B followed by isocratic elution for the next 5 min, and the subsequent linear gradient conditions: 5–18 min (to 16% B), 18–22 min (to 18% B), 22–26 min (to 23% B), 26–31 min (to 28% B), and 31–32 min (to 40% B), with isocratic elution at 32–40 min (40% B) and a final linear gradient elution at 40–43 (to 10% B). The flow rate was 15 mL/min, and aliquots of 800 μL were injected.
3.1.3. LC–MS
High-resolution LC-electrospray mass spectrometry (HR‒LCMS) (ESI+/TOF), spectra were recorded using a AccuTOF JMS-T100LC (JEOL, Peabody, USA) in combination with an Agilent Technologies 1200 Series HPLC system at the following instrumental settings/conditions; Ionization mode: positive, ion source temperature = 250 °C, needle voltage = 2000 V, desolvation gas flow = 2.0 L/min, nebulizing gas flow = 1.0 L/min, orifice1 temperature = 100 °C, orifice2 voltage = 6 V, ring lens voltage = 18 V, ion guide peak voltage = 2000 V, detector voltage = 2300 V, acquisition range = 100–1000 m/z, spectral recording interval = 0.5 s, wait time = 0.03 ns and data sampling interval = 0.5 ns. The sample was dissolved in a mixture of water and acetonitrile with 0.1% formic acid. The elution profile for HPLC consisted of initial conditions with 90% A (water with 0.1% formic acid) and 10% B (acetonitrile with 0.1% formic acid), isocratic elution 0–2 min, followed by a linear gradient elution to 50% B (2–15 min). A 50 × 4.6 mm internal diameter, 1.8 μm Agilent Zorbax Eclipse XDB C18 column was used for separation.
3.1.4. NMR-Spectroscopy
One-dimensional 1H and 13C distortionless enhancement by polarization transfer (DEPT-135), two-dimensional heteronuclear single quantum coherence (1H-13C HSQC), heteronuclear multiple bond correlation (1H-13C HMBC), heteronuclear 2 bond correlation (1H-13C H2BC), double quantum filtered correlation (1H-1H DQF COSY), heteronuclear single quantum coherence-total correlation spectroscopy (1H-13C HSQC-TOCSY), homonuclear J-resolved (1H J-RES) and total correlation spectroscopy (1H-1H TOCSY) experiments were obtained on a Bruker 850 MHz instrument (Bruker BioSpin, Zürich, Switzerland) equipped with a cryogenic probe. The spectral widths were 10–15 ppm and 165–220 ppm for the 1H and 13C-dimensions, respectively. The number of collected data points was 2048 for 1H-dimension in most 2D experiment (4096 in HMBC), and 256 in the 13C dimension. The 2D experiments HMBC, HSQC and H2BC were acquired with non-uniform sampling (NUS = 20–50%). The coupling constants were 145 Hz for 1JCH, 8 Hz for long range couplings (HMBC) and 120–160 Hz for 2JCH (H2BC). Recycle delay was 2 s in all experiments. Sample temperatures were stabilized at 298 K. The deuteriomethyl 13C signal and the residual 1H signal of the solvent (d6-DMSO or d4-MeOD) were used as secondary references (δ 39.5/2.5 and 49.1/3.31 from TMS, respectively).
3.2. Plant Material and Study Sites
Samples of R. cirrhosa and R. maritima were collected during spring low tide by hand from five different study sites in the southern coast of Norway: Bergen, Røytepøyla (A) (60°15′34.5″ N, 05°15′57.9″ E), Etne, Gjersvik, (B) (59°38′41.5″ N, 05°55′18.8″ E), Tysvær, Hadleholmen (C) (59°23′44.1″ N, 05°28′29.6″ E), Tønsberg, Bliksekilen (D) 59°19′25.7″ N, 10°29′58.2″ E) and Råde, Skjeløy (E) (59°17′00.4″ N, 10°44′33.5″ E). Voucher specimen of Ruppia cirrhosa and Ruppia maritima have been deposited in the Herbarium BG (Voucher BG/S 164805 and 53439) at the University Museum of Bergen, Bergen. Plant identification was based on plant morphology and habitat ecology. Leaves of both species are brown-greenish, narrowly linear, sheathering at the base, and fine teethed at the apex. Sheaths of R. maritima are slightly inflated; sheaths of R. cirrhosa are typically conspicuously inflated. Flowers of both species are hermaphroditic and small, in two-flowered, pedunculate spikes. Perianth is absent. Peduncles in R. cirrhosa are 8–15 cm long, sometimes longer, and spirally coiled when fruits are mature. Peduncles in R. maritima are shorter; 4–6 cm long, often somewhat recurved in fruit but never spirally coiled. R. cirrhosa is typically 30–50 cm long, whereas R. maritima often is 10–15 cm long, sometimes up to 30 cm long. R. maritima is found mostly in the hydrolittoral zone, sometimes down to the upper part of the sublittoral zone, growing at ±0.5 m deep, whereas R. cirrhosa occurs in the sublittoral zone and is permanently submerged at depths of 0.5–1.5 m. Both species are found on soft substrata, such as mud and silt. R. maritima is also found on fine sand.
3.3. Extraction, Purification and Identification
The collected plant material was washed thoroughly in fresh water and air-dried. The root was separated from the rest of the plant, and the material was cut in small pieces and stored at −20 °C, when not used. Air-dried leaves of R. cirrhosa were extracted with 50% aqueous methanol (HPLC) for 24 h at room temperature. The extraction was repeated 4 times. The combined extracts were filtered through glass wool, and the volume was further reduced using a rotavapor. The concentrated aqueous extract was partitioned against ethyl acetate three times. The content of both the ethyl acetate and water phase was examined on HPLC. About a third of the aqueous extract was applied to an Amberlite XAD-7 column (5 × 20 cm), and eluted with distilled water until no colour was observed, then methanol was applied. Collected fractions were analyzed on analytical HPLC and concentrated using a rotavapor. The semi-purified plant extract was submitted to preparative HPLC to obtain purified compounds. The physiochemical and spectral data of the flavonoids and chicoric acid were as follows:
Quercetin 3-O-β-d-galactopyranoside (1): Yellow amorphous powder (MeOH); UV/Vis λmax nm 353, 256, 264 (sh); HRLC-MS m/z 465.1015 [M + H]+, 1H-NMR (d6-DMSO, 850.13 MHz) δ (ppm), aglycone; 7.66 (1H, dd, J = 8.6, 2.3 Hz, H-6′), 7.53 (1H, d, J = 2.3 Hz, H-2′), 6.82 (1H, d, J = 8.4 Hz, H-5′), 6.41 (1H, d, J = 1.9 Hz, H-8), 6.20 (1H, d, J = 1.9 Hz, H-6), sugar; 5.37 (1H, d, J = 7.7 Hz, H-1″), 3.56 (1H, m, H-2″), 3.37 (1H, dd, J = 9.6, 3.6 Hz, H-3″), 3.65 (1H, m, H-4″), 3.33 (1H, m, H-5″), 3.29 (1H, dd, J = 10.8, 5.8 Hz, H-6a″), 3.46 (1H, dd, J =10.8, 6.2 Hz, H-6b″). 13C-NMR (d6-DMSO 213.765 MHz) δ (ppm): aglycone; 156.2 (C-2), 133.5 (C-3), 177.5 (C-4), 161.2 (C-5), 98.7 (C-6), 164.2 (C-7), 93.5 (C-8), 156.3 (C-9), 103.9 (C-10), 121.1 (C-1′), 116.0 (C-2′), 144.9 (C-3′), 148.5 (C-4′), 115.2 (C-5′), 122.0 (C-6′), sugar; 101.8 (C-1″), 71.2 (C-2″), 73.2 (C-3″), 67.9 (C-4″), 75.9 (C-5″), 60.1 (C-6″). The structure was confirmed by comparison with literature data [19,20,21].
Quercetin 3-O-β-d-glucopyranoside (2): Yellow amorphous powder (MeOH); UV/Vis λmax nm 352, 256, 263 (sh); HRLC-MS m/z 465.0999 [M + H]+, 1H-NMR (d6-DMSO, 850.13 MHz) δ (ppm), 7.66 (1H, dd, J = 8.6, 2.3 Hz, H-6′), 7.53 (1H, d, J = 2.3 Hz, H-2′), 6.82 (1H, d, J = 8.6 Hz, H-5′), 6.41 (1H, d, J = 1.9 Hz, H-8), 6.20 (1H, d, J = 1.9 Hz, H-6), sugar; 5.46 (1H, d, J = 7.4 Hz, H-1″), 3.24 (1H, t like, J = 8.4 Hz H-2″), 3.22 (1H, t, J = 8.5 Hz, H-3″), 3.09 (1H, d, J = 5.7 Hz, H-4″), 3.08 (1H, m, H-5″), 3.32 (1H, td, J = 12.0, 6.0, 2.1 Hz, H-6a″), 3.58 (1H, d, J = 12.0 Hz, H-6b″). 13C-NMR (d6-DMSO 213.765 MHz) δ (ppm): aglycone; 156.2 (C-2), 133.3 (C-3), 177.4 (C-4), 161.2 (C-5), 98.7 (C-6), 164.2 (C-7), 93.5 (C-8), 156.3 (C-9), 104.0 (C-10), 121.2 (C-1′), 116.2 (C-2′), 144.8 (C-3′), 148.5 (C-4′), 115.2 (C-5′), 122.0 (C-6′), sugar; 100.8 (C-1″), 74.1 (C-2″), 76.5 (C-3″), 69.9 (C-4″), 77.6 (C-5″), 60.9 (C-6″). The structure was confirmed by comparison with literature data [19,21,22,58].
Quercetin 3-O-β-d-(6″-O-malonyl)galactopyranoside (4): Yellow amorphous powder (MeOH); UV/Vis λmax nm 354, 256, 264 (sh); HRLC-MS m/z 551.1062 [M + H]+, 1H-NMR (d6-DMSO, 850.13 MHz) δ (ppm): aglycone; 7.67 (1H, dd, J = 8.3, 2.3 Hz, H-6′), 7.52 (1H, d, J = 2.2 Hz, H-2′), 6.81 (1H, d, J = 8.6 Hz, H-5′), 6.40 (1H, d, J = 2.0 Hz, H-8), 6.20 (1H, d, J = 2.0 Hz, H-6), sugar; 5.37 (1H, d, J = 8.1 Hz, H-1″), 3.57 (1H, m, H-2″), 3.36 (1H, dd, J = 8.9, 3.7 Hz, H-3″), 3.65 (1H, m, H-4″), 3.61 (1H, td, J = 6.2, 1.7 Hz, H-5″), 4.00 (1H, dd, J = 12.0, 5.8Hz, H-6a″), 4.20 (1H, dd, J =12.1, 2.3 Hz, H-6b″), acyl; 3.11 (2H, d, J = 16.0 Hz, H-2′′′). 13C-NMR (d6-DMSO 213.765 MHz) δ (ppm): aglycone; 156.2 (C-2), 133.4 (C-3), 177.1 (C-4), 161.2 (C-5), 98.6 (C-6), 164.1 (C-7), 93.4 (C-8), 156.3 (C-9), 103.8 (C-10), 121.5 (C-1′), 116.2 (C-2′), 144.7 (C-3′), 148.4 (C-4′), 115.1 (C-5′), 121.9 (C-6′), sugar; 101.7 (C-1″), 71.0 (C-2″), 73.1 (C-3″), 67.9 (C-4″), 72.4 (C-5″), 63.5 (C-6″), malonyl; 166.5 (C-1′′′), 41.0 (C-2′′′), 167.7 (C-3′′′). The structure was confirmed by comparison with literature data [23].
Isorhamnetin 3-O-β-d-galactopyranoside (5): Yellow amorphous powder (MeOH); UV/Vis λmax nm 351, 254, 266 (sh); HRLC-MS m/z 479.1208 [M + H]+, 1H-NMR (d4-MeOD, 850.13 MHz) δ (ppm): aglycone; 7.59 (1H, dd, J = 8.5, 2.0 Hz, H-6′), 8.03 (1H, d, J = 2.0 Hz, H-2′), 6.90 (1H, d, J = 8.4 Hz, H-5′), 6.41 (1H, d, J = 1.9 Hz, H-8), 6.21 (1H, d, J = 1.9 Hz, H-6), 3.96 (3H, s, OCH3), sugar; 5.34 (1H, d, J = 7.4 Hz, H-1″), 3.82 (1H, dd, J = 9.6, 7.8 Hz, H-2″), 3.56 (1H, dd, J = 9.1, 2.8 Hz, H-3″), 3.84 (1H, dd, J = 3.2, 0.9 Hz, H-4″), 3.48 (1H, t, J = 8.5 Hz, H-5″), 3.47 (1H, td, J = 11.7, 5.7, 1.7 Hz, H-6a″), 3.65 (1H, dd, J = 11.8, 6.1 Hz, H-6b″). 13C-NMR (d4-MeOD, 213.765 MHz) δ (ppm): aglycone; 158.8 (C-2), 135.6 (C-3), 179.6 (C-4), 163.3 (C-5), 100.0 (C-6), 166.1 (C-7), 94.9 (C-8), 158.6 (C-9), 105.9 (C-10), 123.2 (C-1′), 114.7 (C-2′), 148.6 (C-3′), 151.0 (C-4′), 116.1 (C-5′), 123.8 (C-6′), 57.0 (OCH3), sugar; 104.5 (C-1″), 73.3 (C-2″), 75.2 (C-3″), 70.2 (C-4″), 77.4 (C-5″), 62.3 (C-6″). The structure was confirmed by comparison with literature data [24,25].
Isorhamnetin 3-O-β-d-glucopyranoside (6): Yellow amorphous powder (MeOH); UV/Vis λmax nm 354, 254, 266 (sh); HRLC-MS m/z 479.1212 [M + H]+, 1H-NMR (d4-MeOD, 850.13 MHz) δ (ppm): aglycone; 7.58 (1H, dd, J = 8.4, 2.0 Hz, H-6′), 7.93 (1H, d, J = 2.0 Hz, H-2′), 6.91 (1H, d, J = 8.3 Hz, H-5′), 6.41 (1H, d, J = 1.9 Hz, H-8), 6.21 (1H, d, J = 1.9 Hz, H-6), 3.95 (3H, s, OCH3), sugar; 5.41 (1H, d, J = 7.8 Hz, H-1″), 3.46 (1H, t like, J = 8.6 Hz, H-2″), 3.45 (1H, dd, J = 9.4, 8.2 Hz, H-3″), 3.30 (1H, m, J = 9.4 Hz, H-4″), 3.24 (1H, m, H-5″), 3.57 (1H, dd, J = 11.9, 5.8 Hz, H-6a″), 3.73 (1H, dd, J = 12.0, 2.5 Hz, H-6b″). 13C-NMR (d4-MeOD, 213.765 MHz) δ (ppm): aglycone; 158.8 (C-2), 135.5 (C-3), 179.6 (C-4), 163.3 (C-5), 100.0 (C-6), 166.1 (C-7), 94.9 (C-8), 158.6 (C-9), 105.9 (C-10), 123.2 (C-1′), 114.6 (C-2′), 148.6 (C-3′), 151.0 (C-4′), 116.1 (C-5′), 122.5 (C-6′), 57.0 (OCH3), sugar; 103.7 (C-1″), 76.1 (C-2″), 78.2 (C-3″), 71.6 (C-4″), 78.7 (C-5″), 62.7 (C-6″). The structure was confirmed by comparison with literature data [22,25,26].
Isorhamnetin 3-O-β-d-(6″-O-malonyl)galactopyranoside (7): Yellow amorphous powder (MeOH); UV/Vis λmax nm 350, 254, 266 (sh); HRLC-MS m/z 565.1216 [M + H]+, 1H-NMR (d4-MeOD, 850.13 MHz) δ (ppm): aglycone; 7.62 (1H, dd, J = 8.3, 2.1 Hz, H-6′), 7.90 (1H, d, J = 2.0 Hz, H-2′), 6.92 (1H, d, J = 8.4 Hz, H-5′), 6.44 (1H, d, J = 2.1 Hz, H-8), 6.23 (1H, d, J = 2.1 Hz, H-6), 3.97 (3H, s, OCH3), sugar; 5.21 (1H, d, J = 7.6 Hz, H-1″), 3.81 (1H, m, H-2″), 3.58 (1H, t, J = 9.7 Hz, H-3″), 3.89 (1H, d, J = 4.3 Hz, H-4″), 3.86 (1H, t, J = 9.1 Hz, H-5″), 4.29 (1H, dd, J = 11.4, 4.4 Hz, H-6a″), 4.49 (1H, dd, J = 11.6, 8.4 Hz, H-6b″). 13C- NMR (d4-MeOD, 213.765 MHz) δ (ppm): aglycone; 157.6 (C-2), 134.0 (C-3), 178.0 (C-4), 161.7 (C-5), 98.5 (C-6), 164.6 (C-7), 93.6 (C-8), 157.0 (C-9), 104.3 (C-10), 121.5 (C-1′), 113.0 (C-2′), 146.9 (C-3′), 149.5 (C-4′), 114.7 (C-5′), 122.4 (C-6′), 55.4 (OCH3), sugar; 103.3 (C-1″), 71.4 (C-2″), 73.4 (C-3″), 69.0 (C-4″), 73.4 (C-5″), 63.1 (C-6″), acyl; 166.3 (C-1′′′). The structure was confirmed by comparison with literature data [23,27].
Isorhamnetin 3-O-β-d-(6″-O-malonyl)glucopyranoside (8): Yellow amorphous powder (MeOH); UV/Vis λmax nm 355, 254, 266 (sh); HRLC-MS m/z 565.1208 [M + H]+, 1H-NMR (d4-MeOD, 850.13 MHz) δ (ppm): aglycone; 7.61 (1H, dd, J = 8.5, 2.0 Hz, H-6′), 7.88 (1H, d, J = 2.1 Hz, H-2′), 6.91 (1H, d, J = 8.4 Hz, H-5′), 6.44 (1H, d, J = 2.1 Hz, H-8), 6.22 (1H, d, J = 2.1 Hz, H-6), 3.95 (3H, s, OCH3), sugar; 5.22 (1H, d, J = 7.6 Hz, H-1″), 3.40 (1H, m, J = 8.6 H-2″), 3.43 (1H, t, J = 8.7 Hz, H-3″), 3.35 (1H, t, J = 9.7 Hz, H-4″), 3.47 (1H, t, J = 8.5 Hz, H-5″), 4.19 (1H, dd, J = 12.0, 5.6 Hz, H-6a″), 4.23 (1H, dd, J = 12.0, 2.3 Hz, H-6b″). 13C-NMR (d4-MeOD, 213.765 MHz) δ (ppm): aglycone; 157.7 (C-2), 135.6 (C-3), 173.9 (C-4), 161.7 (C-5), 98.5 (C-6), 164.6 (C-7), 93.6 (C-8), 157.1 (C-9), 104.3 (C-10), 121.6 (C-1′), 113.0 (C-2′), 147.0 (C-3′), 149.6 (C-4′), 114.6 (C-5′), 122.7 (C-6′), 55.4 (OCH3), sugar; 103.1 (C-1″), 74.2 (C-2″), 76.5 (C-3″), 69.9 (C-4″), 74.4 (C-5″), 63.4 (C-6″), acyl; 169.0 (C-1′′′). The structure was confirmed by comparison with literature data [27].
2,3-O-Dicaffeoyltartaric acid (CA): White amorphous powder (MeOH); UV/Vis λmax nm 331, 302 (sh), 245; HRLC-MS m/z 497.0681 [M + Na]+, 1H-NMR (d6-DMSO, 850.13 MHz) δ (ppm): 5.68 (2H, s, H-2, H-3), 7.10 (2H, d, J = 2.1 Hz, H-2′, H-2″), 6.78 (2H, d, J = 8.1 Hz, H-5′, H-5″), 7.08 (2H, dd, J = 8.2, 2.1 Hz, H-6′, H-6″), 7.56 (1H, d, J = 15.8 Hz, H-7′, H-7″), 6.36 (1H, d, J = 15.8 Hz, H-8′, H-8″). 13C-NMR (d6-DMSO, 213.765 MHz) δ (ppm): 167.6 (C-1, C-4), 70.7 (C-2, C-3), 125.2 (C-1′, C-1″), 115.3 (C-2′, C-2″), 145.6 (C-3′, C-3″), 148.9 (C-4′, C-4″), 115.8 (C-5′, C-5″), 121.7 (C-6′, C-6″), 147.0 (C-7′, C-7″), 112.3 (C-8′, C-8″), 165.5 (C-9′, C-9″). The structure was confirmed by comparison with literature data [28].
3.4. Quantitative Determination
Leaves of R. cirrhosa and R. maritima were cut into small pieces and extracted with 50% aqueous methanol, the flavonoid content of the extract was characterized by analytical HPLC with DAD and HR–LCMS. Quantitative determination: 10–40 mg of dried plant material was weighed and extracted with 3–5 mL of 50% aqueous methanol for 2 hours at room temperature. Four replicate samples were made. Prior to injection, the solutions were filtered through a 0.45 μm Millipore membrane filter. HPLC calibration curves of quercetin 3-O-β-d-glucopyranoside (≥90% (HPLC), Sigma-Aldrich, Sigma-Aldric, St. Louis, MO, USA) and caffeic acid (≥98% (HPLC), Sigma-Aldrich) were used to determine the quantitative amounts of flavonoids and phenolic compounds, respectively. The results are presented as milligrams quercetin 3-O-β-d-glucopyranoside or caffeic acid equivalents ± one standard deviation (SD) per gram of dry weight (DW) plant material. Two sample t-test assuming unequal variances with a p-value of 0.05 was used to determine if the means of two different measurements were equal or not. Standard error bars were calculated using the STDEV. P function in excel, and represent one standard deviation (n = 4 or number of replicates).
3.5. Method Validation
The established HPLC method was validated for linearity, sensitivity, precision and accuracy, as previously described [51]. LOD and LOQ were calculated based on standard deviation of y-intercepts of the regression line (SD) and the slope (S), using the equations LOD = 3.3 × SD/S and LOQ = 10 × SD/S. Recovery study was performed in triplicate by adding known amounts of quercetin 3-O-β-d-glucopyranoside to crude extracts of R. cirrhosa. Data for calibration curves, test ranges, limit of detection (LOD) and limit of quantification (LOQ) for quercetin 3-O-β-d-glucopyranoside (90%, Sigma-Aldrich Sigma) and caffeic acid (Sigma-Aldrich) are presented in Table 5. The recovery was ranging from 93.3% to 94.8% for quercetin 3-O-β-d-glucopyranoside with a mean of 94.0 ± 2.0% (Table 5).
Table 5.
Calibration curve, LOD and LOQ for quercetin 3-O-β-d-glucopyranoside (≥90%, Sigma Aldrich) and caffeic acid (≥98%, Sigma-Aldrich).
3.6. DPPH Radical Scavenging
The stable 1,1-diphenyl-2-picryl hydrazyl radical (DPPH·) was used for determination of free radical-scavenging activity of R. cirrhosa extracts and isolated mixtures of flavonoids (purity ≥ 75% (HPLC)). Different sample concentrations of the extracts were prepared, and 0.05 mL of each sample was added to a 2.95 mL methanolic solution of DPPH· (45 μg/mL). A UV-1800 UV spectrophotometer (Shimadzu Scientific Instruments, Columbia, MD, USA) was used for the antioxidant assays. The UV/Vis absorbance at 517 nm was measured every 30 s for 5 min. The experiment was repeated three times, and the results are presented as mean ± standard deviation (n = 3). Trolox (97%, Sigma-Aldrich), chicoric acid (≥95% (HPLC), Sigma-Aldrich), quercetin (≥95% (HPLC), Sigma-Aldrich), quercetin 3-O-β-d-glucopyranoside (≥90% (HPLC), Sigma-Aldrich) and rutin (≥95% (HPLC), Sigma-Aldrich) were used as standard controls. Percent radical-scavenging was calculated as 100 × (Astart − Aend)/(Astart), where Astart is the absorbance before addition of the sample, and Aend is the absorbance value after 5 min of reaction time. Percent scavenging IC50 values were calculated from a linear regression plot of percent scavenging (%) against logarithmic concentration of the test compound [59]. IC50 values denote the concentration of sample which is required to scavenge 50% of DPPH· free radicals.
4. Conclusions
In this study, the polyphenolic content of Ruppia cirrhosa and Ruppia marittima was characterized for the first time using NMR-spectroscopy, HRLC-MS and HPLC-UV. Both Ruppia species contained high amounts of chicoric acid (10.6–30.2 mg/g DW), followed by relatively high amounts of flavonoid glycosides (5.9–14.7 mg/g DW). The eight flavonoids identified were based on quercetin and isorhamnetin with 3-O-galactopyranosides or 3-O-glucopyranosides, four of these were malonylated. This is the first report of 3-O-galactopyranosides and malonylated flavonoids of quercetin and isorhamnetin isolated from aquatic plants. The seasonal variations of flavonoids and phenolics were examined by analyzing R. cirrhosa samples in October, March and August. Highest flavonoid content was found in August, whereas the highest concentration of chicoric acid was observed in March.
Extracts of R. cirrhosa showed low to moderate DPPH· antioxidant activity, however, partially purified extract and isolated compounds showed strong to very strong antioxidant activities, with IC50 values ranging from 12.1 to 88.4 μg/mL.
Acknowledgments
The authors are grateful to The Research Council of Norway for financial support through the Norwegian NMR Platform, NNP (226244/F50), chef engineer Ph.D. Bjarte Holmelid (Department of Chemistry, University of Bergen, Norway) for recording the high-resolution mass spectra and the University of Bergen, Norway for Open Access funding.
Author Contributions
K.H.E. and M.J. conceived and designed the experiments; K.H.E. performed the experiments; K.H.E. and M.J. analyzed the data; A.L. contributed plant materials; K.H.E and M.J. wrote the paper. All authors read and approved the final manuscript.
Conflicts of Interest
The authors declare no conflict of interest.
References
- Cardozo, K.H.M.; Guaratini, T.; Barros, M.P.; Falcão, V.R.; Tonon, A.P.; Lopes, N.P.; Campos, S.; Torres, M.A.; Souza, A.O.; Colepicolo, P.; et al. Metabolites from algae with economical impact. Comp. Biochem. Physiol. Part C Toxicol. Pharmacol. 2007, 146, 60–78. [Google Scholar] [CrossRef] [PubMed]
- Subhashini, P.; Dilipan, E.; Thangaradjou, T.; Papenbrock, J. Bioactive natural products from marine angiosperms: Abundance and functions. Nat. Prod. Bioprospect. 2013, 3, 129–136. [Google Scholar] [CrossRef]
- Zidorn, C. Secondary metabolites of seagrasses (Alismatales and Potamogetonales; Alismatidae): Chemical diversity, bioactivity, and ecological function. Phytochemistry 2016, 124, 5–28. [Google Scholar] [CrossRef] [PubMed]
- Achamlale, S.; Rezzonico, B.; Grignon-Dubois, M. Rosmarinic acid from beach waste: Isolation and HPLC quantification in Zostera detritus from Arcachon lagoon. Food Chem. 2009, 113, 878–883. [Google Scholar] [CrossRef]
- Agostini, S.; Desjobert, J.-M.; Pergent, G. Distribution of phenolic compounds in the seagrass Posidonia oceanica. Phytochemistry 1998, 48, 611–617. [Google Scholar] [CrossRef]
- Bitam, F.; Ciavatta, M.L.; Carbone, M.; Manzo, E.; Mollo, E.; Gavagnin, M. Chemical analysis of flavonoid constituents of the seagrass Halophila stipulacea: First finding of malonylated derivatives in marine phanerogams. Biochem. Syst. Ecol. 2010, 38, 686–690. [Google Scholar] [CrossRef]
- Boutard, B.; Bouillant, M.-L.; Chopin, J.; Lebreton, P. Chimiotaxinomie flavonique des fluviales. Biochem. Syst. Ecol. 1973, 1, 133–140. [Google Scholar] [CrossRef]
- Enerstvedt, K.H.; Jordheim, M.; Andersen, Ø.M. Isolation and Identification of Flavonoids Found in Zostera marina Collected in Norwegian Coastal Waters. Am. J. Plant Sci. 2016, 7, 1163–1172. [Google Scholar] [CrossRef]
- Grignon-Dubois, M.; Rezzonico, B. First Phytochemical Evidence of Chemotypes for the Seagrass Zostera noltii. Plants 2012, 1, 27–38. [Google Scholar] [CrossRef] [PubMed]
- Harborne, J.B.; Williams, C.A. Occurrence of sulphated flavones and caffeic acid esters in members of the fluviales. Biochem. Syst. Ecol. 1976, 4, 37–41. [Google Scholar] [CrossRef]
- McMillan, C.; Zapata, O.; Escobar, L. Sulphated phenolic compounds in seagrasses. Aquat. Bot. 1980, 8, 267–278. [Google Scholar] [CrossRef]
- Nuissier, G.; Rezzonico, B.; Grignon-Dubois, M. Chicoric acid from Syringodium filiforme. Food Chem. 2010, 120, 783–788. [Google Scholar] [CrossRef]
- Hawas, U.W. A New 8-Hydroxy Flavone O-Xyloside Sulfate and Antibacterial Activity from the Egyptian Seagrass Thalassia hemprichii. Chem. Nat. Compd. 2014, 50, 629–632. [Google Scholar] [CrossRef]
- Richardson, F.D. Ecology of Ruppia maritima L. in New Hampshire (U.S.A) tidal marshes. Rhodora 1980, 82, 403–439. [Google Scholar]
- Den Hartog, C.; Wiegleb, G. Potamogetonaceae, Zosteraceae, and Cymodoceaceae. Flora Males. Ser. 1 Spermatophyta 2002, 16, 167–216. [Google Scholar]
- Haynes, R.R. The Potamogetonaceae in the Southeastern United States. J. Arnold Arbor. 1978, 59, 170–191. [Google Scholar]
- Les, D.H.; Haynes, R.R. Systematics of subclass Alismatidae: A synthesis of approaches. In Monocyledons: Systematics and Evolution; Cutler, D.F., Humphries, C.J., Eds.; Royal Botanic Gardens, Kew: London, UK, 1995; Volume 2. [Google Scholar]
- Lee, J.; Scagel, C.F. Chicoric acid: Chemistry, distribution, and production. Front. Chem. 2013, 1, 1–17. [Google Scholar] [CrossRef] [PubMed]
- Lu, Y.; Foo, L.Y. Identification and quantification of major polyphenols in apple pomace. Food Chem. 1997, 59, 187–194. [Google Scholar] [CrossRef]
- Sikorska, M.; Matlawska, I. Quercetin and its glycosides in the flowers of Asclepias syriaca L. Acta Pol. Pharm. 2000, 57, 321–324. [Google Scholar] [PubMed]
- Pereira, C.; Barreto Júnior, C.B.; Kuster, R.M.; Simas, N.K.; Sakuragui, C.M.; Porzel, A.; Wessjohann, L. Flavonoids and a neolignan glucoside from Guarea macrophylla (Meliaceae). Quím. Nova 2012, 35, 1123–1126. [Google Scholar] [CrossRef]
- Liu, H.; Mou, Y.; Zhao, J.; Wang, J.; Zhou, L.; Wang, M.; Wang, D.; Han, J.; Yu, Z.; Yang, F. Flavonoids from Halostachys caspica and their antimicrobial and antioxidant activities. Molecules 2010, 15, 7933–7945. [Google Scholar] [CrossRef] [PubMed]
- Kamata, K.; Seo, S.; Nakajima, J.-I. Constituents from leaves of Apocynum venetum L. J. Nat. Med. 2008, 62, 160–163. [Google Scholar] [CrossRef] [PubMed]
- Saleh, N.A.M.; Mansour, R.M.A.; Markham, K.R. An acylated isorhamnetin glycoside from Aerva javanica. Phytochemistry 1990, 29, 1344–1345. [Google Scholar] [CrossRef]
- Napolitano, J.G.; Lankin, D.C.; Chen, S.-N.; Pauli, G.F. Complete 1H NMR spectral analysis of ten chemical markers of Ginkgo biloba. Magn. Reson. Chem. 2012, 50, 569–575. [Google Scholar] [CrossRef] [PubMed]
- Hassanean, H.A.; Desoky, E.K. An acylated isorhamnetin glucoside from Zygophyllum simplex. Phytochemistry 1992, 31, 3293–3294. [Google Scholar] [CrossRef]
- Wald, B.; Wray, V.; Galensa, R.; Herrmann, K. Malonated flavonol glycosides and 3,5-dicaffeoylquinic acid from pears. Phytochemistry 1989, 28, 663–664. [Google Scholar] [CrossRef]
- Cheminat, A.; Zawatzky, R.; Becker, H.; Brouillard, R. Caffeoyl conjugates from Echinacea species: Structures and biological activity. Phytochemistry 1988, 27, 2787–2794. [Google Scholar] [CrossRef]
- Grignon-Dubois, M.; Rezzonico, B. The economic potential of beach-cast seagrass—Cymodocea nodosa: A promising renewable source of chicoric acid. Bot. Mar. 2013, 56, 303–311. [Google Scholar] [CrossRef]
- Cariello, L.; Zanetti, L. Distribution of Chicoric Acid during Leaf Development of Posidonia oceanica. Bot. Mar. 1979, 22, 359–360. [Google Scholar] [CrossRef]
- Haznedaroglu, M.Z.; Zeybek, U. HPLC Determination of Chicoric Acid in Leaves of Posidonia oceanica. Pharm. Biol. 2007, 45, 745–748. [Google Scholar] [CrossRef]
- Grignon-Dubois, M.; Rezzonico, B. Phenolic fingerprint of the seagrass Posidonia oceanica from four locations in the Mediterranean Sea: First evidence for the large predominance of chicoric acid. Bot. Mar. 2015, 58, 379–391. [Google Scholar] [CrossRef]
- Qi, S.-H.; Huang, L.-S.; He, F.; Zhang, S.; Dong, J.-D. Phytochemical and chemotaxonomic investigation of seagrass Thalassia hemprichii (Ehrenb.) Aschers (Hydrocharitaceae). Biochem. Syst. Ecol. 2012, 43, 128–131. [Google Scholar] [CrossRef]
- Molyneux, P. The use of the stable free radical diphenylpicrylhydrazyl (DPPH) for estimating antioxidant. Songklanakarin J. Sci. Technol. 2004, 26, 211–219. [Google Scholar]
- Yuvaraj, N.; Kanmani, P.; Satishkumar, R.; Paari, A.; Pattukumar, V.; Arul, V. Seagrass as a potential source of natural antioxidant and anti-inflammatory agents. Pharm. Biol. 2012, 50, 458–467. [Google Scholar] [CrossRef] [PubMed]
- Santoso, J.; Anwariyah, S.; Rumiantin, R.O.; Putri, A.P.; Ukhty, N.; Yoshie-Stark, Y. Phenol content, antioxidant activity and fibers profile of four tropical Seagrasses from Indonesia. J. Coast. Dev. 2012, 15, 189–196. [Google Scholar]
- Cao, G.; Sofic, E.; Prior, R.L. Antioxidant and Prooxidant Behavior of Flavonoids: Structure-Activity Relationships. Free Radic. Biol. Med. 1997, 22, 749–760. [Google Scholar] [CrossRef]
- Nimmi, O.S.; Philomena, G. Evaluation of the antioxidant potential of a newly developed polyherbal formulation for antiobesity. Int. J. Pharm. Pharm. Sci. 2012, 4, 505–510. [Google Scholar]
- Ghasemi, K.; Ghasemi, Y.; Ebrahimzadeh, M.A. Antioxidant activity, phenol and flavonoid contents of 13 citrus species peels and tissues. Pak. J. Pharm. Sci. 2009, 22, 277–281. [Google Scholar] [PubMed]
- Majewska, M.; Skrzycki, M.; Podsiad, M.; Czeczot, H. Evaluation of antioxidant potential of flavonoids: An in vitro study. Acta Pol. Pharm. 2011, 68, 611–615. [Google Scholar] [PubMed]
- Nagy, M.; Križková, L.; Mučaji, P.; Kontšeková, Z.; Šeršeň, F.; Krajčovič, J. Antimutagenic Activity and Radical Scavenging Activity of Water Infusions and Phenolics from Ligustrum Plants Leaves. Molecules 2009, 14, 509–518. [Google Scholar] [CrossRef] [PubMed]
- Zuo, A.; Yu, Y.; Li, J.; Xu, B.; Yu, X.; Qiu, Y.; Cao, S. Study on the relation of structure and antioxidant activity of isorhamnetin, quercetin, phloretin, silybin and phloretin isonicotinyl hydrazone. Free Radic. Antioxid. 2011, 1, 39–47. [Google Scholar] [CrossRef]
- Lu, Y.; Khoo, T.J.; Wiart, C. Antioxidant Activity Determination of Citronellal and Crude Extracts of Cymbopogon citratus by 3 Different Methods. Sci. Res. 2014, 5, 395–400. [Google Scholar] [CrossRef]
- Siatka, T.; Kašparová, M. Seasonal Variation in Total Phenolic and Flavonoid Contents and DPPH Scavenging Activity of Bellis perennis L. Flowers. Molecules 2010, 15. [Google Scholar] [CrossRef] [PubMed]
- Zhou, J.-L.; Fang, X.-Y.; Wang, J.-Q.; Zhao, L.-G.; Li, Y.; Tang, F.; Yue, Y.-D. Structures and bioactivities of seven flavonoids from Osmanthus fragrans ‘Jinqiu’ essential oil extraction residues. Nat. Prod. Res. 2017, 32, 588–591. [Google Scholar] [CrossRef] [PubMed]
- Jordheim, M.; Aaby, K.; Fossen, T.; Skrede, G.; Andersen, Ø.M. Molar Absorptivities and Reducing Capacity of Pyranoanthocyanins and Other Anthocyanins. J. Agric. Food Chem. 2007, 55, 10591–10598. [Google Scholar] [CrossRef] [PubMed]
- Ren, F.; Reilly, K.; Kerry, J.P.; Gaffney, M.; Hossain, M.; Rai, D.K. Higher Antioxidant Activity, Total Flavonols, and Specific Quercetin Glucosides in Two Different Onion (Allium cepa L.) Varieties Grown under Organic Production: Results from a 6-Year Field Study. J. Agric. Food Chem. 2017, 65, 5122–5132. [Google Scholar] [CrossRef] [PubMed]
- Slimestad, R.; Fossen, T.; Vagen, I.M. Onions: A source of unique dietary flavonoids. J. Agric. Food Chem. 2007, 55, 10067–10080. [Google Scholar] [CrossRef] [PubMed]
- Hertog, M.G.L.; Hollman, P.C.H.; Venema, D.P. Optimization of a quantitative HPLC determination of potentially anticarcinogenic flavonoids in vegetables and fruits. J. Agric. Food Chem. 1992, 40, 1591–1598. [Google Scholar] [CrossRef]
- Bhagwat, S.; Haytowitz, D.B.; Wasswa-Kintu, S. USDA’s Expanded Flavonoid Database for the Assessment of Dietary Intakes. 2014. Available online: http://www.ars.usda.gov/nutrientdata (accessed 21 December 2017).
- Enerstvedt, K.H.; Lundberg, A.; Sjøtun, I.K.; Fadnes, P.; Jordheim, M. Characterization and seasonal variation of individual flavonoids in Zostera marina and Zostera noltii from Norwegian coastal waters. Biochem. Syst. Ecol. 2017, 74, 42–50. [Google Scholar] [CrossRef]
- Pellati, F.; Benvenuti, S.; Magro, L.; Melegari, M.; Soragni, F. Analysis of phenolic compounds and radical scavenging activity of Echinacea spp. J. Pharm. Biomed. Anal. 2004, 35, 289–301. [Google Scholar] [CrossRef]
- Mølgaard, P.; Johnsen, S.; Christensen, P.; Cornett, C. HPLC Method Validated for the Simultaneous Analysis of Cichoric Acid and Alkamides in Echinacea purpurea Plants and Products. J. Agric. Food Chem. 2003, 51, 6922–6933. [Google Scholar] [CrossRef] [PubMed]
- Liu, C.Z.; Abbasi, B.H.; Gao, M.; Murch, S.J.; Saxena, P.K. Caffeic acid derivatives production by hairy root cultures of Echinacea purpurea. J. Agric. Food Chem. 2006, 54, 8456–8460. [Google Scholar] [CrossRef] [PubMed]
- Chaves, N.; Escudero, J.C.; Gutierrez-Merino, C. Role of Ecological Variables in the Seasonal Variation of Flavonoid Content of Cistus ladanifer Exudate. J. Chem. Ecol. 1997, 23, 579–603. [Google Scholar] [CrossRef]
- Venditti, A.; Serrilli, A.M.; Vittori, S.; Papa, F.; Maggi, F.; Di Cecco, M.; Ciaschetti, G.; Bruno, M.; Rosselli, S.; Bianco, A. Secondary metabolites from Pinus mugo Turra subsp. mugo growing in the Majella National Park (Central Apennines, Italy). Chem. Biodivers. 2013, 10, 2091–2100. [Google Scholar] [CrossRef] [PubMed]
- Vergeer, L.H.T.; Develi, A. Phenolic acids in healthy and infected leaves of Zostera marina and their growth-limiting properties towards Labyrinthula zosterae. Aquat. Bot. 1997, 58, 65–72. [Google Scholar] [CrossRef]
- Caprioli, G.; Alunno, A.; Beghelli, D.; Bianco, A.; Bramucci, M.; Frezza, C.; Iannarelli, R.; Papa, F.; Quassinti, L.; Sagratini, G.; et al. Polar Constituents and Biological Activity of the Berry-Like Fruits from Hypericum androsaemum L. Front. Plant Sci. 2016, 7, 1–12. [Google Scholar] [CrossRef] [PubMed]
- Malterud, K.E.; Farbrot, T.L.; Huse, A.E.; Sund, R.B. Antioxidant and Radical Scavenging Effects of Anthraquinones and Anthrones. Pharmacology 1993, 47, 77–85. [Google Scholar] [CrossRef] [PubMed]
Sample Availability: Not Available. |

© 2017 by the authors. Licensee MDPI, Basel, Switzerland. This article is an open access article distributed under the terms and conditions of the Creative Commons Attribution (CC BY) license (http://creativecommons.org/licenses/by/4.0/).