A Tri-O-Bridged Diels-Alder Adduct from Cortex Mori Radicis

Abstract
:
1. Introduction
2. Results and Discussion
3. Experimental
3.1. General Experimental Procedures
3.2. Plant Material
3.3. Extraction and Isolation
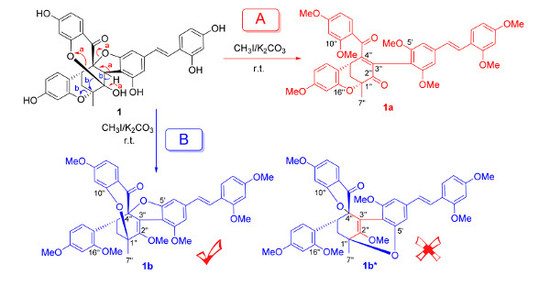
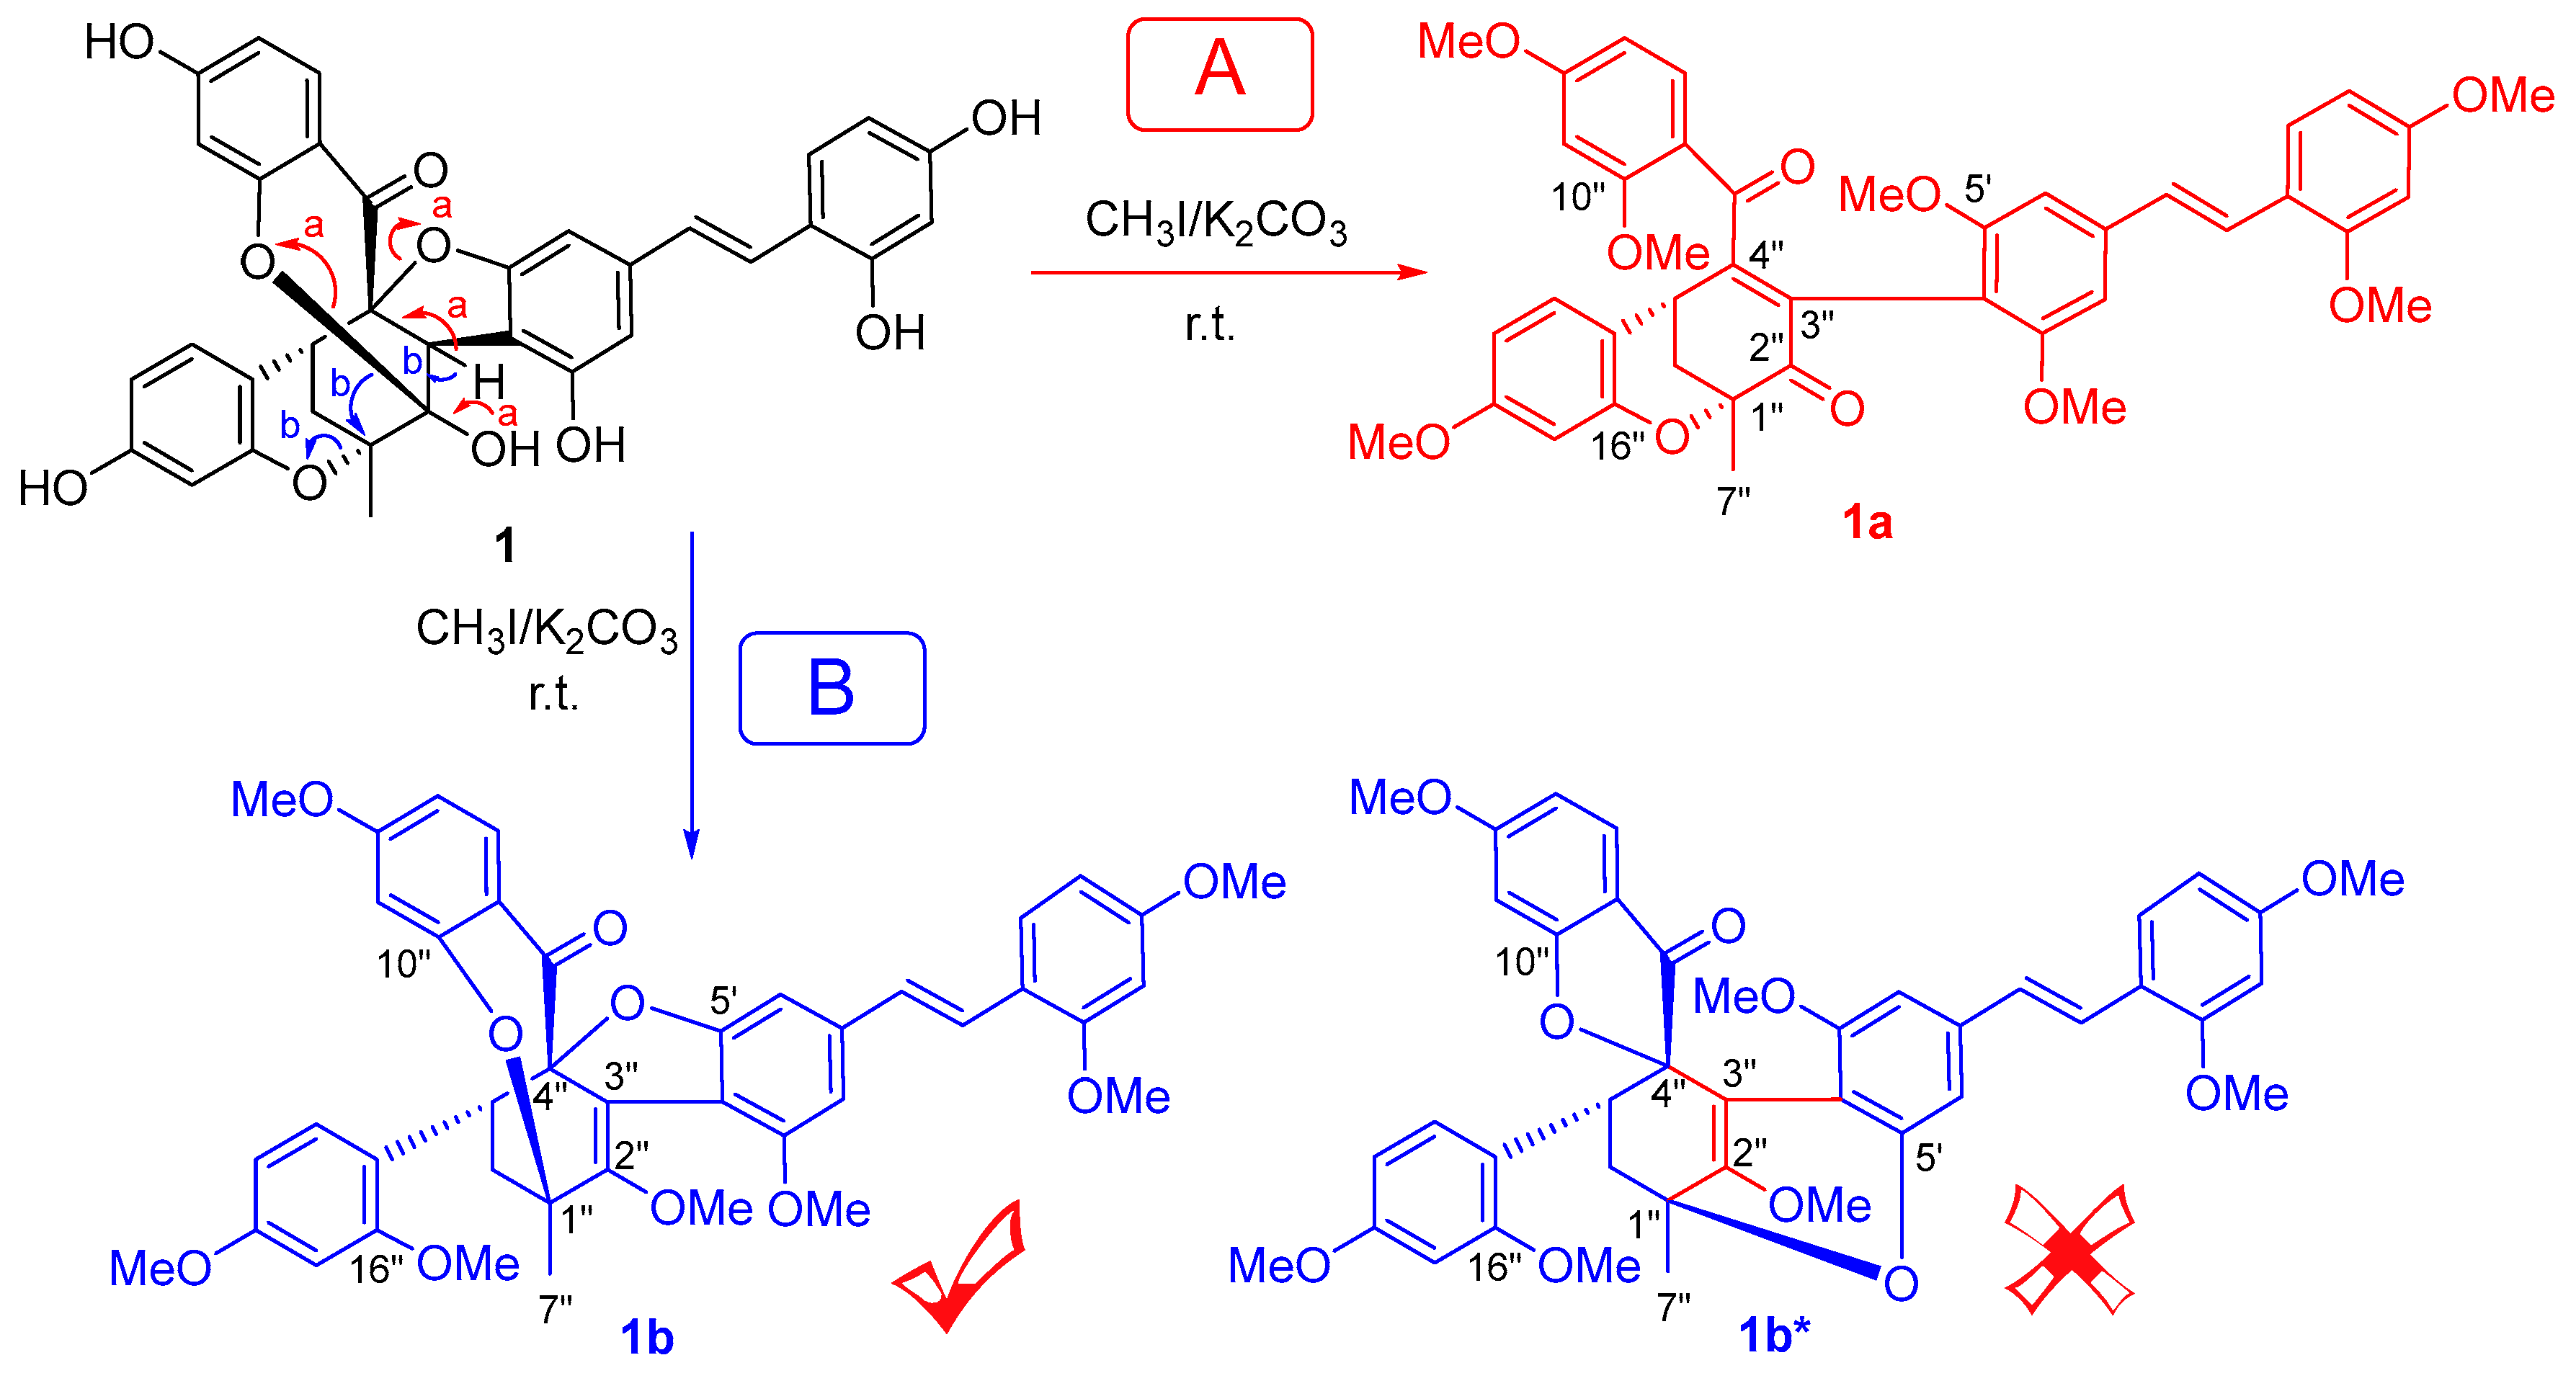
3.4. Methylation of 1
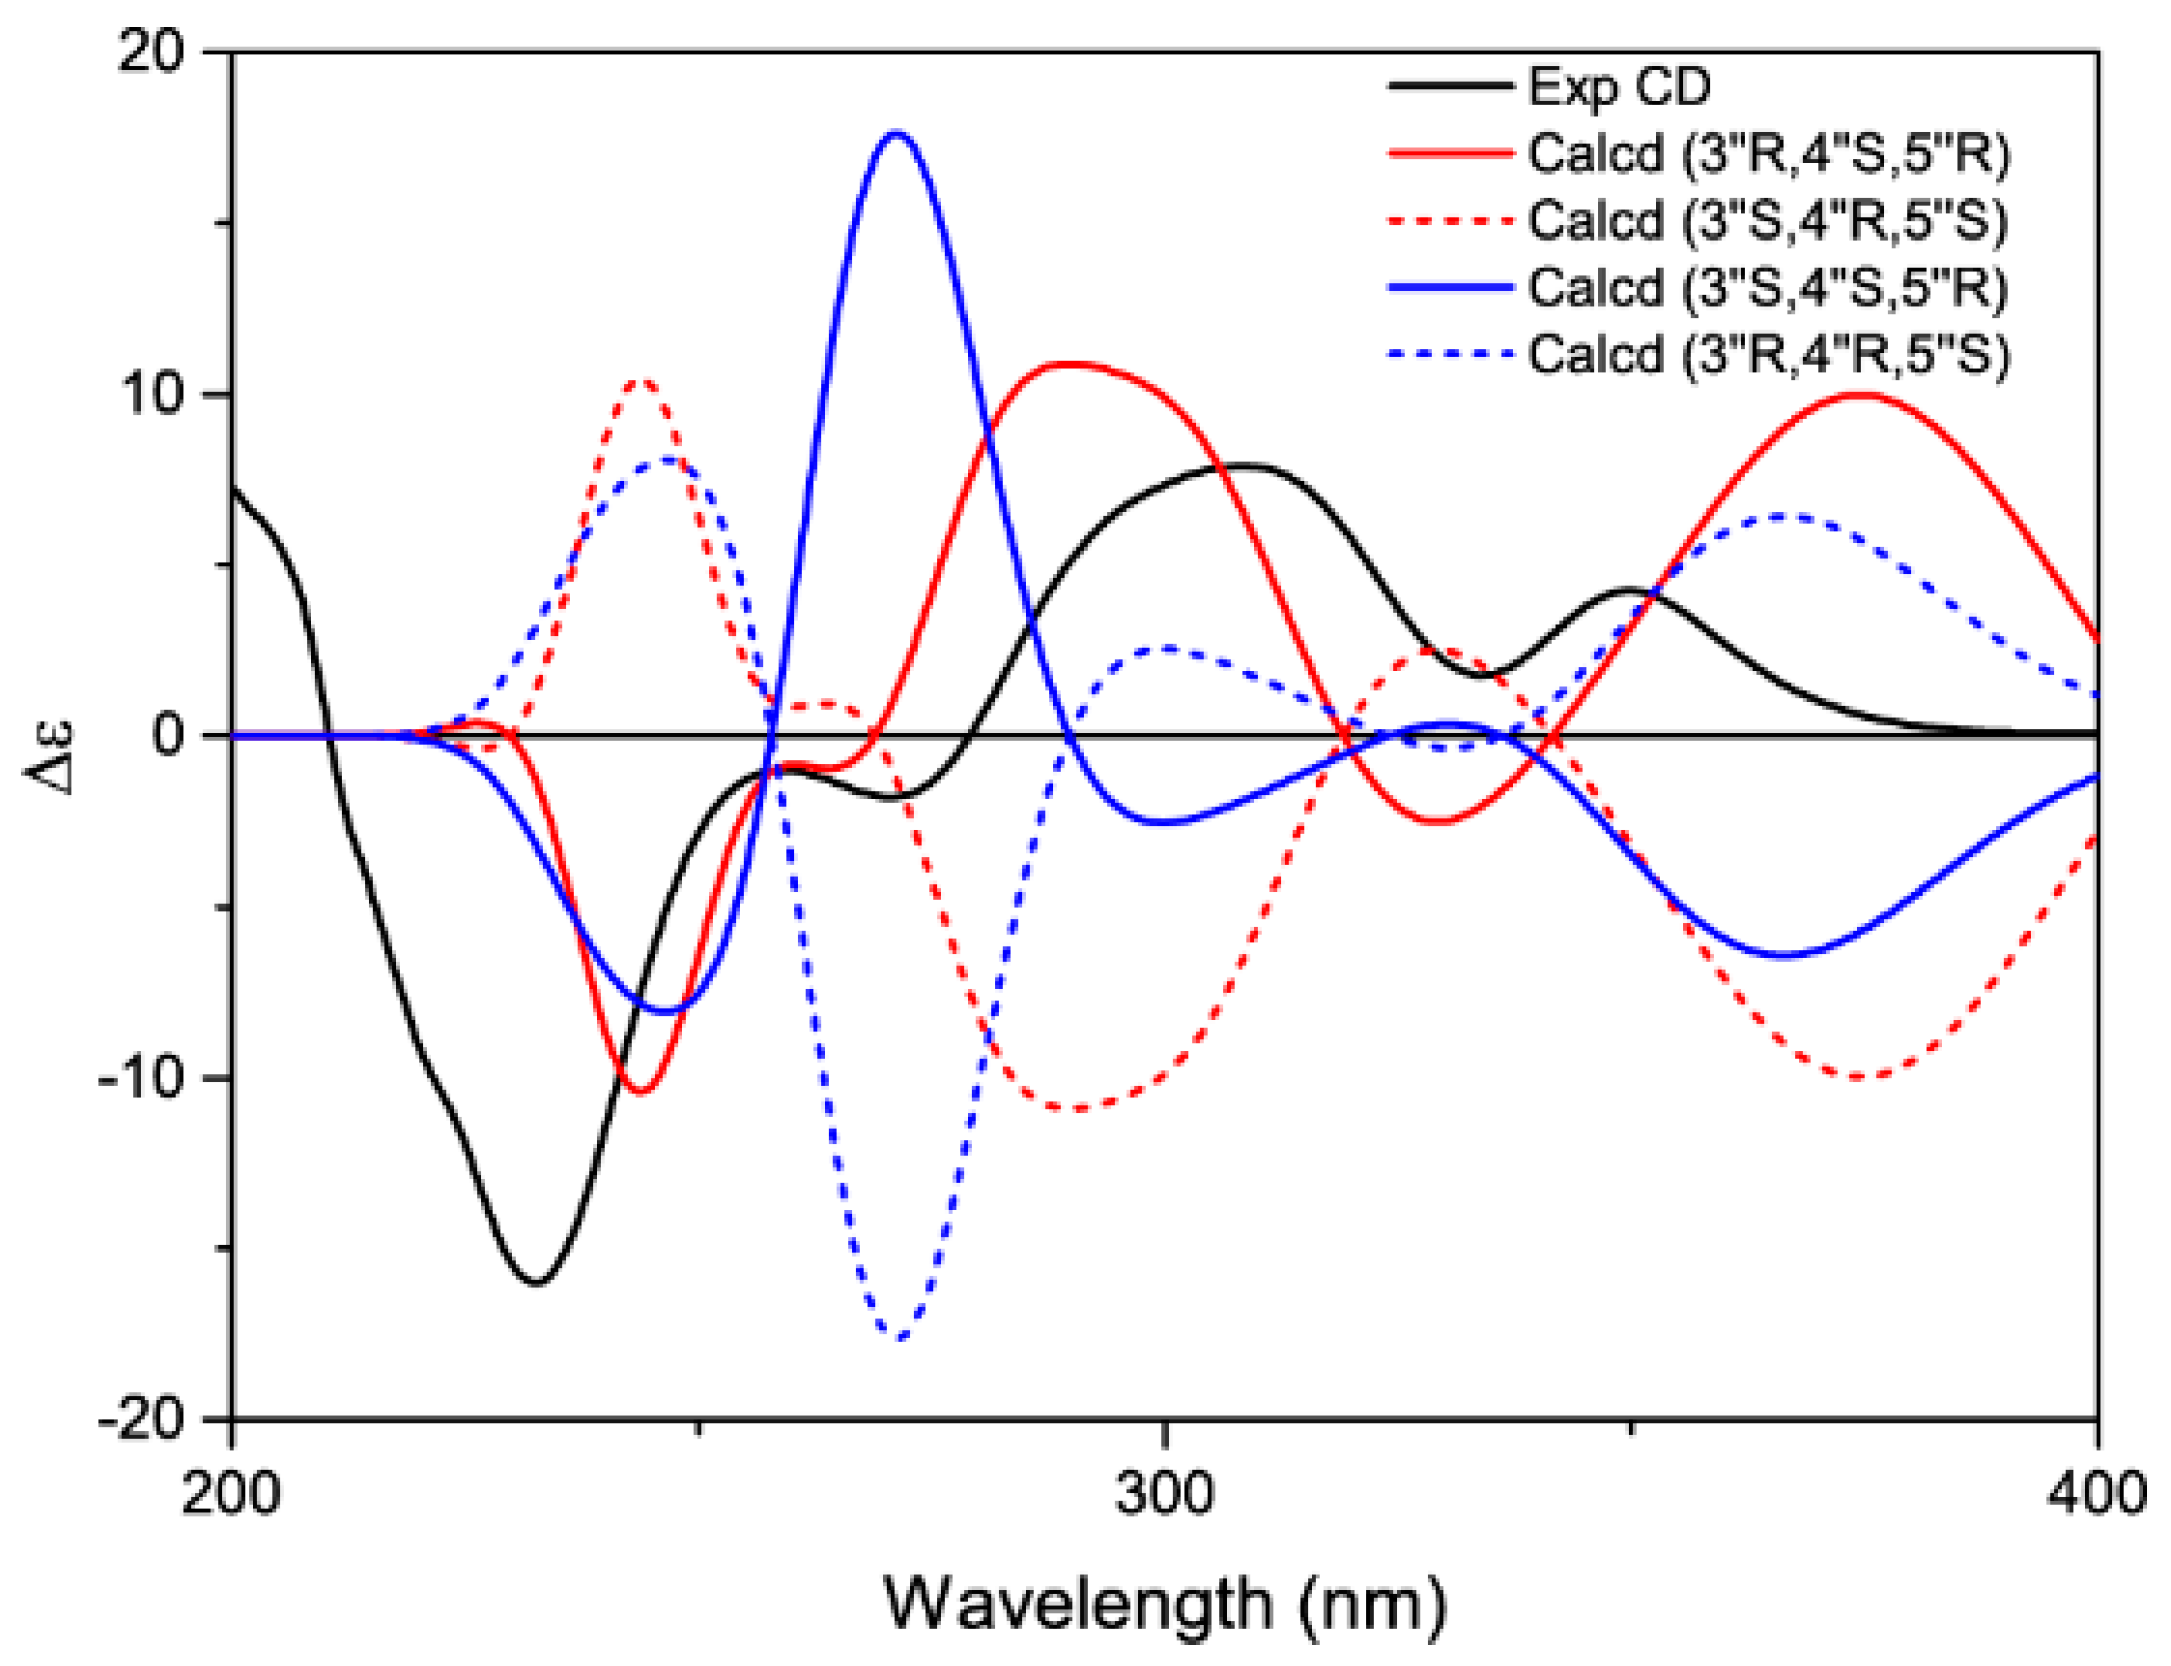
3.5. Calculation of ECD
3.6. Lipid Peroxidation Assay
4. Conclusions
Supplementary Materials
Acknowledgments
Author Contributions
Conflicts of Interest
References
- Abbas, G.M.; Abdel Bar, F.M.; Baraka, H.N.; Gohar, A.A.; Lahloub, M.F. A new antioxidant stilbene and other constituents from the stem bark of Morus nigra L. Nat. Prod. Res. 2014, 28, 952–959. [Google Scholar] [CrossRef] [PubMed]
- Ahmad, A.; Gupta, G.; Afzal, M.; Kazmi, I.; Anwar, F. Antiulcer and antioxidant activities of a new steroid from Morus alba. Life Sci. 2013, 92, 202–210. [Google Scholar] [CrossRef] [PubMed]
- Kapche, G.D.W.F.; Amadou, D.; Waffo Teguo, P.; Donfack, J.H.; Fozing, C.D.; Harakat, D.; Tchana, A.N.; Merillon, J.M.; Moundipa, P.F.; Ngadjui, B.T.; et al. Hepatoprotective and antioxidant arylbenzofurans and flavonoids from the twigs of Morus mesozygia. Planta Med. 2011, 77, 1044–1047. [Google Scholar] [CrossRef] [PubMed]
- Lim, H.J.; Jin, H.G.; Woo, E.R.; Lee, S.K.; Kim, H.P. The root barks of Morus alba and the flavonoid constituents inhibit airway inflammation. J. Ethnopharmacol. 2013, 149, 169–175. [Google Scholar] [CrossRef] [PubMed]
- Riviere, C.; Krisa, S.; Pechamat, L.; Nassra, M.; Delaunay, J.C.; Marchal, A.; Badoc, A.; Waffo-Teguo, P.; Merillon, J.M. Polyphenols from the stems of Morus alba and their inhibitory activity against nitric oxide production by lipopolysaccharide-activated microglia. Fitoterapia 2014, 97, 253–260. [Google Scholar] [CrossRef] [PubMed]
- Sohn, H.Y.; Son, K.H.; Kwon, C.S.; Kwon, G.S.; Kang, S.S. Antimicrobial and cytotoxic activity of 18 prenylated flavonoids isolated from medicinal plants: Morus alba L., Morus mongolica Schneider, Broussnetia papyrifera (L.) Vent, Sophora flavescens Ait and Echinosophora koreensis Nakai. Phytomedicine 2004, 11, 666–672. [Google Scholar] [CrossRef] [PubMed]
- Grienke, U.; Richter, M.; Walther, E.; Hoffmann, A.; Kirchmair, J.; Makarov, V.; Nietzsche, S.; Schmidtke, M.; Rollinger, J.M. Discovery of prenylated flavonoids with dual activity against influenza virus and Streptococcus pneumoniae. Sci. Rep. 2016, 6, 27156. [Google Scholar] [CrossRef] [PubMed]
- Pethakamsetty, L.; Ganapaty, S.; Bharathi, K.M. Phytochemical and antimicrobial examination of the root extracts of Morus Indica. Int. J. Pharm. Sci. Rev. Res. 2013, 21, 75–80. [Google Scholar]
- Fukai, T.; Oku, Y.; Hano, Y.; Terada, S. Antimicrobial activities of hydrophobic 2-arylbenzofurans and an isoflavone against vancomycin-resistant enterococci and methicillin-resistant Staphylococcus aureus. Planta Med. 2004, 70, 685–687. [Google Scholar] [CrossRef] [PubMed]
- Lim, S.L.; Park, S.Y.; Kang, S.; Park, D.; Kim, S.H.; Um, J.Y.; Jang, H.J.; Lee, J.H.; Jeong, C.H.; Jang, J.H.; et al. Morusin induces cell death through inactivating STAT3 signaling in prostate cancer cells. Am. J. Cancer Res. 2015, 5, 289–299. [Google Scholar] [PubMed]
- Zhu, J.J.; Yan, G.R.; Xu, Z.J.; Hu, X.; Wang, G.H.; Wang, T.; Zhu, W.L.; Hou, A.J.; Wang, H.Y. Inhibitory effects of (2′R)-2′,3′-dihydro-2′-(1-hydroxy-1-methylethyl)-2,6′-bibenzofuran-6,4′-diol on mushroom tyrosinase and melanogenesis in B16-F10 melanoma cells. Phytother. Res. 2015, 29, 1040–1045. [Google Scholar] [CrossRef] [PubMed]
- Tan, Y.X.; Liu, C.; Chen, R.Y. New 2-arylbenzofurans with selective cytotoxicity from Morus wittiorum. Phytochem. Lett. 2012, 5, 419–422. [Google Scholar] [CrossRef]
- Almeida, J.R.G.D.S.; Souza, G.R.; Araujo, E.C.D.C.; Silva, F.S.; Tolentino De Lima, J.; Ribeiro, L.A.D.A.; Nunes, X.P.; Barbosa Filho, J.M.; Junior, L.J.Q.; Viana Dos Santos, M.R. Medicinal plants and natural compounds from the genus Morus (Moraceae) with hypoglycemic activity: A review. In Glucose Tolerance; InTech: Rijeka, Croatia, 2012; pp. 189–206. [Google Scholar]
- Wang, Y.-N.; Liu, M.-F.; Hou, W.-Z.; Xu, R.-M.; Gao, J.; Lu, A.-Q.; Xie, M.-P.; Li, L.; Zhang, J.-J.; Peng, Y.; et al. Bioactive Benzofuran Derivatives from Cortex Mori Radicis, and Their Neuroprotective and Analgesic Activities Mediated by mGluR1. Molecules 2017, 22, 236. [Google Scholar] [CrossRef] [PubMed]
- Gao, L.; Han, J.; Lei, X. Enantioselective Total Syntheses of Kuwanon X, Kuwanon Y, and Kuwanol A. Org. Lett. 2016, 18, 360–363. [Google Scholar] [CrossRef] [PubMed]
- Hano, Y.; Suzuki, S.; Nomura, T.; Iitaka, Y. Absolute configuration of natural Diels-Alder type adducts from the morus root bark. Heterocycles 1988, 27, 2315–2325. [Google Scholar]
- Nomura, T.; Hano, Y.; Fukai, T. Chemistry and biosynthesis of isoprenylated flavonoids from Japanese mulberry tree. Proc. Jpn. Acad. Ser. B Phys. Biol. Sci. 2009, 85, 391–408. [Google Scholar] [CrossRef] [PubMed]
- Yang, Y.; Tan, Y.-X.; Chen, R.-Y.; Kang, J. The latest review on the polyphenols and their bioactivities of Chinese Morus plants. J. Asian Nat. Prod. Res. 2014, 16, 690–702. [Google Scholar] [CrossRef] [PubMed]
- Schümann, J.; Hertweck, C. Molecular Basis of Cytochalasan Biosynthesis in Fungi: Gene Cluster Analysis and Evidence for the Involvement of a PKS-NRPS Hybrid Synthase by RNA Silencing. J. Am. Chem. Soc. 2007, 129, 9564–9565. [Google Scholar] [CrossRef] [PubMed]
- Ward, D.A.; MacMillan, J.; Gong, F.; Phillips, A.L.; Hedden, P. Gibberellin 3-oxidases in developing embryos of the southern wild cucumber, Marah macrocarpus. Phytochemistry 2010, 71, 2010–2018. [Google Scholar] [CrossRef] [PubMed]
- Nakajima, K.; Hashimoto, T.; Yamada, Y. Two tropinone reductases with different stereospecificities are short-chain dehydrogenases evolved from a common ancestor. Proc. Natl. Acad. Sci. USA 1993, 90, 9591–9595. [Google Scholar] [CrossRef] [PubMed]
- Xiong, L.; Zhou, Q.-M.; Zou, Y.; Chen, M.-H.; Guo, L.; Hu, G.-Y.; Liu, Z.-H.; Peng, C. Leonuketal, a Spiroketal Diterpenoid from Leonurus japonicus. Org. Lett. 2015, 17, 6238–6241. [Google Scholar] [CrossRef] [PubMed]
- Markwell-Heys, A.W.; George, J.H. Some chemical speculation on the biosynthesis of corallidictyals A-D. Org. Biomol. Chem. 2016, 14, 5546–5549. [Google Scholar] [CrossRef] [PubMed]
Sample Availability: Samples of the compounds 1, 1a, and 1b are available from the authors. |

| Position | 1 | 1a | 1b | |||
|---|---|---|---|---|---|---|
| δH | δC † | δH | δC ‡ | δH | δC † | |
| 1 | 115.2 | 118.2 | 118.4 | |||
| 2 | 156.0 | 156.8 | 158.4 | |||
| 3 | 6.30 s | 102.5 | 6.57 d (2.2) | 98.4 | 6.51 s c | 98.7 |
| 4 | 158.1 | 160.4 | 161.1 | |||
| 5 | 6.23 d (8.4) a | 107.1 | 6.54 dd (8.8, 2.2) | 105.6 | 6.50 d (8.4) c | 106.2 |
| 6 | 7.30 d (8.4) | 127.2 | 7.49 d (8.8) | 127.6 | 7.45 d (8.4) | 128.3 |
| α | 7.09 d (16.2) | 123.1 | 7.16 d (16.5) | 123.1 | 7.15 d (16.8) | 124.6 |
| β | 6.74 d (16.2) | 124.7 | 6.91 d (16.5) | 127.0 | 6.89 d (16.8) | 126.6 |
| 1′ | 139.3 | 139.3 | 141.8 | |||
| 2′ | 6.16 s | 105.7 | 6.42 s b | 101.1 | 6.56 s | 104.5 |
| 3′ | 154.2 | 157.7 | 155.7 | |||
| 4′ | 110.7 | 110.7 | 110.7 | |||
| 5′ | 159.2 | 157.8 | 161.8 | |||
| 6′ | 6.44 s | 98.8 | 6.41 s | 101.7 | 6.36 s | 100.1 |
| 1″ | 74.4 | 75.9 | 76.4 | |||
| 2″ | 109.1 | 193.6 | 148.0 | |||
| 3″ | 3.17 s | 47.3 | 127.7 | 122.4 | ||
| 4″ | 91.4 | 160.4 | 99.4 | |||
| 5″ | 2.66 brs | 36.6 | 3.84 t (3.0) | 33.7 | N.D. | 33.9 |
| 6″ | 2.51 d (13.8) * 1.77 dd (13.8, 3.0) | 30.1 | 2.65 dd (13.3, 3.0) 2.23 dd (13.3, 3.0) | 35.6 | 2.28 dd (13.5, 1.2) 1.87 dd (13.5, 4.2) | 31.3 |
| 7″ | 1.61 s | 22.1 | 1.57 s | 22.7 | 1.57 s | 23.2 |
| 8″ | 194.9 | 193.0 | 202.1 | |||
| 9″ | 112.8 | 119.4 | 120.7 | |||
| 10″ | 166.2 | 159.7 | 159.6 | |||
| 11″ | 6.09 s | 97.6 | 6.39 d (1.9) | 97.5 | 6.62 d (2.1) | 99.0 |
| 12″ | 171.6 | 164.2 | 163.6 | |||
| 13″ | 6.48 d (8.7) | 111.4 | 6.33 dd (8.8, 1.9) | 105.3 | 6.50 dd (8.7, 2.1) c | 105.8 |
| 14″ | 7.44 d (8.7) | 125.7 | 7.04 d (8.8) | 131.3 | 7.24 d (8.7) | 131.5 |
| 15″ | 107.9 | 115.1 | 112.9 | |||
| 16″ | 154.6 | 153.8 | 154.9 | |||
| 17″ | 6.23 s a | 106.5 | 6.47 d (2.4) | 101.4 | 6.27 d (2.4) | 101.5 |
| 18″ | 157.7 | 160.2 | 160.0 | |||
| 19″ | 6.22 d (9.0) a | 101.9 | 6.43 dd (8.4, 2.4) b | 106.7 | 6.43 dd (8.4, 2.4) | 106.9 |
| 20″ | 6.51 d (9.0) | 133.3 | 6.97 d (8.4) | 129.5 | 7.12 d (8.4) | 133.0 |
© 2018 by the authors. Licensee MDPI, Basel, Switzerland. This article is an open access article distributed under the terms and conditions of the Creative Commons Attribution (CC BY) license (http://creativecommons.org/licenses/by/4.0/).
Share and Cite
Lu, A.-Q.; Chen, M.-H.; Gao, J.; Wang, L.; Yang, H.-Y.; Li, L.; Zhang, B.; He, H.-K.; Wang, S.-J. A Tri-O-Bridged Diels-Alder Adduct from Cortex Mori Radicis. Molecules 2018, 23, 133. https://doi.org/10.3390/molecules23010133
Lu A-Q, Chen M-H, Gao J, Wang L, Yang H-Y, Li L, Zhang B, He H-K, Wang S-J. A Tri-O-Bridged Diels-Alder Adduct from Cortex Mori Radicis. Molecules. 2018; 23(1):133. https://doi.org/10.3390/molecules23010133
Chicago/Turabian StyleLu, An-Qi, Ming-Hua Chen, Jie Gao, Lu Wang, Han-Yu Yang, Lan Li, Bo Zhang, Hao-Ke He, and Su-Juan Wang. 2018. "A Tri-O-Bridged Diels-Alder Adduct from Cortex Mori Radicis" Molecules 23, no. 1: 133. https://doi.org/10.3390/molecules23010133
APA StyleLu, A.-Q., Chen, M.-H., Gao, J., Wang, L., Yang, H.-Y., Li, L., Zhang, B., He, H.-K., & Wang, S.-J. (2018). A Tri-O-Bridged Diels-Alder Adduct from Cortex Mori Radicis. Molecules, 23(1), 133. https://doi.org/10.3390/molecules23010133