Simultaneous Determination of Seven Anthraquinone Aglycones of Crude and Processed Semen Cassiae Extracts in Rat Plasma by UPLC–MS/MS and Its Application to a Comparative Pharmacokinetic Study

Abstract
:
1. Introduction
2. Results
2.1. Method Validation
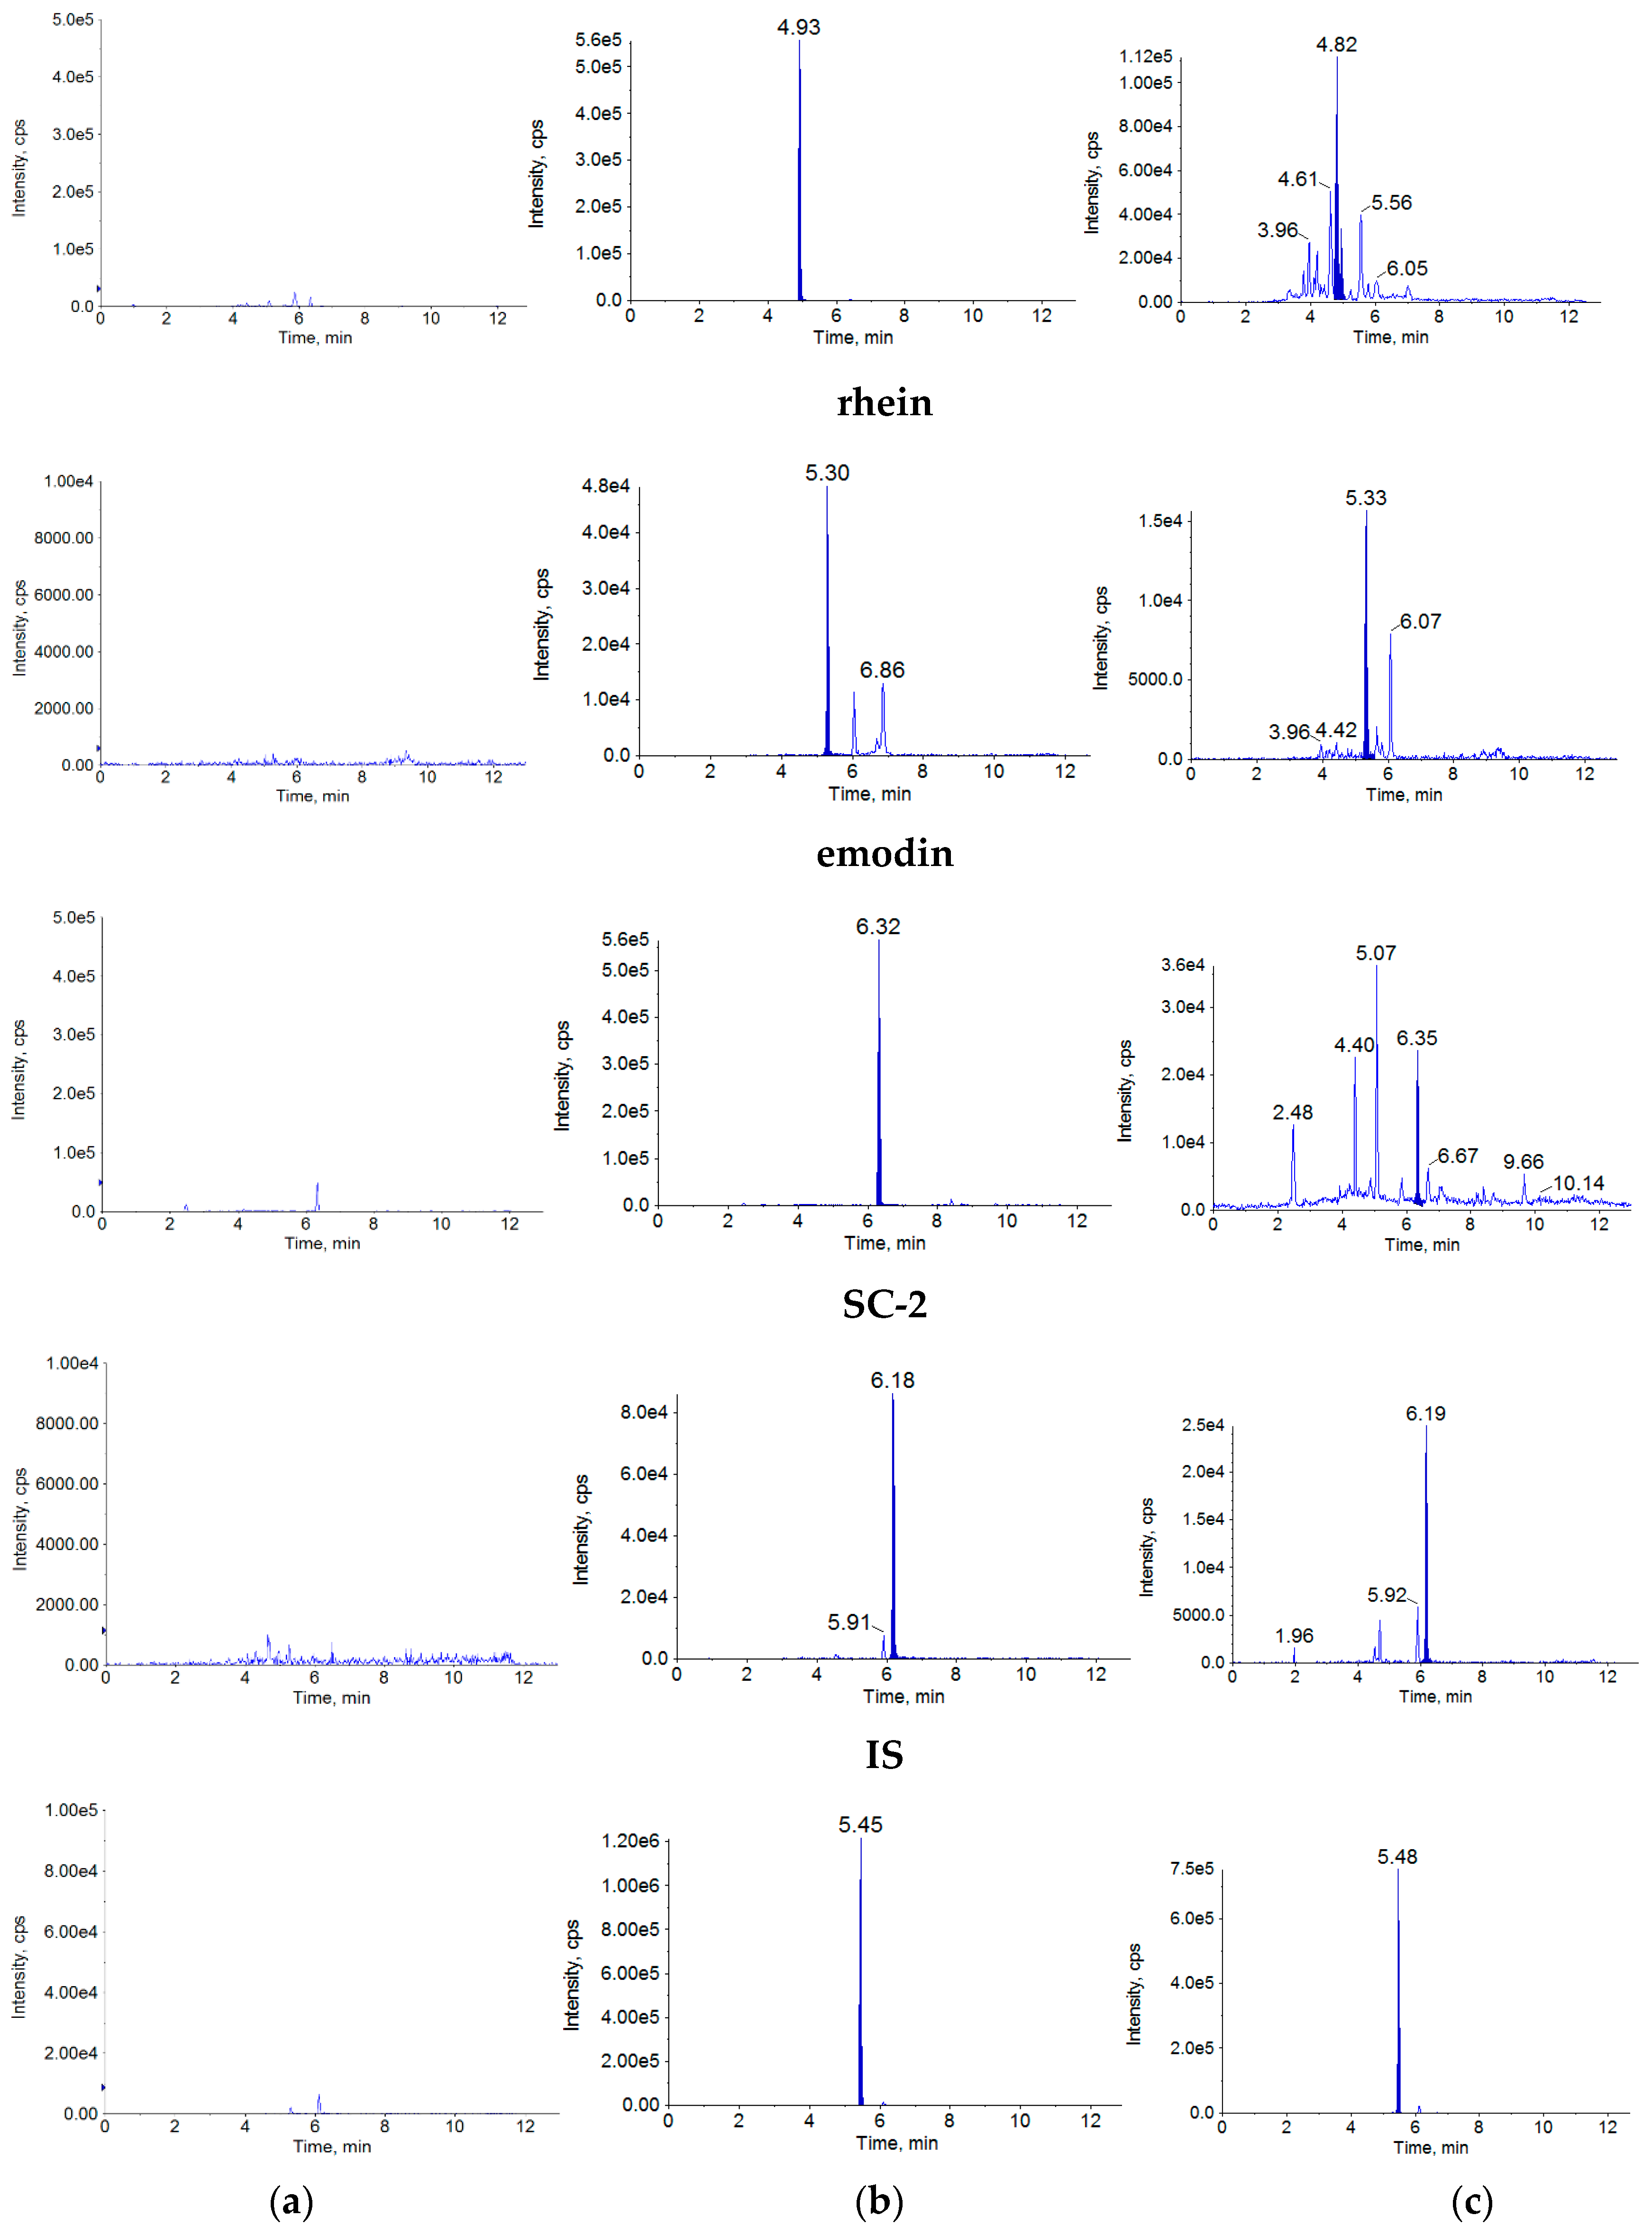
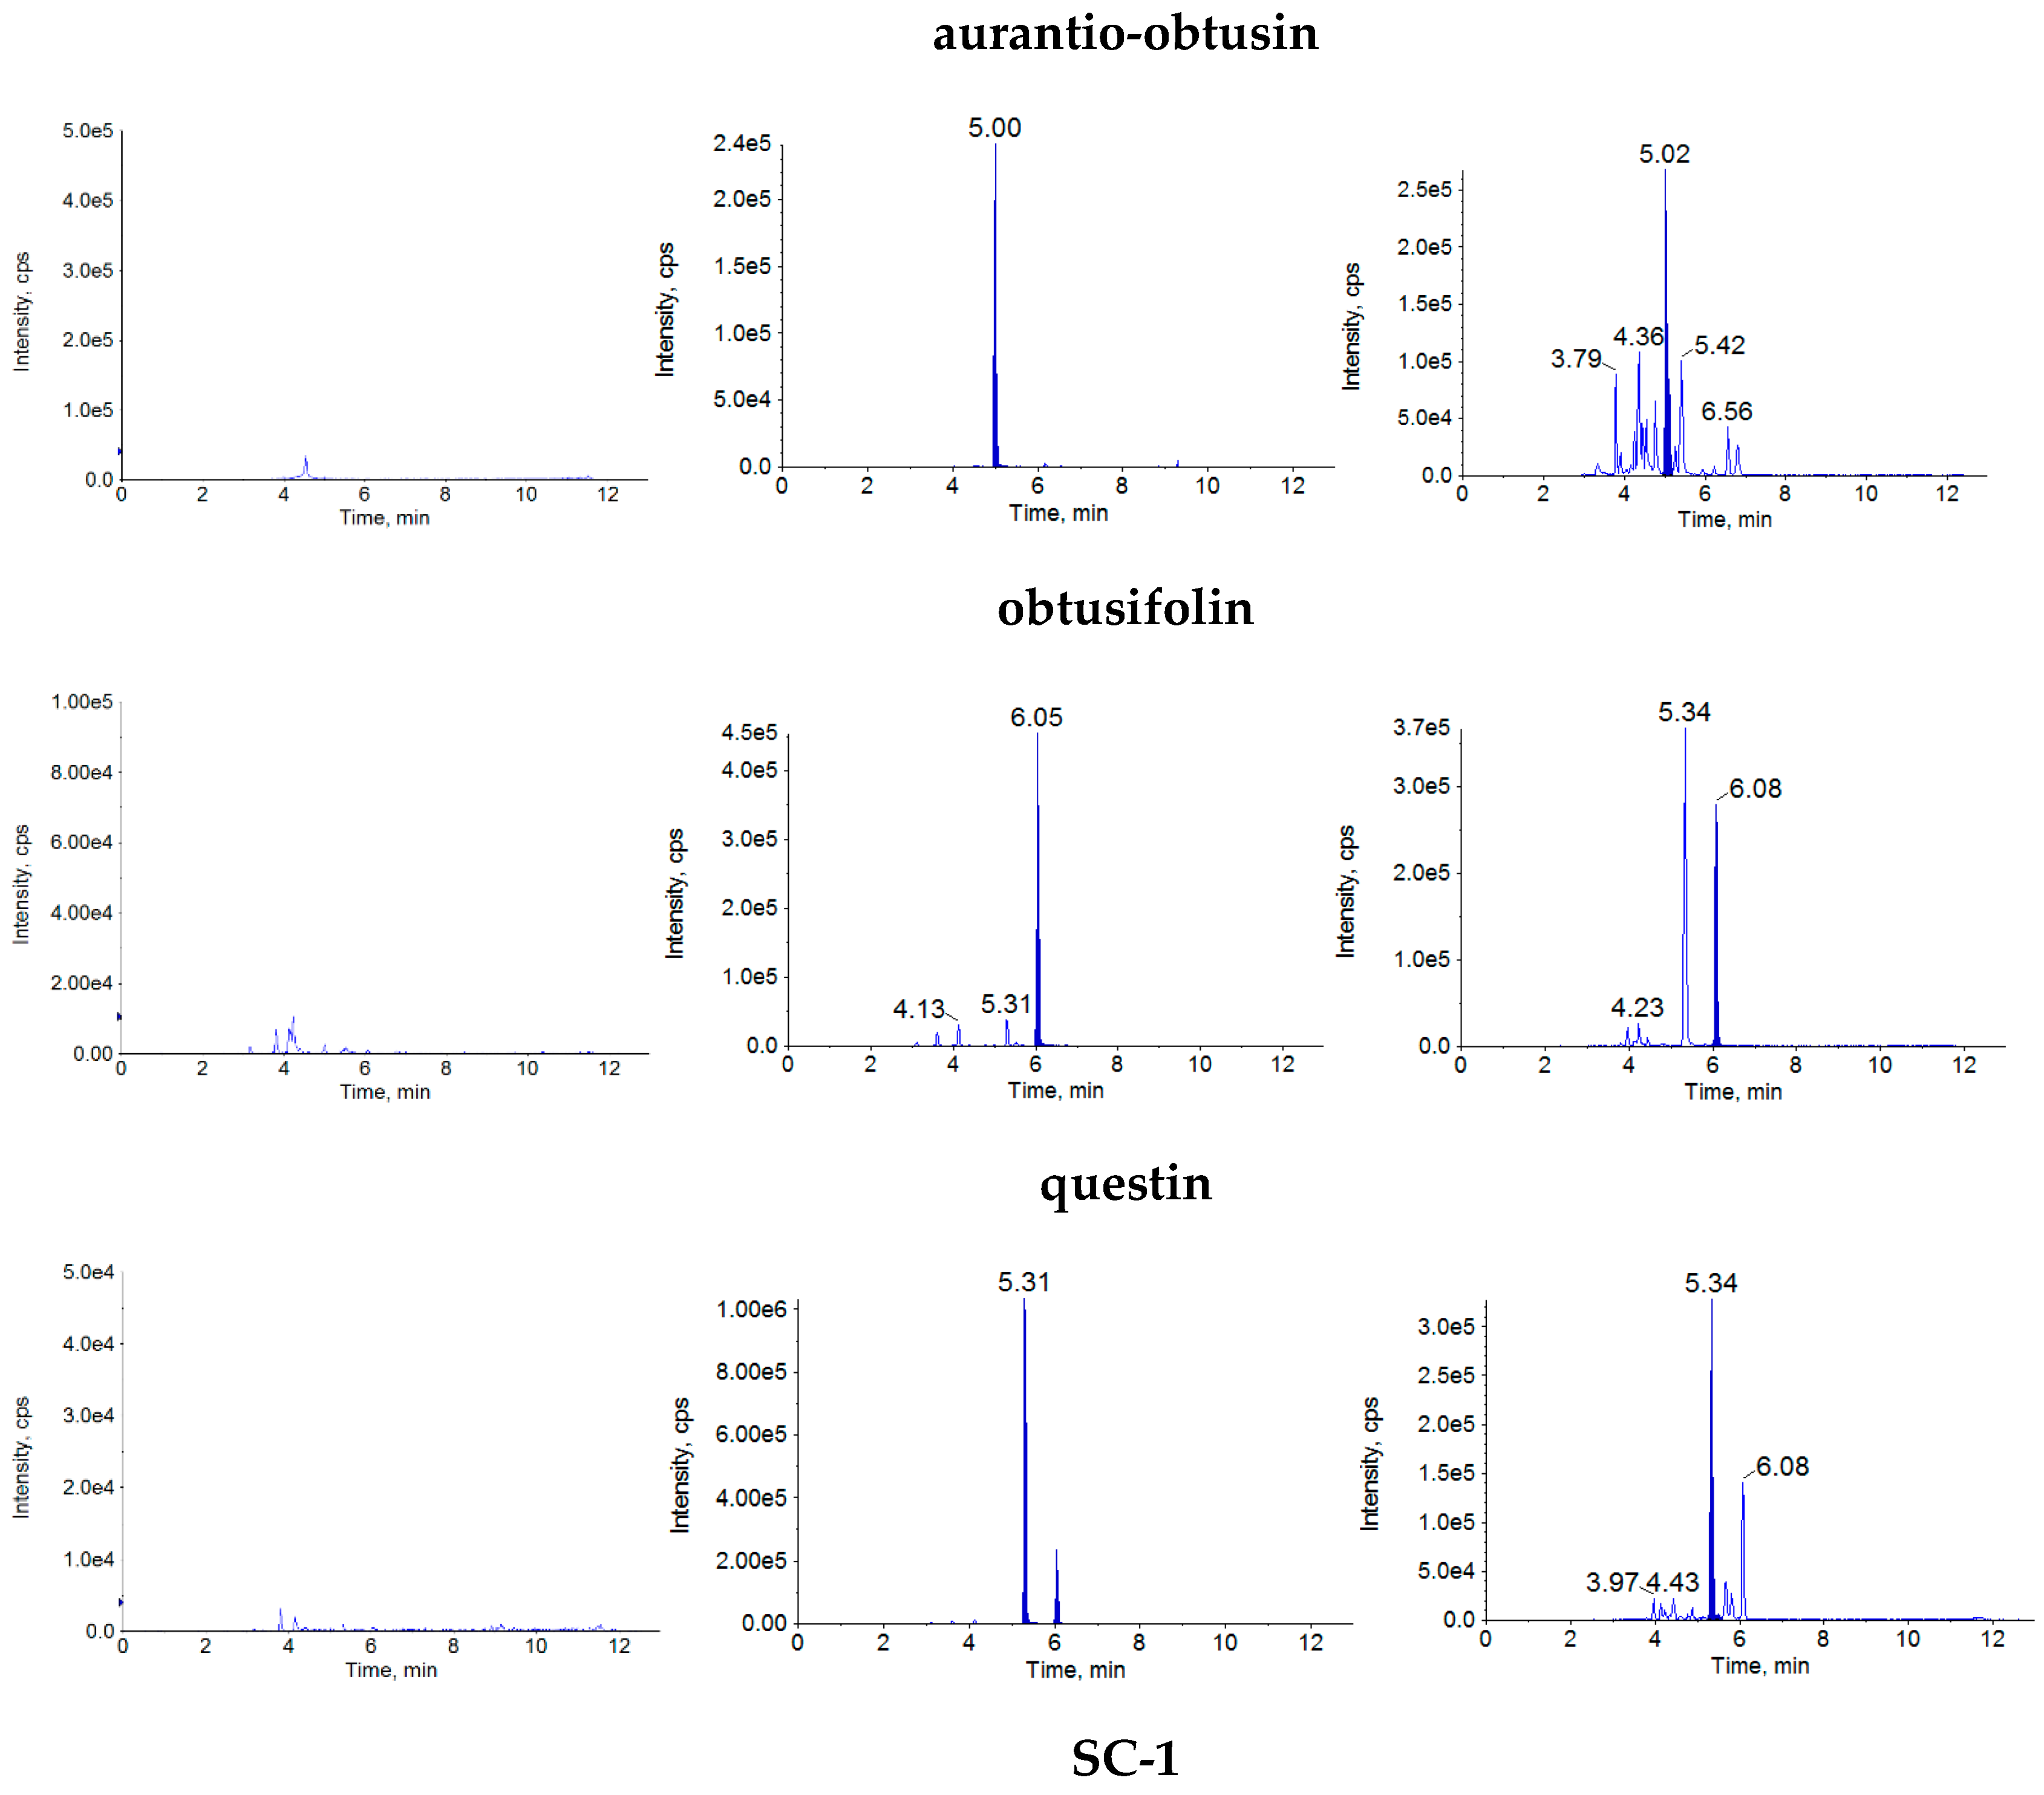
2.1.1. Specificity
2.1.2. Linearity and LLOQ
2.1.3. Precision and Accuracy
2.1.4. Recovery and Matrix Effect
2.1.5. Stability Experiments
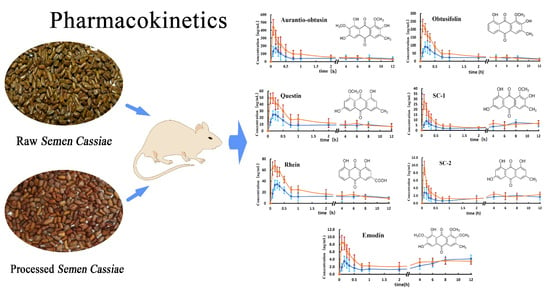
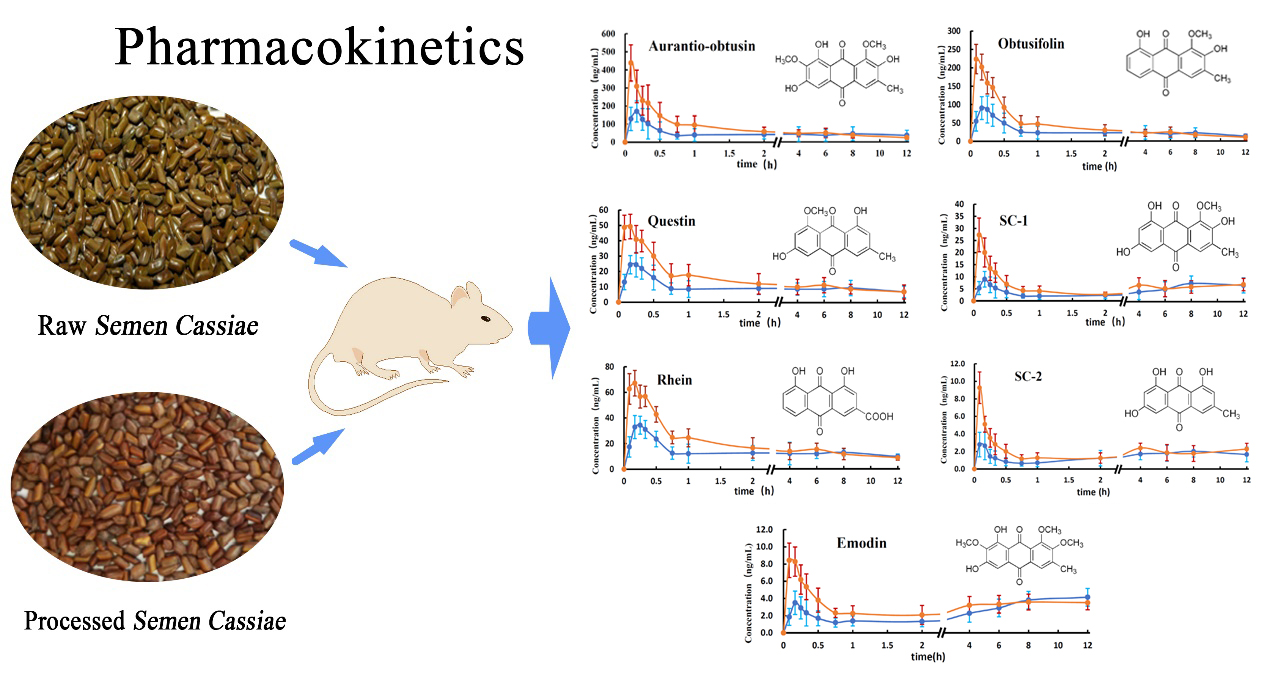
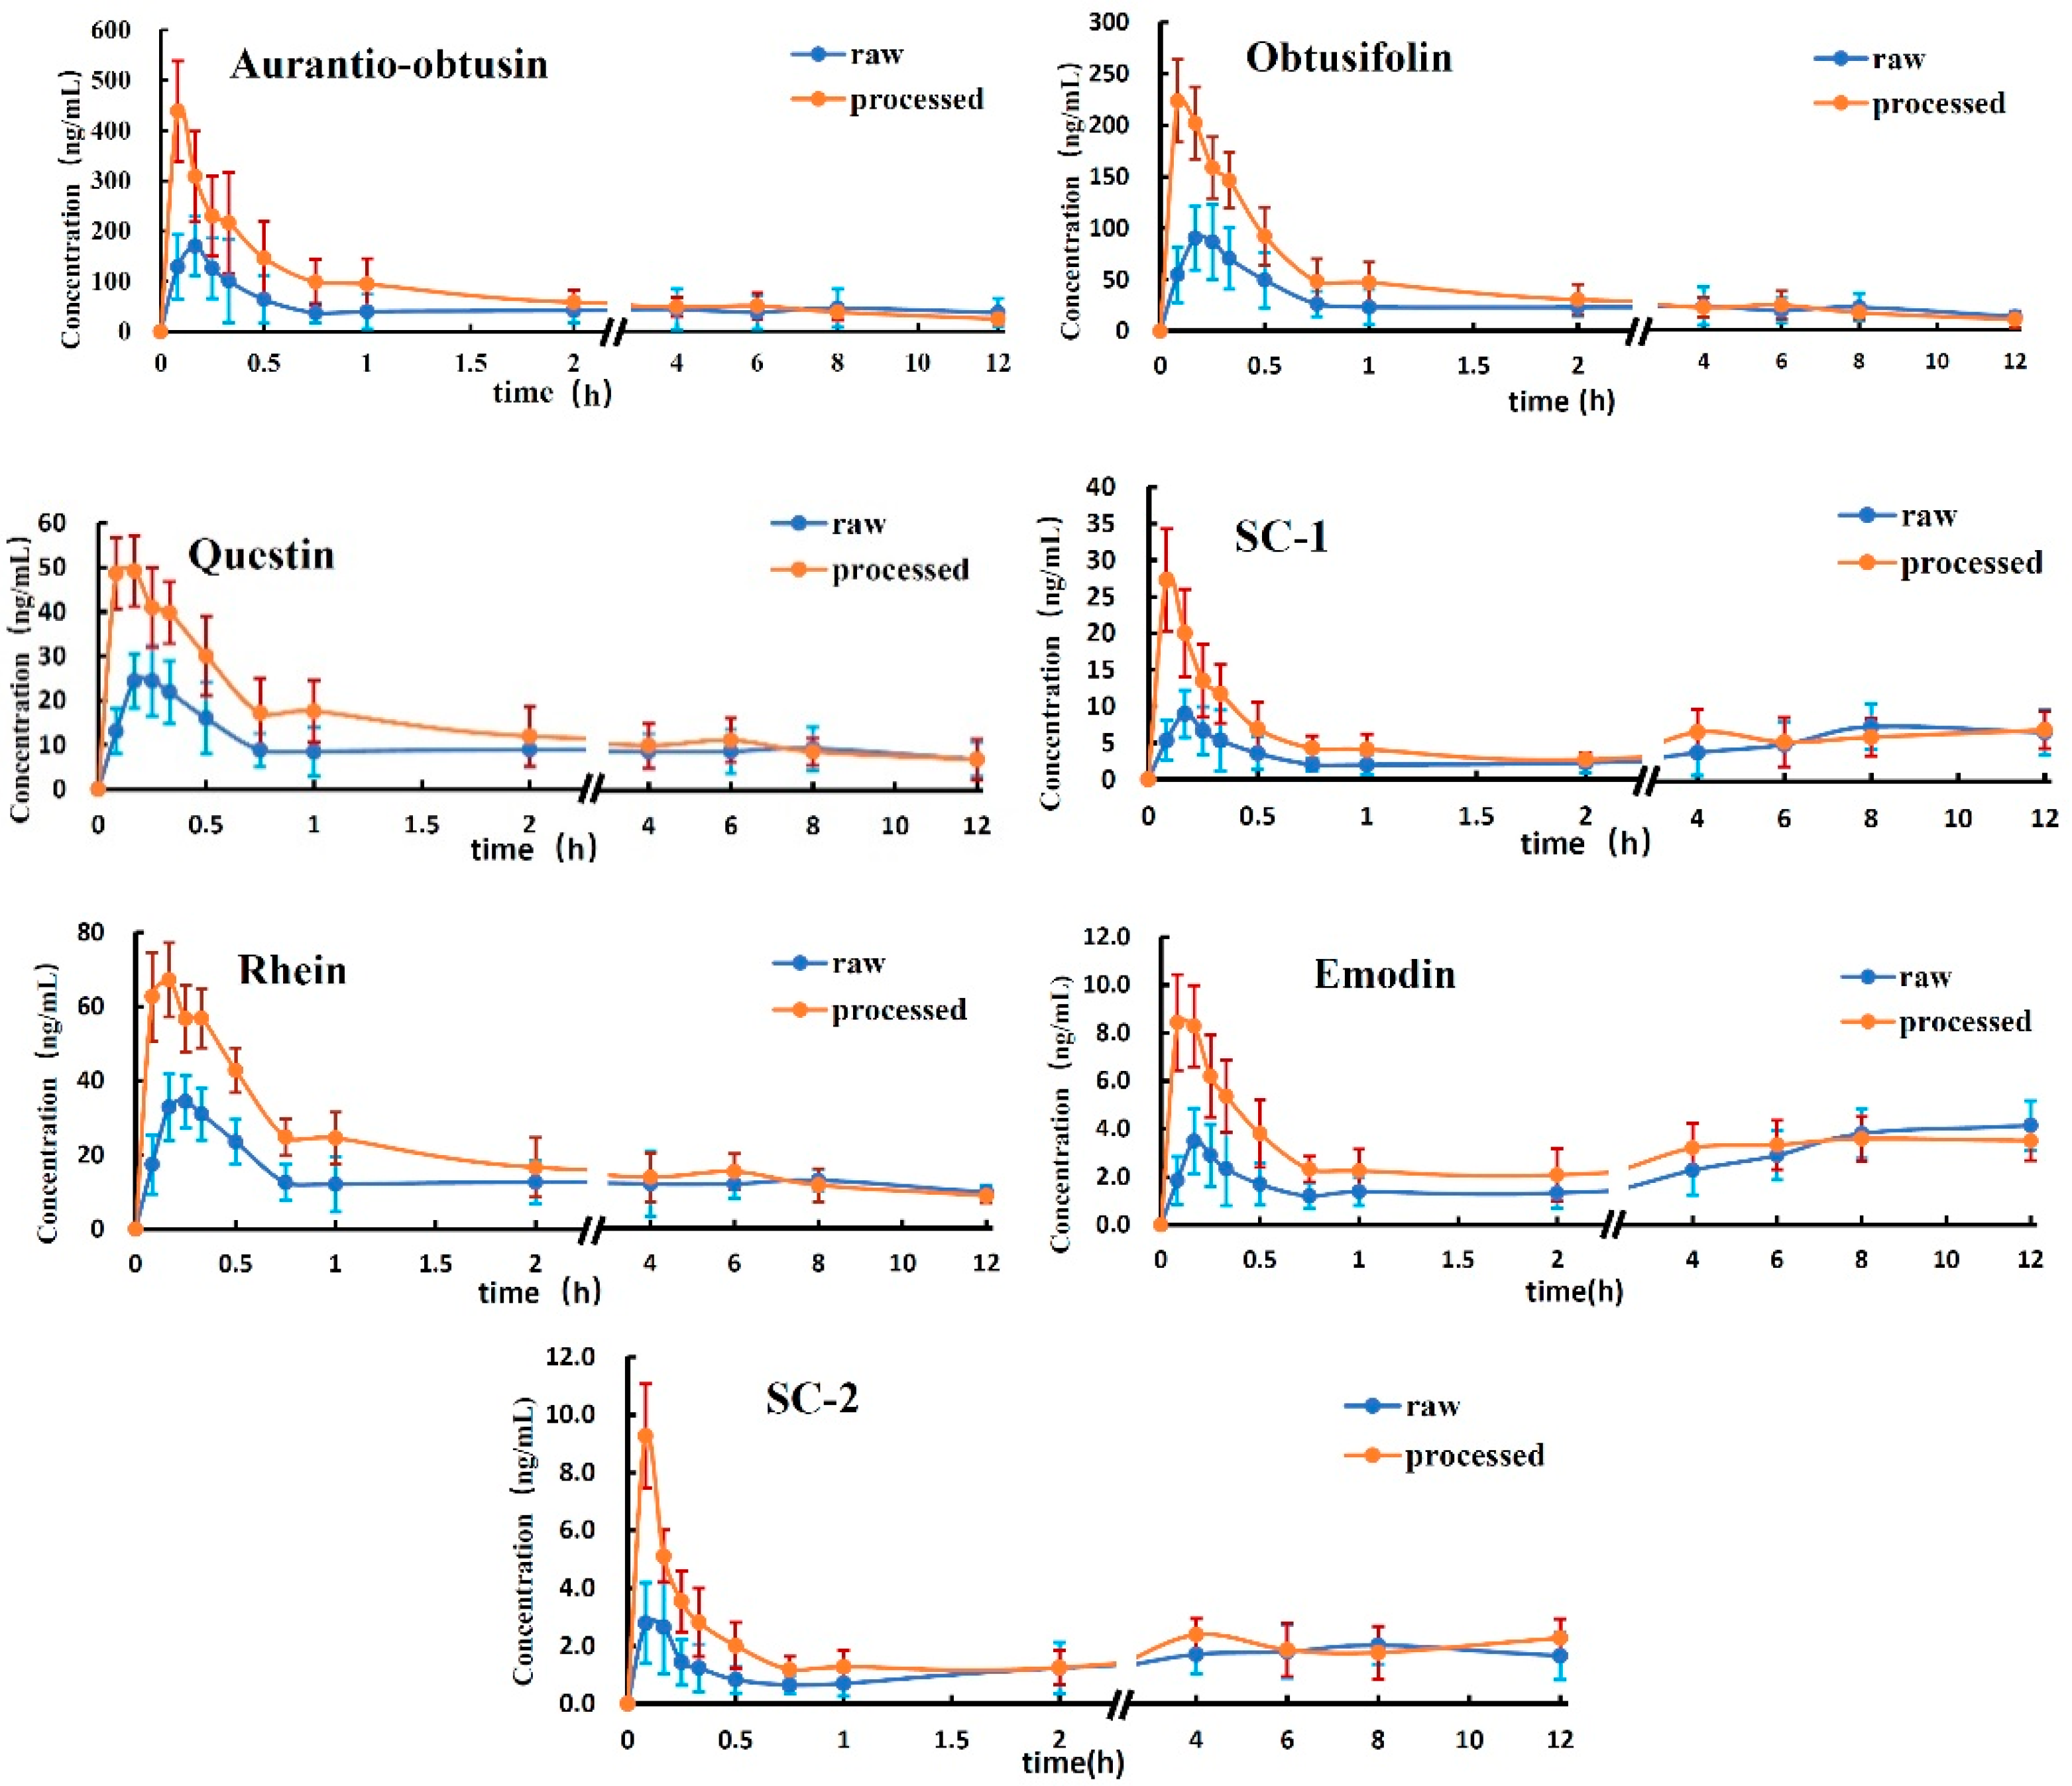
2.2. Application to the Pharmacokinetic Study
3. Discussion
3.1. Dosage of the Seven Analytes
3.2. Analysis of Analytes Concentration in the Plasma
3.3. Analysis of the Mean AUC
3.4. Analysis of Tmax and MRT0-12
4. Materials and Methods
4.1. Chemicals and Reagents
4.2. Instrument and Analytical Conditions
4.3. Preparation of the R-SC and P-SC Extracts
4.4. Preparation of Combined Standard Stock Solution and IS Solution
4.5. Preparation of Calibration Standard and Quality Control (QC) Samples
4.6. Plasma Samples Preparation
4.7. Method Validation
4.7.1. Specificity
4.7.2. Linearity and LLOQ
4.7.3. Precision and Accuracy
4.7.4. Recovery and Matrix Effect
4.7.5. Stability Experiments
4.8. Application of Method and Pharmacokinetic Study
4.9. Assay Application and Statistical Methods
5. Conclusions
Acknowledgments
Author Contributions
Conflicts of Interest
References
- Luo, Z.Y. Yizong Cuiyan, 1st ed.; Xinwenxue Publishing Company: Beijing, China, 1982; p. 20. [Google Scholar]
- Huang, J. Shennong Bencao Jing, 1st ed.; Chinese Ancient Books Publishing House: Beijing, China, 1982; p. 41. ISBN 14249-0021. [Google Scholar]
- Chidume, F.C.; Kwanashie, H.O.; Adekeye, J.O.; Wambebe, C.; Gamaniel, K.S. Antinociceptive and Smooth Muscle Contracting Activities of the Methanolic Extract of Cassia tora Leaf. J. Ethnopharmacol. 2002, 81, 205–209. [Google Scholar] [CrossRef]
- Wu, C.H.; Yen, G.C. Antigenotoxic Properties of Cassia Tea (Cassia tora L.): Mechanism of Action and the Influence of Roasting Process. Life Sci. 2004, 76, 85–101. [Google Scholar] [CrossRef] [PubMed]
- Cherng, J.M.; Chiang, W.; Wang, J.H.; Lin, C.M.; Lee, C.Y.; Shih, C.M.; Chiang, L.C. Anthraquinones of Edible Wild Vegetable Cassia tora Stimulate Proliferation of Human CD4+ T Lymphocytes and Secretion of Interferon-Gamma or Interleukin 10. Food Chem. 2008, 107, 1576–1580. [Google Scholar] [CrossRef]
- Wong, S.M.; Wagner, H.; Benze, S.; Antus, S. Hepato-Protective Activities of Coumestans, Anthraquinones, Naphthopyrone Glycosides, and Iridoid Glycosides. Planta Medica 1988, 54, 566. [Google Scholar] [CrossRef] [PubMed]
- Liu, C.J.; Liu, Q.; Sun, J.D.; Jiang, B.; Yan, J.F. Extraction of Water-Soluble Polysaccharide and the Antioxidant Activity from Semen cassiae. J. Food Drug Anal. 2014, 22, 492–499. [Google Scholar] [CrossRef] [PubMed]
- Zeng, H.L.; Liu, Q.; Wang, M.L.; Jiang, S.J.; Zhang, L.; He, X.; Wang, J.; Chen, X.Q. Target-Guided Separation of Antioxidants from Semen cassia via Off-Line Two-Dimensional High-Speed Counter-Current Chromatography Combined with Complexation and Extrusion Elution Mode. J. Chromatogr. B 2015, 1001, 58–65. [Google Scholar] [CrossRef] [PubMed]
- Ju, M.S.; Kim, H.G.; Choi, J.G.; Ryu, J.H.; Hur, J.; Kim, Y.J.; Oh, M.S. Cassiae semen, a seed of Cassia obtusifolia, has neuroprotective effects in Parkinson’s disease models. Food Chem. Toxicol. 2010, 48, 2037–2044. [Google Scholar] [CrossRef] [PubMed]
- Jung, H.A.; Ali, M.Y.; Jung, H.J.; Jeong, H.O.; Chung, H.Y.; Choi, J.S. Inhibitory activities of major anthraquinones and other constituents from Cassia obtusifolia against β-secretase and cholinesterases. J. Ethnopharmacol. 2016, 191, 152–160. [Google Scholar] [CrossRef] [PubMed]
- Yi, J.H.; Park, H.J.; Lee, S.; Jung, J.W.; Kim, B.C.; Lee, Y.C.; Ryu, J.H.; Kim, D.H. Cassia obtusifolia seed ameliorates amyloid β-induced synaptic dysfunction through anti-inflammatory and Akt/GSK-3β pathways. J. Ethnopharmacol. 2016, 178, 50–57. [Google Scholar] [CrossRef] [PubMed]
- Jung, D.H.; Kim, Y.S.; Kim, N.H.; Lee, J.; Jang, D.S.; Kim, J.S. Extract of Cassiae Semen and Its Major Compound Inhibit S100b-Induced TGF-β1 and Fibronectin Expression in Mouse Glomerular Mesangial Cells. Eur. J. Pharmacol. 2010, 641, 7–14. [Google Scholar] [CrossRef] [PubMed]
- Wang, H.Y. Taiping Shenghui Fang, 1st ed.; People’s Medical Publishing House: Beijing, China, 1958; p. 901. ISBN 140481285. [Google Scholar]
- Zhang, Q.W.; Yin, J. Historical Evolution of Processed Semen Cassiae. Chin. Tradit. Patent Med. 1996, 18, 23–24. [Google Scholar]
- Gao, Q.; Xu, H.Q.; Chen, J.W.; Zhang, J. Liver-Protective and Bowel-Lubricating and Defecation-Promoting Effects of Crude and Processed Semen Cassiae. Tradit. Chin. Drug Res. Clin. Pharmacol. 2007, 18, 194–196. [Google Scholar]
- Xu, L.J.; Chan, C.O.; Lau, C.C.; Yu, Z.L.; Mok, D.K.W.; Chen, S.B. Simultaneous Determination of Eight Anthraquinones in Semen Cassiae by HPLC-DAD. Phytochem. Anal. 2012, 23, 110–116. [Google Scholar] [CrossRef] [PubMed]
- Zhang, W.D.; Wang, Y.; Wang, Q.; Yang, W.J.; Gu, Y.; Wang, R.; Song, X.M.; Wang, X.J. Quality Evaluation of Semen Cassiae (Cassia obtusifolia L.) by Using Ultra-High Performance Liquid Chromatography Coupled with Mass Spectrometry. J. Sep. Sci. 2012, 35, 2054–2062. [Google Scholar] [CrossRef] [PubMed]
- Tang, L.Y.; Xu, Y.L.; Zhou, X.D.; Zhou, G.H.; Kou, Z.Z.; Wang, T.; Wang, Z.J. Effect of Processing on Naphthopyrone Glycosides and Anthraquinone Aglycone in Semen Cassiae. Chin. J. Exp. Tradit. Med. Formulae 2015, 21, 69–72. [Google Scholar]
- Zhang, W.D.; Wang, P.Y.; Wang, Y.; Wang, Q.; Gu, Y.; Cao, J.; Wang, S.Q.; Wang, X.J. Simultaneous Determination of Aurantio-Obtusin, Chrysoobtusin, Obtusin and 1-Desmethylobtusin in Rat Plasma by UHPLC-MS/MS. Biomed. Chromatogr. 2014, 28, 369–374. [Google Scholar] [CrossRef] [PubMed]
- Yang, C.J.; Wang, S.H.; Guo, X.W.; Sun, J.H.; Liu, L.; Wu, L.J. Simultaneous Determination of Seven anthraquinoNes in Rat Plasma by Ultra High Performance Liquid Chromatography–Tandem Mass Spectrometry and Pharmacokinetic Study after Oral Administration of Semen Cassiae Extract. J. Ethnopharmacol. 2015, 169, 305–313. [Google Scholar] [CrossRef] [PubMed]
- Zhang, L.; Ma, W.F.; Li, J.; He, J.; Zhang, P.; Zheng, F.; Zhang, B.L.; Gao, X.M.; Chang, Y.X. Influence of Processing on Pharmacokinetic of Typical Constituents in Radix Polygoni Multiflori after Oral Administration by LC–ESI–MS/MS. J. Ethnopharmacol. 2013, 148, 246–253. [Google Scholar] [CrossRef] [PubMed]
- Tang, L.Y.; Wang, Z.J.; Fu, M.H.; Fang, J.; Wu, H.W.; Huang, L.Q. Study of Free Anthraquinones in Semen Cassiae. J. Chin. Med. Mater. 2009, 32, 717–719. [Google Scholar]
- Xu, Y.L.; Tang, L.Y.; Zhou, X.D.; Zhou, G.H.; Wang, Z.J. Five New Anthraquinones from Cassia obtusifolia. Arch. Pharm. Res. 2005, 38, 1054–1058. [Google Scholar] [CrossRef] [PubMed]
Sample Availability: Not available. |


| Compounds | Regression Equation | r | Linear Range (ng/mL) | LLOQ (ng/mL) |
|---|---|---|---|---|
| aurantio-obtusin | y = 0.02099x + 0.00298 | 0.9976 | 0.94–564.0 | 0.94 |
| obtusifolin | y = 0.04153x + 0.00092 | 0.9990 | 1.03–410.0 | 1.03 |
| questin | y = 0.10900x + 0.00108 | 0.9997 | 0.84–84.0 | 0.84 |
| SC-1 | y = 0.04423x + 0.00072 | 0.9996 | 1.03–82.80 | 1.03 |
| rhein | y = 0.00330x + 0.00147 | 0.9969 | 1.07–203.0 | 1.07 |
| emodin | y = 0.05259x + 0.00383 | 0.9989 | 1.03–207.0 | 1.03 |
| SC-2 | y = 0.01045x + 0.00036 | 0.9964 | 0.90–180.0 | 0.90 |
| Compounds | Concentration (ng/mL) | Intra-Day | Inter-Day | ||
|---|---|---|---|---|---|
| Accuracy (%) | RSD (%) | Accuracy (%) | RSD (%) | ||
| aurantio-obtusin | 1.88 | 103.20 | 5.68 | 95.99 | 7.40 |
| 18.8 | 99.86 | 2.72 | 103.38 | 5.66 | |
| 94 | 96.77 | 4.70 | 100.18 | 3.42 | |
| obtusifolin | 2.05 | 96.76 | 6.96 | 103.27 | 6.97 |
| 20.5 | 98.17 | 3.25 | 99.56 | 4.53 | |
| 103 | 100.37 | 2.65 | 103.90 | 7.32 | |
| questin | 1.68 | 101.10 | 3.43 | 98.05 | 5.90 |
| 16.8 | 99.99 | 4.91 | 103.51 | 4.83 | |
| 84 | 102.19 | 3.73 | 104.96 | 5.47 | |
| SC-1 | 2.07 | 96.29 | 4.65 | 101.74 | 5.33 |
| 20.7 | 98.47 | 3.45 | 104.94 | 7.92 | |
| 103 | 99.93 | 4.98 | 97.02 | 4.01 | |
| rhein | 2.13 | 104.69 | 5.25 | 103.45 | 7.74 |
| 21.3 | 98.97 | 3.48 | 97.46 | 6.38 | |
| 107 | 101.57 | 3.83 | 102.89 | 4.68 | |
| emodin | 2.07 | 105.60 | 4.96 | 104.16 | 3.97 |
| 20.7 | 102.76 | 2.67 | 97.95 | 5.36 | |
| 103 | 104.62 | 4.82 | 95.52 | 8.65 | |
| SC-2 | 1.80 | 95.65 | 5.74 | 101.08 | 3.50 |
| 18 | 98.65 | 3.56 | 97.13 | 3.16 | |
| 90 | 103.43 | 7.33 | 104.35 | 6.49 | |
| Compounds | Concentration (ng/mL) | Recovery (%) | Matrix Effects (%) | ||
|---|---|---|---|---|---|
| Mean (%) | RSD (%) | Mean (%) | RSD (%) | ||
| aurantio-obtusin | 1.88 | 91.13 | 5.68 | 98.51 | 4.55 |
| 18.8 | 93.45 | 6.12 | 100.16 | 3.60 | |
| 94 | 89.80 | 5.71 | 97.06 | 5.58 | |
| obtusifolin | 2.05 | 86.45 | 6.62 | 100.06 | 3.92 |
| 20.5 | 88.25 | 7.56 | 94.46 | 4.30 | |
| 103 | 90.03 | 5.55 | 100.67 | 3.51 | |
| questin | 1.68 | 86.72 | 4.84 | 95.40 | 5.22 |
| 16.8 | 87.58 | 3.06 | 97.29 | 6.53 | |
| 84 | 89.76 | 2.45 | 93.50 | 6.29 | |
| SC-1 | 2.07 | 76.54 | 8.91 | 98.58 | 4.83 |
| 20.7 | 78.90 | 4.87 | 96.77 | 3.24 | |
| 103 | 79.28 | 6.69 | 96.23 | 5.95 | |
| rhein | 2.13 | 80.43 | 9.26 | 102.98 | 8.28 |
| 21.3 | 81.72 | 5.65 | 99.27 | 3.28 | |
| 107 | 83.45 | 6.15 | 101.87 | 5.75 | |
| emodin | 2.07 | 92.45 | 6.62 | 105.92 | 3.92 |
| 20.7 | 93.77 | 5.61 | 103.07 | 3.54 | |
| 103 | 90.02 | 4.76 | 104.93 | 5.41 | |
| SC-2 | 1.80 | 93.23 | 5.85 | 97.94 | 6.63 |
| 18 | 90.41 | 5.28 | 98.95 | 5.39 | |
| 90 | 87.64 | 7.50 | 99.74 | 4.41 | |
| Compounds | Concentration (ng/mL) | Room Temperature for 4 h | Autosampler for 24 h | −20 °C for 3 Weeks | Freeze-Thaw Cycles | ||||
|---|---|---|---|---|---|---|---|---|---|
| Remains (%) | RSD (%) | Remains (%) | RSD (%) | Remains (%) | RSD (%) | Remains (%) | RSD (%) | ||
| aurantio-obtusin | 1.88 | 103.7 | 4.62 | 104.8 | 5.54 | 104.49 | 5.13 | 106.89 | 8.40 |
| 18.8 | 97.1 | 5.86 | 105.8 | 6.86 | 102.69 | 7.42 | 105.24 | 6.69 | |
| 94 | 95.4 | 7.65 | 97.8 | 4.58 | 97.84 | 5.17 | 98.05 | 4.43 | |
| obtusifolin | 2.05 | 98.3 | 5.27 | 102.4 | 6.46 | 101.59 | 6.93 | 103.98 | 5.11 |
| 20.5 | 91.5 | 5.93 | 93.4 | 7.39 | 93.69 | 6.73 | 95.74 | 5.81 | |
| 103 | 98.2 | 4.53 | 98.3 | 5.42 | 99.49 | 5.03 | 101.69 | 4.31 | |
| questin | 1.68 | 99.0 | 4.03 | 100.8 | 4.72 | 98.14 | 5.42 | 103.45 | 3.78 |
| 16.8 | 99.6 | 2.80 | 102.8 | 6.99 | 102.44 | 4.92 | 104.83 | 6.45 | |
| 84 | 105.5 | 6.37 | 99.1 | 4.40 | 103.54 | 2.41 | 96.70 | 5.09 | |
| SC-1 | 2.07 | 95.0 | 6.87 | 97.1 | 8.70 | 98.29 | 7.87 | 100.56 | 4.81 |
| 20.7 | 97.9 | 4.06 | 99.4 | 4.76 | 99.89 | 4.46 | 102.14 | 7.81 | |
| 103 | 105.9 | 5.32 | 99.3 | 6.53 | 103.84 | 5.99 | 97.01 | 8.16 | |
| rhein | 2.13 | 106.2 | 9.77 | 103.0 | 8.99 | 102.84 | 9.07 | 105.23 | 7.15 |
| 21.3 | 94.9 | 4.47 | 95.9 | 5.30 | 96.64 | 4.93 | 98.77 | 4.29 | |
| 107 | 102.6 | 4.95 | 102.7 | 6.01 | 103.89 | 5.54 | 106.25 | 7.76 | |
| emodin | 2.07 | 95.8 | 5.27 | 106.8 | 6.46 | 102.54 | 6.93 | 101.15 | 4.11 |
| 20.7 | 99.3 | 4.58 | 102.2 | 5.48 | 101.99 | 5.08 | 96.36 | 4.36 | |
| 103 | 104.5 | 7.59 | 104.0 | 6.69 | 103.49 | 6.67 | 105.71 | 6.23 | |
| SC-2 | 1.80 | 105.5 | 4.74 | 93.5 | 5.71 | 100.74 | 5.28 | 95.65 | 4.53 |
| 18 | 94.9 | 6.34 | 101.2 | 5.14 | 99.29 | 4.79 | 101.66 | 4.10 | |
| 90 | 105.5 | 5.96 | 103.6 | 7.43 | 106.29 | 6.77 | 97.54 | 5.81 | |
| Compounds | Group | Cmax (ng/mL) | Tmax (h) | AUC0-12 (ng·h/mL) | AUC0-∞ (ng·h/mL) | MRT0-12 (h) |
|---|---|---|---|---|---|---|
| aurantio-obtusin | raw | 171.46 ± 58.87 | 0.20 ± 0.07 | 537.31 ± 141.20 | 1436.22 ± 375.33 | 5.42 ± 1.19 |
| processed | 438.36 ± 99.64 * | 0.08 ±0.00 * | 674.17 ± 87.38 | 846.48 ± 96.18 | 4.20 ± 0.54 | |
| obtusifolin | raw | 99.13 ± 30.78 | 0.23 ± 0.07 | 279.63 ± 56.93 | 389.67 ± 58.93 | 5.17 ± 0.75 |
| processed | 231.72 ± 39.96 * | 0.13 ± 0.08 | 344.76 ± 44.90 | 385.30 ± 65.59 | 3.94 ± 0.40 * | |
| questin | raw | 28.35 ± 5.78 | 0.23 ± 0.07 | 110.56 ± 40.65 | 258.79 ± 45.11 | 5.45 ± 0.50 |
| processed | 56.07 ± 8.05 * | 0.17 ± 0.08 | 139.99 ± 30.00 | 218.56 ± 42.14 | 4.83 ± 0.48 | |
| SC-1 | raw | 11.34 ± 2.65 | 0.17 ± 0.00 | 60.60 ± 10.47 | 152.07 ± 43.76 | 6.49 ± 1.11 |
| processed | 28.74 ± 6.55 * | 0.08 ± 0.00 * | 70.53 ± 15.62 | 145.87 ± 36.46 | 6.25 ± 0.62 | |
| rhein | raw | 39.48 ± 6.72 | 0.23 ± 0.07 | 155.19 ± 32.53 | 351.71 ± 54.77 | 5.45 ± 0.54 |
| processed | 75.99 ± 9.68 * | 0.13 ± 0.07 | 192.33 ± 26.31 | 294.23 ± 45.80 | 3.74 ± 0.42 * | |
| emodin | raw | 4.94 ± 1.40 | 0.18 ± 0.04 | 33.67 ± 7.85 | 80.72 ± 21.59 | 7.15 ± 0.74 |
| processed | 9.75 ± 1.94 | 0.17 ± 0.06 | 38.43 ± 8.13 | 82.66 ± 19.56 | 6.24 ± 0.50 | |
| SC-2 | raw | 4.07 ± 1.36 | 0.10 ± 0.04 | 21.08 ± 4.37 | 70.47 ± 13.66 | 6.40 ± 0.43 |
| processed | 9.64 ± 1.75 | 0.12 ± 0.08 | 25.12 ± 5.79 | 48.10 ± 9.22 | 6.29 ± 0.48 |
| Compounds | Dosages in R-SC Group (mg/kg) | Dosages in P-SC Group (mg/kg) |
|---|---|---|
| aurantio-obtusin | 5.78 | 9.18 |
| obtusifolin | 1.78 | 3.52 |
| questin | 0.28 | 0.40 |
| SC-1 | 0.96 | 1.63 |
| rhein | 0.26 | 0.40 |
| emodin | 0.74 | 1.17 |
| SC-2 | 0.44 | 0.76 |
© 2017 by the authors. Licensee MDPI, Basel, Switzerland. This article is an open access article distributed under the terms and conditions of the Creative Commons Attribution (CC BY) license (http://creativecommons.org/licenses/by/4.0/).
Share and Cite
Guo, R.; Wu, H.; Yu, X.; Xu, M.; Zhang, X.; Tang, L.; Wang, Z. Simultaneous Determination of Seven Anthraquinone Aglycones of Crude and Processed Semen Cassiae Extracts in Rat Plasma by UPLC–MS/MS and Its Application to a Comparative Pharmacokinetic Study. Molecules 2017, 22, 1803. https://doi.org/10.3390/molecules22111803
Guo R, Wu H, Yu X, Xu M, Zhang X, Tang L, Wang Z. Simultaneous Determination of Seven Anthraquinone Aglycones of Crude and Processed Semen Cassiae Extracts in Rat Plasma by UPLC–MS/MS and Its Application to a Comparative Pharmacokinetic Study. Molecules. 2017; 22(11):1803. https://doi.org/10.3390/molecules22111803
Chicago/Turabian StyleGuo, Rixin, Hongwei Wu, Xiankuo Yu, Mengying Xu, Xiao Zhang, Liying Tang, and Zhuju Wang. 2017. "Simultaneous Determination of Seven Anthraquinone Aglycones of Crude and Processed Semen Cassiae Extracts in Rat Plasma by UPLC–MS/MS and Its Application to a Comparative Pharmacokinetic Study" Molecules 22, no. 11: 1803. https://doi.org/10.3390/molecules22111803
APA StyleGuo, R., Wu, H., Yu, X., Xu, M., Zhang, X., Tang, L., & Wang, Z. (2017). Simultaneous Determination of Seven Anthraquinone Aglycones of Crude and Processed Semen Cassiae Extracts in Rat Plasma by UPLC–MS/MS and Its Application to a Comparative Pharmacokinetic Study. Molecules, 22(11), 1803. https://doi.org/10.3390/molecules22111803