
Suitable DNA Barcoding for Identification and Supervision of Piper kadsura in Chinese Medicine Markets

Abstract
: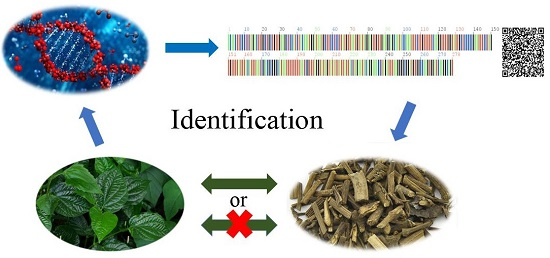
1. Introduction
2. Results
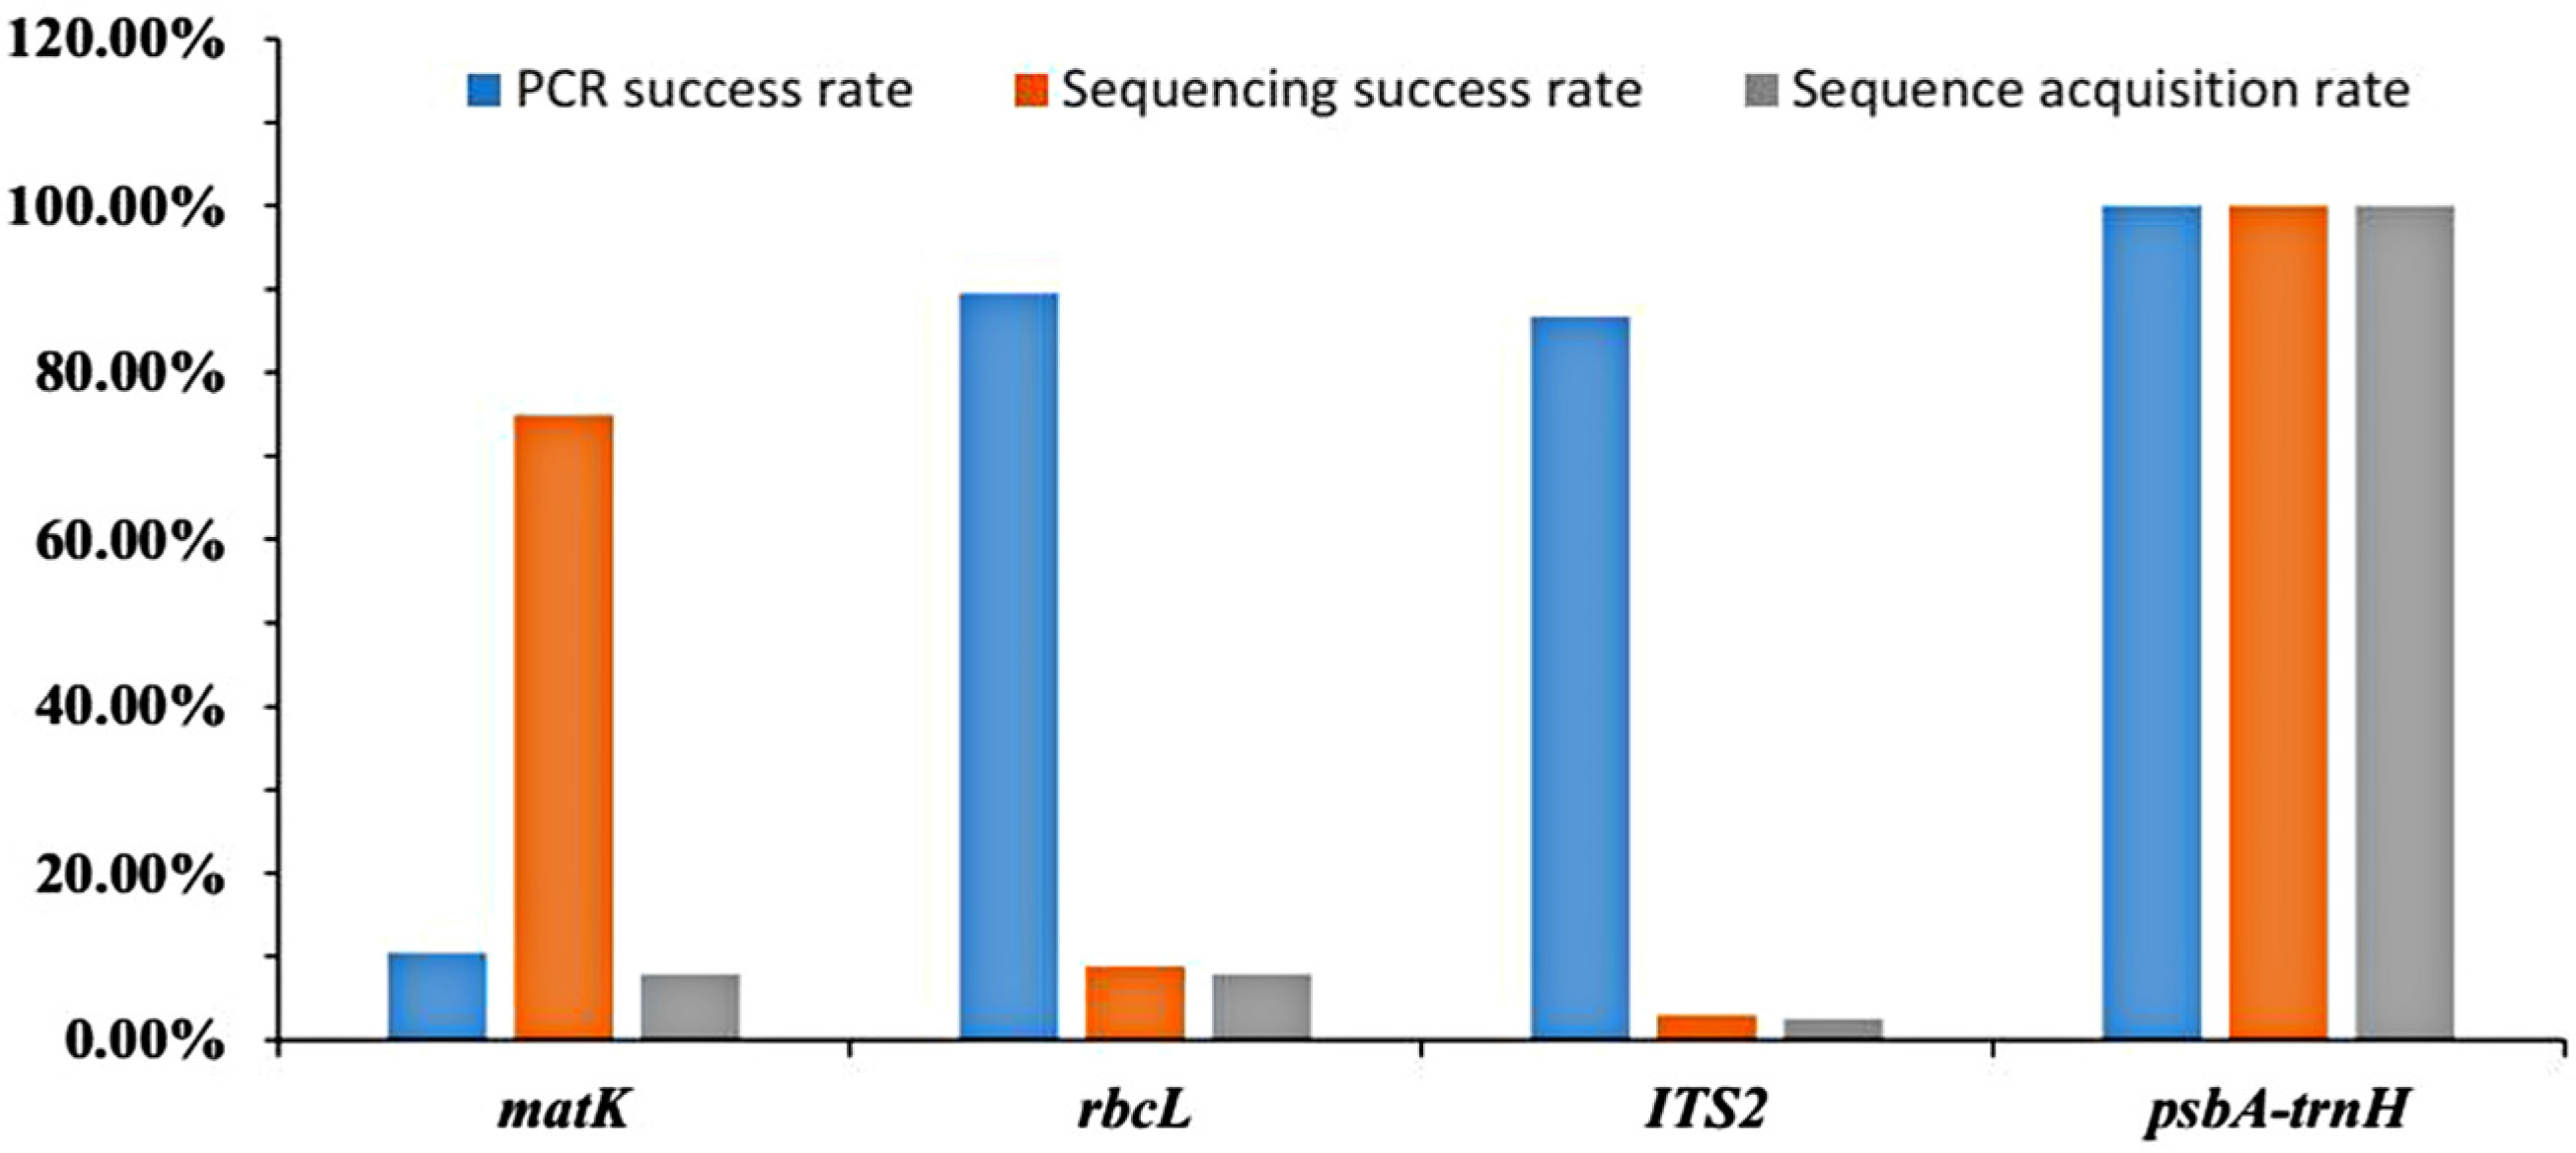
2.1. Success Rates of PCR Amplification, Sequencing, and Sequence Acquisition
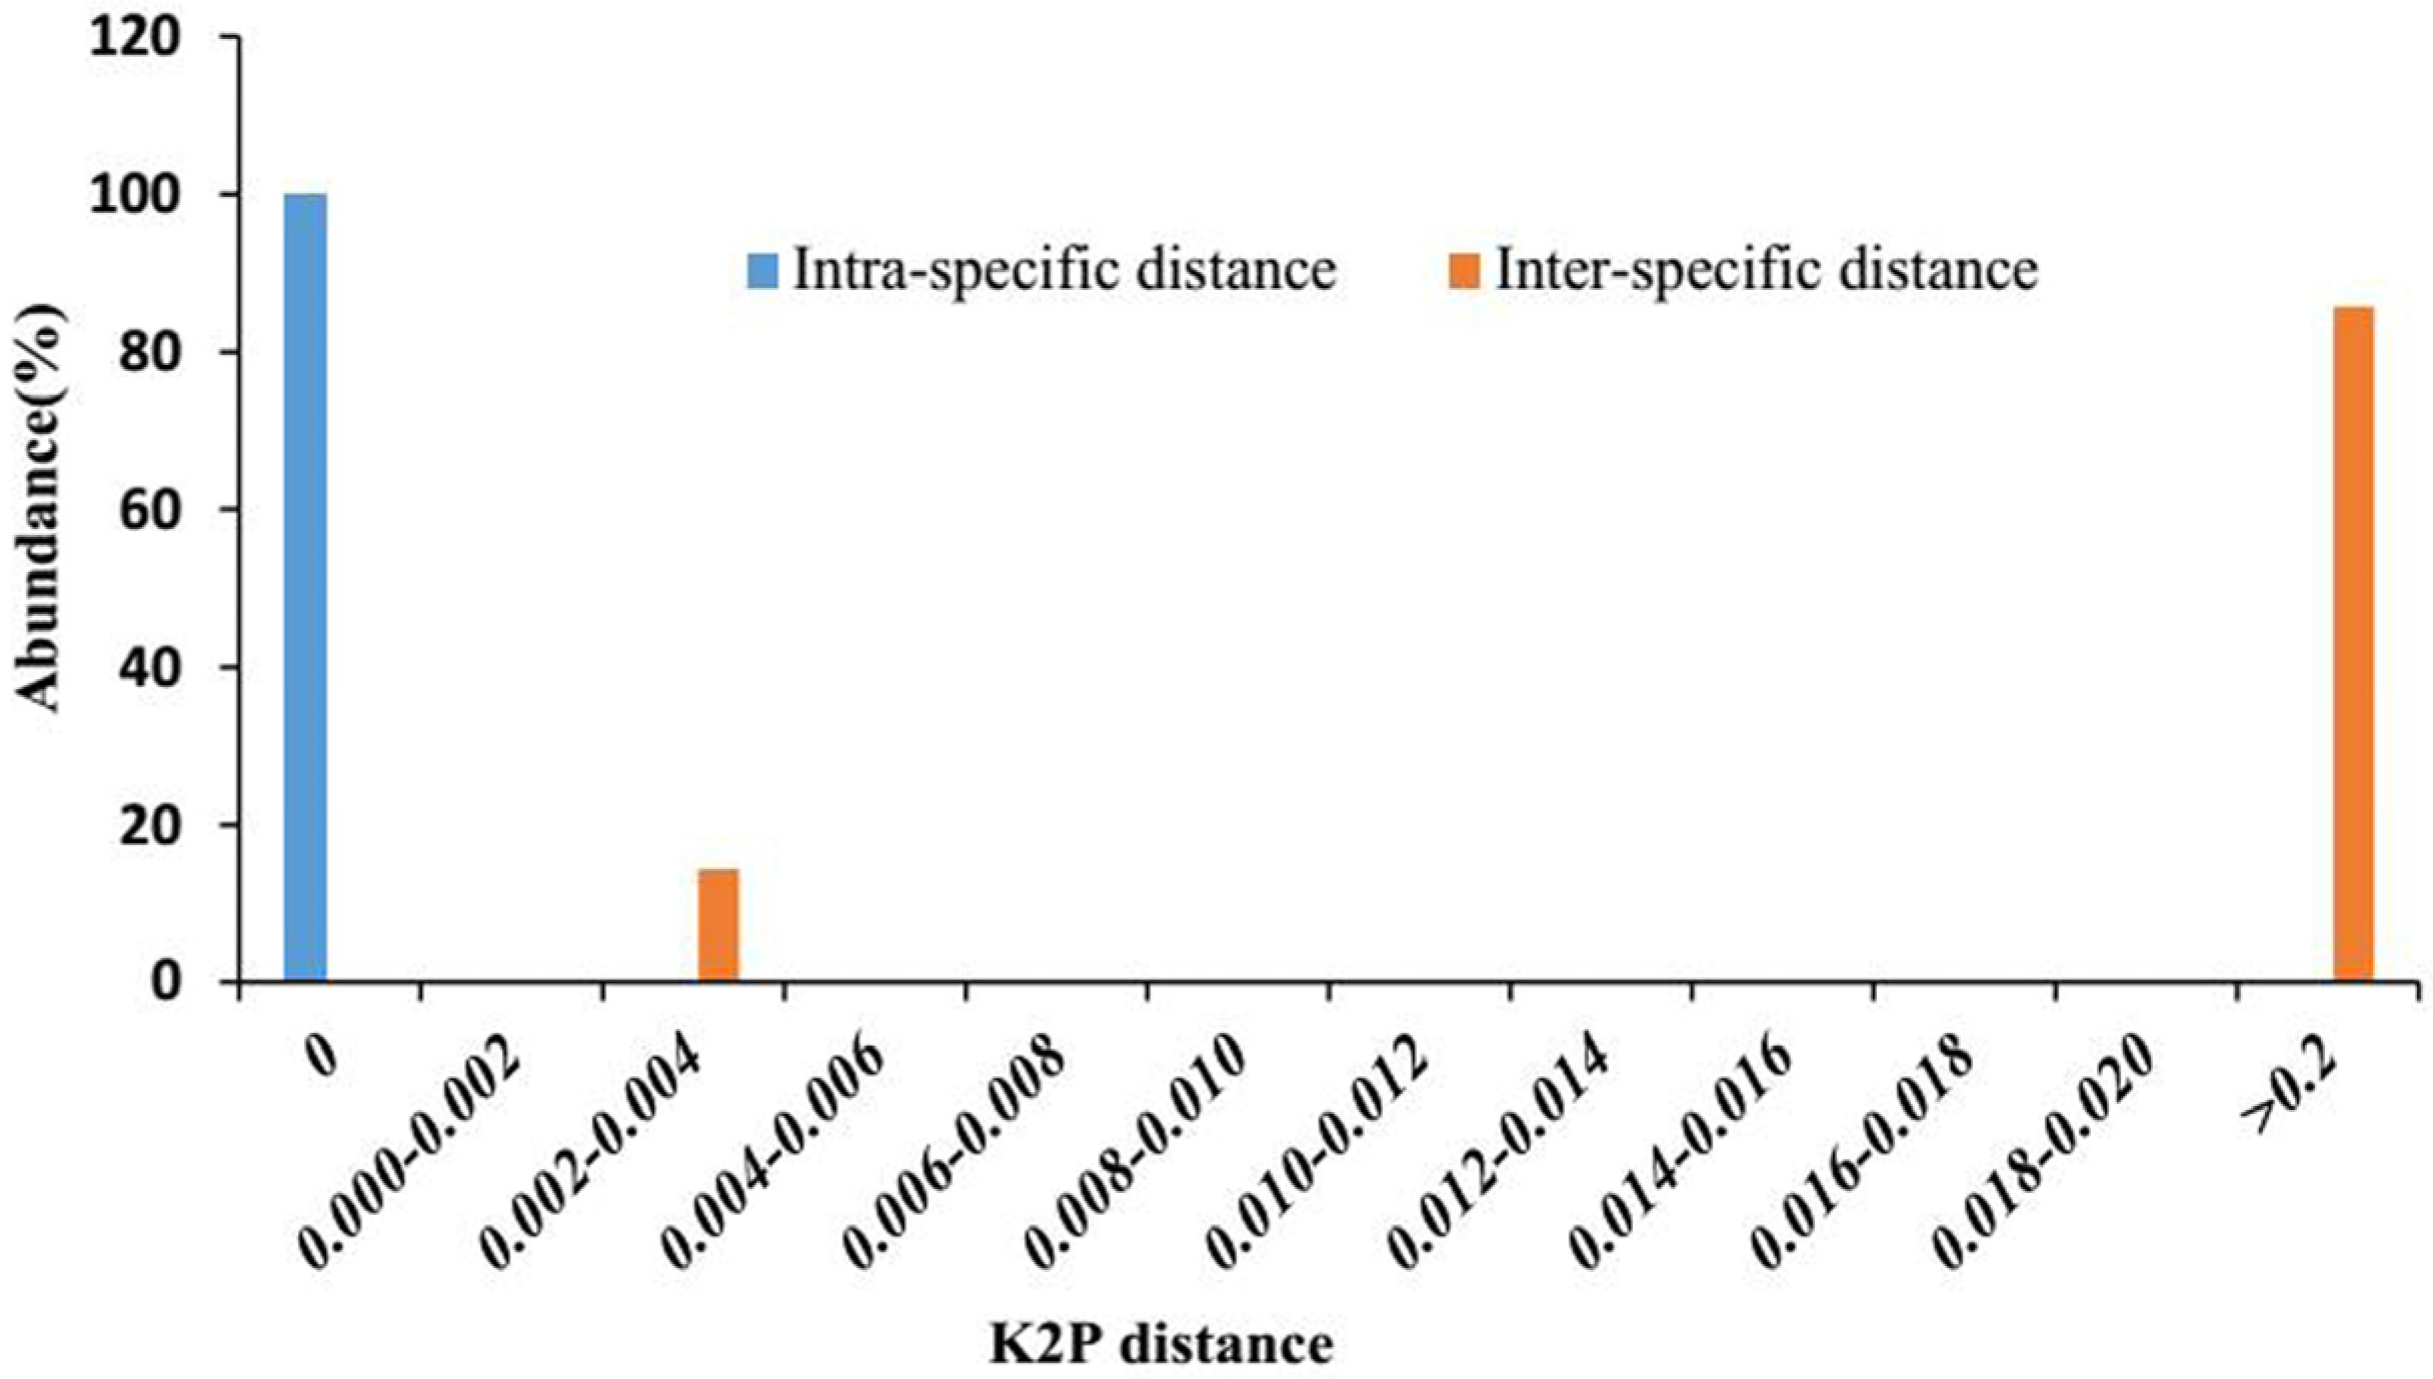
2.2. Genetic Distances within and between Species
2.3. Barcoding Gap Assessment
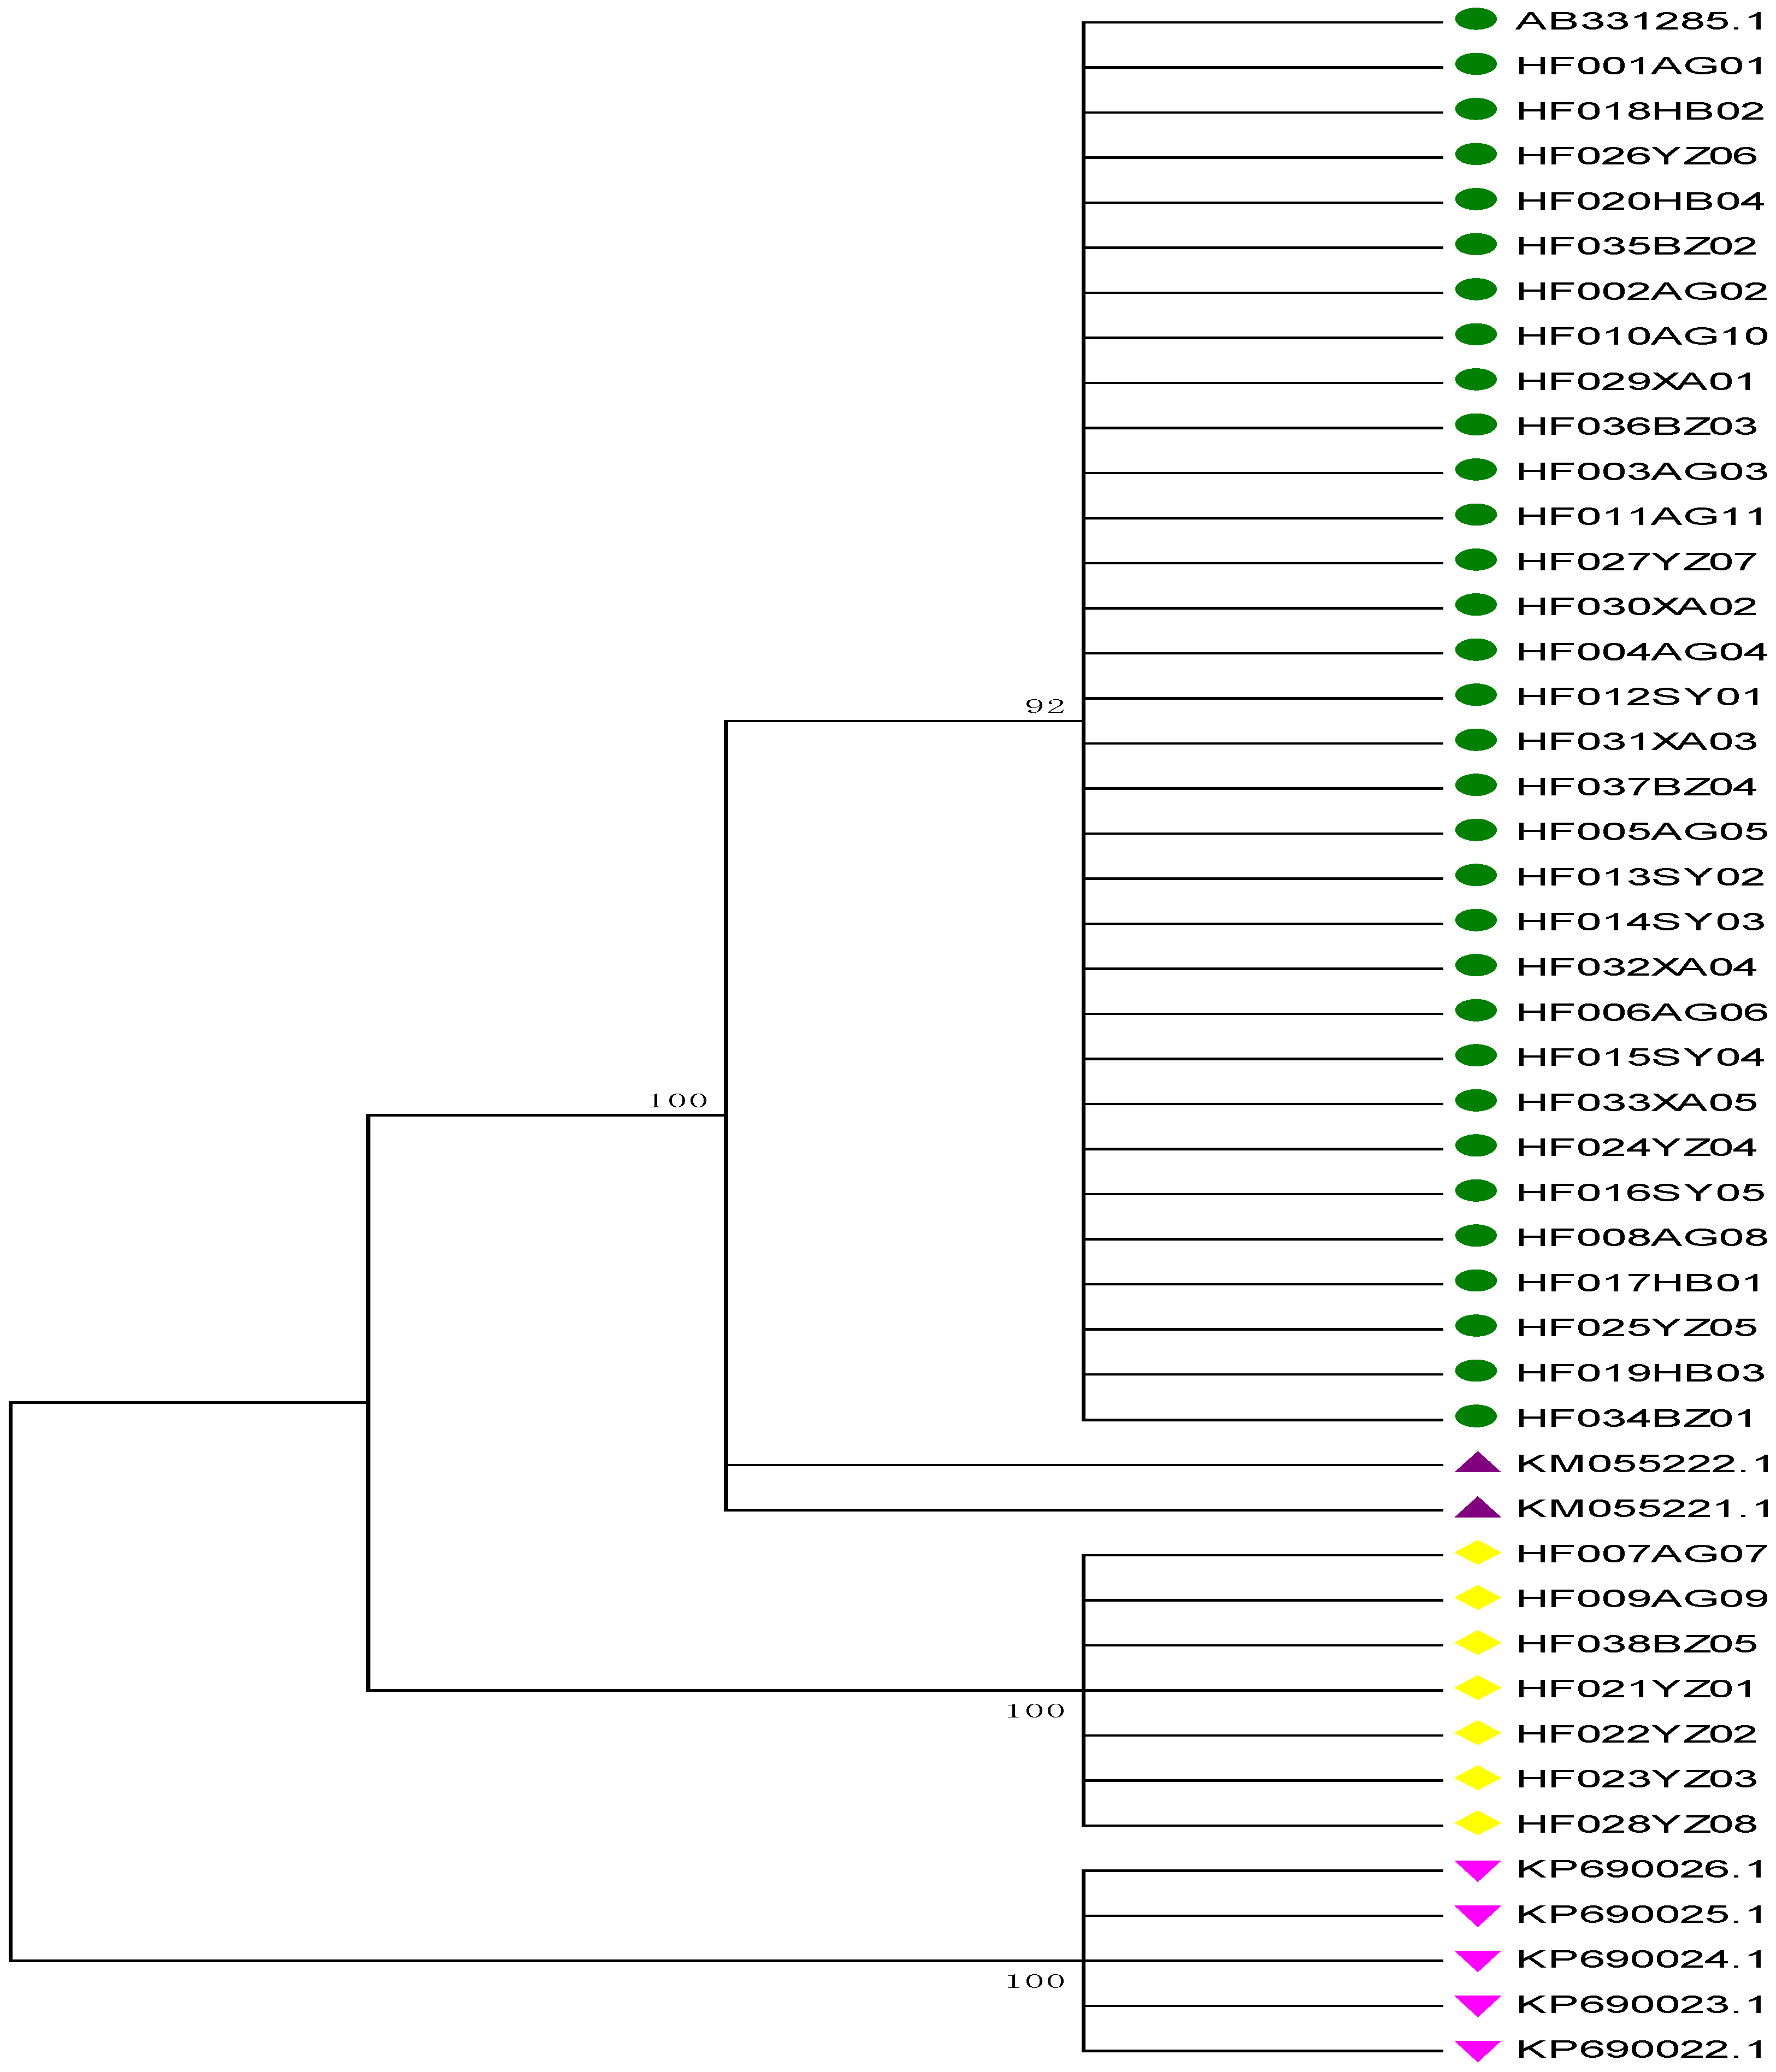
2.4. Neighbor-Joining (NJ) Tree Identification
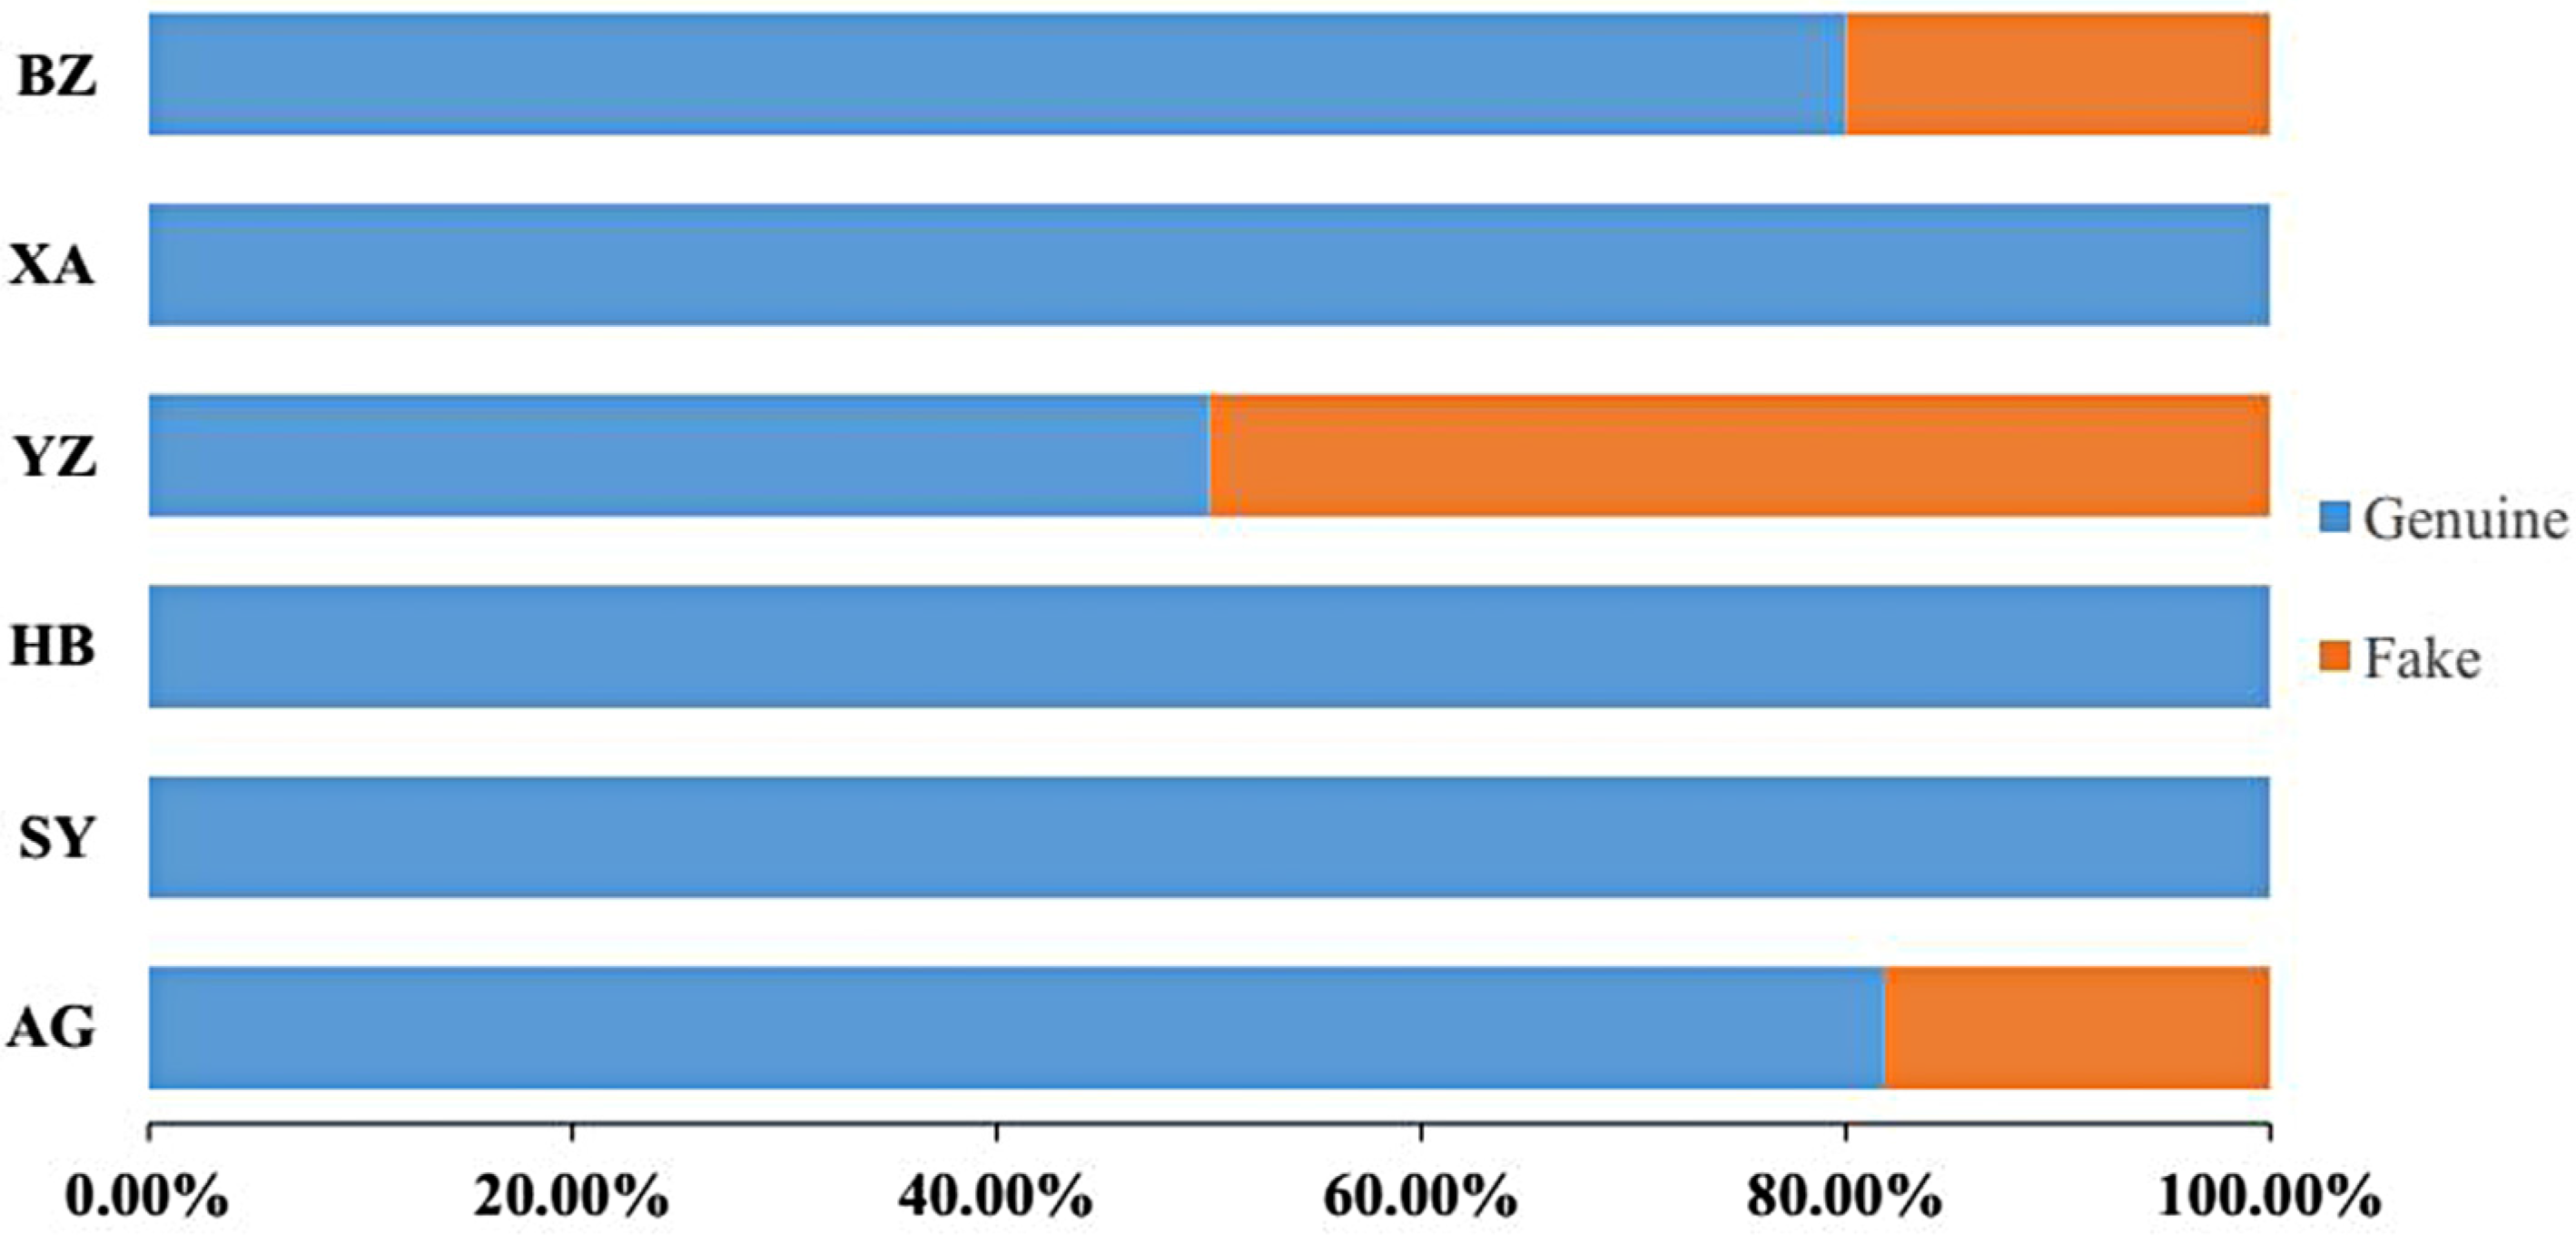
2.5. Proportions of Adulterant Species
2.6. DNA Barcoding and Two-Dimensional DNA Barcoding Image
3. Discussion
3.1. Efficacy of psbA-trnH for Identification
3.2. Opportunities and Challenges of DNA Barcoding in Medicine Markets
4. Experimental Section
4.1. Plant Materials
4.2. DNA Extraction, Amplification, and Sequencing
4.3. Sequence Alignment and Genetic and Phylogenetic Analyses
Acknowledgments
Author Contributions
Conflicts of Interest
Abbreviations
| TCM | Traditional Chinese medicine |
| K2P | Kimura 2-Parameter |
| NJ | Neighbor-joining |
References
- State Pharmacopoeia Committee. Chinese Pharmacopoeia, 10th ed.; Medical Science and Technology Press: Beijing, China, 2010; p. 448. [Google Scholar]
- Kuo, Y.C.; Yang, N.S.; Chou, C.J.; Lin, L.C.; Tsai, W.J. Regulation of cell proliferation, gene expression, production of cytokines, and cell cycle progression in primary human T lymphocytes by piperlactam S isolated from Piper kadsura. Mol. Pharmacol. 2000, 58, 1057–1066. [Google Scholar] [PubMed]
- Kim, K.H.; Choi, J.W.; Choi, S.U.; Ha, S.K.; Kim, S.Y.; Park, H.J.; Lee, K.R. The chemical constituents of Piper kadsura and their cytotoxic and anti-neuroinflammtaory activities. J. Enzyme Inhib. Med. Chem. 2011, 26, 254–260. [Google Scholar] [CrossRef] [PubMed]
- Marshall, E. Will DNA bar codes breathe life into classification? Science 2005, 307, 1037. [Google Scholar] [CrossRef] [PubMed]
- Hebert, P.D.N.; Cywinska, A.; Ball, S.L.; DeWaard, J.R. Biological identifications through DNA barcodes. Proc. R. Soc. Lond. B Biol. Sci. 2003, 270, 313–321. [Google Scholar] [CrossRef] [PubMed]
- Lahaye, R.; van der Bank, M.; Bogarin, D.; Warner, J.; Pupulin, F.; Gigot, G.; Maurin, O.; Duthoit, S.; Barraclough, T.G.; Savolainen, V. DNA barcoding the floras of biodiversity hotspots. Proc. Natl. Acad. Sci. USA 2008, 105, 2923–2928. [Google Scholar] [CrossRef] [PubMed]
- Chase, M.W.; Soltis, D.E.; Olmstead, R.G.; Morgan, D.; Les, D.H.; Mishler, B.D.; Duvall, M.R.; Price, R.A.; Hills, H.G.; Qiu, Y.L.; et al. Phylogenetics of seed plants: An analysis of nucleotide sequences from the plastid gene rbcL. Ann. Mo. Bot. Gard. 1993, 80, 528–580. [Google Scholar] [CrossRef]
- Chen, S.L.; Yao, H.; Han, J.P.; Liu, C.; Song, J.Y.; Shi, L.C.; Zhu, Y.J.; Ma, X.Y.; Gao, T.; Pang, X.H.; et al. Validation of the ITS2 region as a novel DNA barcode for identifying medicinal plant species. PLoS ONE 2010, 5, e8613. [Google Scholar] [CrossRef] [PubMed]
- Kress, W.J.; Erickson, D.L. A two-locus global DNA barcode for land plants: The coding rbcL gene complements the non-coding trnH-psbA spacer region. PLoS ONE 2007, 2, e508. [Google Scholar] [CrossRef] [PubMed]
- Newmaster, S.G.; Fazekas, A.J.; Steeves, R.A.D.; Janovec, J. Testing candidate plant barcode regions in the Myristicaceae. Mol. Ecol. Resour. 2008, 8, 480–490. [Google Scholar] [CrossRef] [PubMed]
- CBOL Plant Working Group. A DNA barcode for land plants. Proc. Natl. Acad. Sci. USA 2009, 106, 1294–1297. [Google Scholar]
- Hou, D.Y.; Song, J.Y.; Shi, L.C.; Ma, X.C.; Xin, T.Y.; Han, J.P.; Xiao, W.; Sun, Z.Y.; Cheng, R.Y.; Yao, H. Stability and accuracy assessment of identification of traditional Chinese materia medica using DNA barcoding: A case study on Flos Lonicerae Japonicae. BioMed Res. Int. 2013, 2013, 1–6. [Google Scholar] [CrossRef] [PubMed]
- Vassou, S.L.; Kusuma, G.; Parani, M. DNA barcoding for species identification from dried and powdered plant parts: A case study with authentication of the raw drug market samples of Sida cordifolia. Gene 2015, 559, 86–93. [Google Scholar] [CrossRef] [PubMed]
- Kool, A.; de Boer, H.J.; Krüger, Å.; Rydberg, A.; Abbad, A.; Björk, L.; Martin, G. Molecular identification of commercialized medicinal plants in Southern Morocco. PLoS ONE 2012, 7, e39459. [Google Scholar] [CrossRef] [PubMed]
- Xin, T.Y.; Li, X.J.; Yao, H.; Lin, Y.L.; Ma, X.C.; Cheng, R.Y.; Song, J.Y.; Ni, L.H.; Fan, C.Z.; Chen, S.L. Survey of commercial Rhodiola products revealed species diversity and potential safety issues. Sci. Rep. 2015, 5, 8337. [Google Scholar] [CrossRef] [PubMed]
- Wu, L.; Sun, W.; Wang, B.; Zhao, H.Y.; Li, Y.L.; Cai, S.Q.; Xiang, L.; Zhu, Y.J.; Yao, H.; Song, J.Y.; et al. An integrated system for identifying the hidden assassins in traditional medicines containing aristolochic acids. Sci. Rep. 2015, 5, 11318. [Google Scholar] [CrossRef] [PubMed]
- Chen, S.L.; Pang, X.; Song, J.; Shi, L.; Yao, H.; Han, J.; Leon, C. A renaissance in herbal medicine identification: From morphology to DNA. Biotechnol. Adv. 2014, 32, 1237–1244. [Google Scholar] [CrossRef] [PubMed]
- Newmaster, S.G.; Grguric, M.; Shanmughanandhan, D.; Ramalingam, S.; Ragupathy, S. DNA barcoding detects contamination and substitution in North American herbal products. BMC Med. 2013, 11, 222. [Google Scholar] [CrossRef] [PubMed]
- Chen, S.L. Standard DNA Barcodes of Chinese Material Medica in Chinese Pharmacopoeia; Science Press: Beijing, China, 2015; p. 18. [Google Scholar]
- Shaw, J.; Lickey, E.B.; Beck, J.T.; Farmer, S.B.; Liu, W.S.; Miller, J.; Siripun, K.C.; Winder, C.T.; Schilling, E.E.; Small, R.L. The tortoise and the hare II: Relative utility of 21 noncoding chloroplast DNA sequences for phylogenetic analysis. Am. J. Bot. 2005, 92, 142–166. [Google Scholar] [CrossRef] [PubMed]
- Whitlock, B.A.; Hale, A.M.; Groff, P.A. Intraspecific inversions pose a challenge for the trnH-psbA plant DNA barcode. PLoS ONE 2010, 5, e11533. [Google Scholar] [CrossRef] [PubMed]
- Pang, X.H.; Liu, C.; Shi, L.C.; Liu, R.; Liang, D.; Li, H.; Cherny, S.S.; Chen, S.L. Utility of the trnH–psbA intergenic spacer region and its combinations as plant DNA barcodes: A meta-analysis. PLoS ONE 2012, 7, e48833. [Google Scholar] [CrossRef] [PubMed]
- Yao, H.; Song, J.Y.; Ma, X.Y.; Liu, C.; Li, Y.; Xu, H.X.; Chen, S.L. Identification of Dendrobium species by a candidate DNA barcode sequence: The chloroplast psbA-trnH intergenic region. Planta Med. 2009, 75, 667–669. [Google Scholar] [CrossRef] [PubMed]
- Kress, W.J.; Wurdack, K.J.; Zimmer, E.A.; Weigt, L.A.; Janzen, D.H. Use of DNA barcodes to identify flowering plants. Proc. Natl. Acad. Sci. USA 2005, 102, 8369–8374. [Google Scholar] [CrossRef] [PubMed]
- Kress, W.J.; Erickson, D.L.; Jones, F.A.; Swenson, N.G.; Perez, R.; Sanjur, O.; Bermingham, E. Plant DNA barcodes and a community phylogeny of a tropical forest dynamics plot in Panama. Proc. Natl. Acad. Sci. USA 2009, 106, 18621–18626. [Google Scholar] [CrossRef] [PubMed]
- Ma, X.Y.; Xie, C.X.; Liu, C.; Song, J.Y.; Yao, H.; Luo, K.; Zhu, Y.J.; Gao, T.; Pang, X.H.; Chen, S.L.; et al. Species identification of medicinal pteridophytes by a DNA barcode marker, the chloroplast psbA-trnH intergenic region. Biol. Pharm. Bull. 2010, 33, 1919–1924. [Google Scholar] [CrossRef] [PubMed]
- Hebert, P.D.; Gregory, T.R. The promise of DNA barcoding for taxonomy. Syst. Boil. 2005, 54, 852–859. [Google Scholar] [CrossRef] [PubMed]
- Han, J.P.; Pang, X.H.; Liao, B.S.; Yao, H.; Song, J.Y.; Chen, S.L. An authenticity survey of herbal medicines from markets in China using DNA barcoding. Sci. Rep. 2016, 6, 18723. [Google Scholar] [CrossRef] [PubMed]
- Zhao, S.; Chen, X.C.; Song, J.Y.; Pang, X.H.; Chen, S.L. Internal transcribed spacer 2 barcode: A good tool for identifying Acanthopanacis cortex. Front. Plant Sci. 2015, 6, 840. [Google Scholar] [CrossRef] [PubMed]
- Tamura, K.; Peterson, D.; Peterson, N.; Stecher, G.; Nei, M.; Kumar, S. MEGA5: Molecular evolutionary genetics analysis using maximum likelihood, evolutionary distance, and maximum parsimony methods. Mol. Biol. Evol. 2011, 28, 2731–2739. [Google Scholar] [CrossRef] [PubMed]
- Slabbinck, B.; Dawyndt, P.; Martens, M.; de Vos, P.; de Baets, B. Taxon Gap: A visualization tool for intra-and inter-species variation among individual biomarkers. Bioinformatics 2008, 24, 866–867. [Google Scholar] [CrossRef] [PubMed]
- Sample Availability: Not Available.


 A
A  T
T  C
C  G).
A T C G).
G).
A T C G).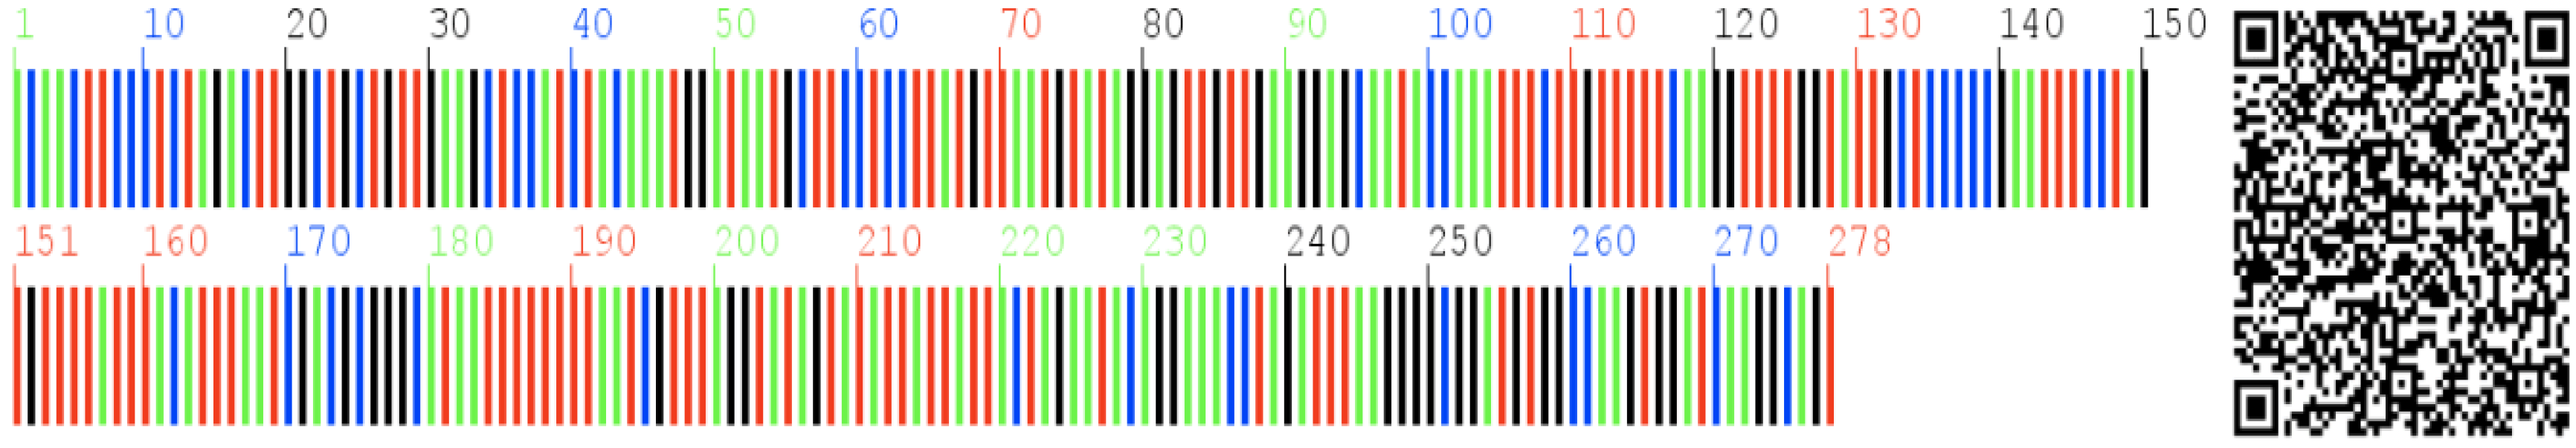

| K2P Genetic Distances | Genetic Distance |
|---|---|
| Intra-specific distances | 0.000 |
| Inter-specific distances with Piper wallichii | 0.004 |
| Inter-specific distances with AC (Actinidia chinensis) | 0.318 |
| Inter-specific distances with Kadsura heteroclita | 0.426 |
| Sl No. | Latin Name | Place of Collection | Sample No. | Identification Result |
|---|---|---|---|---|
| 1 | P. kadsura | AG | HF001AG01 | Genuine |
| 2 | P. kadsura | AG | HF002AG02 | Genuine |
| 3 | P. kadsura | AG | HF003AG03 | Genuine |
| 4 | P. kadsura | AG | HF004AG04 | Genuine |
| 5 | P. kadsura | AG | HF005AG05 | Genuine |
| 6 | P. kadsura | AG | HF006AG06 | Genuine |
| 7 | P. kadsura | AG | HF007AG07 | Fake |
| 8 | P. kadsura | AG | HF008AG08 | Genuine |
| 9 | P. kadsura | AG | HF009AG09 | Fake |
| 10 | P. kadsura | AG | HF010AG10 | Genuine |
| 11 | P. kadsura | AG | HF011AG11 | Genuine |
| 12 | P. kadsura | SY | HF012SY01 | Genuine |
| 13 | P. kadsura | SY | HF013SY02 | Genuine |
| 14 | P. kadsura | SY | HF014SY03 | Genuine |
| 15 | P. kadsura | SY | HF015SY04 | Genuine |
| 16 | P. kadsura | SY | HF016SY05 | Genuine |
| 17 | P. kadsura | HB | HF017HB01 | Genuine |
| 18 | P. kadsura | HB | HF018HB02 | Genuine |
| 19 | P. kadsura | HB | HF019HB03 | Genuine |
| 20 | P. kadsura | HB | HF020HB04 | Genuine |
| 21 | P. kadsura | YZ | HF021YZ01 | Fake |
| 22 | P. kadsura | YZ | HF022YZ02 | Fake |
| 23 | P. kadsura | YZ | HF023YZ03 | Fake |
| 24 | P. kadsura | YZ | HF024YZ04 | Genuine |
| 25 | P. kadsura | YZ | HF025YZ05 | Genuine |
| 26 | P. kadsura | YZ | HF026YZ06 | Genuine |
| 27 | P. kadsura | YZ | HF027YZ07 | Genuine |
| 28 | P. kadsura | YZ | HF028YZ08 | Fake |
| 29 | P. kadsura | XA | HF029XA01 | Genuine |
| 30 | P. kadsura | XA | HF030XA02 | Genuine |
| 31 | P. kadsura | XA | HF031XA03 | Genuine |
| 32 | P. kadsura | XA | HF032XA04 | Genuine |
| 33 | P. kadsura | XA | HF033XA05 | Genuine |
| 34 | P. kadsura | BZ | HF034BZ01 | Genuine |
| 35 | P. kadsura | BZ | HF035BZ02 | Genuine |
| 36 | P. kadsura | BZ | HF036BZ03 | Genuine |
| 37 | P. kadsura | BZ | HF037BZ04 | Genuine |
| 38 | P. kadsura | BZ | HF038BZ05 | Fake |
| No. | Latin Name | Genus Name | Genebank No. |
|---|---|---|---|
| 1 | P. kadsura | Piper Linn. | AB331285.1 |
| 2 | P. kadsura | Piper Linn. | KM055222.1 |
| 3 | P. wallichii | Piper Linn. | KM055221.1 |
| 4 | K. heteroclita | Kadsura Kaempf. ex Juss. | KP690026.1 |
| 5 | K. heteroclita | Kadsura Kaempf. ex Juss. | KP690025.1 |
| 6 | K. heteroclita | Kadsura Kaempf. ex Juss. | KP690024.1 |
| 7 | K. heteroclita | Kadsura Kaempf. ex Juss. | KP690023.1 |
| 8 | K. heteroclita | Kadsura Kaempf. ex Juss. | KP690022.1 |
© 2016 by the authors. Licensee MDPI, Basel, Switzerland. This article is an open access article distributed under the terms and conditions of the Creative Commons Attribution (CC-BY) license ( http://creativecommons.org/licenses/by/4.0/).
Share and Cite
Yu, N.; Gu, H.; Wei, Y.; Zhu, N.; Wang, Y.; Zhang, H.; Zhu, Y.; Zhang, X.; Ma, C.; Sun, A. Suitable DNA Barcoding for Identification and Supervision of Piper kadsura in Chinese Medicine Markets. Molecules 2016, 21, 1221. https://doi.org/10.3390/molecules21091221
Yu N, Gu H, Wei Y, Zhu N, Wang Y, Zhang H, Zhu Y, Zhang X, Ma C, Sun A. Suitable DNA Barcoding for Identification and Supervision of Piper kadsura in Chinese Medicine Markets. Molecules. 2016; 21(9):1221. https://doi.org/10.3390/molecules21091221
Chicago/Turabian StyleYu, Ning, Hong Gu, Yulong Wei, Ning Zhu, Yanli Wang, Haiping Zhang, Yue Zhu, Xin Zhang, Chao Ma, and Aidong Sun. 2016. "Suitable DNA Barcoding for Identification and Supervision of Piper kadsura in Chinese Medicine Markets" Molecules 21, no. 9: 1221. https://doi.org/10.3390/molecules21091221
APA StyleYu, N., Gu, H., Wei, Y., Zhu, N., Wang, Y., Zhang, H., Zhu, Y., Zhang, X., Ma, C., & Sun, A. (2016). Suitable DNA Barcoding for Identification and Supervision of Piper kadsura in Chinese Medicine Markets. Molecules, 21(9), 1221. https://doi.org/10.3390/molecules21091221