
Low-Quality Structural and Interaction Data Improves Binding Affinity Prediction via Random Forest


Abstract
:
1. Introduction
2. Methods
2.1. Models
- How test set performance varies when Vina is tailored to the training set? (model 1 vs. model 2).
- How test set performance varies when a classical SF is converted into a machine-learning SF by substituting MLR with RF? (model 2 vs. model 3)
- How test set performance of a machine-learning SF varies with additional features? (model 3 vs. model 4)
2.2. Benchmarks
2.2.1. PDBbind Data Quality
- (a)
- the resolution of the structure is better than 2.5 Å
- (b)
- the structure has been determined by X-ray crystallography
- (c)
- both the protein and the ligand are complete in the structure
- (d)
- protein and ligand are non-covalently bound
- (e)
- the ligand molecule does not contain uncommon elements such as Be, B, Si, and metal atoms
- (f)
- in case of peptide ligands, these are oligo-peptides (i.e., have less than 10 peptide residues)
- (g)
- in case of nucleotide ligands, these are oligo-nucleotides (i.e., have less than four nucleotide residues)
- (h)
- binding data must be either a dissociation constant (Kd) or an inhibition constant (Ki)
- (i)
- it is a binary complex (i.e., those proteins with multiple ligands bound in close vicinity at the common binding site are discarded)
2.2.2. Benchmarks Using High-Quality Data for Training
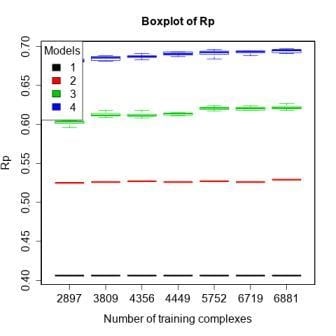
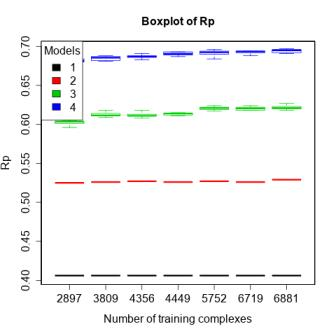
2.2.3. Benchmarks Including Low-Quality Data for Training

| Benchmark | Test Set | Training Sets | Purpose |
|---|---|---|---|
| 1 | refined14\refined13 (546) | refined13 (2959) | To validate previous results for machine-learning SFs in the light of newly released data. |
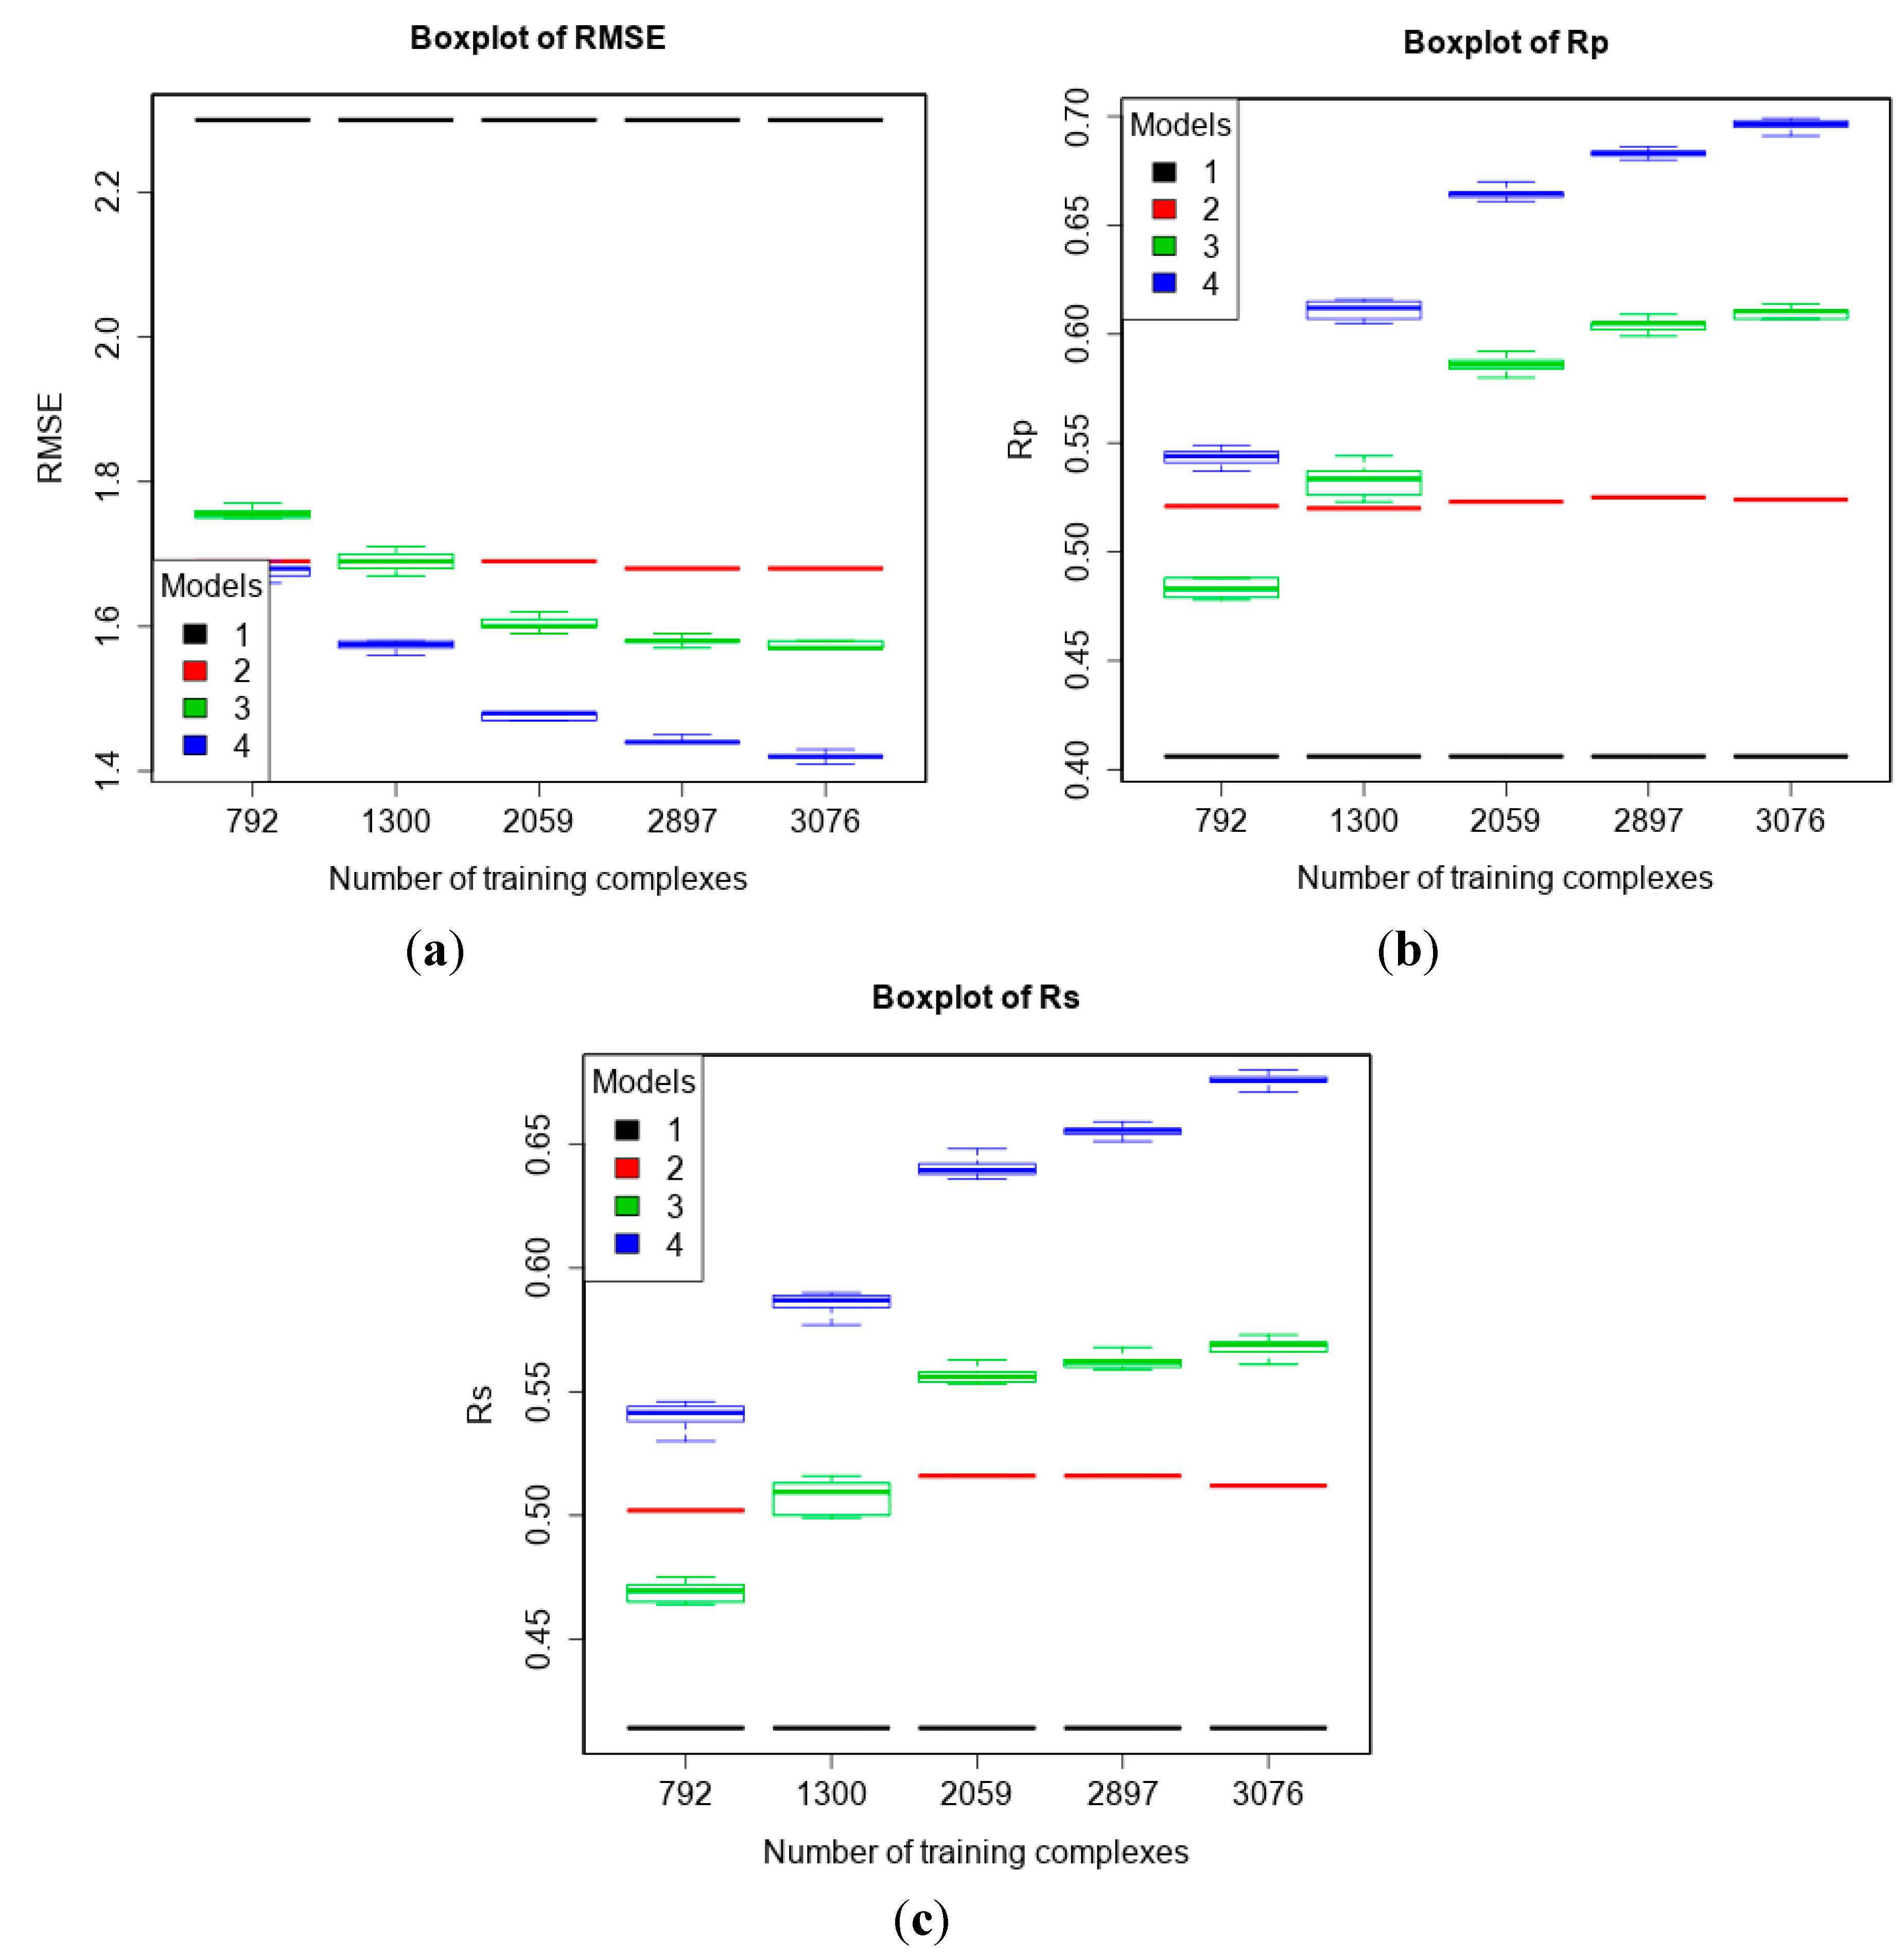
| 2 | refined13\refined12 (382) | refined02 (792) refined07 (1300) refined10 (2059) refined12 (2897) refined14\(refined13\refined12) (3076) | To study how performance varies given more high-quality training data. |
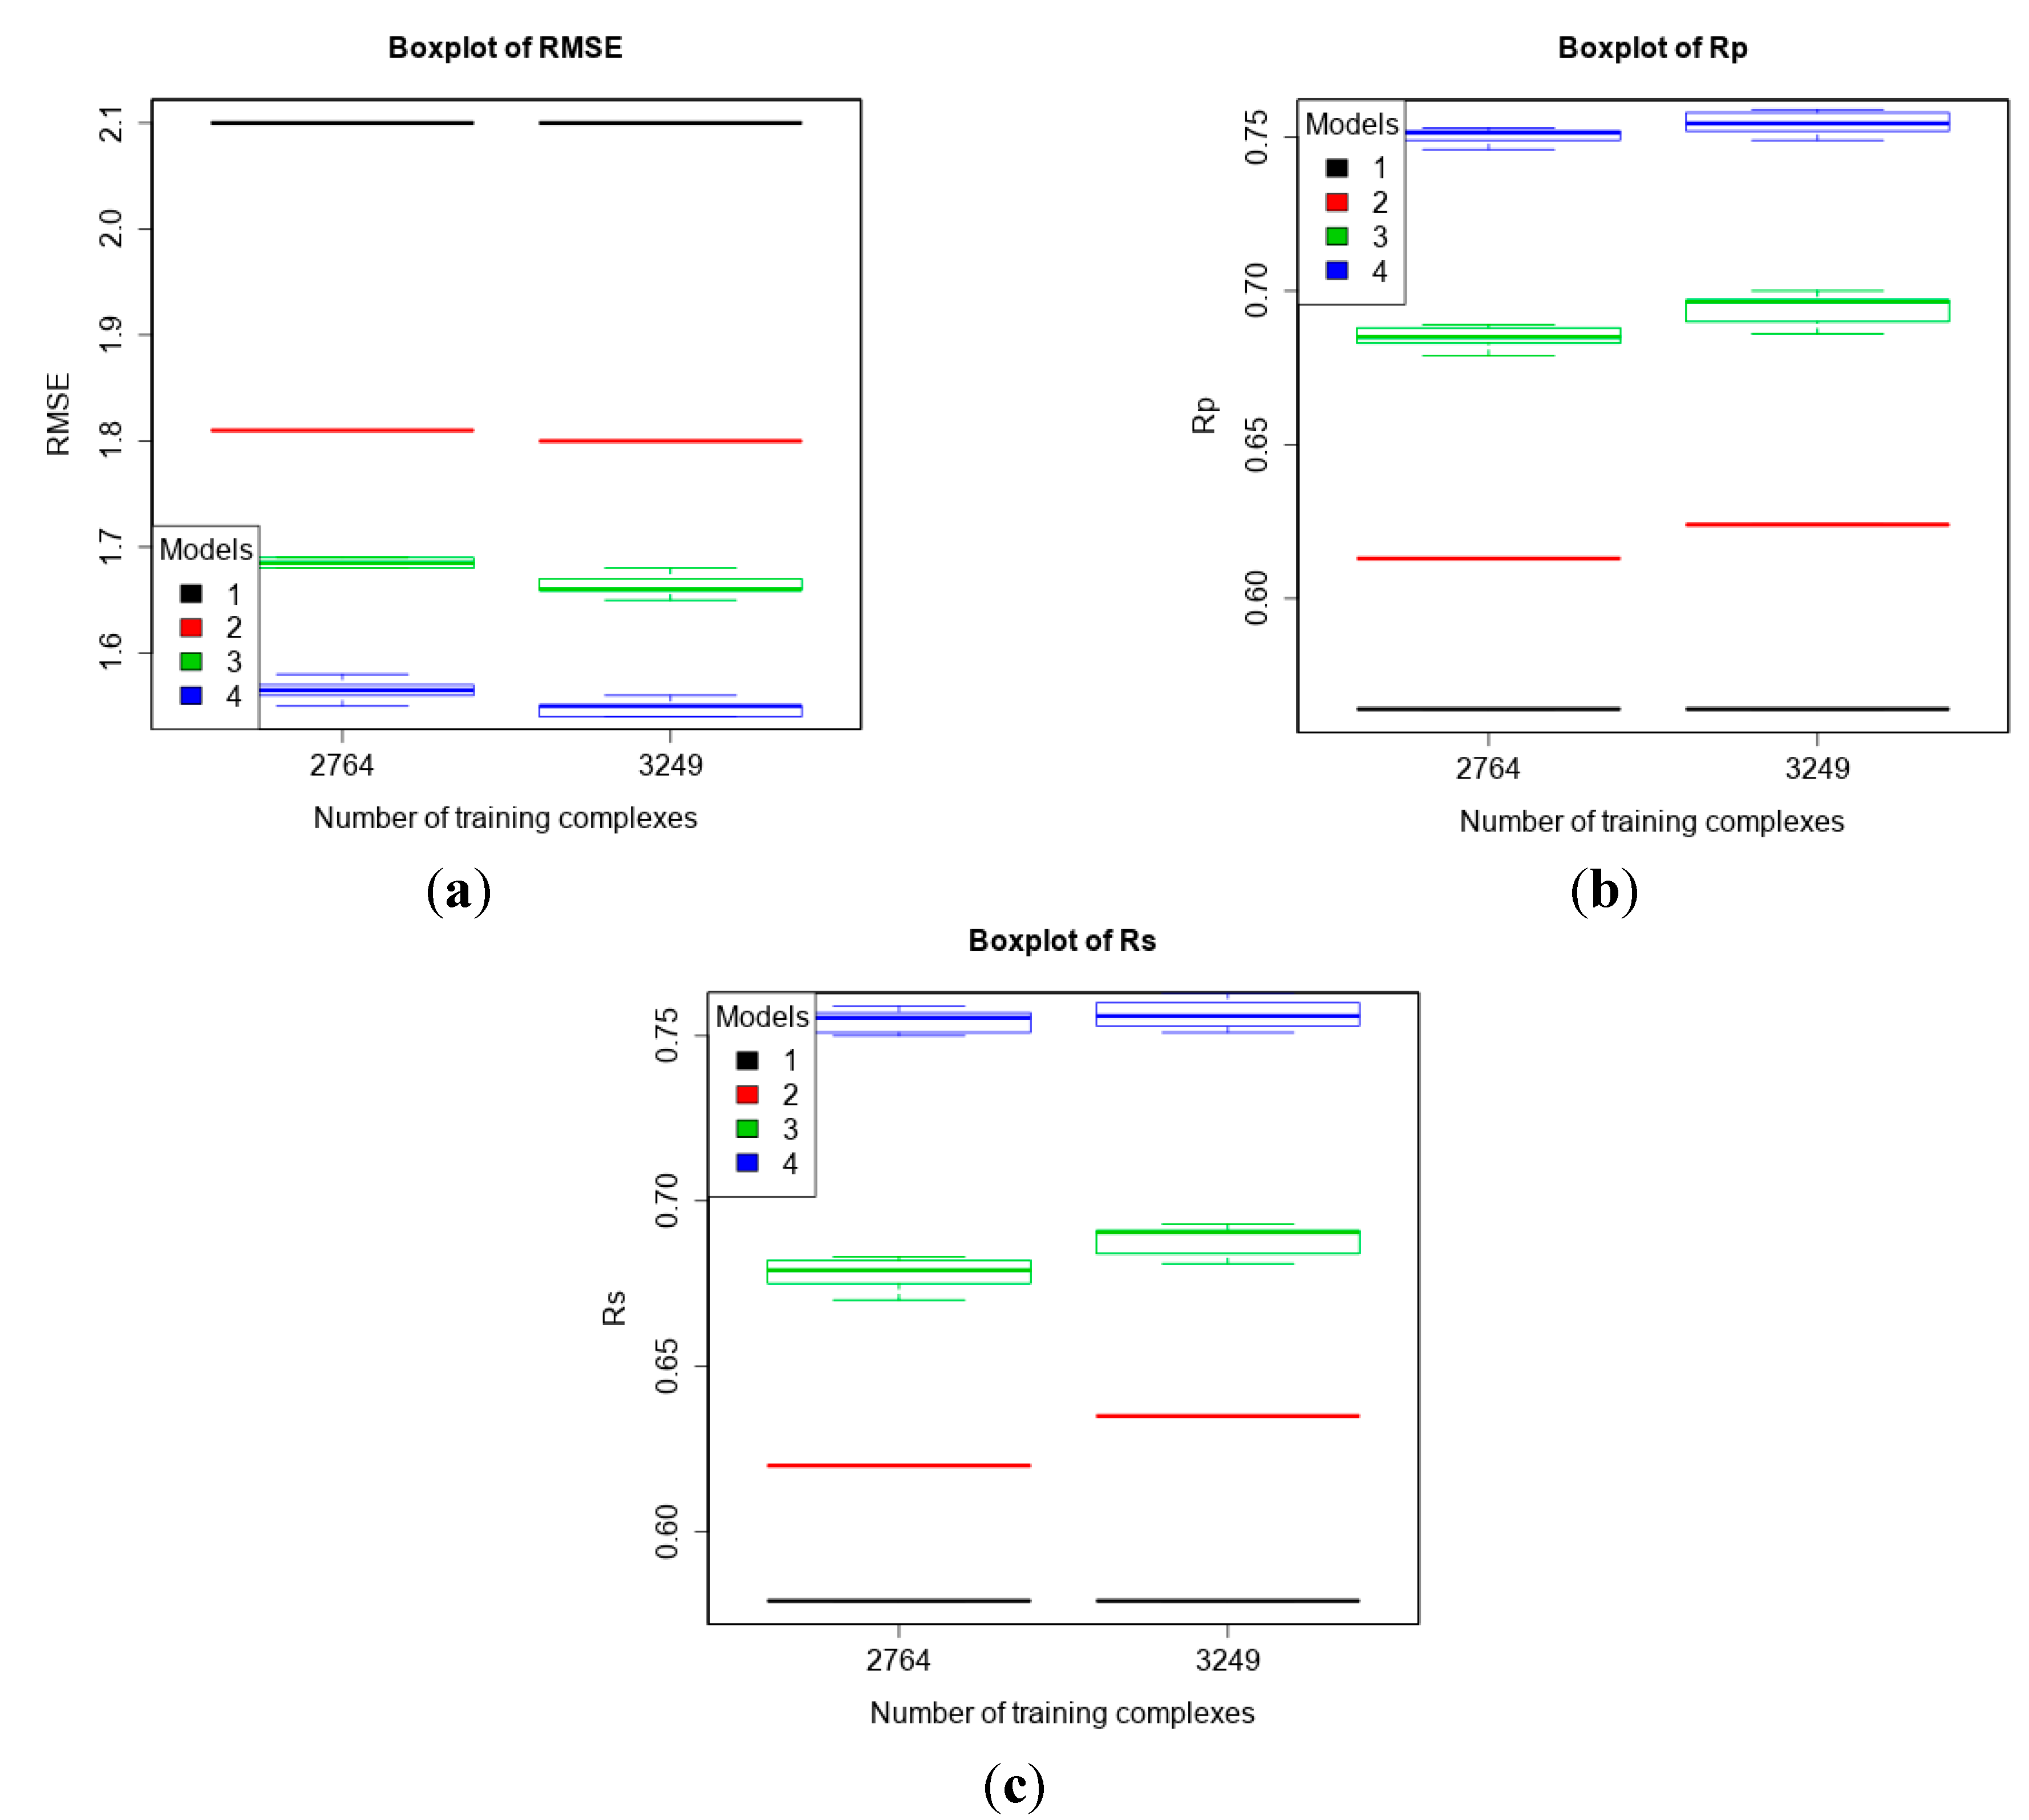
| 3 | core13 (195) | refined13\core13 (2764) refined14\core13 (3249) | To compare machine-learning SFs to classical SFs on CASF-2013. |
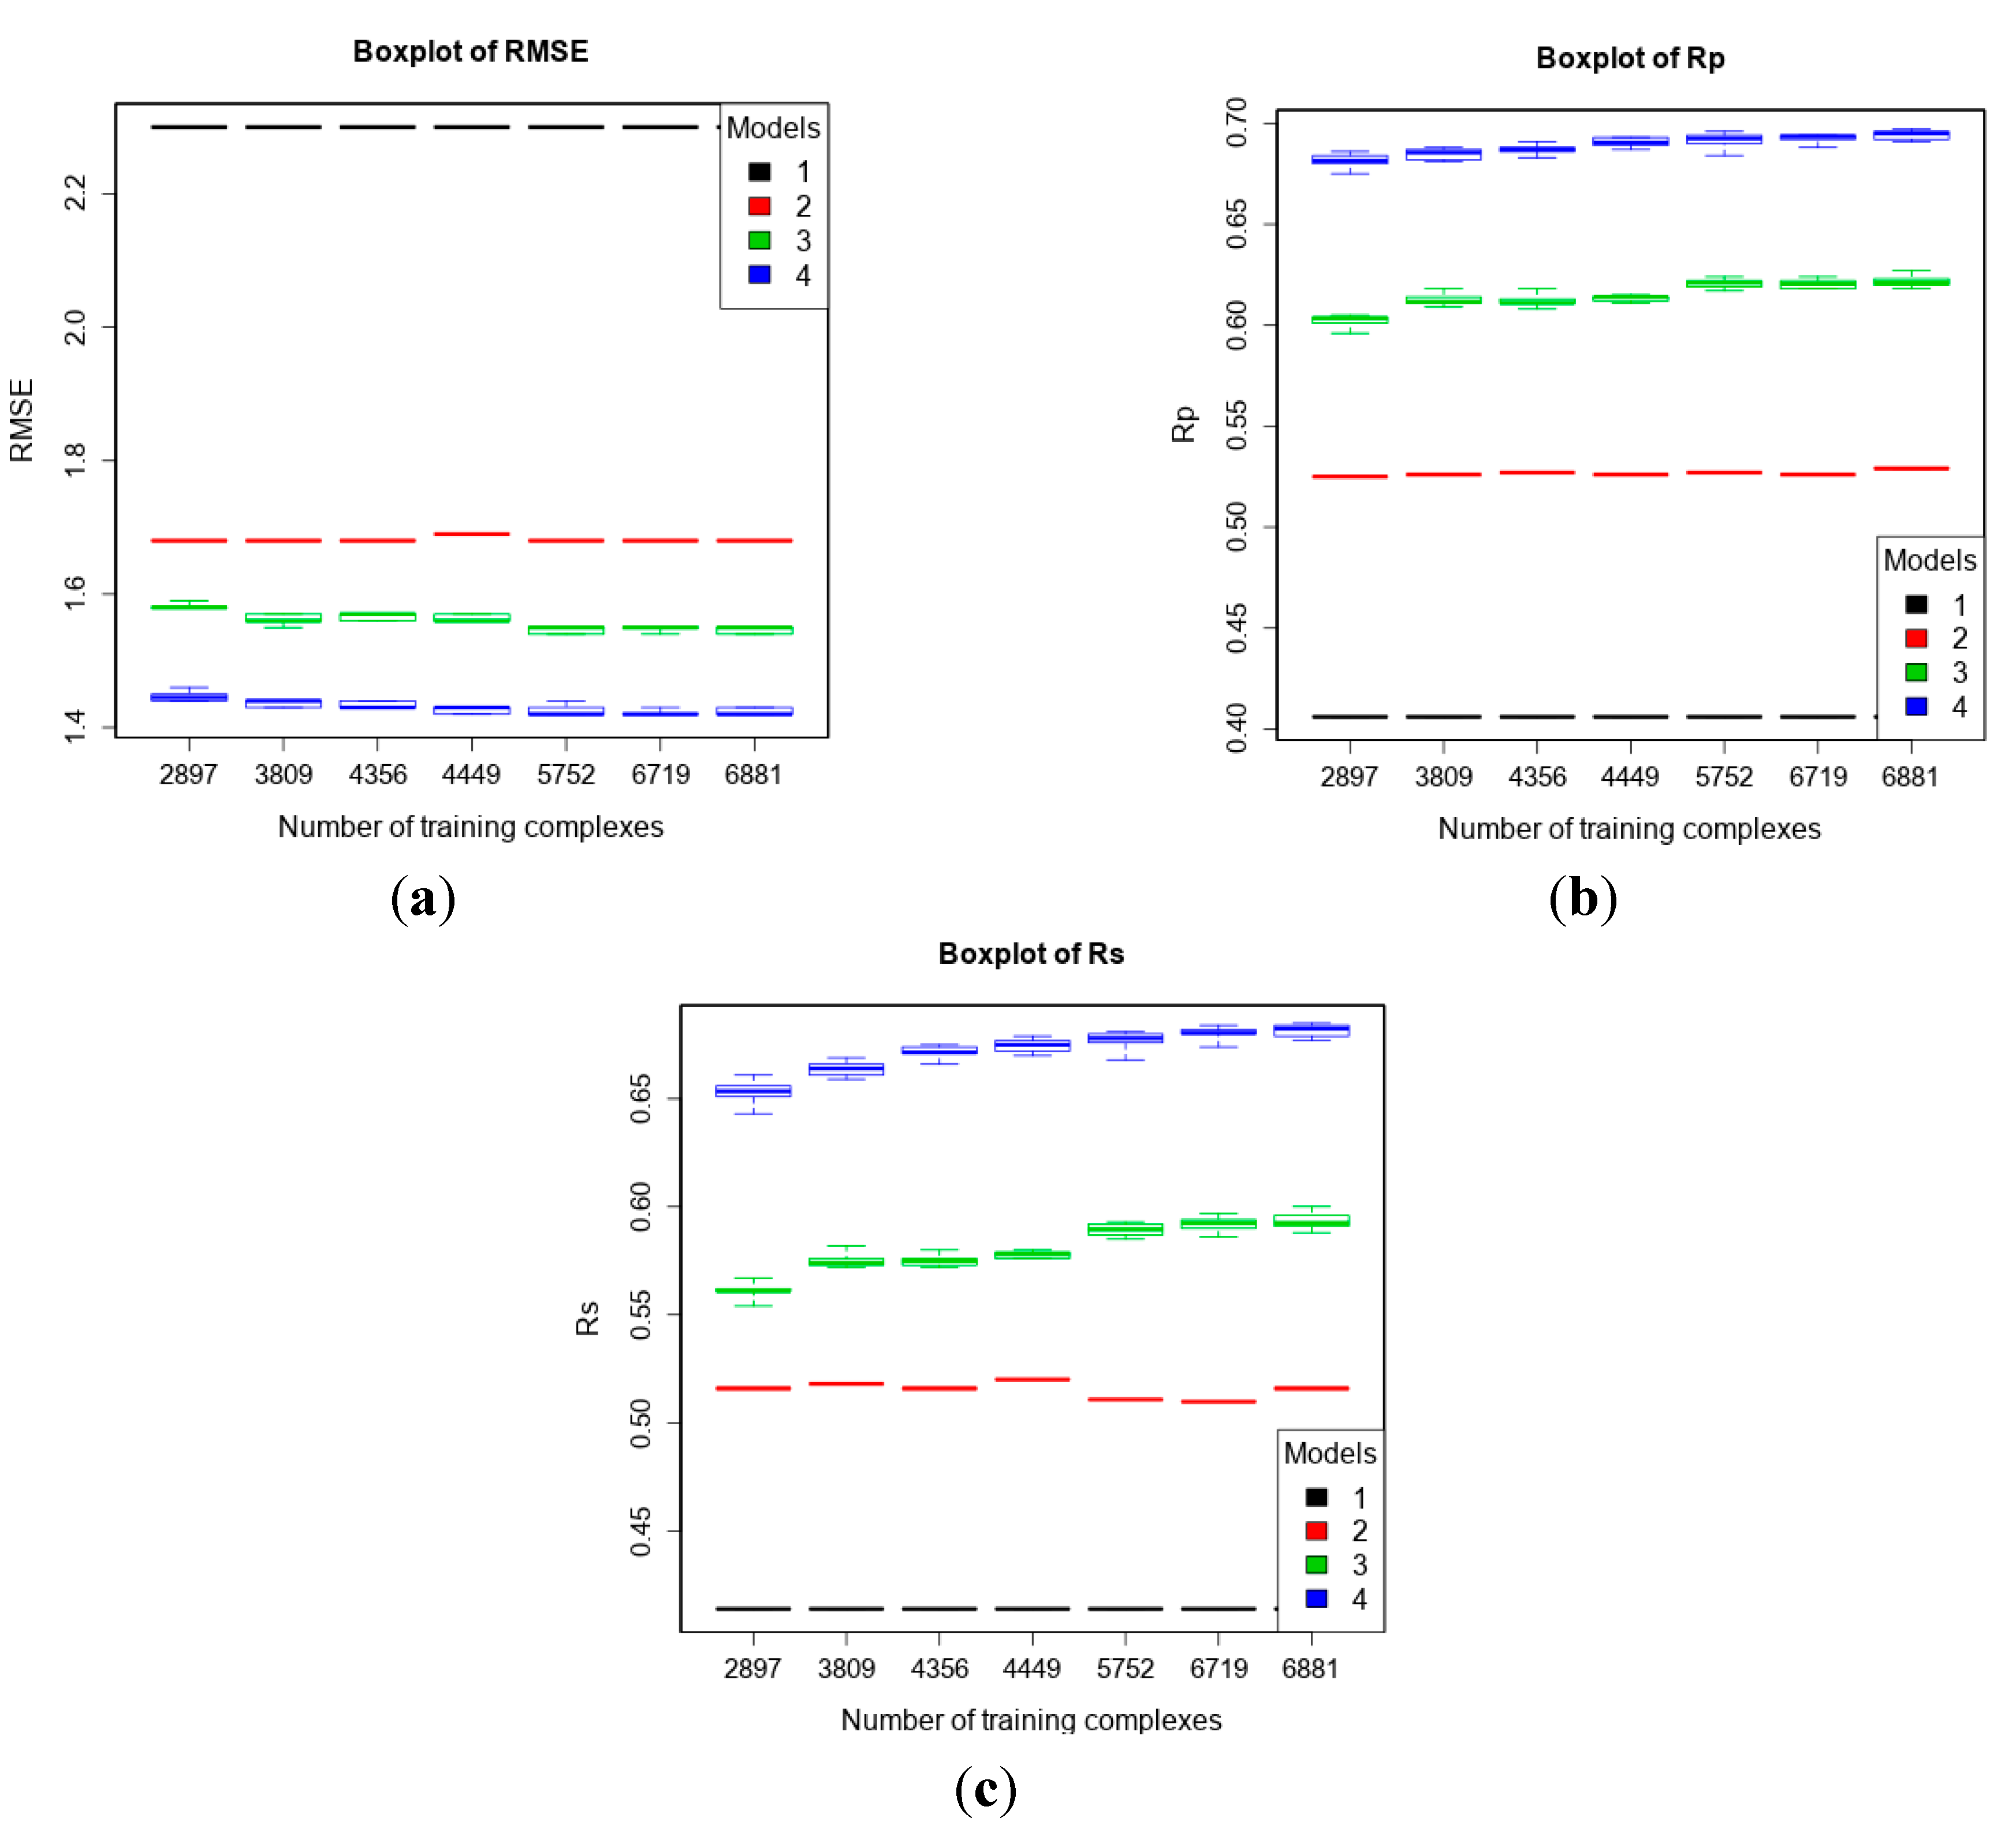
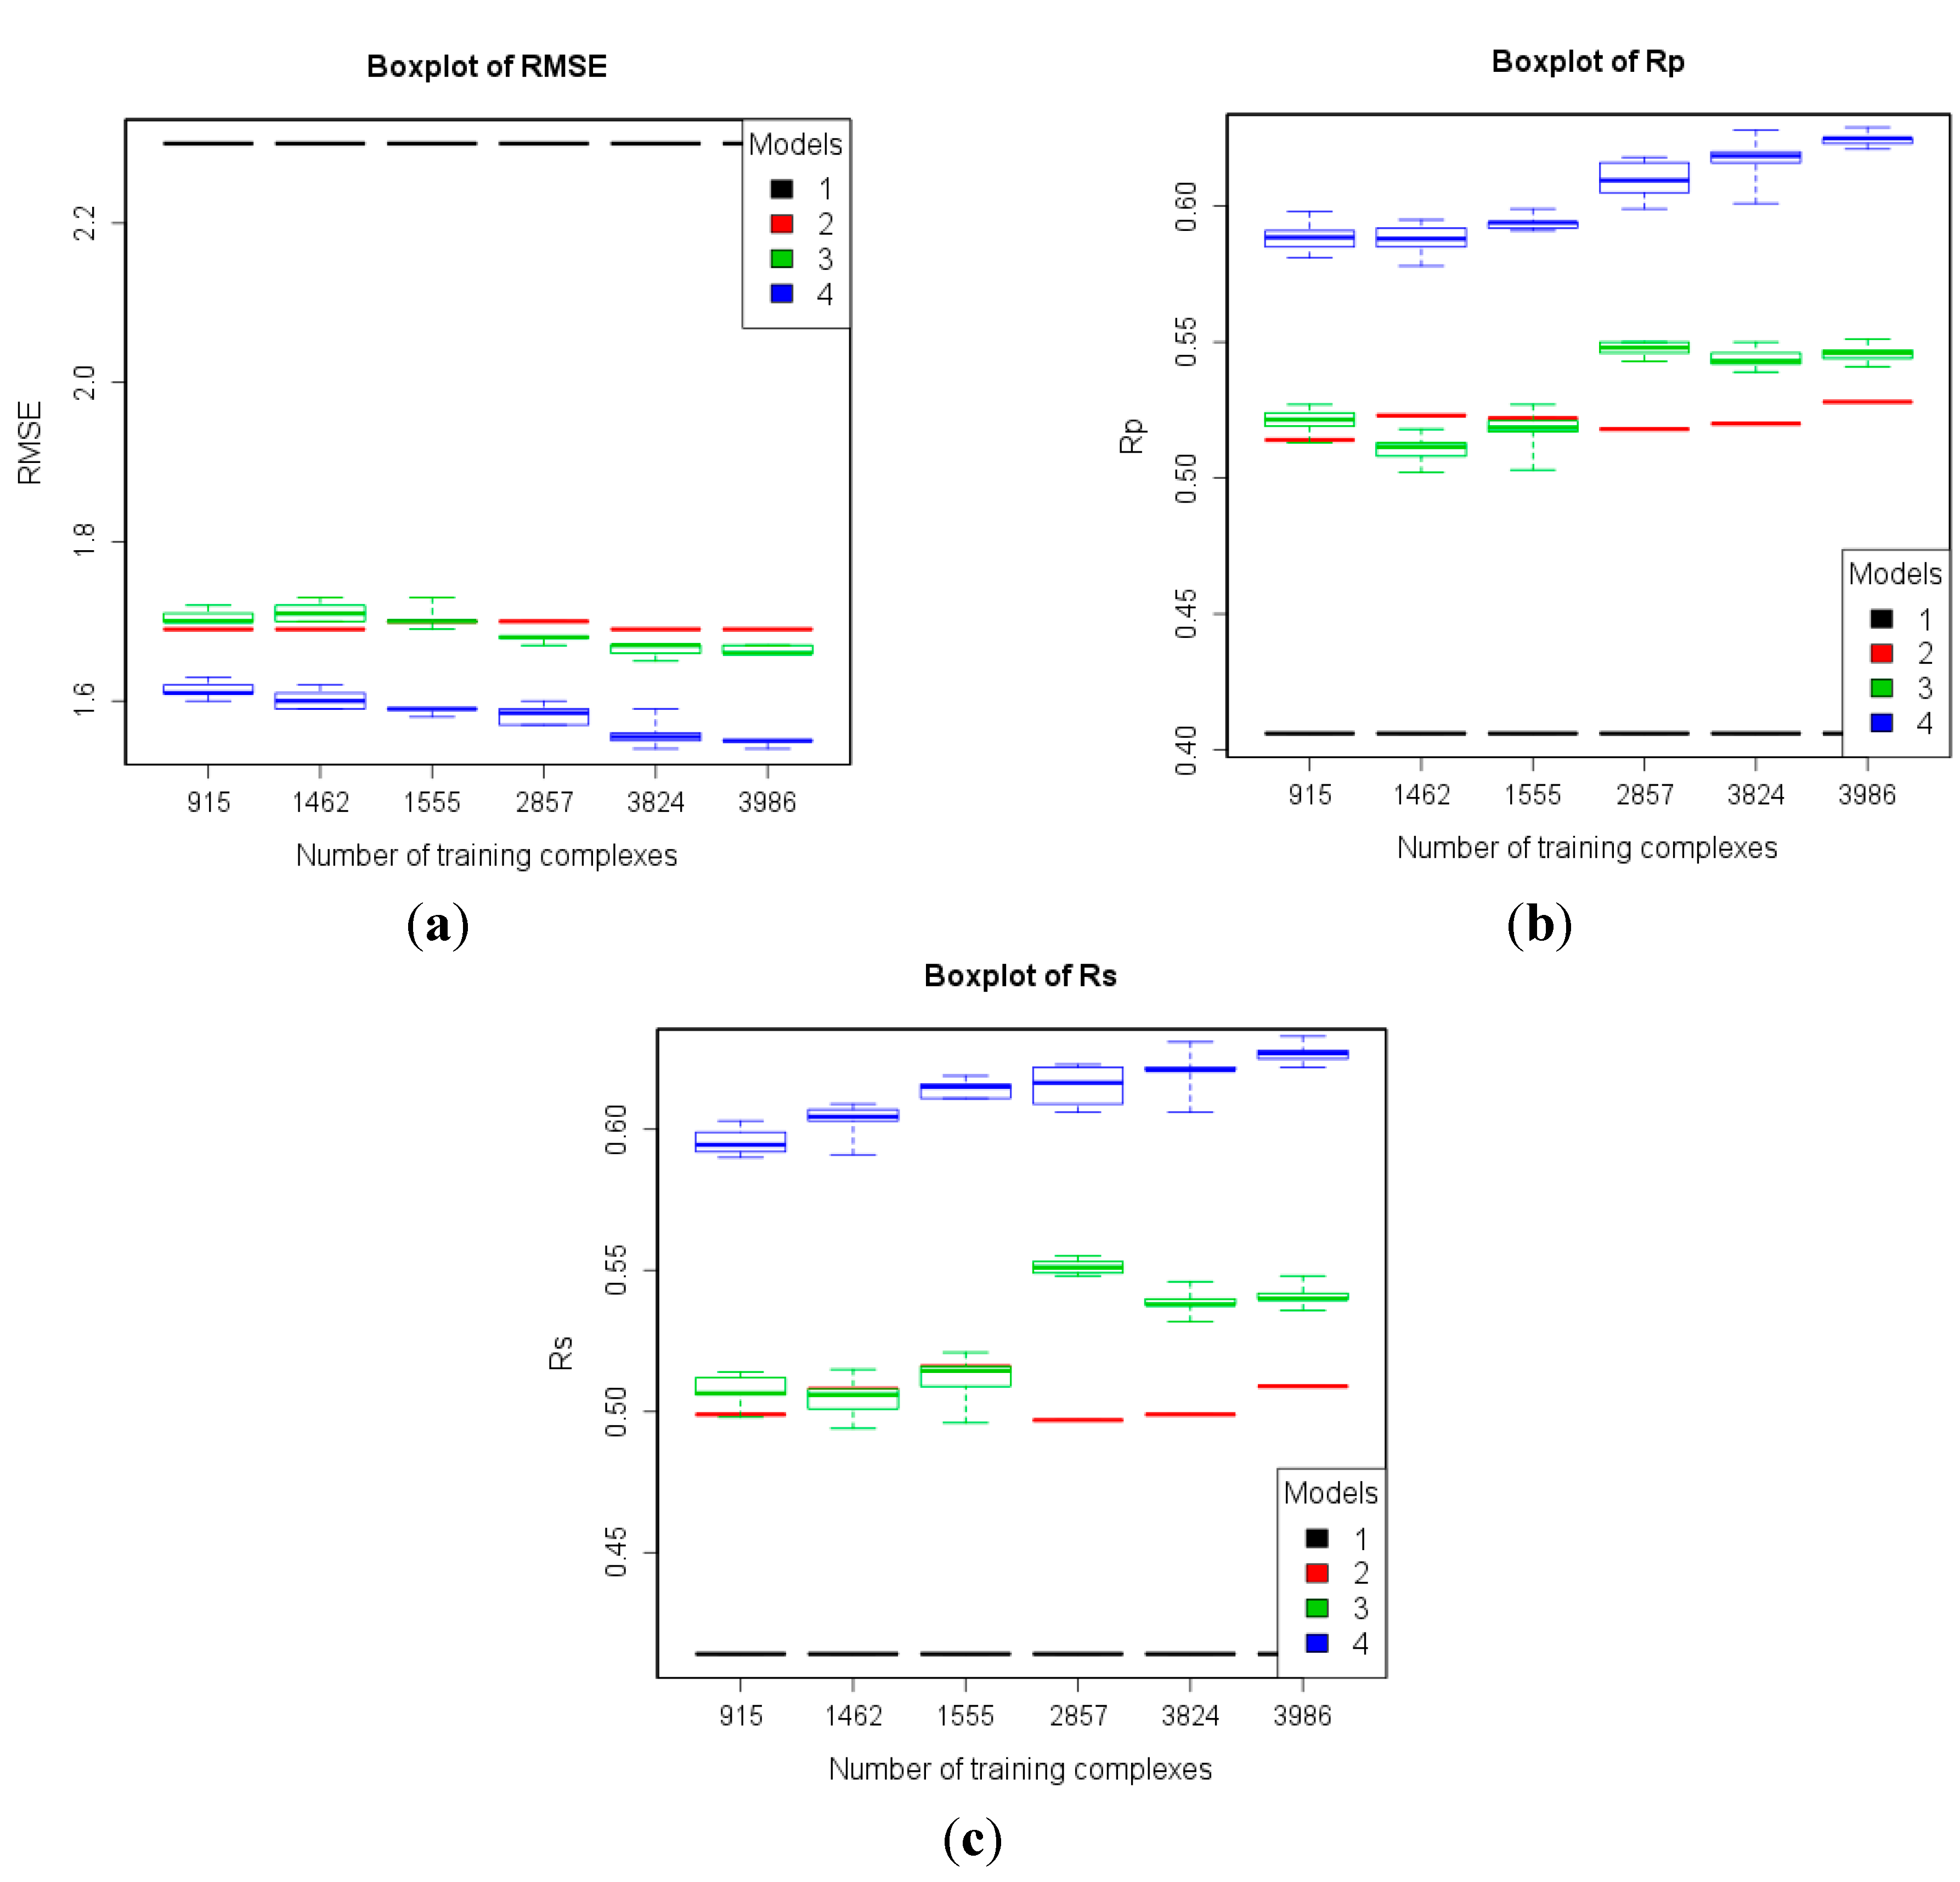
| 4 | refined13\refined12 (382) | refined12 (2897) general12_Kd/KiOnly ≤ 2.5 Å (3809) general12_Kd/KiOnly ≤ 3.0 Å (4356) general12_Kd/KiOnly (4449) general12 ≤ 2.5 Å (5752) general12 ≤ 3.0 Å (6719) general12 (6881) | To investigate how performance changes when adding low-quality training data. |
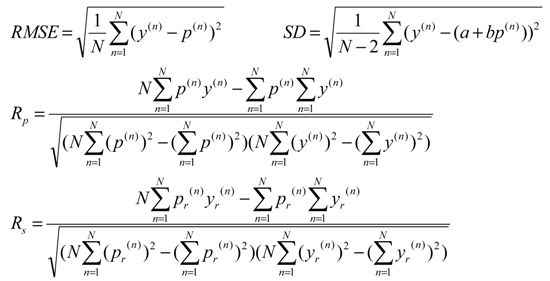
2.3. Performance Measures
3. Results and Discussion
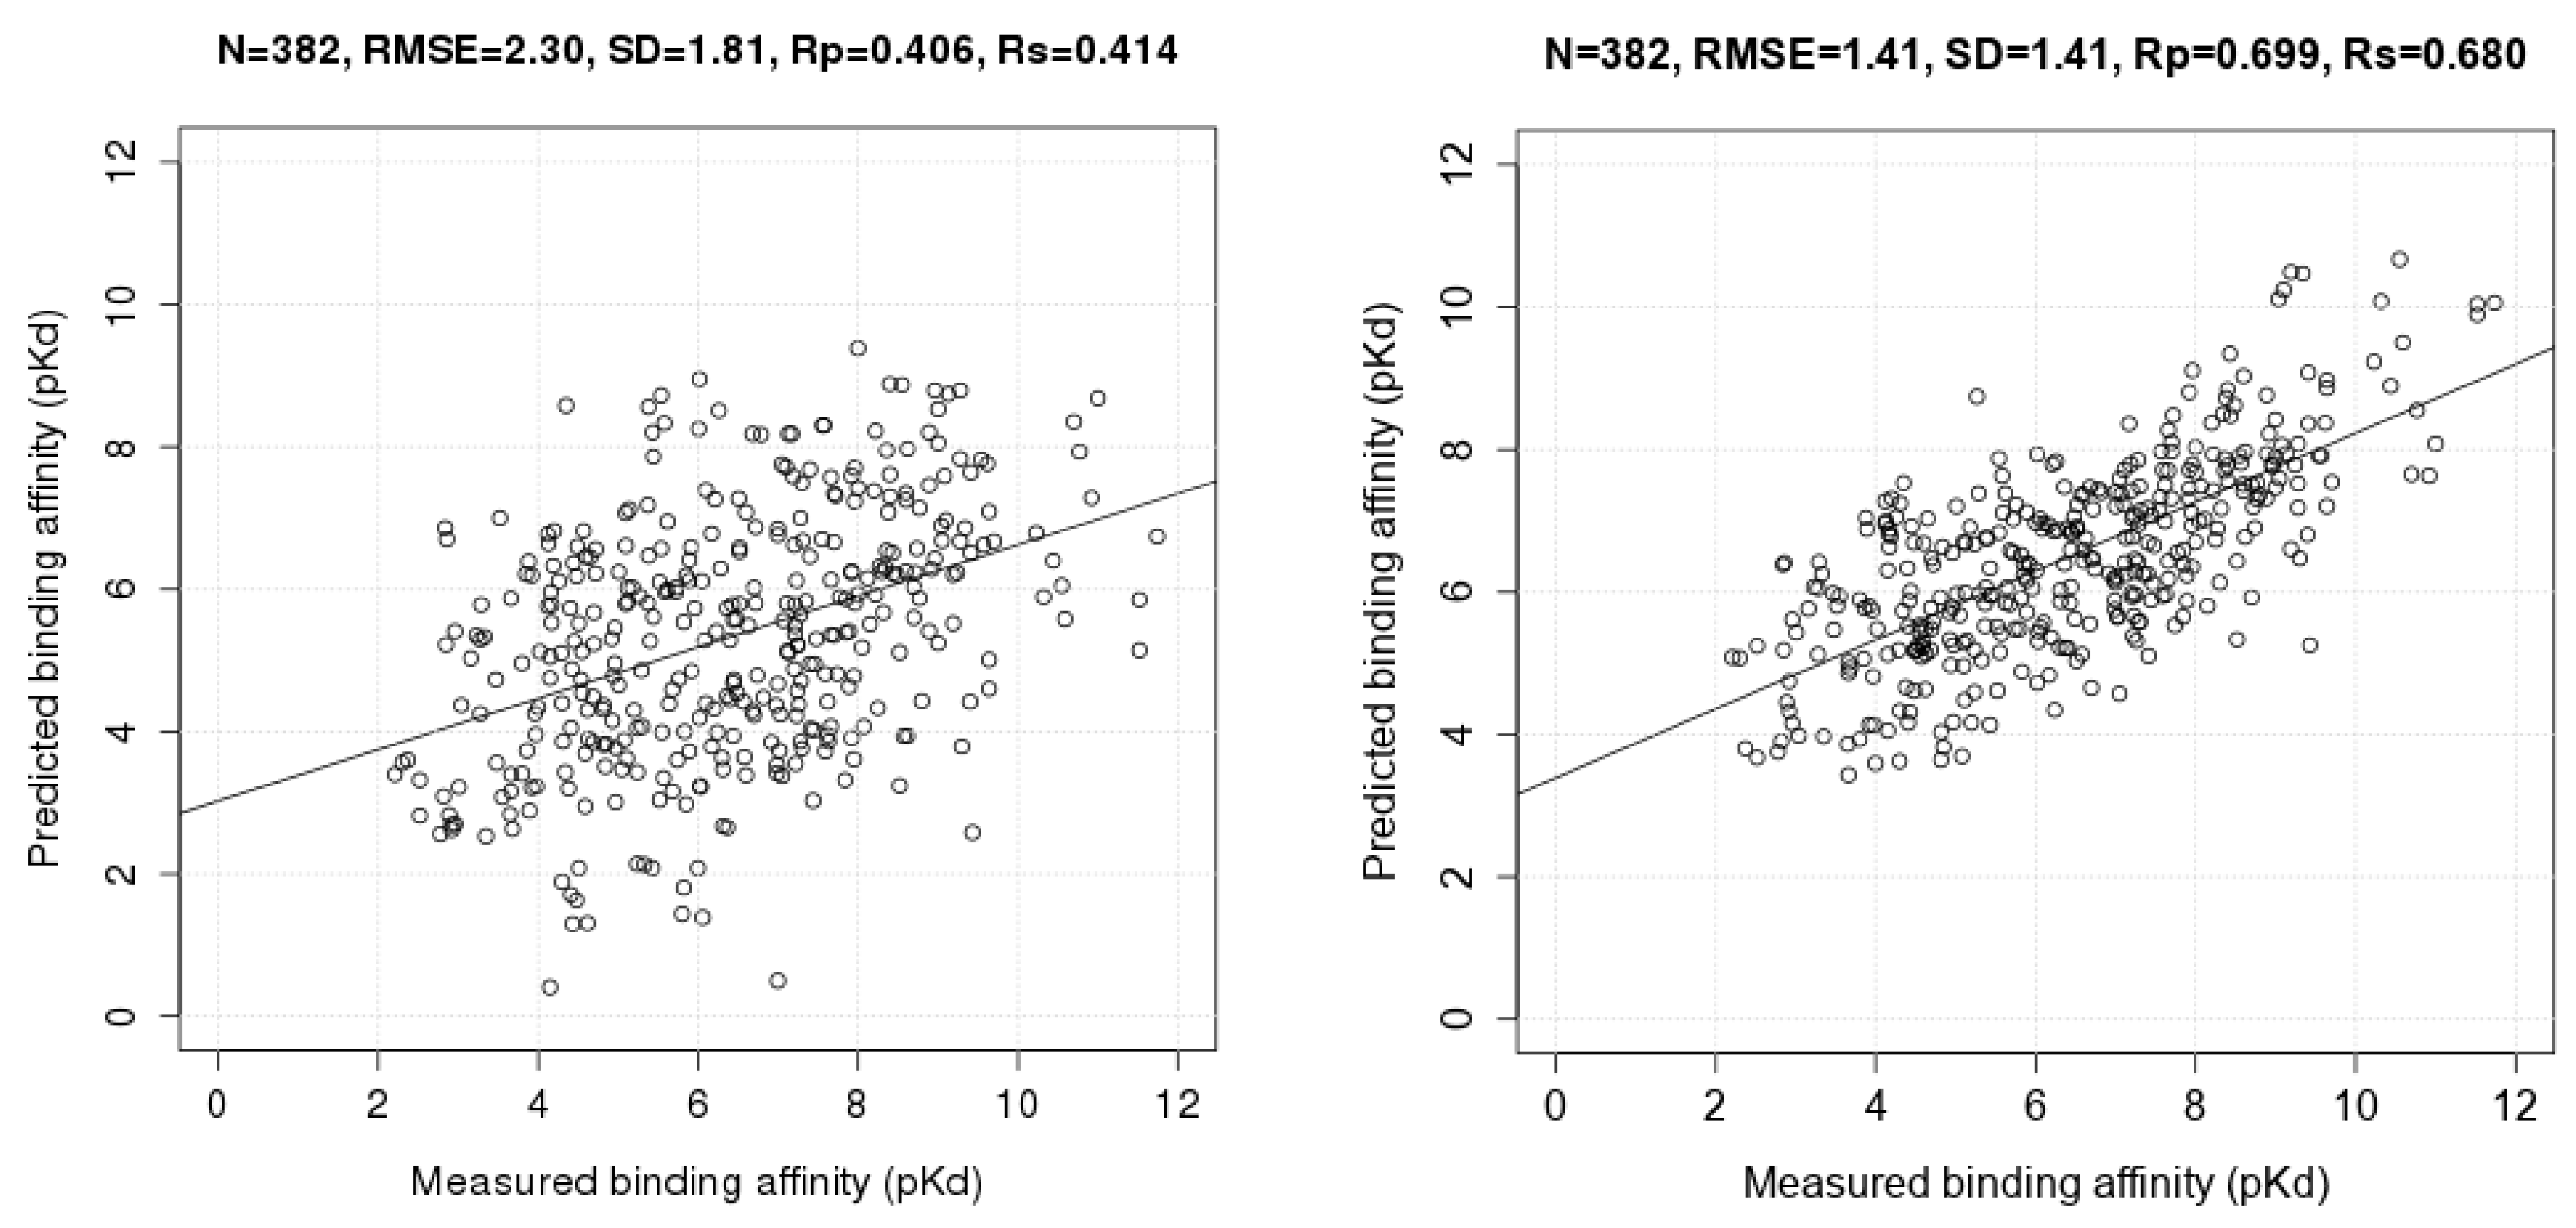
3.1. Evaluating RF-Score-v3 in a Blind Test on New Data Released in 2014
3.2. Training with New High-Quality Data Stills Improves Predictive Performance


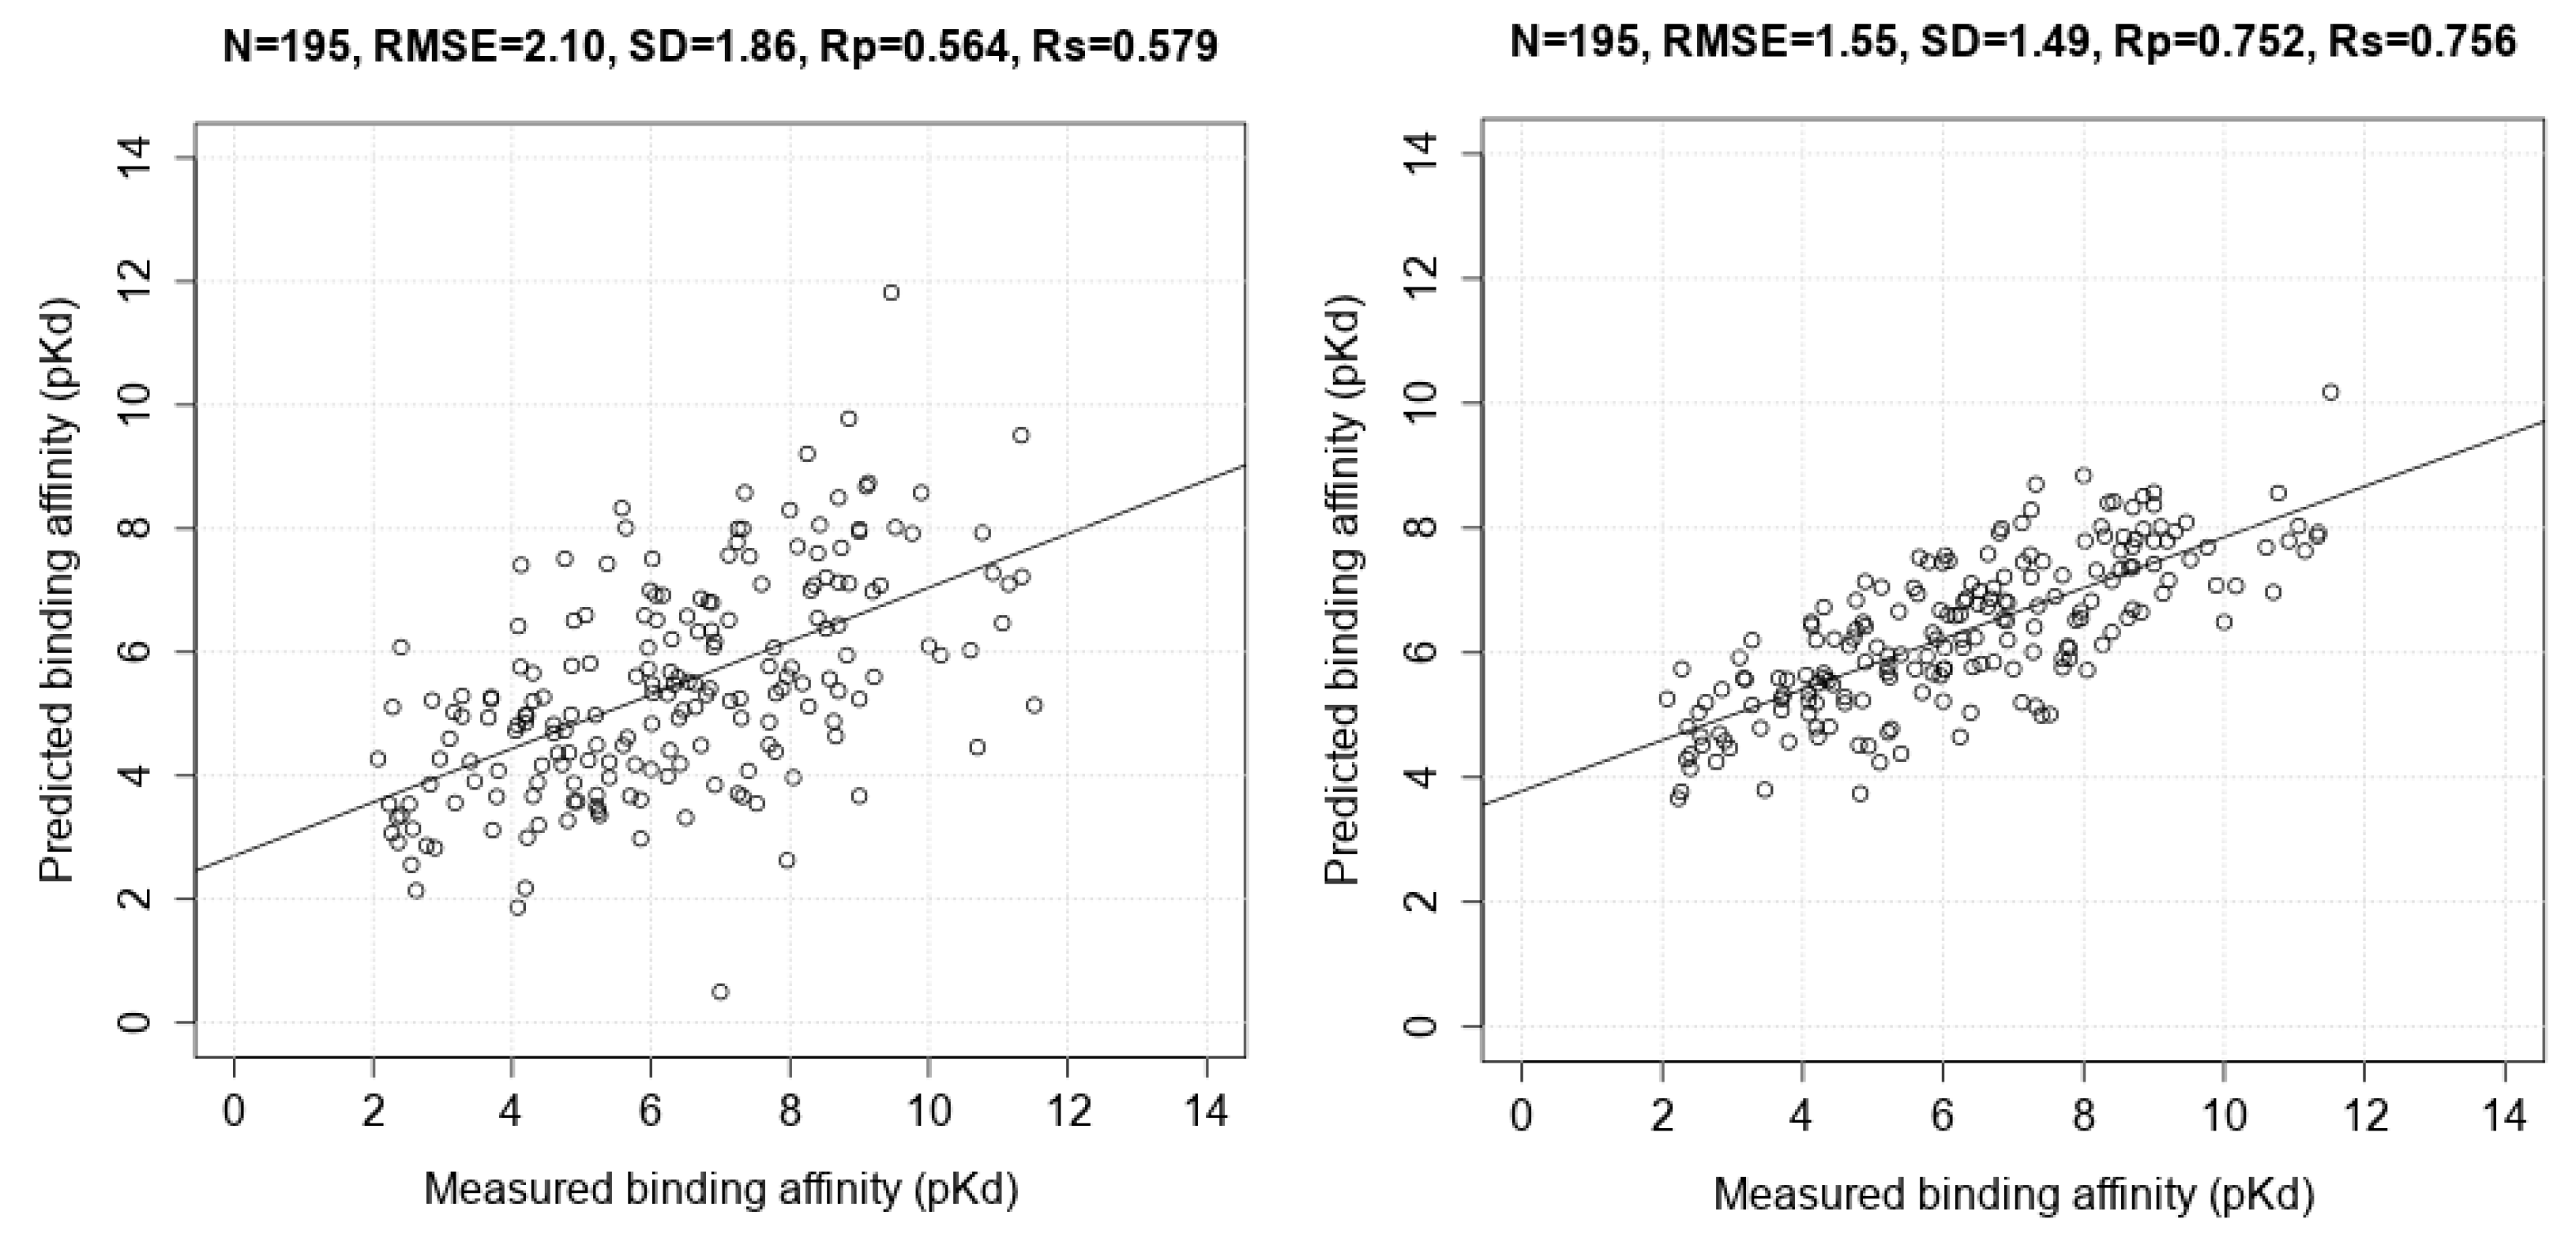
3.3. Comparing Machine-Learning SFs to More Classical SFs on CASF-2013

| Scoring Function | N | Rp | SD |
|---|---|---|---|
| RF::VinaElem | 195 | 0.752 | 1.49 |
| X-ScoreHM | 195 | 0.614 | 1.78 |
| ΔSAS | 195 | 0.606 | 1.79 |
| ChemScore@SYBYL | 195 | 0.592 | 1.82 |
| ChemPLP@GOLD | 195 | 0.579 | 1.84 |
| PLP1@DS | 195 | 0.568 | 1.86 |
| AutoDock Vina | 195 | 0.564 | 1.86 |
| G-Score@SYBYL | 195 | 0.558 | 1.87 |
| ASP@GOLD | 195 | 0.556 | 1.88 |
| ASE@MOE | 195 | 0.544 | 1.89 |
| ChemScore@GOLD | 189 | 0.536 | 1.90 |
| D-Score@SYBYL | 195 | 0.526 | 1.92 |
| Alpha-HB@MOE | 195 | 0.511 | 1.94 |
| LUDI3@DS | 195 | 0.487 | 1.97 |
| GoldScore@GOLD | 189 | 0.483 | 1.97 |
| Affinity-dG@MOE | 195 | 0.482 | 1.98 |
| NHA | 195 | 0.478 | 1.98 |
| MWT | 195 | 0.473 | 1.99 |
| LigScore2@DS | 190 | 0.456 | 2.02 |
| GlideScore-SP | 169 | 0.452 | 2.03 |
| Jain@DS | 191 | 0.408 | 2.05 |
| PMF@DS | 194 | 0.364 | 2.11 |
| GlideScore-XP | 164 | 0.277 | 2.18 |
| London-dG@MOE | 195 | 0.242 | 2.19 |
| PMF@SYBYL | 191 | 0.221 | 2.20 |
3.4. Training with Low-Quality Data also Improves Predictive Performance
4. Conclusions
Acknowledgments
Author Contributions
Conflicts of Interest
References
- Li, L.; Khanna, M.; Jo, I.; Wang, F.; Ashpole, N.M.; Hudmon, A.; Meroueh, S.O. Target-specific support vector machine scoring in structure-based virtual screening: computational validation, in vitro testing in kinases, and effects on lung cancer cell proliferation. J. Chem. Inf. Model. 2011, 51, 755–759. [Google Scholar] [CrossRef] [PubMed]
- Durrant, J.D.; McCammon, J.A. NNScore 2.0: A Neural-Network Receptor-Ligand Scoring Function. J. Chem. Inf. Model. 2011, 51, 2897–2903. [Google Scholar] [CrossRef] [PubMed]
- Ding, B.; Wang, J.; Li, N.; Wang, W. Characterization of Small Molecule Binding. I. Accurate Identification of Strong Inhibitors in Virtual Screening. J. Chem. Inf. Model. 2013, 53, 114–122. [Google Scholar] [CrossRef] [PubMed]
- Ballester, P.J.; Mitchell, J.B.O. A machine learning approach to predicting protein-ligand binding affinity with applications to molecular docking. Bioinformatics 2010, 26, 1169–1175. [Google Scholar] [CrossRef] [PubMed]
- Li, L.; Wang, B.; Meroueh, S.O. Support vector regression scoring of receptor-ligand complexes for rank-ordering and virtual screening of chemical libraries. J. Chem. Inf. Model. 2011, 51, 2132–2138. [Google Scholar] [CrossRef] [PubMed]
- Li, G.B.; Yang, L.L.; Wang, W.J.; Li, L.L.; Yang, S.Y. ID-Score: A New Empirical Scoring Function Based on a Comprehensive Set of Descriptors Related to Protein-Ligand Interactions. J. Chem. Inf. Model. 2013, 53, 592–600. [Google Scholar] [CrossRef] [PubMed]
- Liu, Q.; Kwoh, C.K.; Li, J. Binding Affinity Prediction for Protein-Ligand Complexes Based on β Contacts and B Factor. J. Chem. Inf. Model. 2013, 53, 3076–3085. [Google Scholar] [CrossRef] [PubMed]
- Schreyer, A.; Blundell, T. CREDO: A Protein-Ligand Interaction Database for Drug Discovery. Chem. Biol. Drug Des. 2009, 73, 157–167. [Google Scholar] [CrossRef] [PubMed]
- Lahti, J.L.; Tang, G.W.; Capriotti, E.; Liu, T.; Altman, R.B. Bioinformatics and Variability in Drug Response: A Protein Structural Perspective. J. R. Soc. Interface 2012, 9, 1409–1437. [Google Scholar] [CrossRef] [PubMed]
- Wang, R.; Fang, X.; Lu, Y.; Wang, S. The PDBbind Database: Collection of Binding Affinities for Protein-Ligand Complexes with Known Three-Dimensional Structures. J. Med. Chem 2004, 47, 2977–2980. [Google Scholar] [CrossRef] [PubMed]
- Li, H.; Leung, K.S.; Wong, M.H.; Ballester, P.J. Improving AutoDock Vina Using Random Forest: The Growing Accuracy of Binding Affinity Prediction by the Effective Exploitation of Larger Data Sets. Mol. Inform. 2015, 34, 115–126. [Google Scholar] [CrossRef]
- Breiman, L. Random Forests. Mach. Learn. 2001, 45, 5–32. [Google Scholar] [CrossRef]
- Ballester, P.J. Machine Learning Scoring Functions based on Random Forest and Support Vector Regression. Lect. Notes Bioinform. 2012, 7632, 14–25. [Google Scholar]
- Ballester, P.J.; Mangold, M.; Howard, N.I.; Marchese Robinson, R.L.; Abell, C.; Blumberger, J.; Mitchell, J.B.O. Hierarchical virtual screening for the discovery of new molecular scaffolds in antibacterial hit identification. J. R. Soc. Interface 2012, 9, 3196–3207. [Google Scholar] [CrossRef] [PubMed]
- Li, H.; Leung, K.-S.; Ballester, P.J.; Wong, M.-H. istar: A Web Platform for Large-Scale Protein-Ligand Docking. PLoS ONE 2014, 9, e85678. [Google Scholar] [CrossRef] [PubMed]
- Li, H.; Leung, K.-S.; Wong, M.-H.; Ballester, P.J. Substituting random forest for multiple linear regression improves binding affinity prediction of scoring functions: Cyscore as a case study. BMC Bioinform. 2014. [Google Scholar] [CrossRef] [PubMed]
- Ballester, P.J.; Schreyer, A.; Blundell, T.L. Does a More Precise Chemical Description of Protein-Ligand Complexes Lead to More Accurate Prediction of Binding Affinity? J. Chem. Inf. Model. 2014, 54, 944–955. [Google Scholar] [CrossRef] [PubMed]
- Warren, G.L.; Do, T.D.; Kelley, B.P.; Nicholls, A.; Warren, S.D. Essential considerations for using protein-ligand structures in drug discovery. Drug Discov. Today 2012, 17, 1270–1281. [Google Scholar] [CrossRef] [PubMed]
- Cheng, T.; Li, X.; Li, Y.; Liu, Z.; Wang, R. Comparative Assessment of Scoring Functions on a Diverse Test Set. J. Chem. Inf. Model. 2009, 49, 1079–1093. [Google Scholar] [CrossRef] [PubMed]
- Li, Y.; Liu, Z.; Li, J.; Han, L.; Liu, J.; Zhao, Z.; Wang, R. Comparative assessment of scoring functions on an updated benchmark: 1. Compilation of the test set. J. Chem. Inf. Model. 2014, 54, 1700–1716. [Google Scholar] [CrossRef] [PubMed]
- Trott, O.; Olson, A.J. AutoDock Vina: Improving the speed and accuracy of docking with a new scoring function, efficient optimization, and multithreading. J. Comput. Chem. 2010, 31, 455–461. [Google Scholar] [CrossRef] [PubMed]
- Ballester, P.J.; Mitchell, J.B.O. Comments on “leave-cluster-out cross-validation is appropriate for scoring functions derived from diverse protein data sets”: Significance for the validation of scoring functions. J. Chem. Inf. Model. 2011, 51, 1739–1741. [Google Scholar] [CrossRef] [PubMed]
- Li, Y.; Han, L.; Liu, Z.; Wang, R. Comparative assessment of scoring functions on an updated benchmark: 2. Evaluation methods and general results. J. Chem. Inf. Model. 2014, 54, 1717–1736. [Google Scholar] [CrossRef] [PubMed]
- Li, H.; Leung, K.S.; Wong, M.H.; Ballester, P. The impact of docking pose generation error on the prediction of binding affinity. In Lecture Notes in Bioinformatics; Springer: Cambridge, UK, 2015; In Press. [Google Scholar]
- Sample Availability: Not Apply.
© 2015 by the authors. Licensee MDPI, Basel, Switzerland. This article is an open access article distributed under the terms and conditions of the Creative Commons Attribution license ( http://creativecommons.org/licenses/by/4.0/).
Share and Cite
Li, H.; Leung, K.-S.; Wong, M.-H.; Ballester, P.J. Low-Quality Structural and Interaction Data Improves Binding Affinity Prediction via Random Forest. Molecules 2015, 20, 10947-10962. https://doi.org/10.3390/molecules200610947
Li H, Leung K-S, Wong M-H, Ballester PJ. Low-Quality Structural and Interaction Data Improves Binding Affinity Prediction via Random Forest. Molecules. 2015; 20(6):10947-10962. https://doi.org/10.3390/molecules200610947
Chicago/Turabian StyleLi, Hongjian, Kwong-Sak Leung, Man-Hon Wong, and Pedro J. Ballester. 2015. "Low-Quality Structural and Interaction Data Improves Binding Affinity Prediction via Random Forest" Molecules 20, no. 6: 10947-10962. https://doi.org/10.3390/molecules200610947
APA StyleLi, H., Leung, K.-S., Wong, M.-H., & Ballester, P. J. (2015). Low-Quality Structural and Interaction Data Improves Binding Affinity Prediction via Random Forest. Molecules, 20(6), 10947-10962. https://doi.org/10.3390/molecules200610947