
Caffeic Acid Phenethyl Ester and Ethanol Extract of Propolis Induce the Complementary Cytotoxic Effect on Triple-Negative Breast Cancer Cell Lines


 ,
, 
 ,
,  ,
,  ,
,
Abstract
:1. Introduction
2. Results and Discussion
2.1. The Chemical Characterization of Ethanol Extract of Propolis

| Identified Constituents in EEP | Chemical Structure | Retention Time Rt | Quantity of Crude Propolis (µg∙g−1) | Bioactivity |
|---|---|---|---|---|
| Cinnamic acid | 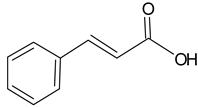 | 5.20 | 2432.4 | Antimicrobial [39] |
| p-Coumaric acid | 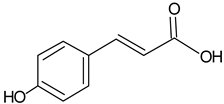 | 5.69 | 723.1 | Anti-oxidative [40] |
| Ferulic acid | 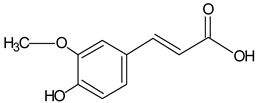 | 6.23 | 1559.2 | Antimicrobial [41] |
| Gallic acid | 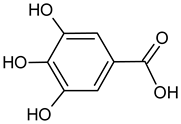 | 6.98 | 2041.6 | Antimicrobial [42] |
| Caffeic acid |  | 7.36 | 2317.3 | Bacteriostatic [42], anti-inflammatory [43] |
| Caffeic acid phenethyl ester (CAPE) | 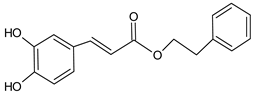 | 8.63 | 1356.2 | Anti-inflammatory [21], antiviral [20], anticancer [24,25] |
| Pinobanksin | 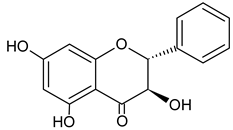 | 8.97 | nd | Antifungal [44] |
| Kaempferol | 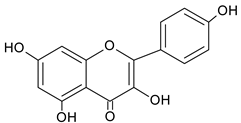 | 9.34 | 1874.6 | Anti-inflammatory [45] |
| Apigenin | 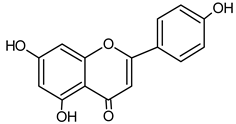 | 10.40 | 166.7 | Anti-allergic [46], anti-inflammatory [47] |
| Pinocembrin | 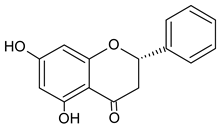 | 10.92 | 1557.2 | Antifungal [48] |
| Quercetin |  | 13.19 | 2047.9 | Antioxidative [49] |
| Chrysin | 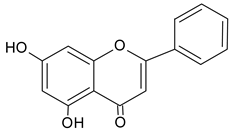 | 13.93 | 1147.3 | Anti-inflammatory, anticancer [50] |
| Galangin | 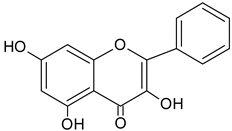 | 14.72 | 863.1 | Antioxidative [51], antimicrobial [52] |
| Acacetin | 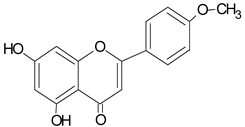 | 17.96 | 1007.2 | anti-inflammatory [53] |
| Kaempferide | 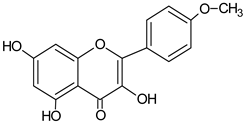 | 21.67 | nd | Antioxidative [54] |
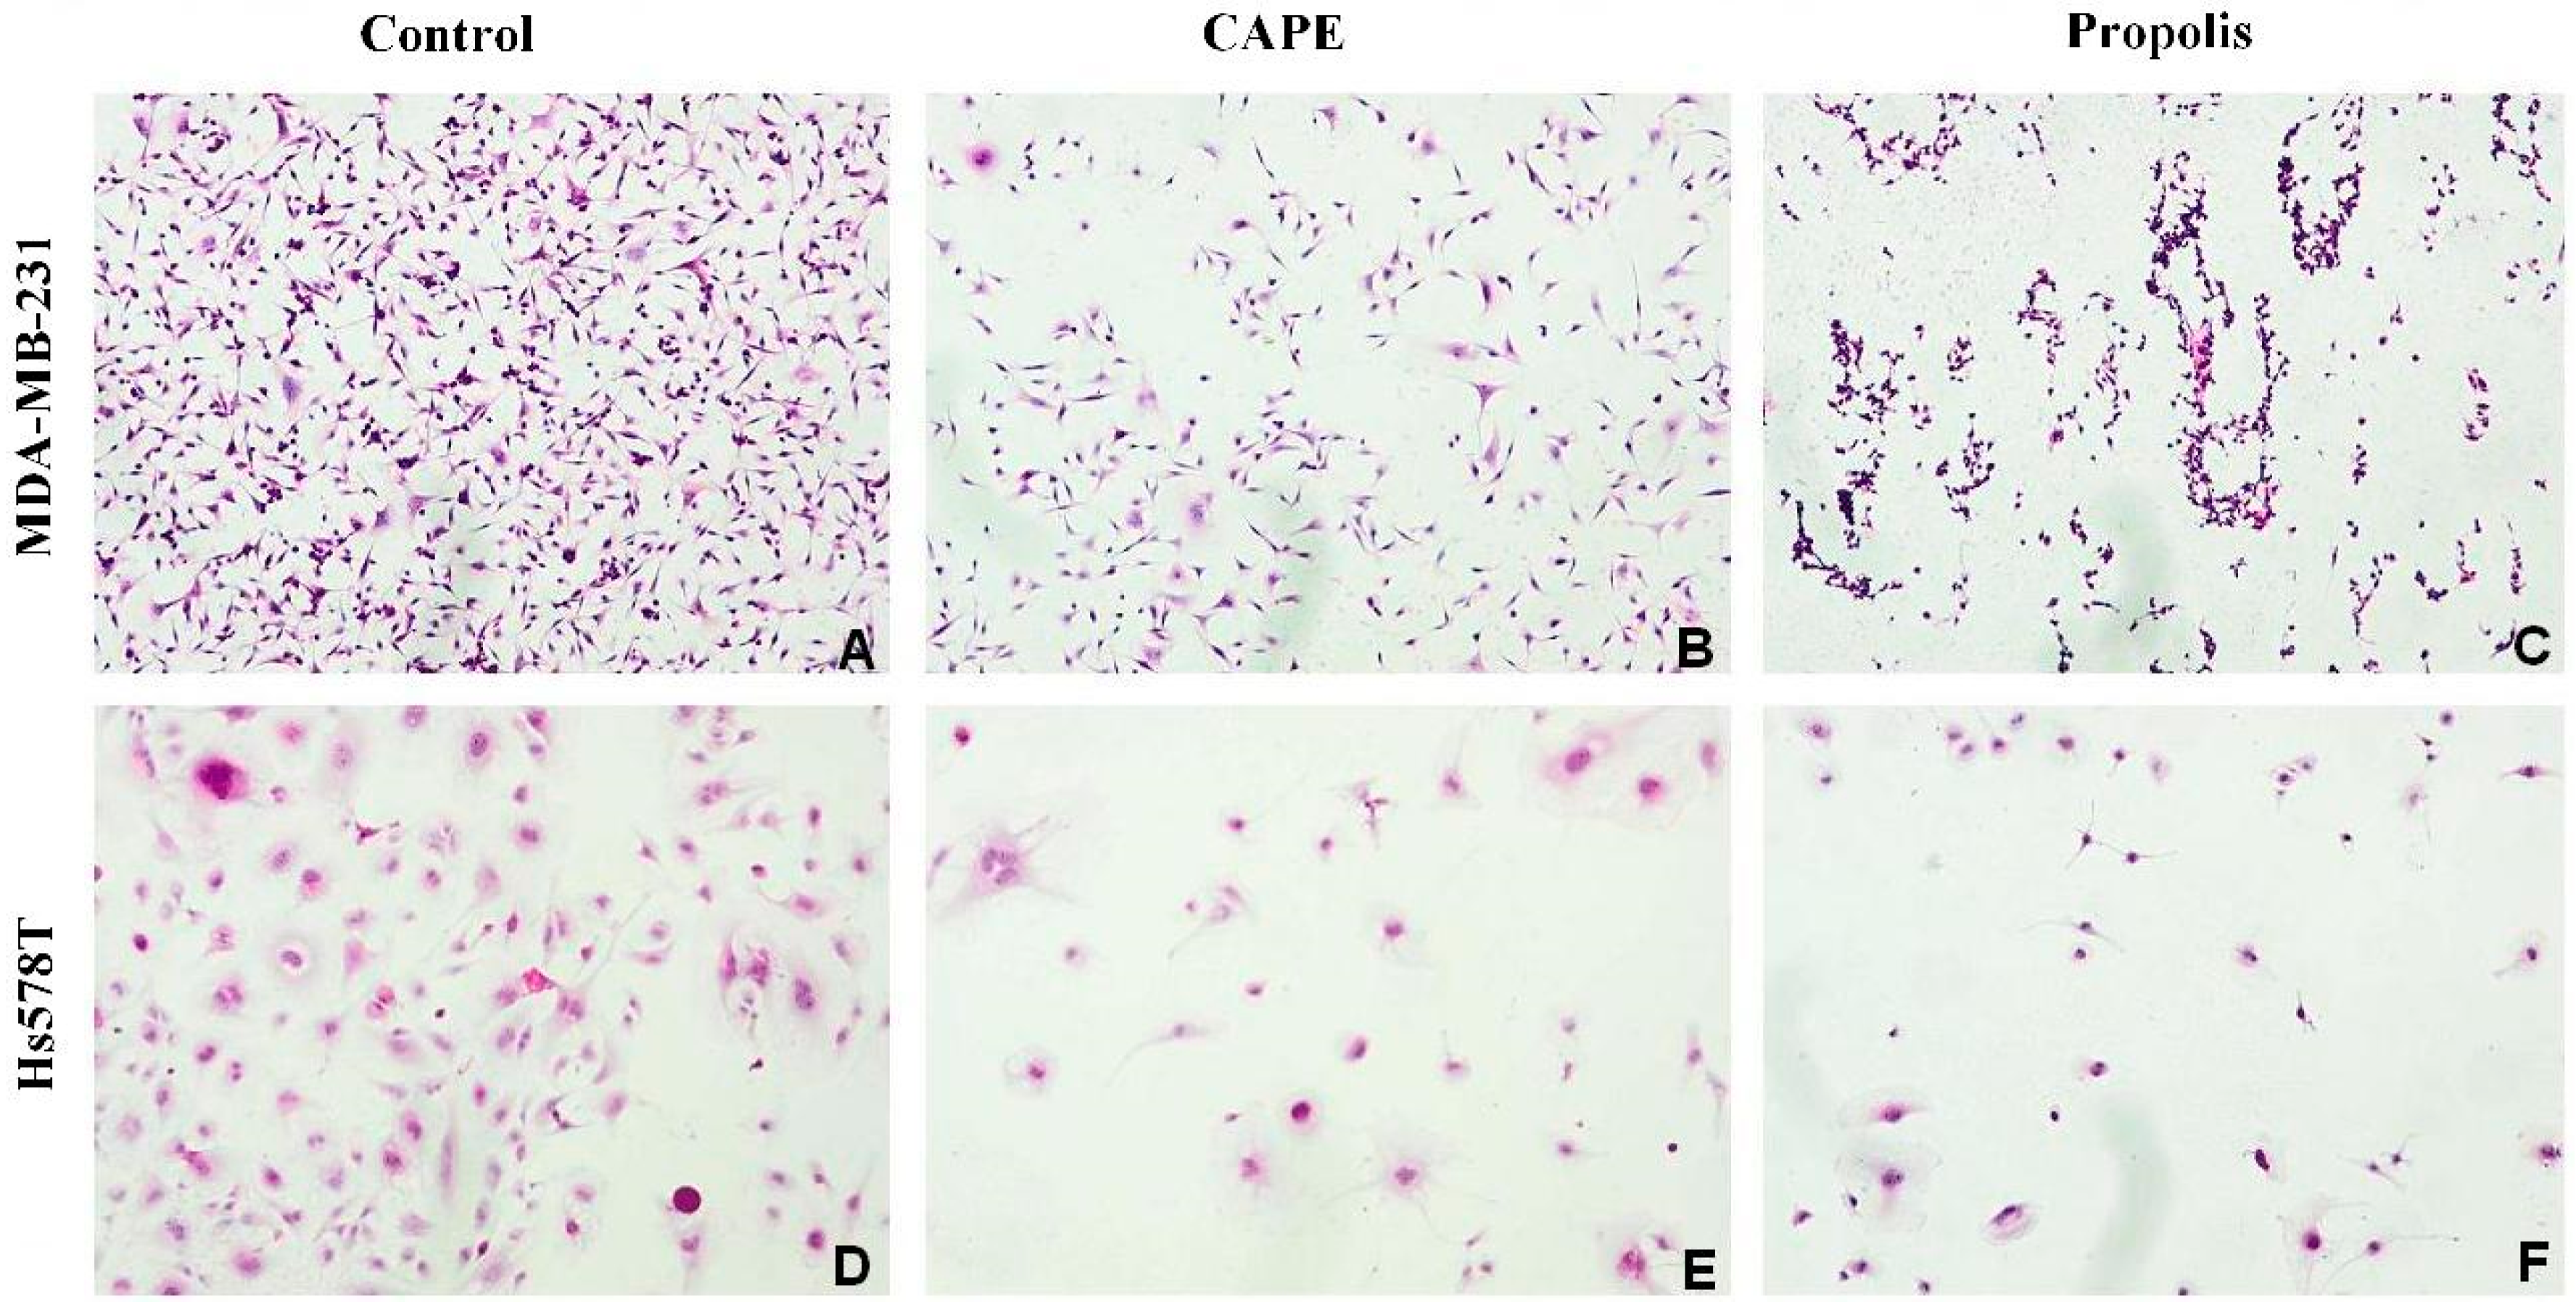
2.2. The Biological Effects of CAPE and Propolis on Morphological Changes of Hs578T and MDA-MB-231 Breast Carcinoma Cells
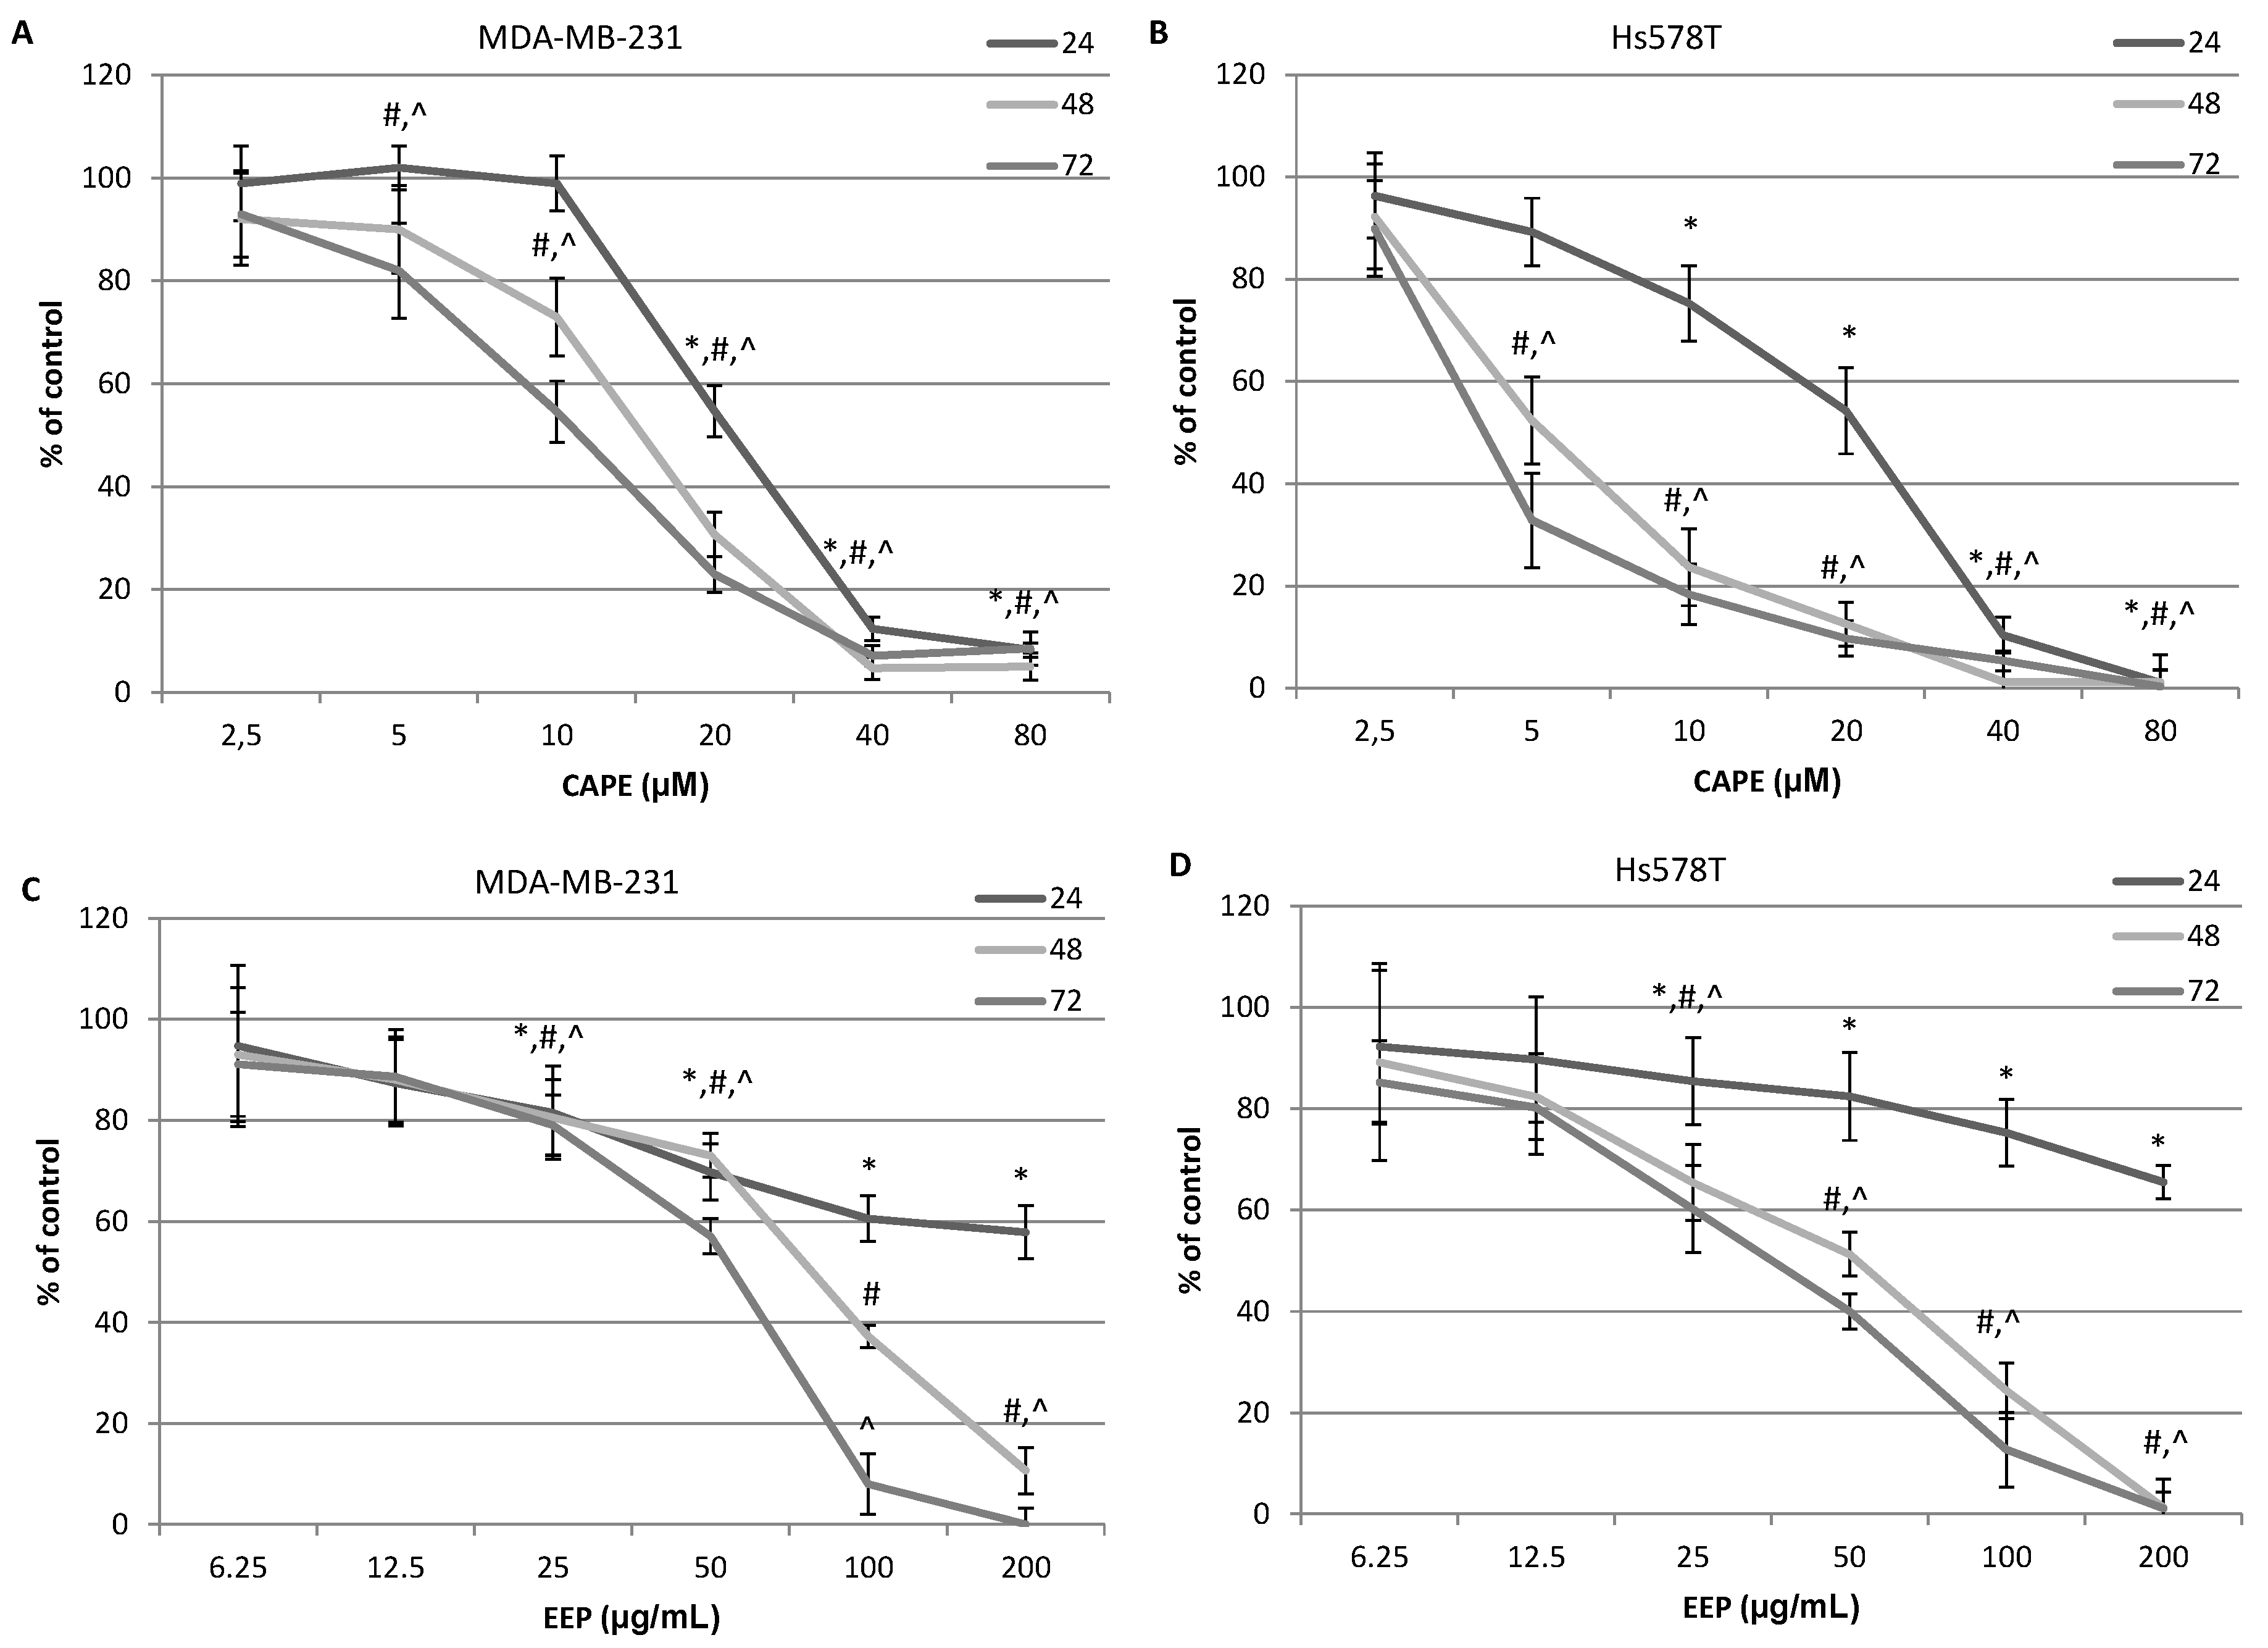
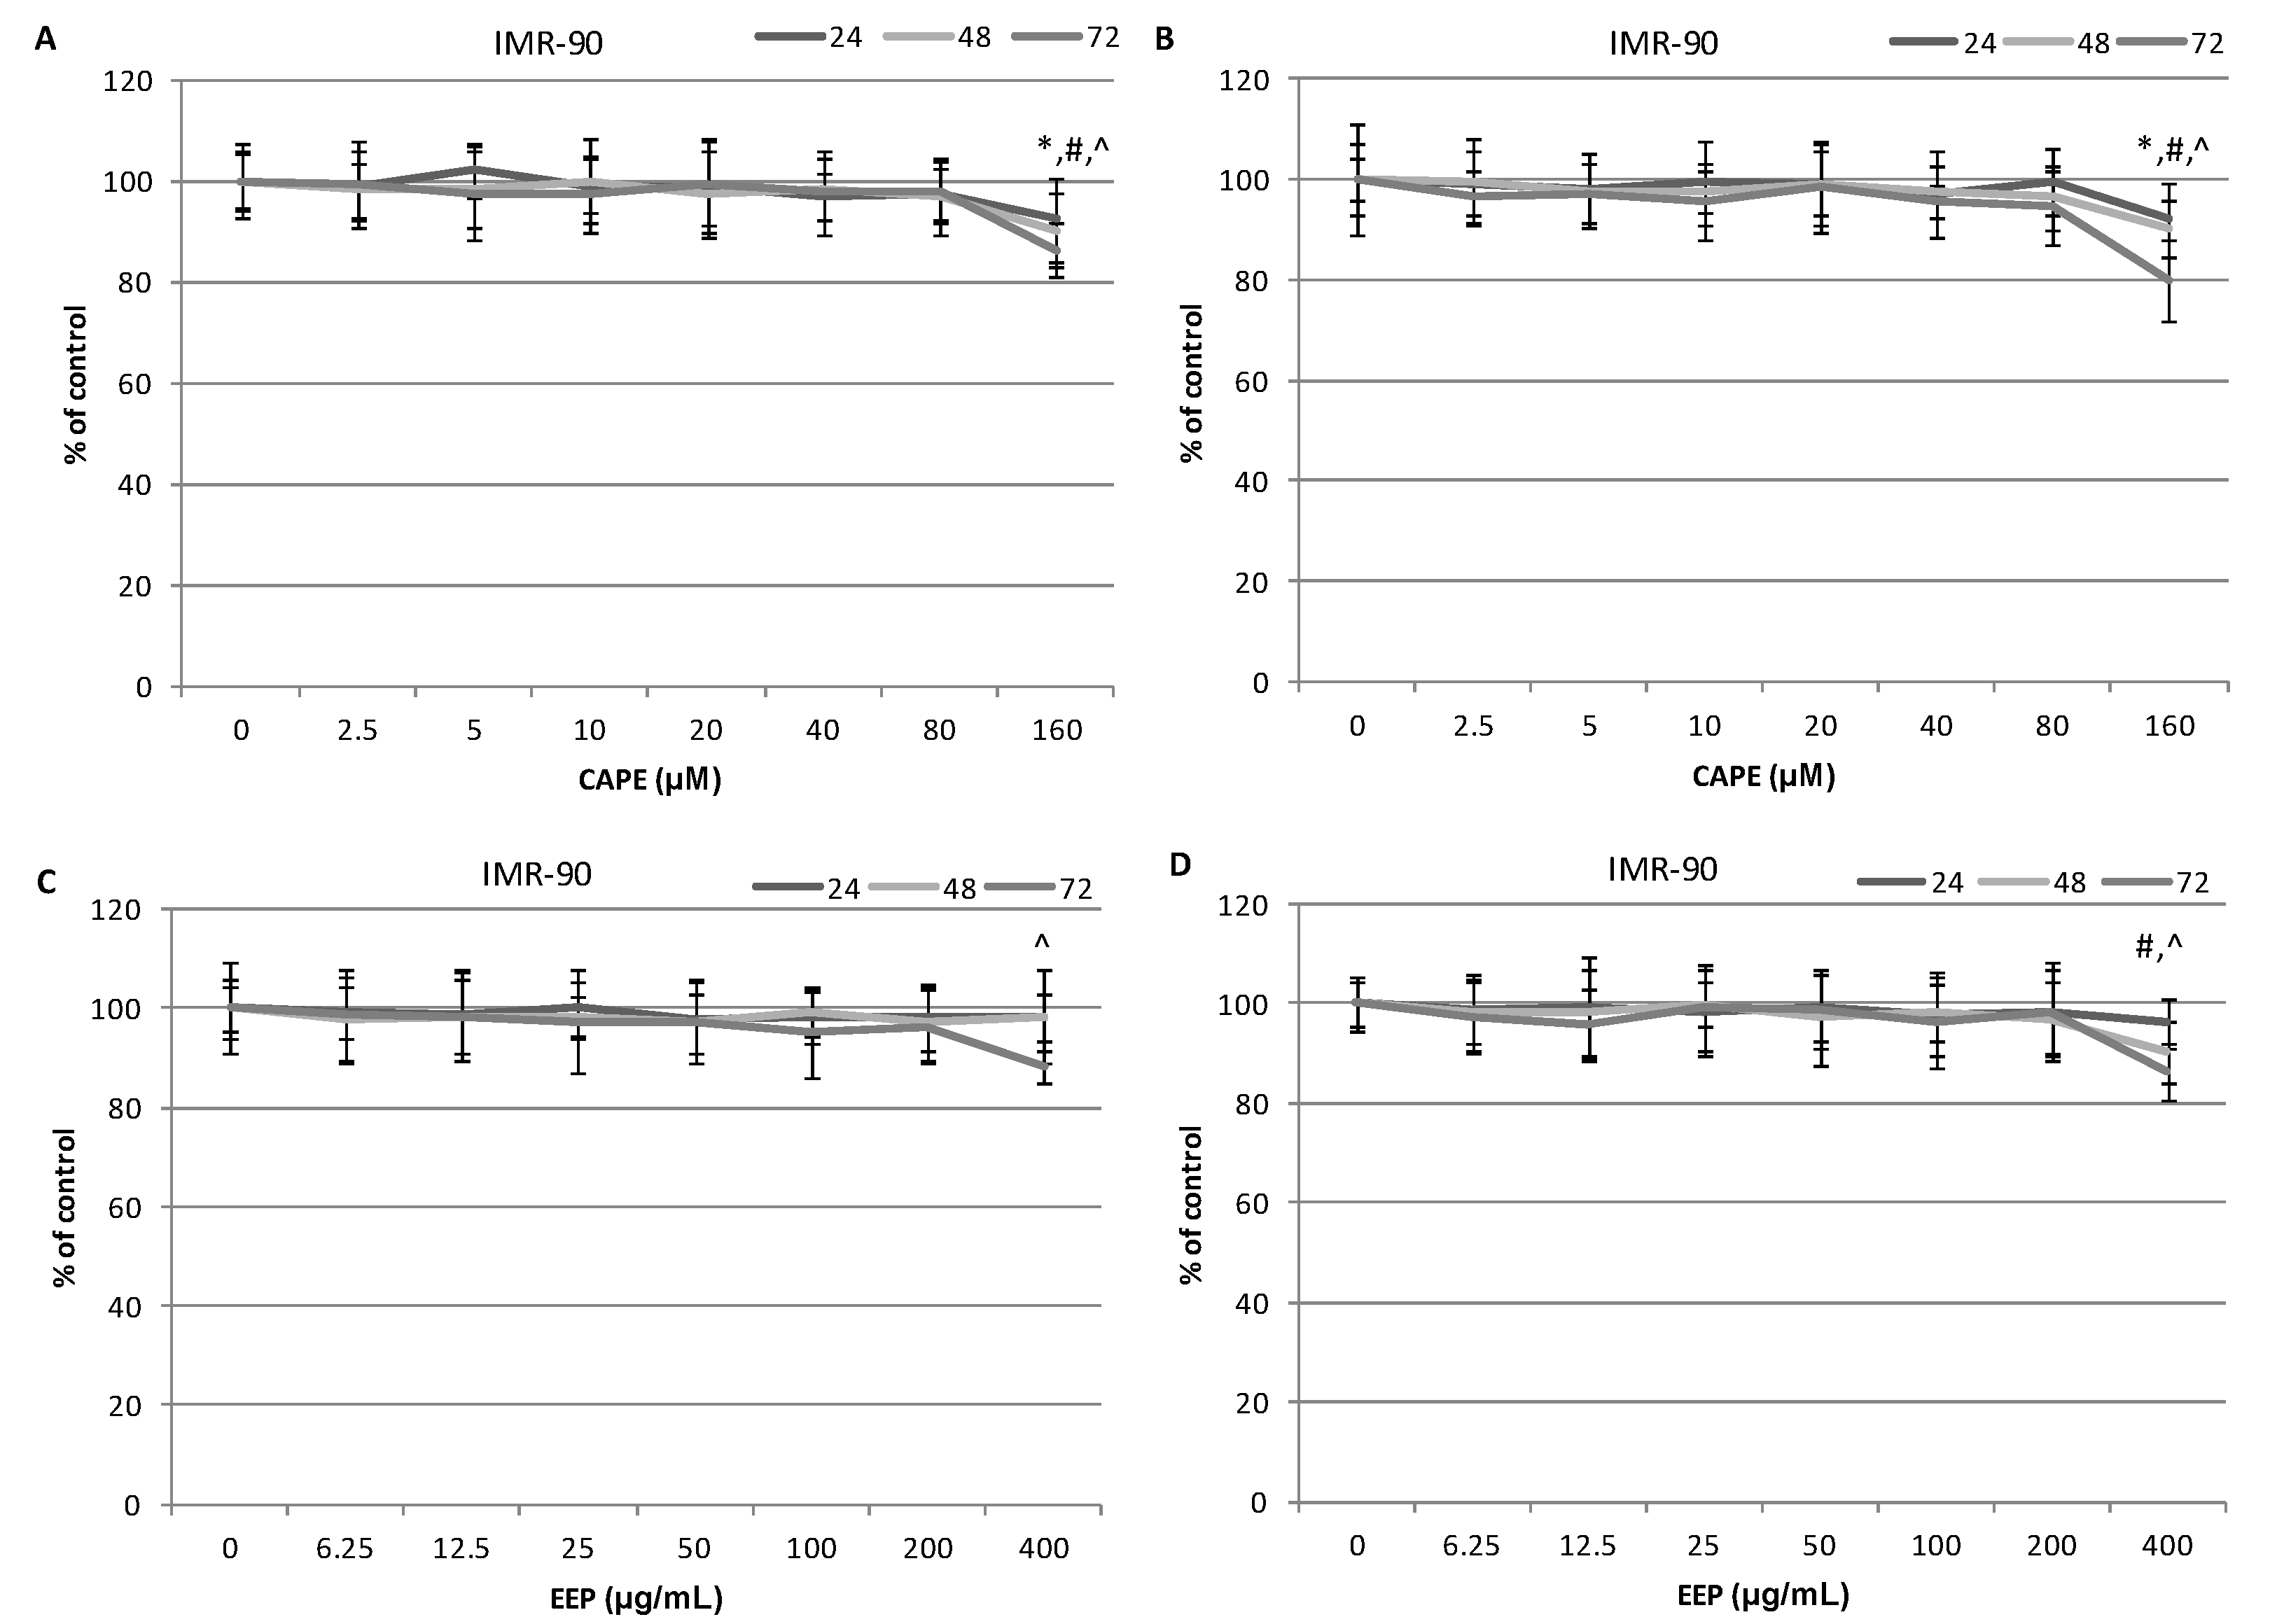
2.3. The Assessment of Viability of MDA-MB-231 and Hs578T Cells Exposed to CAPE and EEP with the MTT Assay
2.4. The Assessment of the Cytotoxic Activity of CAPE and EEP against MDA-MB-231 and Hs578T Cells with the LDH Assay.
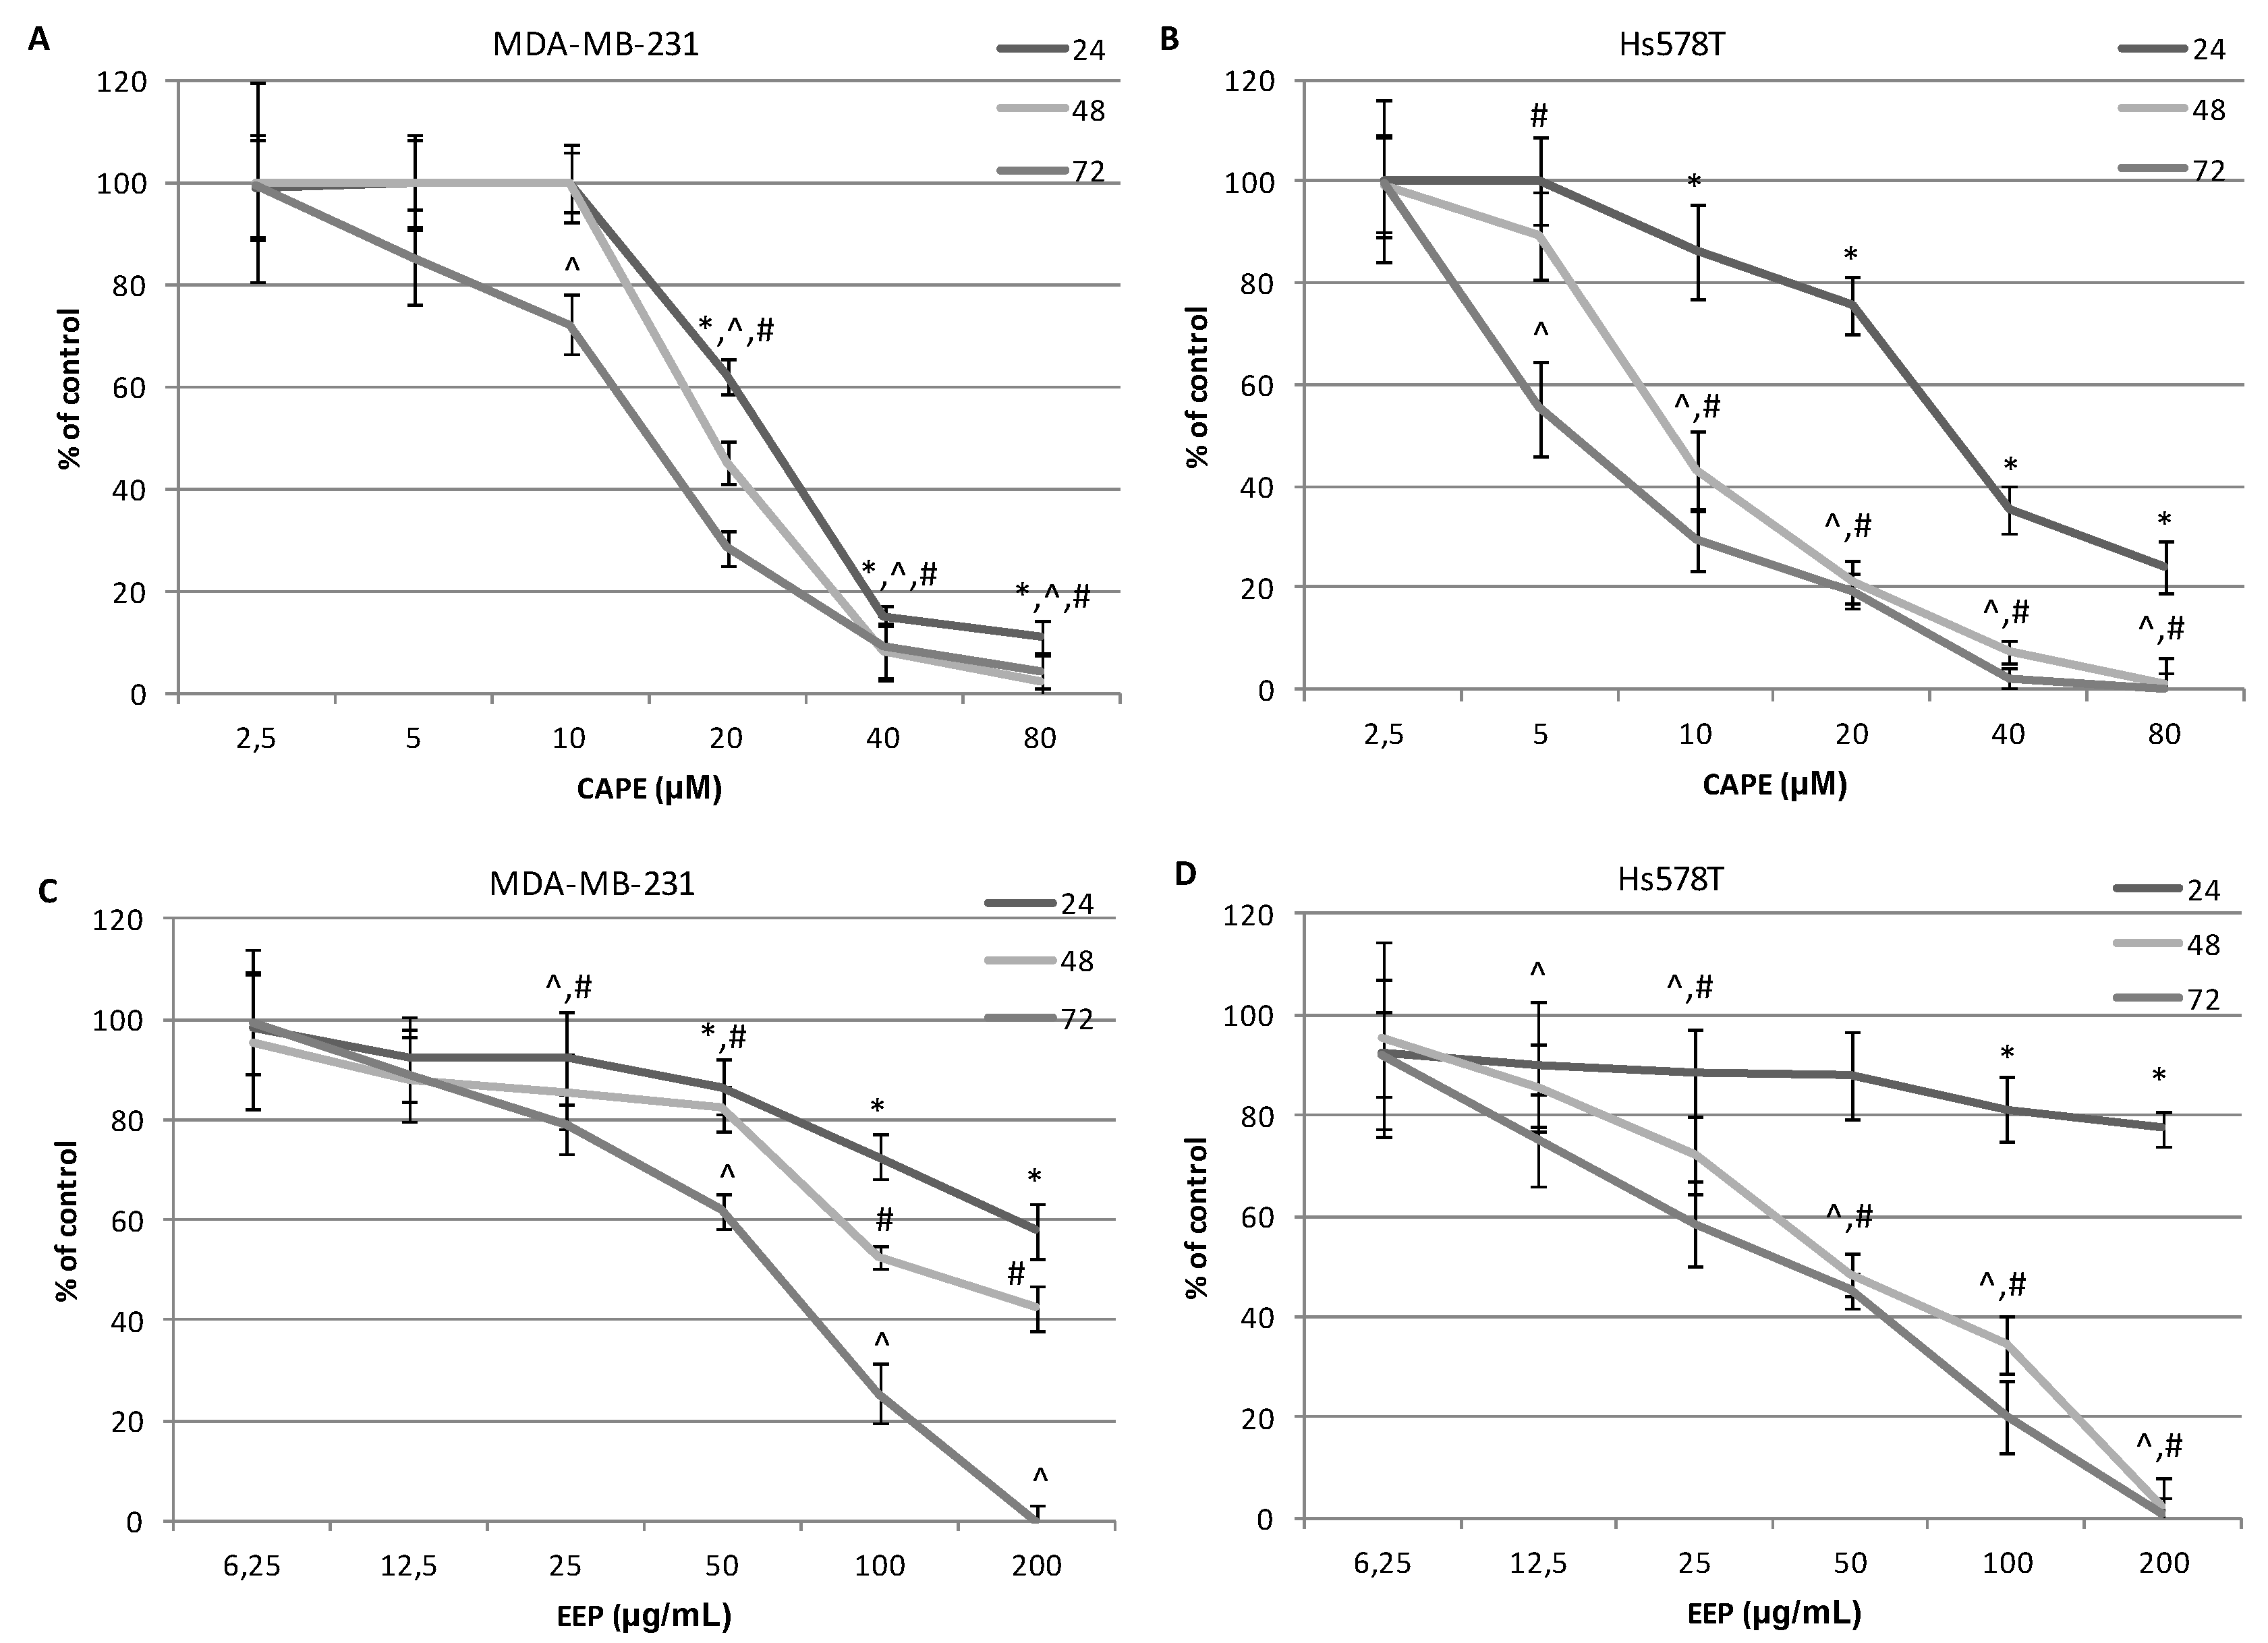
| Breast Cancer Cell Line (TNBC) | CAPE Exposure, EEP Exposure (h) | MTT Assay IC50: CAPE μM (μg∙mL−1) | MTT Assay IC50: EEP μg∙mL−1 | LDH Assay IC50: CAPE μM (μg∙mL−1) | LDH Assay IC50: EEP (μg∙mL−1) |
|---|---|---|---|---|---|
| MDA-MB-231 | 24 | 21.05 (5.99) | 232.31 | 22.93 (6.52) | 731.68 |
| 48 | 13.78 (3.92) | 63.38 | 18.64 (5.30) | 170.97 | |
| 72 | 11.69 (3.32) | 40.40 | 14.08 (4.00) | 48.35 | |
| Hs578T | 24 | 16.38 (4.66) | 2538.51 | 32.80 (9.33) | >3000.00 |
| 48 | 6.60 (1.88) | 38.64 | 11.53 (3.28) | 45.07 | |
| 72 | 4.82 (1.37) | 31.03 | 8.01 (2.28) | 33.68 |
3. Experimental Section
3.1. Compounds and Reagents
3.2. Propolis Sample Collection and Ethanol Extract of Propolis Preparation
3.3. High-Performance Liquid Chromatography with Diode Array Detector Analysis
3.4. Triple-Negative Breast Cancer Cell Cultures
3.5. Microscopic Evaluation of Carcinoma Cells Morphology
3.6. The Initial Evaluation of Viability of Triple-Negative Breast Cancer Cells
3.7. MTT Cell Proliferation and Cytotoxicity Assay
3.8. Lactate Dehydrogenase Release Assay
- (i)
- Background control (Control I): 200 μL assay medium per well;
- (ii)
- Low control (Control II = spontaneous LDH release): 100 μL assay medium and 100 μL cell suspension;
- (iii)
- High control (Control III = maximum LDH release): 100 μL Triton-X solution (final concentration 2%) in assay medium and 100 μL cell suspension per well.
3.9. Statistical Analysis
4. Conclusions
Acknowledgments
Author Contributions
Conflicts of Interest
References
- Brewster, A.M.; Chavez-MacGregor, M.; Brown, P. Epidemiology, biology, and treatment of triple-negative breast cancer in women of African ancestry. Lancet Oncol. 2014, 15, e625–e634. [Google Scholar] [CrossRef] [PubMed]
- Murtaza, G.; Karim, S.; Akram, M.R.; Khan, S.A.; Azhar, S.; Mumtaz, A.; Bin Asad, M.H. Caffeic acid phenethyl ester and therapeutic potentials. Biomed. Res. Int. 2014, 2014, 145342–145350. [Google Scholar] [PubMed]
- Omene, C.; Kalac, M.; Wu, J.; Marchi, E.; Frenkel, K.; O’Connor, O.A. Propolis and its active component, caffeic acid phenethyl ester (CAPE), modulate breast cancer therapeutic targets via an epigenetically mediated mechanism of action. J. Cancer Sci. Ther. 2013, 5, 334–342. [Google Scholar] [PubMed]
- Madrigal-Santillán, E.; Madrigal-Bujaidar, E.; Alvarez-González, I.; Sumaya-Martínez, M.T.; Gutiérrez-Salinas, J.; Bautista, M.; Morales-González, A.; García-Luna, Y.; González-Rubio, M.; Aguilar-Faisal, J.L.; et al. Review of natural products with hepatoprotective effects. World J. Gastroentero. 2014, 20, 14787–14804. [Google Scholar] [CrossRef]
- Wojtyczka, R.D.; Dziedzic, A.; Idzik, D.; Kępa, M.; Kubina, R.; Kabała-Dzik, A.; Smoleń-Dzirba, J.; Stojko, J.; Sajewicz, M.; Wąsik, T.J. Susceptibility of Staphylococcus aureus clinical isolates to propolis extract alone or in combination with antimicrobial drugs. Molecules 2013, 18, 9623–9640. [Google Scholar] [CrossRef] [PubMed]
- Dziedzic, A.; Kubina, R.; Wojtyczka, R.D.; Kabała-Dzik, A.; Tanasiewicz, M.; Morawiec, T. The antibacterial effect of ethanol extract of polish propolis on mutans streptococci and lactobacilli isolated from saliva. Evid. -Based Complement. Alternat. Med. 2013, 2013, 681891–681902. [Google Scholar] [CrossRef] [PubMed]
- Wang, K.; Zhang, J.; Ping, S.; Ma, Q.; Chen, X.; Xuan, H.; Shi, J.; Zhang, C.; Hu, F. Anti-inflammatory effects of ethanol extracts of Chinese propolis and buds from poplar (Populus × canadensis). J. Ethnopharmacol. 2014, 155, 300–311. [Google Scholar] [CrossRef] [PubMed]
- Búfalo, M.C.; Bordon-Graciani, A.P.; Conti, B.J.; de Assis Golim, M.; Sforcin, J.M. The immunomodulatory effect of propolis on receptors expression, cytokine production and fungicidal activity of human monocytes. J. Pharm. Pharmacol. 2014, 66, 1497–1504. [Google Scholar] [CrossRef] [PubMed]
- Jastrzębska-Stojko, Z.; Stojko, R.; Rzepecka-Stojko, A.; Kabała-Dzik, A.; Stojko, J. Biological activity of propolis-honey balm in the treatment of experimentally-evoked burn wounds. Molecules 2013, 18, 14397–14413. [Google Scholar] [CrossRef] [PubMed]
- Kurek-Górecka, A.; Rzepecka-Stojko, A.; Górecki, M.; Stojko, J.; Sosada, M.; Swierczek-Zieba, G. Structure and antioxidant activity of polyphenols derived from propolis. Molecules 2013, 19, 78–101. [Google Scholar] [CrossRef] [PubMed]
- Su, K.Y.; Hsieh, C.Y.; Chen, Y.W.; Chuang, C.T.; Chen, C.T.; Chen, Y.L. Taiwanese green propolis and propolin G protect the liver from the pathogenesis of fibrosis via eliminating TGF-β-induced smad2/3 phosphorylation. J. Agric. Food Chem. 2014, 62, 3192–3201. [Google Scholar] [CrossRef]
- Socha, R.; Gałkowska, D.; Bugaj, M.; Juszczak, L. Phenolic composition and antioxidant activity of propolis from various regions of Poland. Nat. Prod. Res. 2014, 29, 416–422. [Google Scholar] [CrossRef] [PubMed]
- Chen, Y.J.; Shiao, M.S.; Hsu, M.L.; Tsai, T.H.; Wang, S.Y. Effect of caffeic acid phenethyl ester, an antioxidant from propolis, on inducing apoptosis in human leukemic HL-60 cells. J. Agric. Food Chem. 2001, 49, 5615–5619. [Google Scholar] [CrossRef] [PubMed]
- Kustiawan, P.M.; Puthong, S.; Arung, E.T.; Chanchao, C. In vitro cytotoxicity of indonesian stingless bee products against human cancer cell lines. Asian Pac. J. Trop. Biomed. 2014, 4, 549–556. [Google Scholar] [CrossRef] [PubMed]
- Xuan, H.; Li, Z.; Yan, H.; Sang, Q.; Wang, K.; He, Q.; Wang, Y.; Hu, F. Antitumor activity of Chinese propolis in human breast cancer MCF-7 and MDA-MB-231 cells. Evid. -Based Complement. Altern. Med. 2014, 2014. [Google Scholar] [CrossRef]
- Kamiya, T.; Nishihara, H.; Hara, H.; Adachi, T. Ethanol extract of Brazilian red propolis induces apoptosis in human breast cancer MCF-7 cells through endoplasmic reticulum stress. J. Agric. Food Chem. 2012, 60, 11065–11070. [Google Scholar] [CrossRef] [PubMed]
- Kubina, R.; Kabała-Dzik, A.; Dziedzic, A.; Bielec, B.; Wojtyczka, R.D.; Bułdak, R.J.; Wyszyńska, M.; Stawiarska-Pięta, B.; Szaflarska-Stojko, E. The ethanol extract of Polish propolis exhibits anti-proliferative and/or pro-apoptotic effect on HTC 116 colon cancer and Me45 malignant melanoma cells in vitro conditions. Adv. Clin. Exp. Med. 2015, 24, 203–212. [Google Scholar] [CrossRef] [PubMed]
- Grunberger, D.; Banerjee, R.; Eisinger, K.; Oltz, E.M.; Efros, L.; Caldwell, M.; Estevez, V.; Nakanishi, K. Preferential cytotoxicity on tumor cells by caffeic acid phenethyl ester isolated from propolis. Experientia 1988, 44, 230–232. [Google Scholar] [CrossRef] [PubMed]
- Yildirim, O.; Yilmaz, A.; Oz, O.; Vatansever, H.; Cinel, L.; Aslan, G.; Tamer, L.; Adigüzel, U.; Arpaci, R.; Kanik, A.; Emekdaş, G. Effect of caffeic acid phenethyl ester on treatment of experimentally induced methicillin-resistant Staphylococcus epidermidis endophthalmitis in a rabbit model. Cell Biochem. Funct. 2007, 25, 693–700. [Google Scholar] [CrossRef] [PubMed]
- Wang, P.; Liu, C.; Sanches, T.; Zhong, Y.; Liu, B.; Xiong, J.; Neamati, N.; Zhao, G. Design and synthesis of novel nitrogen-containing polyhydroxylated aromatics as HIV-1 integrase inhibitors from caffeic acid phenethyl ester. Bioorg. Med. Chem. Lett. 2009, 19, 4574–4578. [Google Scholar] [CrossRef] [PubMed]
- Cho, M.S.; Park, W.S.; Jung, W.K.; Qian, Z.J.; Lee, D.S.; Choi, J.S.; Lee, D.Y.; Park, S.G.; Seo, S.K.; Kim, H.J.; et al. Caffeic acid phenethyl ester promotes anti-inflammatory effects by inhibiting MAPK and NF-κB signaling in activated HMC-1 human mast cells. Pharm. Biol. 2014, 52, 926–932. [Google Scholar] [CrossRef] [PubMed]
- Altuntaş, A.; Yılmaz, H.R.; Altuntaş, A.; Uz, E.; Demir, M.; Gökçimen, A.; Aksu, O.; Bayram, D.Ş.; Sezer, M.T. Caffeic acid phenethyl ester protects against amphotericin B induced nephrotoxicity in rat model. Biomed. Res. Int. 2014, 2014, 702981–702988. [Google Scholar] [CrossRef] [PubMed]
- Zhou, K.; Li, X.; Du, Q.; Li, D.; Hu, M.; Yang, X.; Jiang, Q.; Li, Z. A CAPE analogue as novel antiplatelet agent efficiently inhibits collagen-induced platelet aggregation. Pharmazie 2014, 69, 615–620. [Google Scholar] [PubMed]
- Wu, J.; Omene, C.; Karkoszka, J.; Bosland, M.; Eckard, J.; Klein, C.B.; Frenkel, K. Caffeic acid phenethyl ester (CAPE), derived from a honeybee product propolis, exhibits a diversity of anti-tumor effects in pre-clinical models of human breast cancer. Cancer Lett. 2011, 308, 43–53. [Google Scholar] [CrossRef] [PubMed]
- Akyol, S.; Ozturk, G.; Ginis, Z.; Armutcu, F.; Yigitoglu, M.R.; Akyol, O. In vivo and in vitro antıneoplastic actions of caffeic acid phenethyl ester (CAPE): Therapeutic perspectives. Nutr. Cancer 2013, 65, 515–526. [Google Scholar] [CrossRef] [PubMed]
- Borrelli, F.; Izzo, A.A.; Di Carlo, G.; Maffia, P.; Russo, A.; Maiello, F.M.; Capasso, F.; Mascolo, N. Effect of a propolis extract and caffeic acid phenethyl ester on formation of aberrant crypt foci and tumors in the rat colon. Fitoterapia 2002, 73, S38–S43. [Google Scholar] [CrossRef] [PubMed]
- Xiang, D.; Wang, D.; He, Y.; Xie, J.; Zhong, Z.; Li, Z.; Xie, J. Caffeic acid phenethyl ester induces growth arrest and apoptosis of colon cancer cells via the beta-catenin/T-cell factor signaling. Anti-Cancer Drugs 2006, 17, 753–762. [Google Scholar] [CrossRef] [PubMed]
- Chen, M.F.; Wu, C.T.; Chen, Y.J.; Keng, P.C.; Chen, W.C. Cell killing and radiosensitization by caffeic acid phenethyl ester (CAPE) in lung cancer cells. J. Radiat. Res. 2004, 45, 253–260. [Google Scholar] [CrossRef] [PubMed]
- Kudugunti, S.K.; Vad, N.M.; Ekogbo, E.; Moridani, M.Y. Efficacy of caffeic acid phenethyl ester (CAPE) in skin B16-F0 melanoma tumor bearing C57BL/6 mice. Investig. New Drugs 2011, 29, 52–62. [Google Scholar] [CrossRef]
- Wu, C.S.; Chen, M.F.; Lee, I.L.; Tung, S.Y. Predictive role of nuclear factor-κB activity in gastric cancer: A promising adjuvant approach with caffeic acid phenethyl ester. J. Clin. Gastroenterol. 2007, 41, 894–900. [Google Scholar] [CrossRef] [PubMed]
- Chen, M.J.; Chang, W.H.; Lin, C.C.; Liu, C.Y.; Wang, T.E.; Chu, C.H.; Shih, S.C.; Chen, Y.J. Caffeic acid phenethyl ester induces apoptosis of human pancreatic cancer cells involving caspase and mitochondrial dysfunction. Pancreatology 2008, 8, 566–576. [Google Scholar] [CrossRef] [PubMed]
- Lee, K.; Kang, N.; Kim, J.; Lee, K.; Lee, D.; Hur, H.J.; Lee, H.J. Caffeic acid phenethyl ester inhibits invasion and expression of matrix metalloproteinase in SK-Hep1 human hepatocellular carcinoma cells by targeting nuclear factor κB. Genes Nutr. 2008, 2, 319–322. [Google Scholar] [CrossRef] [PubMed]
- Huang, M.T.; Ma, W.; Yen, P.; Xie, J.G.; Han, J.; Frenkel, K.; Grunberger, D.; Conney, A.H. Inhibitory effects of caffeic acid phenethyl ester (CAPE) on 12-O-tetradecanoylphorbol-13-acetate-induced tumor promotion in mouse skin and the synthesis of DNA, RNA and protein in HeLa cells. Carcinogenesis 1996, 17, 761–765. [Google Scholar] [CrossRef] [PubMed]
- Onori, P.; DeMorrow, S.; Gaudio, E.; Franchitto, A.; Mancinelli, R.; Venter, J.; Kopriva, S.; Ueno, Y.; Alvaro, D.; Savage, J.; et al. Caffeic acid phenethyl ester decreases cholangiocarcinoma growth by inhibition of NFκB and induction of apoptosis. Int. J. Cancer 2009, 125, 565–576. [Google Scholar] [CrossRef] [PubMed]
- Kuo, H.C.; Kuo, W.H.; Lee, Y.J.; Lin, W.L.; Chou, F.P.; Tseng, T.H. Inhibitory effect of caffeic acid phenethyl ester on the growth of C6 glioma cells in vitro and in vivo. Cancer Lett. 2006, 234, 199–208. [Google Scholar] [CrossRef] [PubMed]
- Watabe, M.; Hishikawa, K.; Takayanagi, A.; Shimizu, N.; Nakaki, T. Caffeic acid phenethyl ester induces apoptosis by inhibition of NFκB and activation of Fas in human breast cancer MCF-7 cells. J. Biol. Chem. 2004, 279, 6017–6026. [Google Scholar] [CrossRef] [PubMed]
- Eng-Wong, J.; Isaacs, C. Prediction of benefit from adjuwant treatment in patients with breast cancer. Clin. Breast Cancer 2010, 10, 32–37. [Google Scholar] [CrossRef]
- Omene, C.O.; Wu, J.; Frenkel, K. Caffeic acid phenethyl ester (CAPE) derived from propolis, a honeybee product, inhibits growth of breast cancer stem cells. Investig. New Drugs 2012, 30, 1279–1288. [Google Scholar] [CrossRef]
- Guzman, J.D. Natural cinnamic acids, synthetic derivatives and hybrids with antimicrobial activity. Molecules 2014, 19, 19292–19349. [Google Scholar] [CrossRef] [PubMed]
- Etoh, H.; Murakami, K.; Yogoh, T.; Ishikawa, H.; Fukuyama, Y.; Tanaka, H. Anti-oxidative compounds in barley tea. Biosci. Biotechnol. Biochem. 2004, 68, 2616–2618. [Google Scholar] [CrossRef] [PubMed]
- Borges, A.; Ferreira, C.; Saavedra, M.J.; Simões, M. Antioxidant and antimicrobial activities of ferulic acid esters from ochrosia oppositifolia. Microb. Drug Resist. 2013, 19, 256–265. [Google Scholar] [CrossRef] [PubMed]
- Stojković, D.; Petrović, J.; Soković, M.; Glamočlija, J.; Kukić-Marković, J.; Petrović, S. In situ antioxidant and antimicrobial activities of naturally occurring caffeic acid, p-coumaric acid and rutin, using food systems. J. Sci. Food Agric. 2013, 93, 3205–3208. [Google Scholar] [CrossRef] [PubMed]
- Fernández, M.A.; Sáenz, M.T.; García, M.D. Anti-inflammatory activity in rats and mice of phenolic acids isolated from Scrophularia frutescens. J. Pharm. Pharmacol. 1998, 50, 1183–1186. [Google Scholar] [CrossRef] [PubMed]
- Boisard, S.; Le Ray, A.-M.; Landreau, A.; Kempf, M.; Cassisa, V.; Flurin, C.; Richomme, P. Antifungal and antibacterial metabolites from a French poplar type propolis. Evid. -Based Complement. Altern. Med. 2015, 2015. [Google Scholar] [CrossRef]
- Hämäläinen, M.; Nieminen, R.; Vuorela, P.; Heinonen, M.; Moilanen, E. Anti-inflammatory effects of flavonoids: Genistein, kaempferol, quercetin, and daidzein inhibit STAT-1 and NF-κB activations, whereas flavone, isorhamnetin, naringenin, and pelargonidin inhibit only NF-κB activation along with their inhibitory effect on iNOS expression and NO production in activated macrophages. Mediat. Inflamm. 2007, 2007, 45673. [Google Scholar] [CrossRef]
- Li, R.R.; Pang, L.L.; Du, Q.; Shi, Y.; Dai, W.J.; Yin, K.S. Apigenin inhibits allergen-induced airway inflammation and switches immune response in a murine model of asthma. Immunopharm. Immunot. 2010, 32, 364–370. [Google Scholar] [CrossRef]
- Lee, J.H.; Zhou, H.Y.; Cho, S.Y.; Kim, Y.S.; Lee, Y.S.; Jeong, C.S. Anti-inflammatory mechanisms of apigenin: Inhibition of cyclooxygenase-2 expression, adhesion of monocytes to human umbilical vein endothelial cells, and expression of cellular adhesion molecules. Arch. Pharm. Res. 2007, 30, 1318–1327. [Google Scholar] [CrossRef] [PubMed]
- Peng, L.; Yang, S.; Cheng, Y.J.; Chen, F.; Pan, S.; Fan, G. Antifungal activity and action mode of pinocembrin from propolis against Penicillium italicum. Food Sci. Biotechnol. 2012, 21, 1533–1539. [Google Scholar] [CrossRef]
- Zhang, M.; Swarts, S.G.; Yin, L.; Liu, C.; Tian, Y.; Cao, Y.; Swarts, M.; Yang, S.; Zhang, S.B.; Zhang, K.; et al. Antioxidant properties of quercetin. Adv. Exp. Med. Biol. 2011, 701, 283–289. [Google Scholar] [PubMed]
- Liu, Y.; Song, X.; He, J.; Zheng, X.; Wu, H. Synthetic derivatives of chrysin and their biological activities. Med. Chem. Res. 2014, 23, 555–563. [Google Scholar] [CrossRef]
- Paulíková, H.; Berczeliová, E. The effect of quercetin and galangin on glutathione reductase. Biomed. Pap. Med. Fac. Univ. Palacky. Olomouc. Czech Repub. 2005, 149, 497–500. [Google Scholar] [CrossRef] [PubMed]
- Lee, Y.S.; Kang, O.H.; Choi, J.G.; Oh, Y.C.; Chae, H.S.; Kim, J.H.; Park, H.; Sohn, D.H.; Wang, Z.T.; Kwon, D.Y. Synergistic effects of the combination of galangin with gentamicin against methicillin-resistant Staphylococcus aureus. J. Microbiol. 2008, 46, 283–288. [Google Scholar] [CrossRef] [PubMed]
- Carballo-Villalobos, A.I.; González-Trujano, M.E.; López-Muñoz, F.J. Evidence of mechanism of action of anti-inflammatory/antinociceptive activities of acacetin. Eur. J. Pain 2014, 18, 396–405. [Google Scholar] [CrossRef] [PubMed]
- Lee, Y.J.; Kuo, H.C.; Chu, C.Y.; Wang, C.J.; Lin, W.C.; Tseng, T.H. Involvement of tumor suppressor protein p53 and p38 MAPK in caffeic acid phenethyl ester-induced apoptosis of C6 glioma cells. Biochem. Pharmacol. 2003, 66, 2281–2289. [Google Scholar] [CrossRef] [PubMed]
- Jin, U.H.; Song, K.H.; Motomura, M.; Suzuki, I.; Gu, Y.H.; Kang, Y.J.; Moon, T.C.; Kim, C.H. Caffeic acid phenethyl ester induces mitochondriamediated apoptosis in human myeloid leukemia U937 cells. Mol. Cell Biochem. 2008, 310, 43–48. [Google Scholar] [CrossRef] [PubMed]
- Szliszka, E.; Zydowicz, G.; Janoszka, B.; Dobosz, C.; Kowalczyk-Ziomek, G.; Król, W. Ethanolic extract of Brazilian green propolis sensitizes prostate cancer cells to TRAIL induced apoptosis. Int. J. Oncol. 2011, 38, 941–953. [Google Scholar] [PubMed]
- Sample Availability: Samples of the compounds are available from the authors.
© 2015 by the authors. Licensee MDPI, Basel, Switzerland. This article is an open access article distributed under the terms and conditions of the Creative Commons Attribution license ( http://creativecommons.org/licenses/by/4.0/).
Share and Cite
Rzepecka-Stojko, A.; Kabała-Dzik, A.; Moździerz, A.; Kubina, R.; Wojtyczka, R.D.; Stojko, R.; Dziedzic, A.; Jastrzębska-Stojko, Ż.; Jurzak, M.; Buszman, E.; et al. Caffeic Acid Phenethyl Ester and Ethanol Extract of Propolis Induce the Complementary Cytotoxic Effect on Triple-Negative Breast Cancer Cell Lines. Molecules 2015, 20, 9242-9262. https://doi.org/10.3390/molecules20059242
Rzepecka-Stojko A, Kabała-Dzik A, Moździerz A, Kubina R, Wojtyczka RD, Stojko R, Dziedzic A, Jastrzębska-Stojko Ż, Jurzak M, Buszman E, et al. Caffeic Acid Phenethyl Ester and Ethanol Extract of Propolis Induce the Complementary Cytotoxic Effect on Triple-Negative Breast Cancer Cell Lines. Molecules. 2015; 20(5):9242-9262. https://doi.org/10.3390/molecules20059242
Chicago/Turabian StyleRzepecka-Stojko, Anna, Agata Kabała-Dzik, Aleksandra Moździerz, Robert Kubina, Robert D. Wojtyczka, Rafał Stojko, Arkadiusz Dziedzic, Żaneta Jastrzębska-Stojko, Magdalena Jurzak, Ewa Buszman, and et al. 2015. "Caffeic Acid Phenethyl Ester and Ethanol Extract of Propolis Induce the Complementary Cytotoxic Effect on Triple-Negative Breast Cancer Cell Lines" Molecules 20, no. 5: 9242-9262. https://doi.org/10.3390/molecules20059242
APA StyleRzepecka-Stojko, A., Kabała-Dzik, A., Moździerz, A., Kubina, R., Wojtyczka, R. D., Stojko, R., Dziedzic, A., Jastrzębska-Stojko, Ż., Jurzak, M., Buszman, E., & Stojko, J. (2015). Caffeic Acid Phenethyl Ester and Ethanol Extract of Propolis Induce the Complementary Cytotoxic Effect on Triple-Negative Breast Cancer Cell Lines. Molecules, 20(5), 9242-9262. https://doi.org/10.3390/molecules20059242