Article

Synthesis, Crystal Structures and Spectroscopic Properties of Triazine-Based Hydrazone Derivatives; A Comparative Experimental-Theoretical Study

1
Chemistry Department, Faculty of Science, King Abdulaziz University, P.O. Box 80203, Jeddah 21589, Saudi Arabia
2
Department of Chemistry, COMSATS Institute of Information Technology, University Road, Tobe Camp, 22060 Abbottabad, Pakistan
3
Center of Excellence for Advanced Materials Research (CEAMR), King Abdulaziz University, P.O. Box 80203, Jeddah 21589, Saudi Arabia
4
Department of Chemistry, College of Science, King Faisal University, Al-Hafouf 31982, Saudi Arabia
*
Authors to whom correspondence should be addressed.
Molecules 2015, 20(4), 5851-5874; https://doi.org/10.3390/molecules20045851
Submission received: 14 February 2015 / Revised: 18 March 2015 / Accepted: 23 March 2015 / Published: 3 April 2015
(This article belongs to the Collection Heterocyclic Compounds)

Abstract

:
We report here a comparative theoretical and experimental study of four triazine-based hydrazone derivatives. The hydrazones are synthesized by a three step process from commercially available benzil and thiosemicarbazide. The structures of all compounds were determined by using the UV-Vis., FT-IR, NMR (1H and 13C) spectroscopic techniques and finally confirmed unequivocally by single crystal X-ray diffraction analysis. Experimental geometric parameters and spectroscopic properties of the triazine based hydrazones are compared with those obtained from density functional theory (DFT) studies. The model developed here comprises of geometry optimization at B3LYP/6-31G (d, p) level of DFT. Optimized geometric parameters of all four compounds showed excellent correlations with the results obtained from X-ray diffraction studies. The vibrational spectra show nice correlations with the experimental IR spectra. Moreover, the simulated absorption spectra also agree well with experimental results (within 10–20 nm). The molecular electrostatic potential (MEP) mapped over the entire stabilized geometries of the compounds indicated their chemical reactivates. Furthermore, frontier molecular orbital (electronic properties) and first hyperpolarizability (nonlinear optical response) were also computed at the B3LYP/6-31G (d, p) level of theory.

Graphical Abstract

1. Introduction

Heterocyclic chemistry is essential to biology and medicine. It is not questionable to say that we are living in the age of heterocyclic chemistry. Triazines are heterocyclic analogue of benzene containing three nitrogen atoms with moelcular formula C3H3N3. Three isomeric triazines are shown in Figure 1.
Figure 1. Basic skeleton of different types of triazines.
Molecules 20 05851 g001
In 1776, Scheele synthesized triazine through pyrolysis of uric acid, and later Serullas repeated the work of Scheele however, the structure was first confirmed by Leibig and Wohler [1]. Molecules containing triazine skeletons show considerable biological and pharmaceutical activities [2,3]. 2-Ethoxymethyl-6-ethyl-2,3,4,5-tetrahydro-1,2,4-triazine-3,5-dione was synthesized and evaluated for its antimicrobial activity [4] and later its molecular and vibrational spectra were investigated by applying density functional theory methods [5]. Hydrazides of 1,2,4-triazine have been used as precursors for the synthesis of various biologically active compounds [3]. Moreover, these molecules are also efficient in dye sensitized solar cells (DSSC) [6].
Hydrazones are another class of compounds well known to possess various kinds of biological activities [7]. They have been used as an intermediate for the preparation of heterocycles displaying useful activities [8,9]. Recently Jani et al. has reported the synthesis and antimicrobial activities of complexes prepared using ligands containing triazine and hydrazone functionalities [10]. The vast range of pharmacological applications of these classes of compounds encouraged us to synthesize compounds containing both triazine and hydrazone moieties. We report here the synthesis, crystal structures and spectroscopic properties of some 1,2,4-triazine-based hydrazone derivatives. In continuation to our on-going studies of various class of heterocyclic molecules [11,12,13], density functional theory (DFT) studies were also performed not only to validate the experimental results, but also to explore further structural properties as well.

2. Results and Discussion
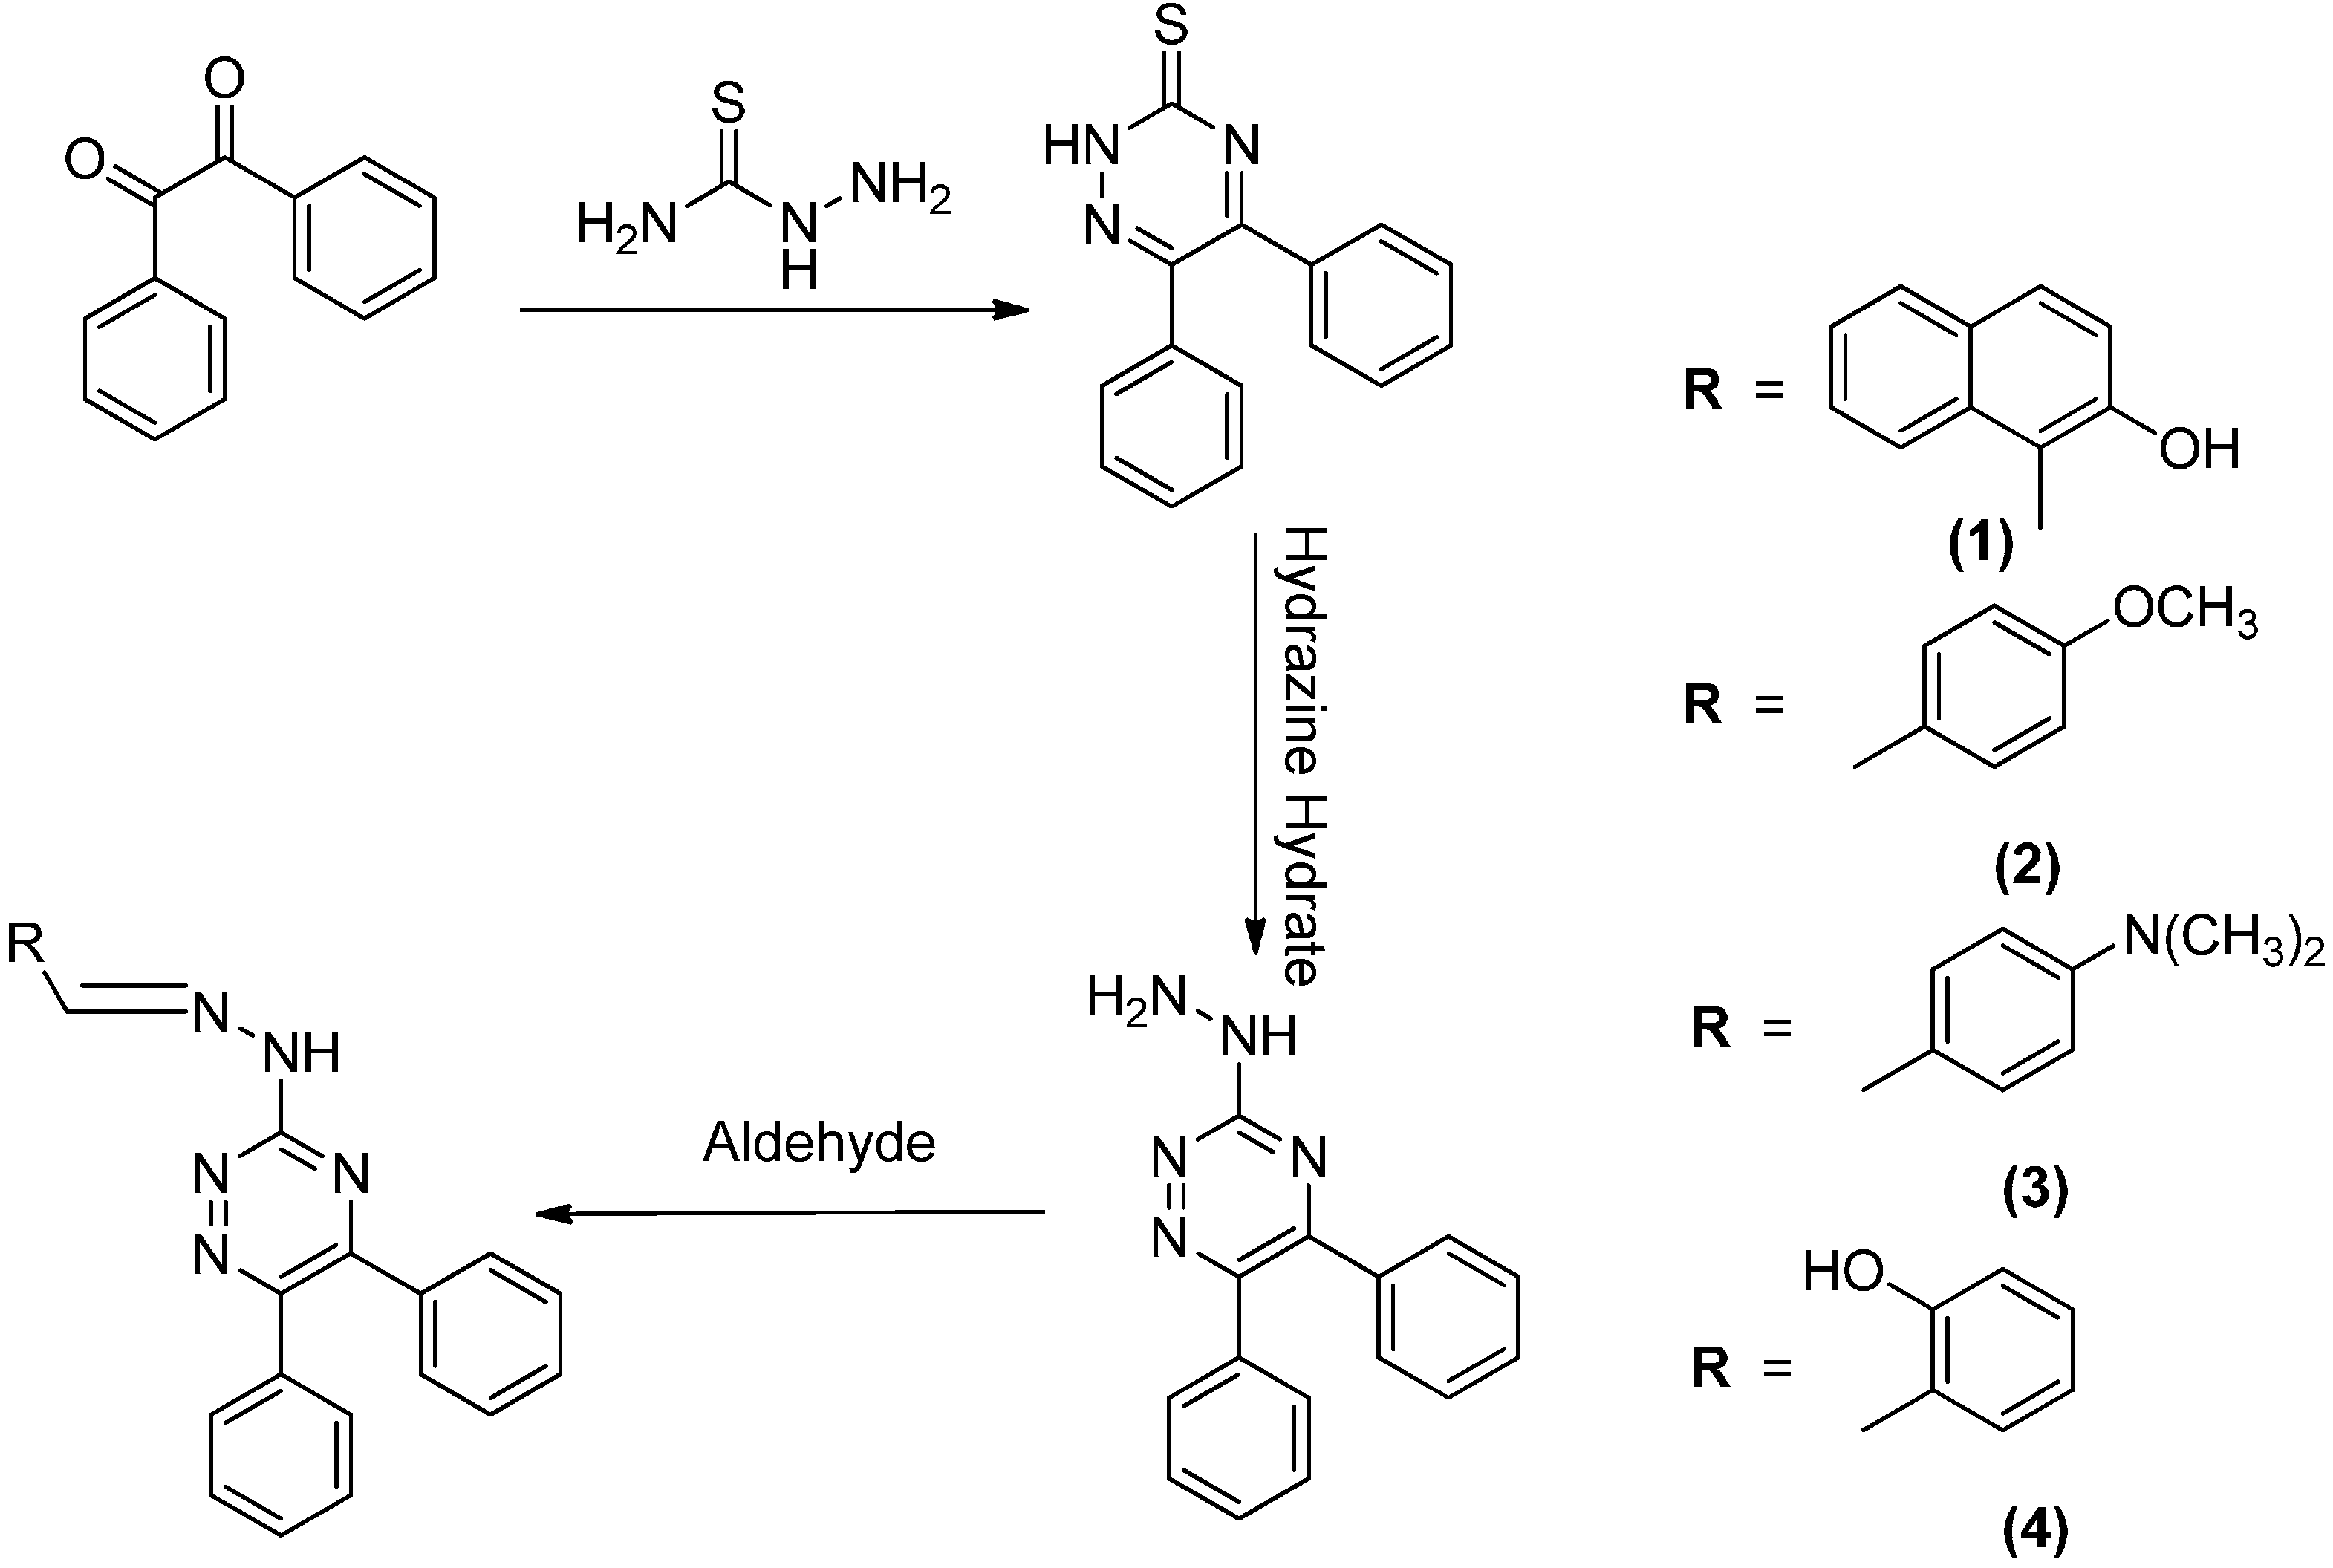
2.1. Synthesis

The synthesis of all four triazine based hydrazone derivatives 14 was performed in three steps starting from commercially available benzil. The first step was condensation of benzil with thiosemicarbazide followed by another condensation of the intermediate with hydrazine hydrate to construct the triazine ring. The hydrazine intermediate was then reacted with the respective aldehydes to deliver hydrazones 14 as the final products (Scheme 1).
Scheme 1. Synthetic scheme of target compounds 14.
Molecules 20 05851 g009

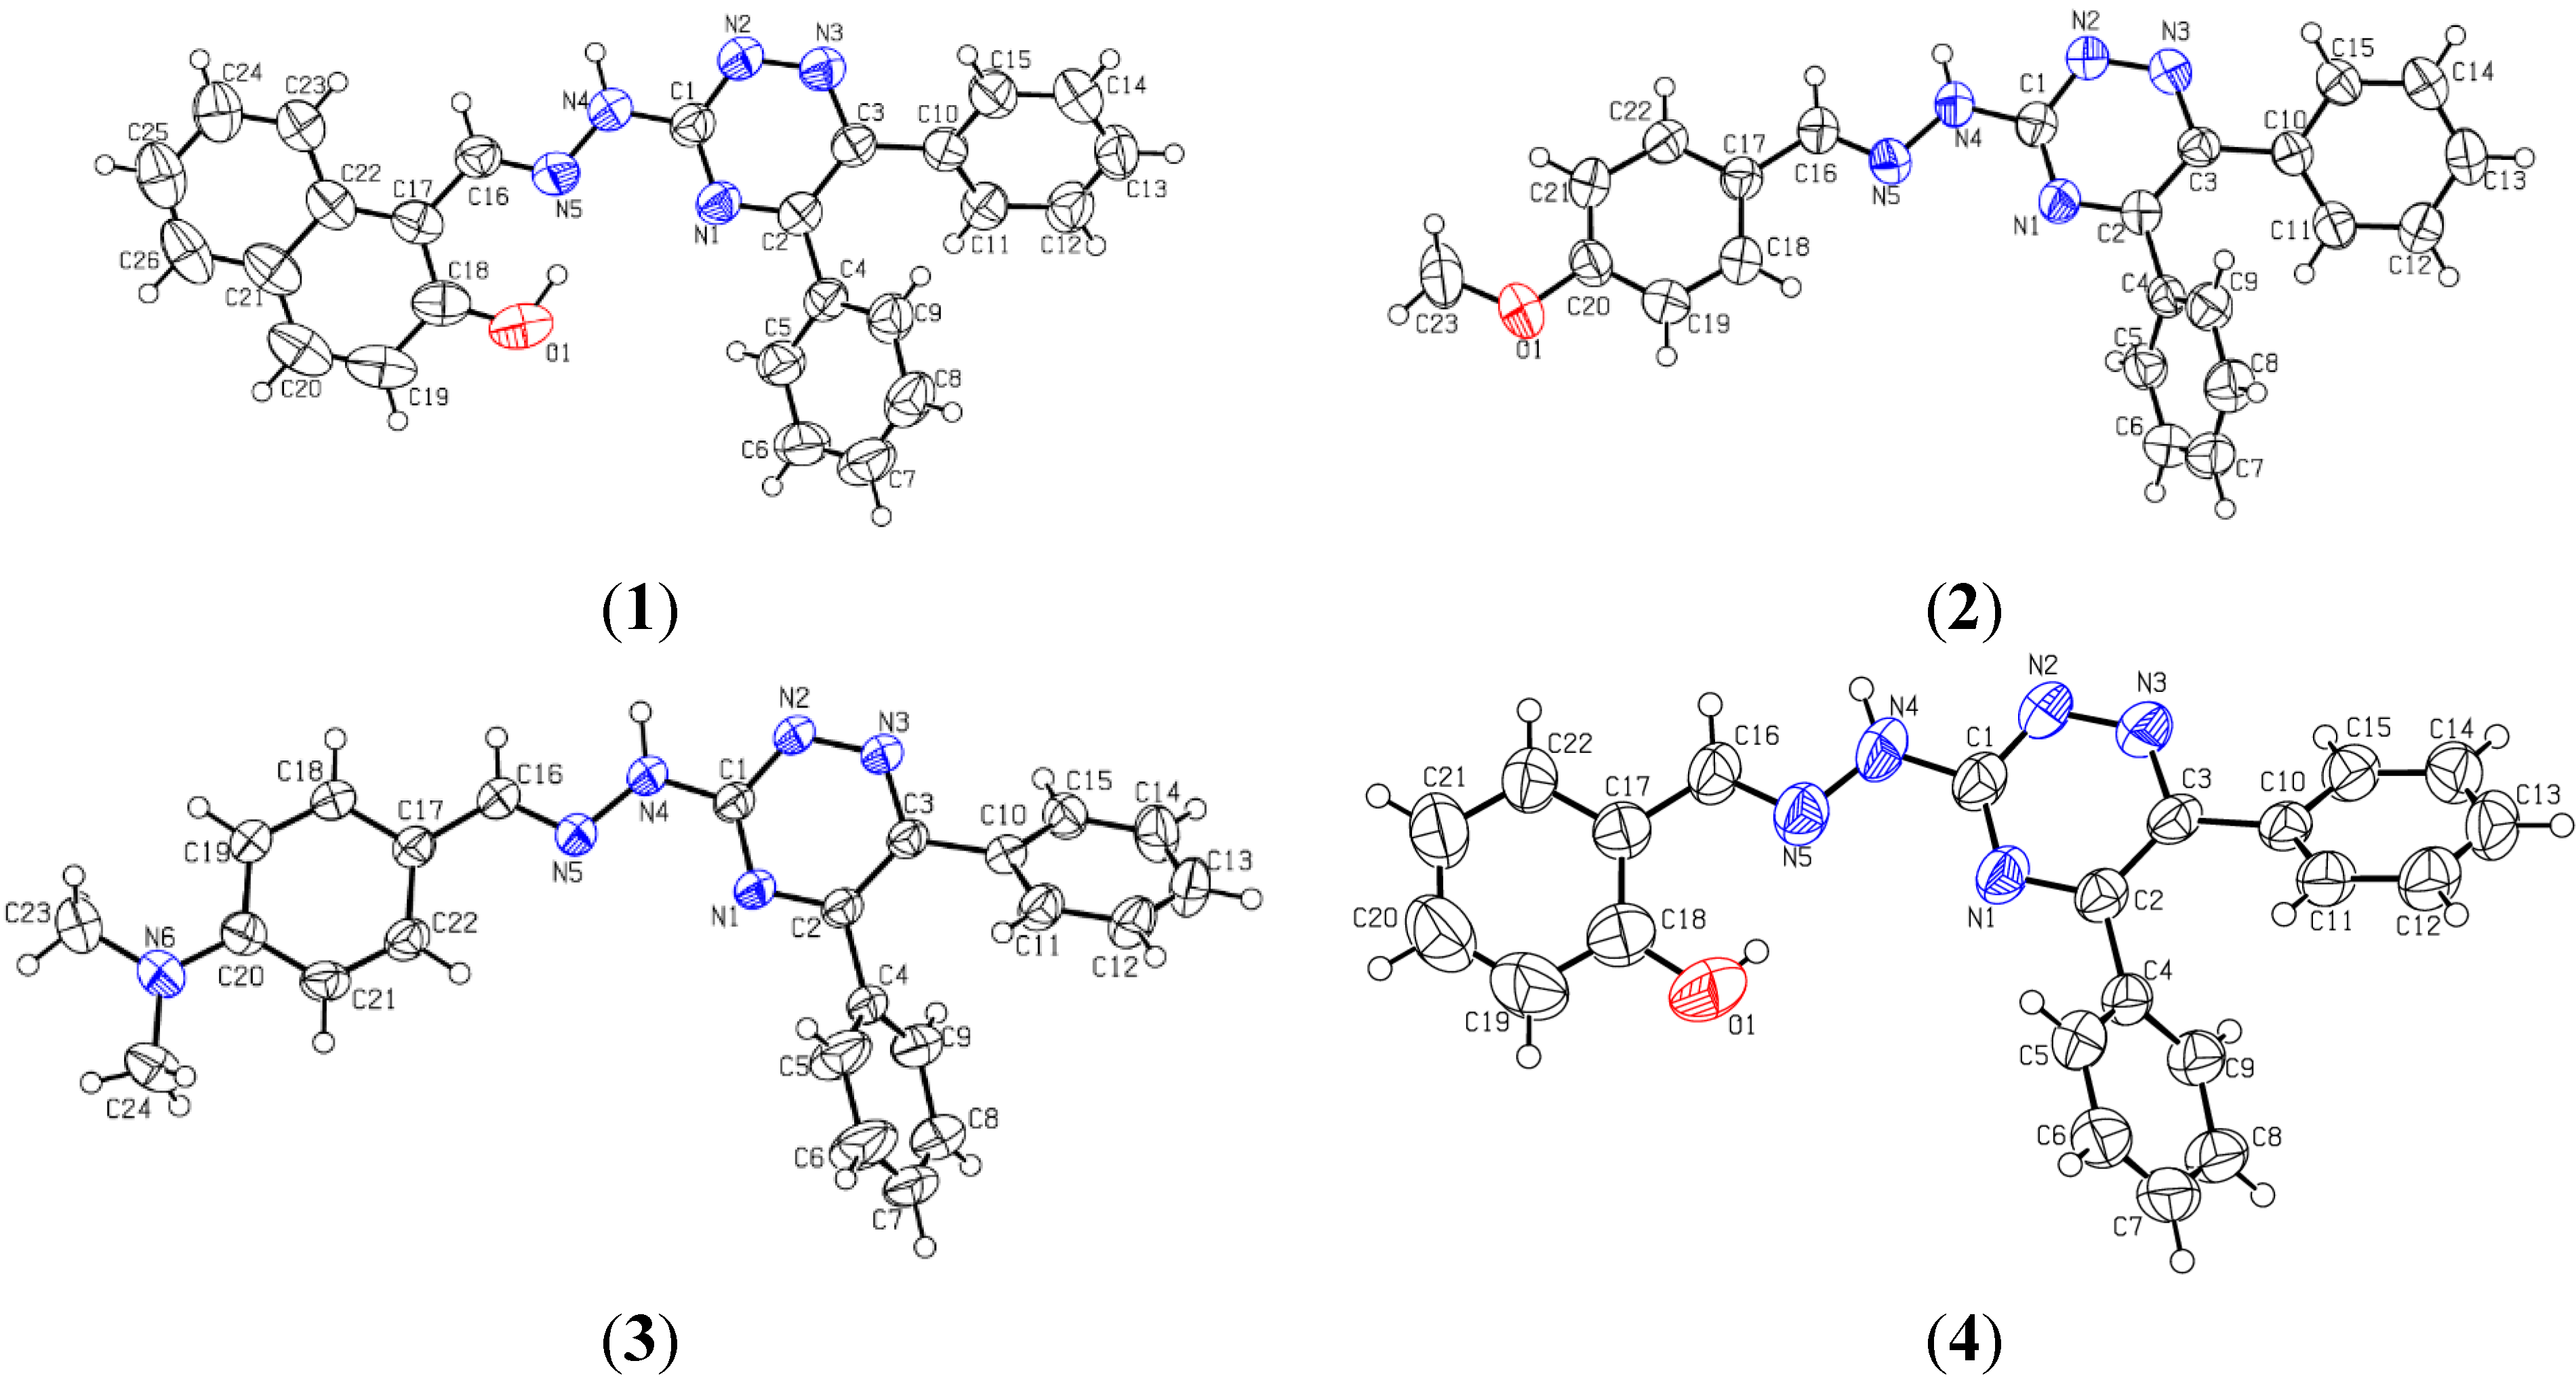
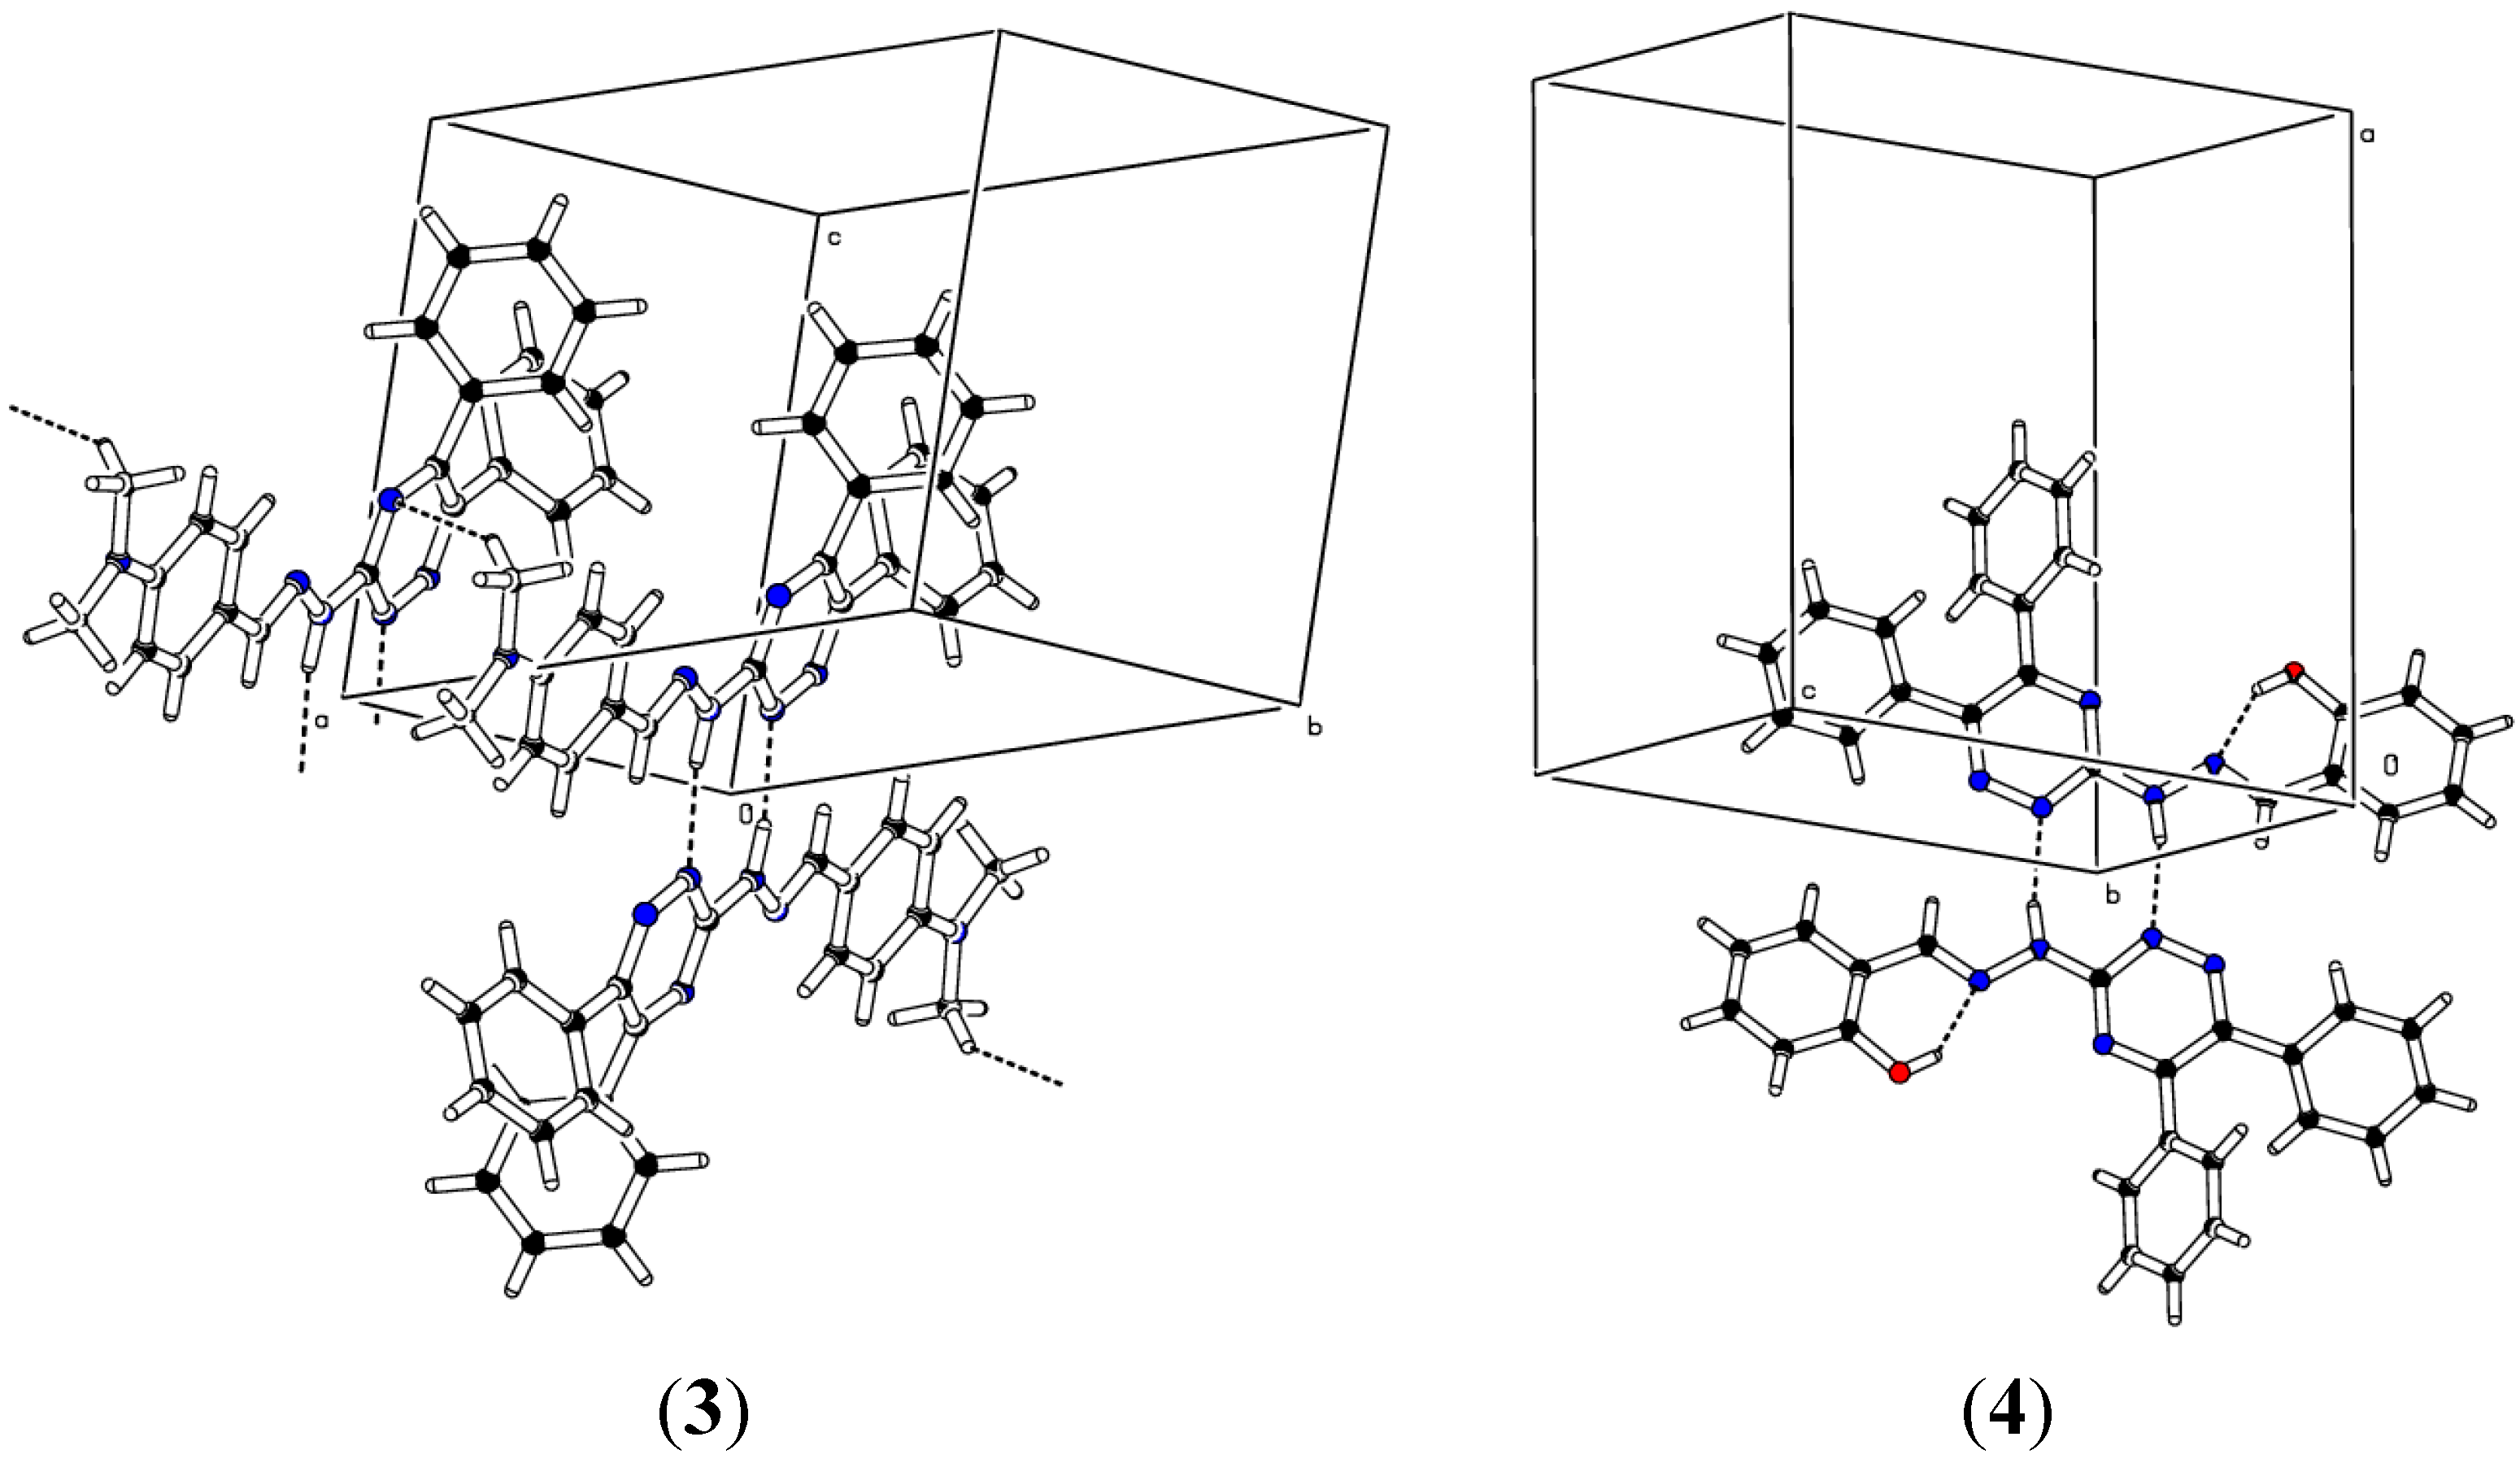
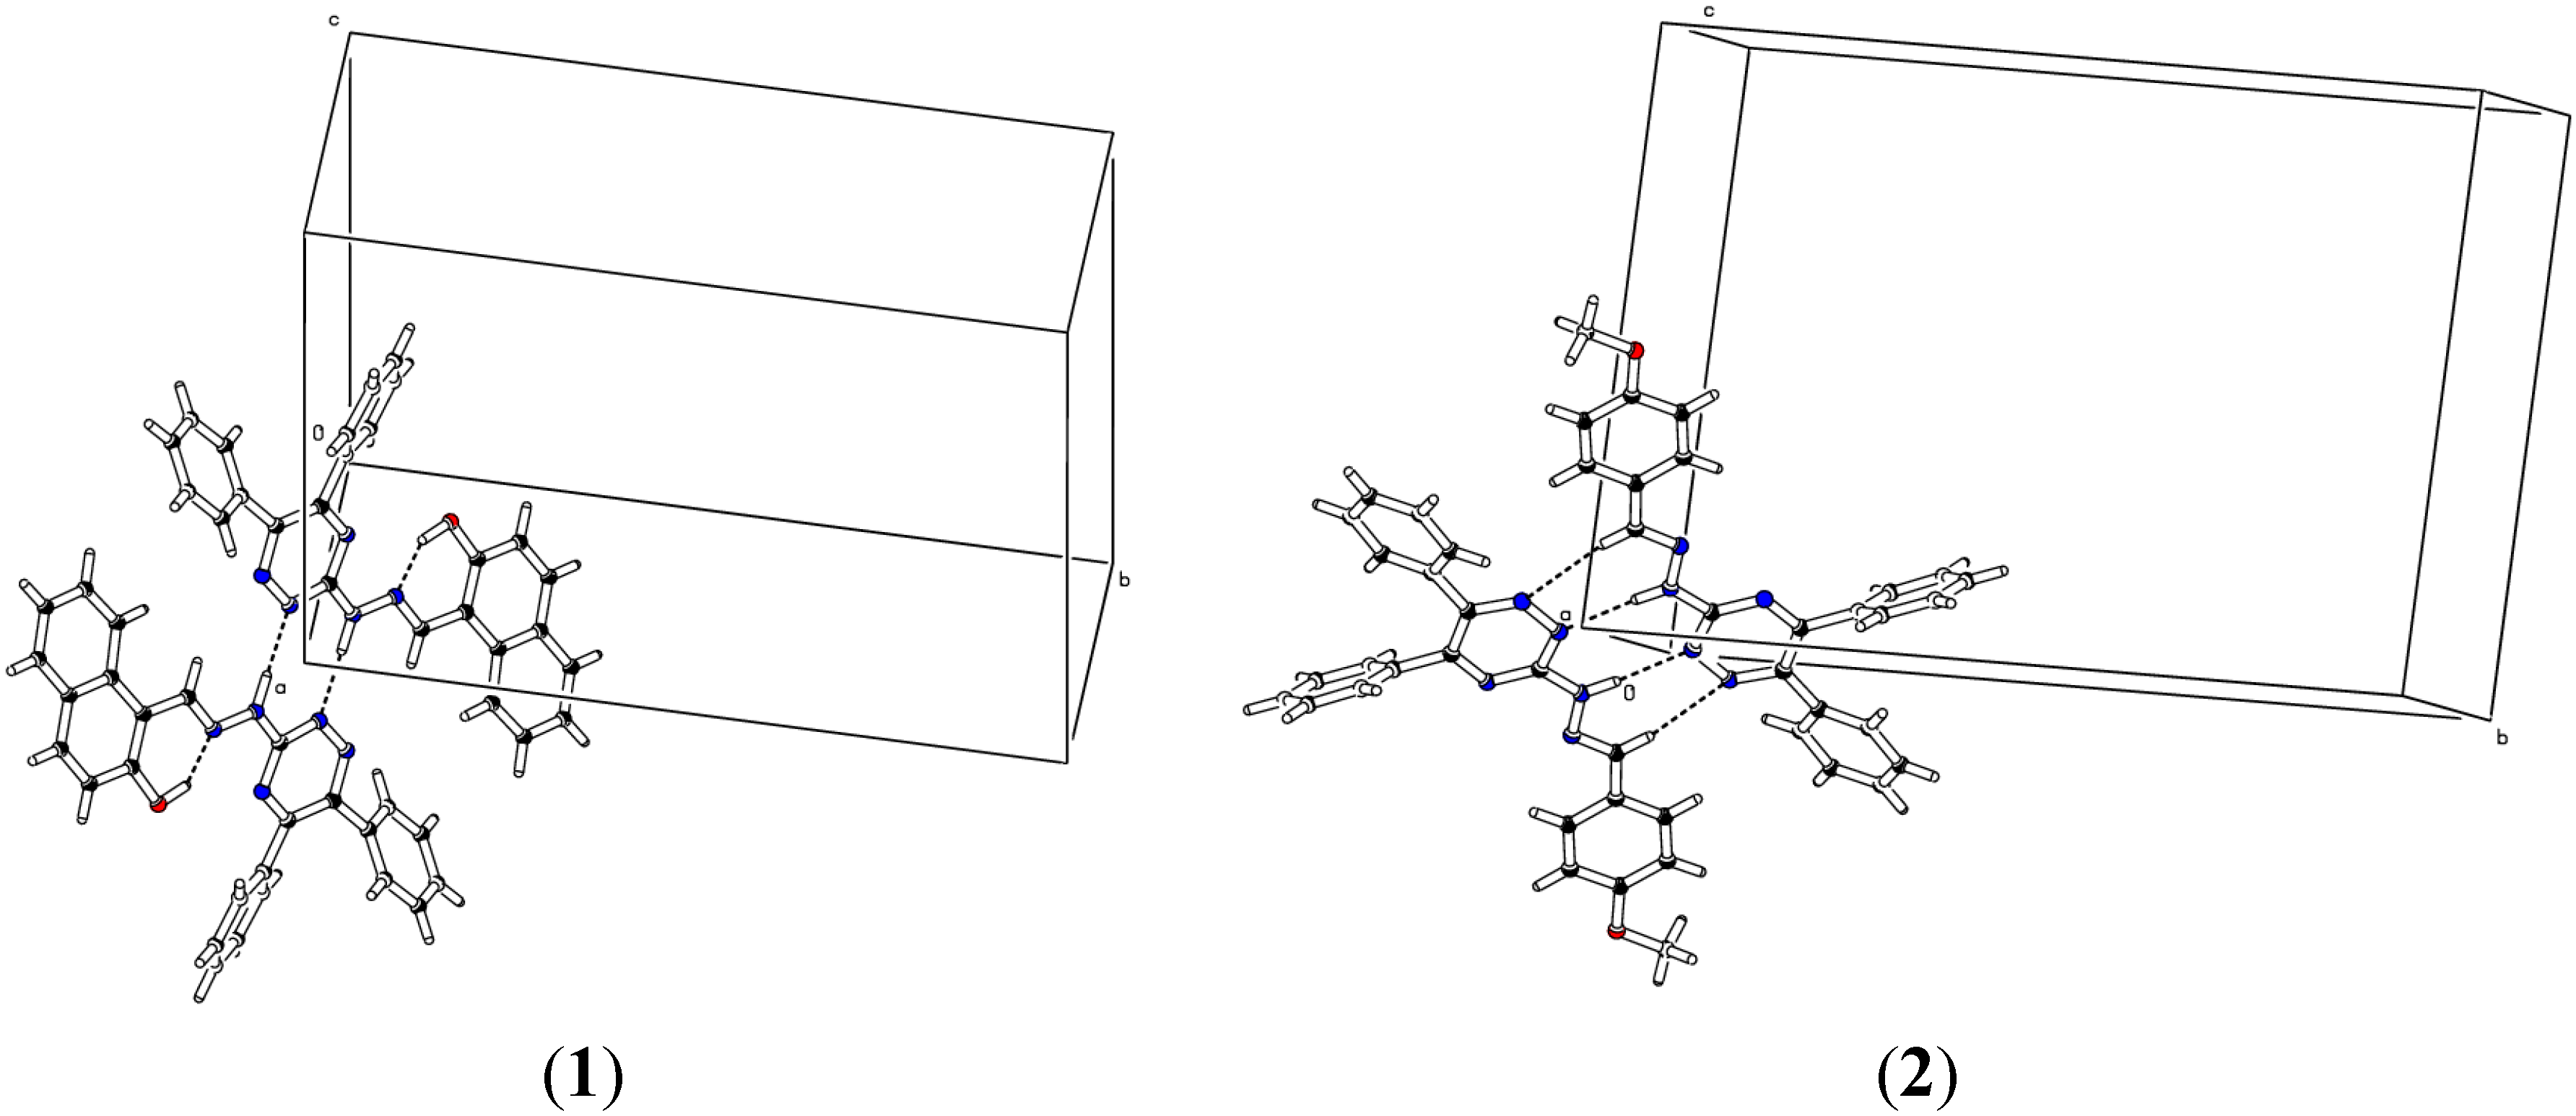
2.2. Crystallographic Studies

All four compounds were crystalized from dimethyl sulfoxide (DMSO) solution while standing in the lab at room temperature for about three months. In order to establish the X-ray structures suitable crystals were picked under a microscope. The structures of the compounds were established in order to understand their three dimensional interactions in a unit cell. Complete crystallographic parameters of all compounds 14 are provided in Table 1. The ORTEP diagrams of all compounds are shown in Figure 2.
Table 1. Crystal data and structure refinement parameters.
Identification Code1234
Empirical formulaC26H19N5OC23H19N5OC24H22N6C22H17N5O
Formula weight417.46381.43394.48367.41
Temperature/K296.15296.15296.15296.15
Crystal systemmonoclinicmonoclinictriclinicmonoclinic
Space groupP21/nP21/cP-1P21/c
a/Å6.5745(2)5.9756(18)8.8933(10)14.9753(17)
b/Å19.9133(6)21.573(6)11.1477(11)6.1220(6)
c/Å15.9805(5)14.980(4)11.7484(13)21.038(2)
α/°90.0090.0091.212(9)90.00
β/°96.369(3)93.45(2)106.044(10)103.992(11)
γ/°90.0090.00108.519(9)90.00
Volume/Å32079.25(11)1927.7(9)1053.8(2)1871.6(3)
Z4424
ρcalcmg/mm31.3341.3141.2431.304
m/mm−10.6770.0840.0770.084
F(000)872.0800.0416.0768.0
Crystal size/mm30.48 × 0.16 × 0.150.48 × 0.08 × 0.050.32 × 0.26 × 0.170.43 × 0.15 × 0.05
2θ range for data collection7.12 to 152°5.76 to 58.66°5.62 to 58.9°5.6 to 59.14°
Index ranges−6 ≤ h ≤ 8,−7 ≤ h ≤ 8,−11 ≤ h ≤ 9,−19 ≤ h ≤ 19,
−25 ≤ k ≤ 21,−27 ≤ k ≤ 24,−12 ≤ k ≤ 14,−8 ≤ k ≤ 7,
−20 ≤ l ≤ 19−20 ≤ l ≤ 18−16 ≤ l ≤ 15−29 ≤ l ≤ 26
Reflections collected1233911554937911939
Independent reflections4304[R(int) = 0.0185]4608[R(int) = 0.0727]5004[R(int) = 0.0252]4597[R(int) = 0.0620]
Data/restraints/parameters4304/0/2904608/1/2665004/0/2744597/1/257
Goodness-of-fit on F21.0361.0121.0380.961
Final R indexes [I ≥ 2σ (I)]R1 = 0.0428,R1 = 0.0626,R1 = 0.0541,R1 = 0.0601,
wR2 = 0.1156wR2 = 0.0925wR2 = 0.1221wR2 = 0.1236
Final R indexes [all data]R1 = 0.0546,R1 = 0.1988,R1 = 0.0840,R1 = 0.1880,
wR2 = 0.1273wR2 = 0.1358wR2 = 0.1423wR2 = 0.1670
Largest diff. peak/hole/e Å−30.19/−0.200.16/−0.190.25/−0.160.13/−0.16
Compounds 14 are structurally similar regarding the triazine moiety and the two phenyl rings attached to it. However, these hydrazones differ in the hydrazomethyl moieties attached the central triazine ring. The triazine ring is planar mainly because all atoms are sp2 hybridized. Root mean square deviation values of the fitted atoms of ring are 0.0285(2) Å, 0.0215(1) Å, 0.0187(1) Å and 0.0264 Å for molecules 14, respectively. The dihedral angles between the triazine ring and substituted phenyl rings are 37.99(5)° and 43.08(6)° in 1, 60.39(7)° and 31.77(1)° in 2, 61.08(8)° and 44.91(6)° in 3 and 50.02(7)° and 34.70(1)° in compound 4. The two aromatic rings attached to the triazine moiety are twisted at dihedral angles of 55.01(5)°, 61.85(7)°, 56.46(9)° and 57.22(7)° in all compounds 14 respectively. The different dihedral angles reflect that all molecules have different spatial environment as well as Vander Walls’ interactions in their unit cells (Figure 3). Hydrogen bond parameters of all compounds have been listed in Table 2.
Figure 2. ORTEP diagrams of compounds 14. Thermal ellipsoids were drawn at 50% probability level.
Molecules 20 05851 g002
Compound 1 and 4 formed inverted dimers through only one carboxylic type N-H…N interaction. The compound 2 formed inverted dimers via N-H…N classical type interactions (two). Compound 3 involved the formation of dimers through classical N-H…N interaction. These dimers are further connected through non-classical C-H…N interaction in zig-zag manner (Figure 3). Triazine moiety is not planer with the substituted phenyl rings (C17-C22) and dihedral angles of compounds 14 are 14.99(7)°, 5.13(2)°, 3.27(1)° and 14.04(2)°, respectively. Intramolecular hydrogen bonding has been observed in compound 1 and 4 bearing hydroxyl groups at the ortho positions to produce an S(6) six membered ring motif.
Figure 3. Unit cell diagrams of compounds 14 showing the inter- and intramolecular hydrogen bonding.
Molecules 20 05851 g003aMolecules 20 05851 g003b
Table 2. Hydrogen bond parameters of compounds 14.
DHAd(D-H)/Åd(H-A)/Åd(D-A)/ÅD-H-A/°
(1)
N4H2N210.971.912.8750(18)171.9
(2)
C16H16N320.932.583.496(4)168.5
N4H1N220.893(10)2.047(11)2.939(3)176(3)
(3)
N4H1N230.972.032.995(2)168.8
C24H24CN140.962.593.449(3)148.7
(4)
O1H1ON50.821.932.646(3)146.1
N4H2N250.889(10)2.033(12)2.907(4)167(3)
12 − X, −Y, −Z, 21 − X, 1 − Y, 1 − Z, 3−X, −Y, −Z, 41 + X, +Y, +Z, 5−X, 2 − Y, −Z

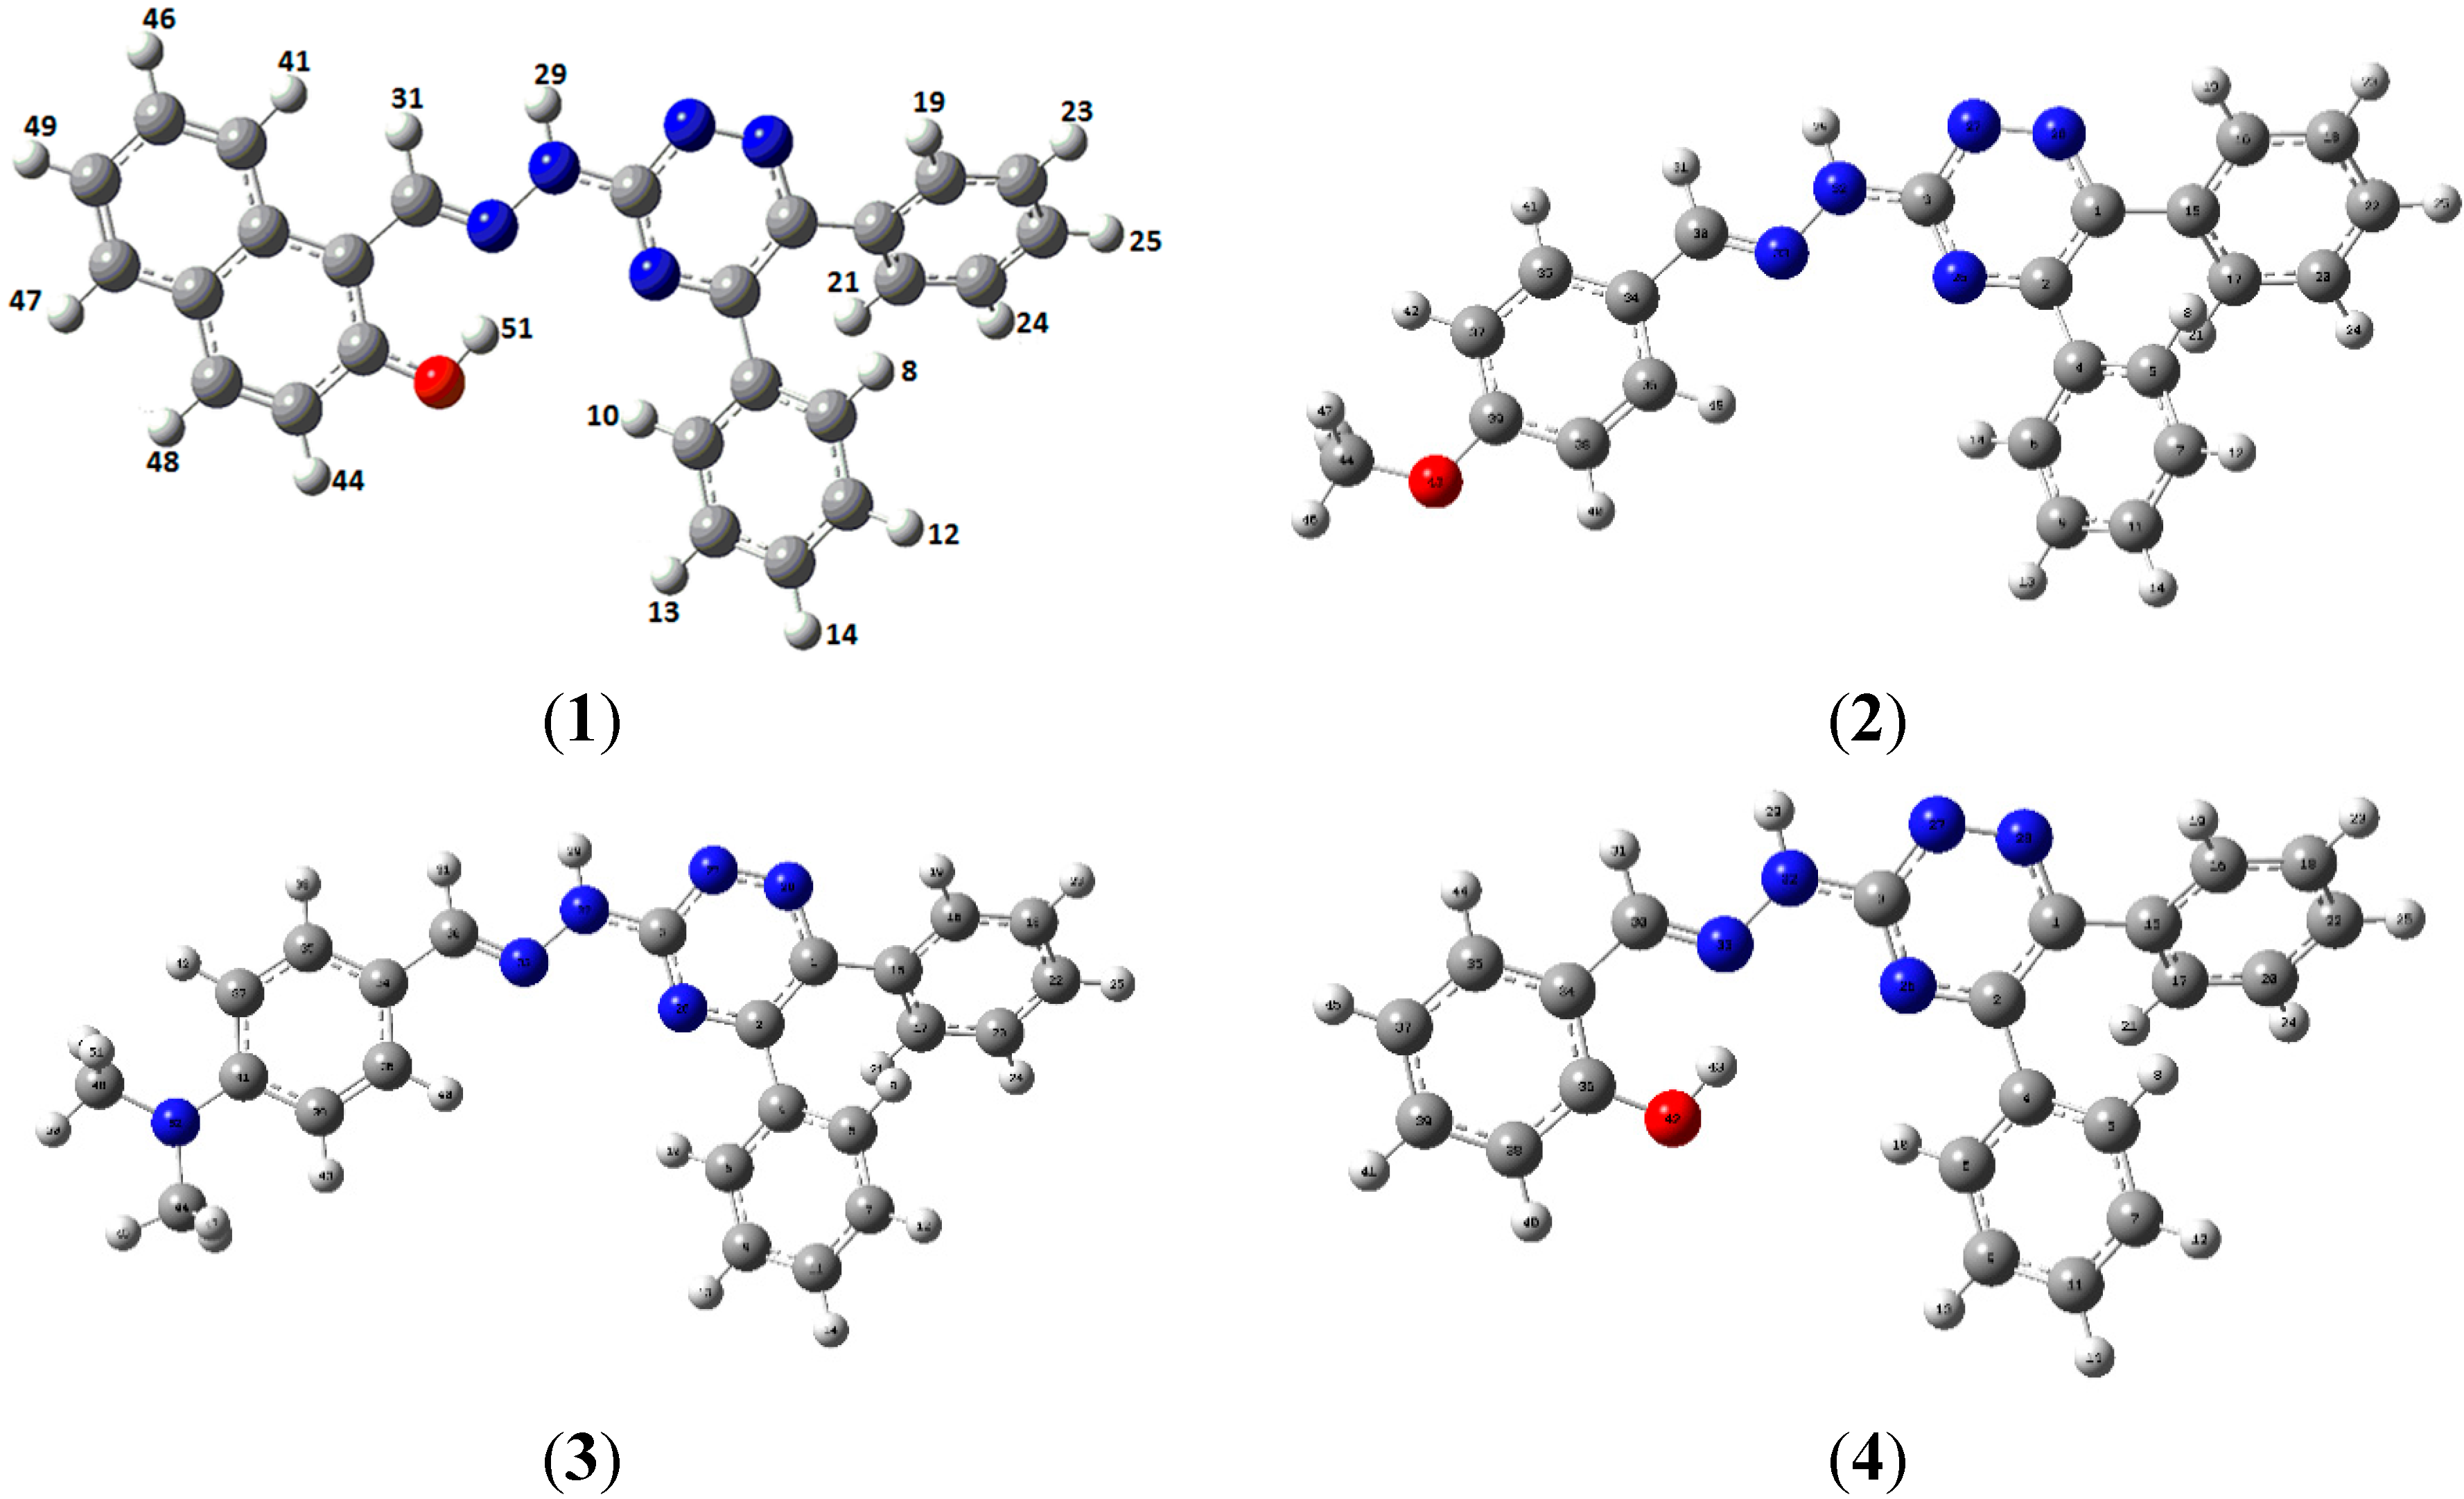
2.3. Geometries Optimization

Theoretical studies have been performed to compare the geometric parameters with those obtained from X-ray diffraction studies. The geometric parameters of title compounds 14 were optimized using Gaussian 09 program at B3LYP/6-31G (d, p) level of DFT. Optimized geometries are shown in Figure 4 and comparison of simulated bond lengths and bond angles of compounds 14 along with X-ray values are listed in Table 3, Table 4, Table 5 and Table 6, respectively.
Figure 4. Optimized geometries of compounds (14) at B3LYP/6-31G (d, p) level of DFT.
Molecules 20 05851 g004
Table 3. Selected molecular structure parameters of compound 1.
Bond Lengths (A°) Experimental B3LYP/6-31G (d, p)
O1-C181.353(2)1.430
N1-C11.341(18)1.335
N1-C21.327(18)1.335
N2-N31.328(17)1.315
N2-C11.338(19)1.354
N3-C31.336(17)1.347
N4-N51.364(18)1.354
N4-C11.356(19)1.368
N5-C161.286(19)1.294
Bond Angles (°)
C2-N1-C1116.2(12)116.3
N3-N2-C1118.1(12)116.9
N2-N3-C3120.2(12)121.2
C1-N4-N5119.4(12)123.1
C16-N5-N4117.9(13)116.6
N1-C1-N4119.3(13)120.6
N2-C1-N1125.4(13)125.7
N2-C1-N4115.2(13)113.5
N1-C2-C3120.0(12)119.4
N1-C2-C4114.6(12)115.1
N3-C3-C2119.4(13)118.9
N3-C3-C10115.0(12)114.7
O1-C18-C19116.1(16)118.9
Table 4. Selected molecular structure parameters of compound 2.
Bond Lengths (A°) Experimental B3LYP/6-31G (d, p)
O1-C201.377(3)1.362
O1-C231.426(3)1.419
N1-C11.332(3)1.334
N1-C21.330(3)1.335
N2-N31.343(3)1.316
N2-C11.353(3)1.353
N3-C31.334(3)1.346
N4-N51.387(3)1.351
N4-C11.372(3)1.370
Bond Angles (°)
C2-N1-C1115.6(2)116.3
N3-N2-C1117.3(2)116.7
N2-N3-C3120.2(2)121.2
C1-N4-N5121.9(2)121.9
C16-N5-N4112.5(2)119.1
N1-C1-N4122.1(2)119.7
N2-C1-N1126.3(2)126.1
N2-C1-N4111.6(3)114.0
N1-C2-C3120.9(3)119.1
N1-C2-C4115.5(2)115.3
N3-C3-C2119.4(2)119.1
N3-C3-C10113.9(2)114.7
C20-O1-C23117.6(3)118.5
Table 5. Selected molecular structure parameters of compound 3.
Bond Lengths (A°) Experimental B3LYP/6-31G (d, p)
O1-C11.347(2)1.521
N1-C21.325(2)1.402
N2-N31.333(2)1.540
N2-C11.351(2)1.395
N3-C31.336(2)1.402
N4-N51.381(2)1.540
N4-C11.349(2)1.540
N5-C161.282(2)1.540
N6-C201.372(2)1.383
Bond Angles (°)
C2-N1-C1115.3(14)116.3
N3-N2-C1118.3(13)119.9
N2-N3-C3119.6(14)119.6
C1-N4-N5122.4(14)109.4
C16-N5-N4113.8(14)109.4
N1-C1-N4120.7(15)120.9
N2-C1-N1125.4(15)118.1
N2-C1-N4113.7(14)120.9
N1-C2-C3121.2(15)120.4
N1-C2-C4116.5(15)119.1
N3-C3-C2119.7(14)120.4
N3-C3-C10116.5(14)119.1
Table 6. Selected molecular structure parameters of compound 4.
Bond Lengths (A°) Experimental B3LYP/6-31G (d)
O1-C181.357(4)1.341
N1-C11.336(3)1.334
N1-C21.337(3)1.336
N2-N31.338(3)1.317
N2-C11.338(3)1.350
N3-C31.339(3)1.346
N4-N51.383(3)1.351
N4-C11.360(3)1.371
N5-C161.271(3)1.291
Bond Angles (°)
C2-N1-C1115.9(2)116.3
N3-N2-C1117.9(2)116.7
N2-N3-C3120.4(2)121.2
C1-N4-N5122.5(3)121.8
C16-N5-N4115.1(2)119.2
N1-C1-N4120.9(3)119.6
N2-C1-N1126.0(3)126.1
N2-C1-N4113.1(3)114.0
N1-C2-C3120.4(2)119.0
N1-C2-C4116.0(2)115.3
N3-C3-C2119.1(2)119.1
N3-C3-C10114.3(2)114.6
O1-C18-C19118.3(3)115.8
The results listed in Table 3, Table 4, Table 5 and Table 6 show that X-ray and simulated bond lengths/angles of all atoms in compounds 14 correlated nicely. Deviation in the selected bond lengths/angles of compound 1 was observed in the range of 0.006–0.077 Å/0.1–3.7°. Maximum deviation in bond length was 0.077 Å for O1-C18. Similarly maximum deviation in bond angle was 3.7° for C1-N4-N5. For 2 deviation in selected bond lengths/angles was found in the range 0–0.036 Å/0–6.6°. Similarly the maximum deviation in bond lengths/angles of compound 3 and 4 was observed in the range 0.011–0.258 Å/0–7.3° and 0.001–0.032 Å/0–4.1°.
Comparative analyses of the geometric data of compounds 14 also indicate that the intramolecular hydrogen bonding affect the geometric parameters, particularly the C1-N2, of compound 1 and 4. The C1-N2 bond length decreases with the increase in the strength of intramolecular hydrogen bonding. The intramolecular hydrogen bonding is stronger in compound 1 compared to compound 4, and it is reflected in shortened O1-C18 bond length (1.353) of compound 1. Moreover, N4-N5 bond length is also shortened for compound 1 (strong intramolecular hydrogen bonding). The bond lengths in the triazine central ring depend not only on the strength of the intramolecular hydrogen bonding but also on the strength of mesomeric electron donation. In general, relatively shorter bond lengths are observed for compound 1 whereas compound 2 shows relatively larger bond lengths. Relatively shorter bond lengths for compounds 3 compared to 2 can be attributed to relatively strong conjugation of NMe2 group (strong donor than methoxy through resonance) with the triazine skeleton.

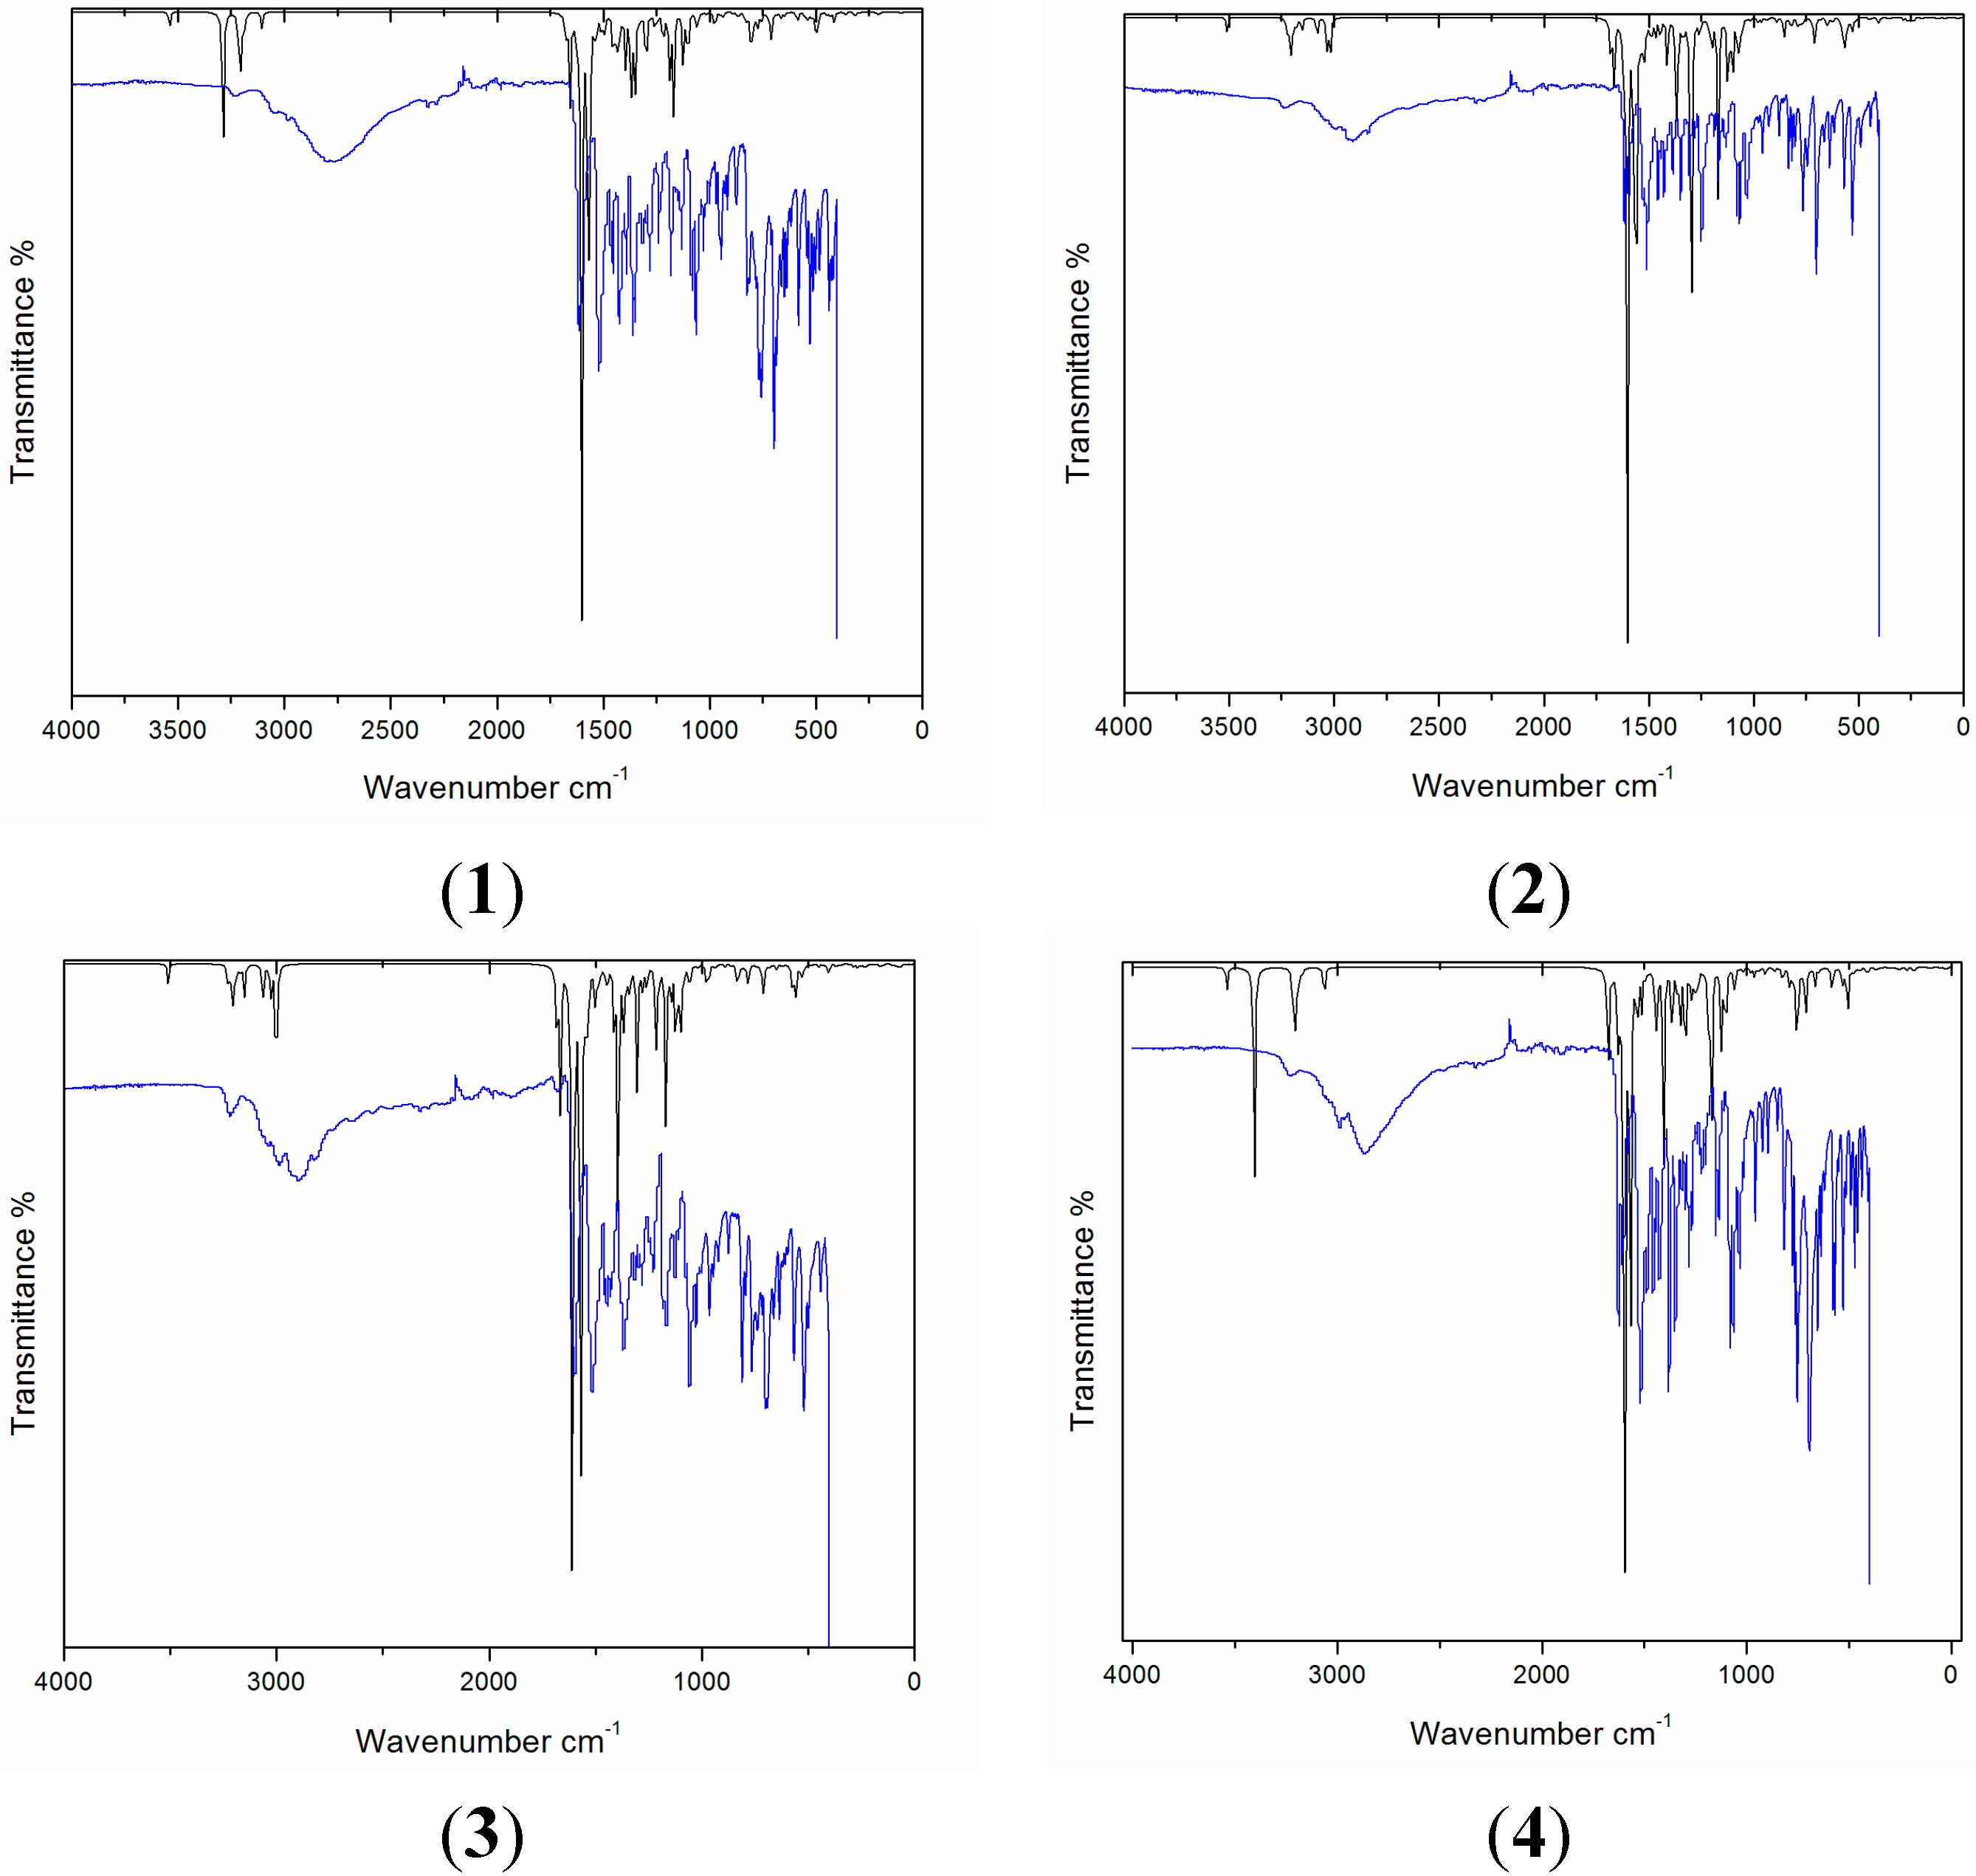
2.4. Vibrational Analysis

Vibrational spectroscopy is a spectroscopic technique used in chemistry for the identification of functional groups in order to elucidate the structure of a target molecule, kinetics of chemical reactions, etc. Both experimental and simulated spectra are shown in the Figure 5. Comparison of prominent frequencies of compounds 14 has given in Table 7.
Figure 5. Simulated (balck) and experimental (blue) vibrational spectra of compounds 14.
Molecules 20 05851 g005
For the correction of theoretical errors in this work, the theoretical harmonic frequencies above 1700 cm−1 were scaled by a scaling factor of 0.958, and frequencies less than 1700 cm−1 were scaled by 0.9627 [14]. Compounds 14 mainly have NH, N=CH and aromatic ring functional groups. These compounds have very comparable structures regarding functional groups except compound 3 which bears a dimethyl amino group. Therefore, the vibrations in compounds 14 are very comparable. For example, C=C aromatic vibrations are observed at 1611 (1), 1611 (2), 1593 (3) and 1621 cm−1 (4). The lower stretching vibration for compound 3 compared to 1, 2 and 4 may be attributed to the better conjugation of the dimethylamino group with the triazine skeleton. Despite similar vibrations, characteristic distinguishing vibrations could be seen for each compound. For example, methyl groups in 3 appear at 2950 (asymmetric stretching), 2947 (asymmetric stretching), 2891 (symmetric stretching), 2884 cm−1 (symmetric stretching). Moreover, the C-N stretching vibration is observed at 1341 cm−1. Compound 2 was characterized by an O-Ph stretching vibration at 1244 cm−1.
Table 7. Prominent experimental and simulated vibrational (cm−1) values of 14.
1234
Exp. B3LYP AssignmentExp. B3LYP AssignmentExp. B3LYP AssignmentExp. B3LYP Assignment
1611
1517
1595ѴC=Carom1611
1513
1605ѴC=C1593
1507
1605ѴC=C1621
1515
1613ѴC=Carom
1542ѴC=Narom1542ѴC=Narom1550ѴC=N1565ѴC=Carom
1512ѴC=Narom1511ѴC=Narom1538ѴC=Narom1536ѴC=Narom
1367
1280
1506ѴN=Carom1350
1247
1499ѴC=Carom1428
1363
1511ѴN=Carom1375
1279
1510ѴC=Narom
1319ѴC-Carom1318ѴC-Carom1508ѴC=Narom1353βCHarom
1301ѴC-Carom1250ѴO-Ph1341ѴNPh1251ѴC-Carom
12391252ѴC-Carom11671127βCHarom12771257ѴC-Carom11331127ѴC=Narom
11791127ѴC=Narom1126ѴC=Narom1171βCHarom10781081βCHarom
10621061βCHarom10601080βCHarom11601126ѴC=Narom10621061βCHarom
756775βCHarom1060βCHarom10521079βCHarom750724γCHarom
764759γCHarom807803γCHarom688686γCHarom
516540γCHarom
From Table 7 it is clear that an excellent agreement exists among simulated and experimental vibrations. In compound 1, a strong simulated C=Carom. stretching vibration appeared at 1595 cm−1 and showed nice agreement with the experimental 1611 cm−1. Aromatic C=C stretching vibrations in 2 depicted at 1605 cm−1 theoretically, and correlates with the experimental 1611 cm−1. Similarly the computed aromatic C=C vibrations in compound 3 and 4 showed very nice agreement between theory and experiment. Prominent C=N stretching vibrations of 1 found at 1542 cm−1, 1506 cm−1 and 1127 cm−1 in simulated spectrum also shows strong agreement with the experimental counterparts appearing at 1517 cm−1, 1179 cm−1. The C=N stretching vibrations of 2, 3 and 4 also correlated excellently between theory and experiment (for individual values see Table 7).

2.5. Nuclear Magnetic Resonance Studies (1H-NMR)

The versatility in nuclear magnetic resonance spectroscopy makes it an unavoidable tool for the structural identification of compounds. Experimentally, NMR (both 1H and 13C) of all compounds 14 were recorded in DMSO and spectra are shown in the (Figure S1, Figure S2, Figure S3, Figure S4, Figure S5, Figure S6, Figure S7 and Figure S8, Supplementary Information). 1H-NMR chemical shift calculations were performed by using the fully optimized geometries at B3LYP/6-311+G (2d, p) level by adopting the GIAO method using the internal reference standard i.e., tetramethylsilane. The detailed simulated 1H-NMR chemical shift values are listed in Table 8.
All compounds have NH protons that appeared at 8.43 ppm (1), 8.49 ppm (2), 8.42 ppm (3) and 8.34 ppm (4) theoretically, whereas the experimental peaks appeared at 12.31 ppm (1), 11.80 ppm (2), 11.62 ppm (3), and 12.26 ppm (4). NH protons are solvent and environment dependent; therefore, it is very hard to compare the theoretical values with the experimental ones [15]. Compounds 1 and 4 contain OH functional groups and are involved in intramolecular hydrogen bonding as depicted from X-ray studies, therefore, these protons appeared theoretically at 12.87 ppm (1), 11.34 ppm (4), and show excellent correlation with the experimental values at 12.77 ppm (1), 11.47 ppm (4). Computed chemical shift values of azomethine protons appeared at 9.39 ppm (1), 8.00 ppm (2), 7.93 ppm (3) and 8.28 ppm (4), whereas experimental values appeared at 9.33 ppm (1), 8.22 ppm (2), 9.65 ppm (3) and 8.45 ppm (4) respectively. Aromatic protons of all compounds showed very excellent correlation between experimental and theoretically calculated chemical shifts. Simulated aromatic protons of 1 appeared in the range 8.98–7.28 ppm, which agrees very well with the experimental chemical shifts at 8.23–7.25 ppm. For compound 2, theoretical chemical shifts of aromatic protons (8.79–6.83 ppm) also correlate very nicely with the experimental chemical shifts (7.61–7.00 ppm). Similarly theoretical aromatic protons of 3 and 4 appeared in the range 8.87–6.74 ppm and 8.87–6.99 ppm, respectively which correlate nicely with the experimental chemical shifts at 7.68–6.74 ppm and 7.67–7.00 ppm. Theoretical data of all compounds showed close agreement with the experimental data.
Table 8. Simulated 1H-NMR chemical shifts of 14 (ppm) at B3LYP/6-311+G (2d, p) level (atomic labels are with reference to Figure 4).
(1)B3LYP (ppm)(2)B3LYP (ppm)(3)B3LYP (ppm)(4)B3LYP (ppm)
51H12.8710H8.8810H8.8743H11.34
31H9.3919H8.7919H8.8210H8.87
10H8.9848H8.6740H8.6419H8.76
19H8.6729H8.4929H8.4229H8.34
29H8.4331H8.0031H7.9331H8.28
41H8.3913H7.8413H7.8213H7.90
48H8.0623H7.8323H7.8023H7.85
47H8.0514H7.6314H7.6214H7.68
13H7.9725H7.628H7.6025H7.66
23H7.898H7.5725H7.5941H7.58
46H7.8341H7.4438H7.378H7.57
14H7.6424H7.3524H7.3344H7.46
8H7.6412H7.3112H7.3124H7.37
25H7.6340H7.2921H7.2040H7.37
49H7.6221H7.2143H6.8712H7.33
44H7.5542H6.8342H6.7421H7.25
24H7.4046H4.1149H3.4145H6.99
21H7.3647H3.7146H3.40
12H7.2845H3.7147H3.08
51H3.06
45H2.75
50H2.71
Since these hydrazones are structurally similar regarding the triazine skeleton therefore most of the chemical shifts appear similar in the NMR spectra. However, distinct differences have been observed in the chemical shifts arising from differences in the hydrazomethyl fragment. For example, the naphthalene moiety in 1 can easily be identified by a downfield chemical shift at 9.39 ppm (31H) which arises due to peri-hydrogens. Moreover, increased number of downfield chemical shifts between 8–9 ppm also supported the naphthalene part of compound 1. The ortho hydroxyl groups in compound 1 and 4 were supported by downfield chemical shifts at 12.77 ppm (1) and 11.47 ppm (4) (vide supra). The characteristic methoxy group of compound 2 appeared at 3.79 ppm in the experimental NMR spectrum which correlates nicely with the theoretical chemical shift at 4.11–3.71 ppm. Similarly, the characteristic dimethyl amino group in 3 was confirmed by chemical shift at 3.1 ppm, corresponding to six protons.

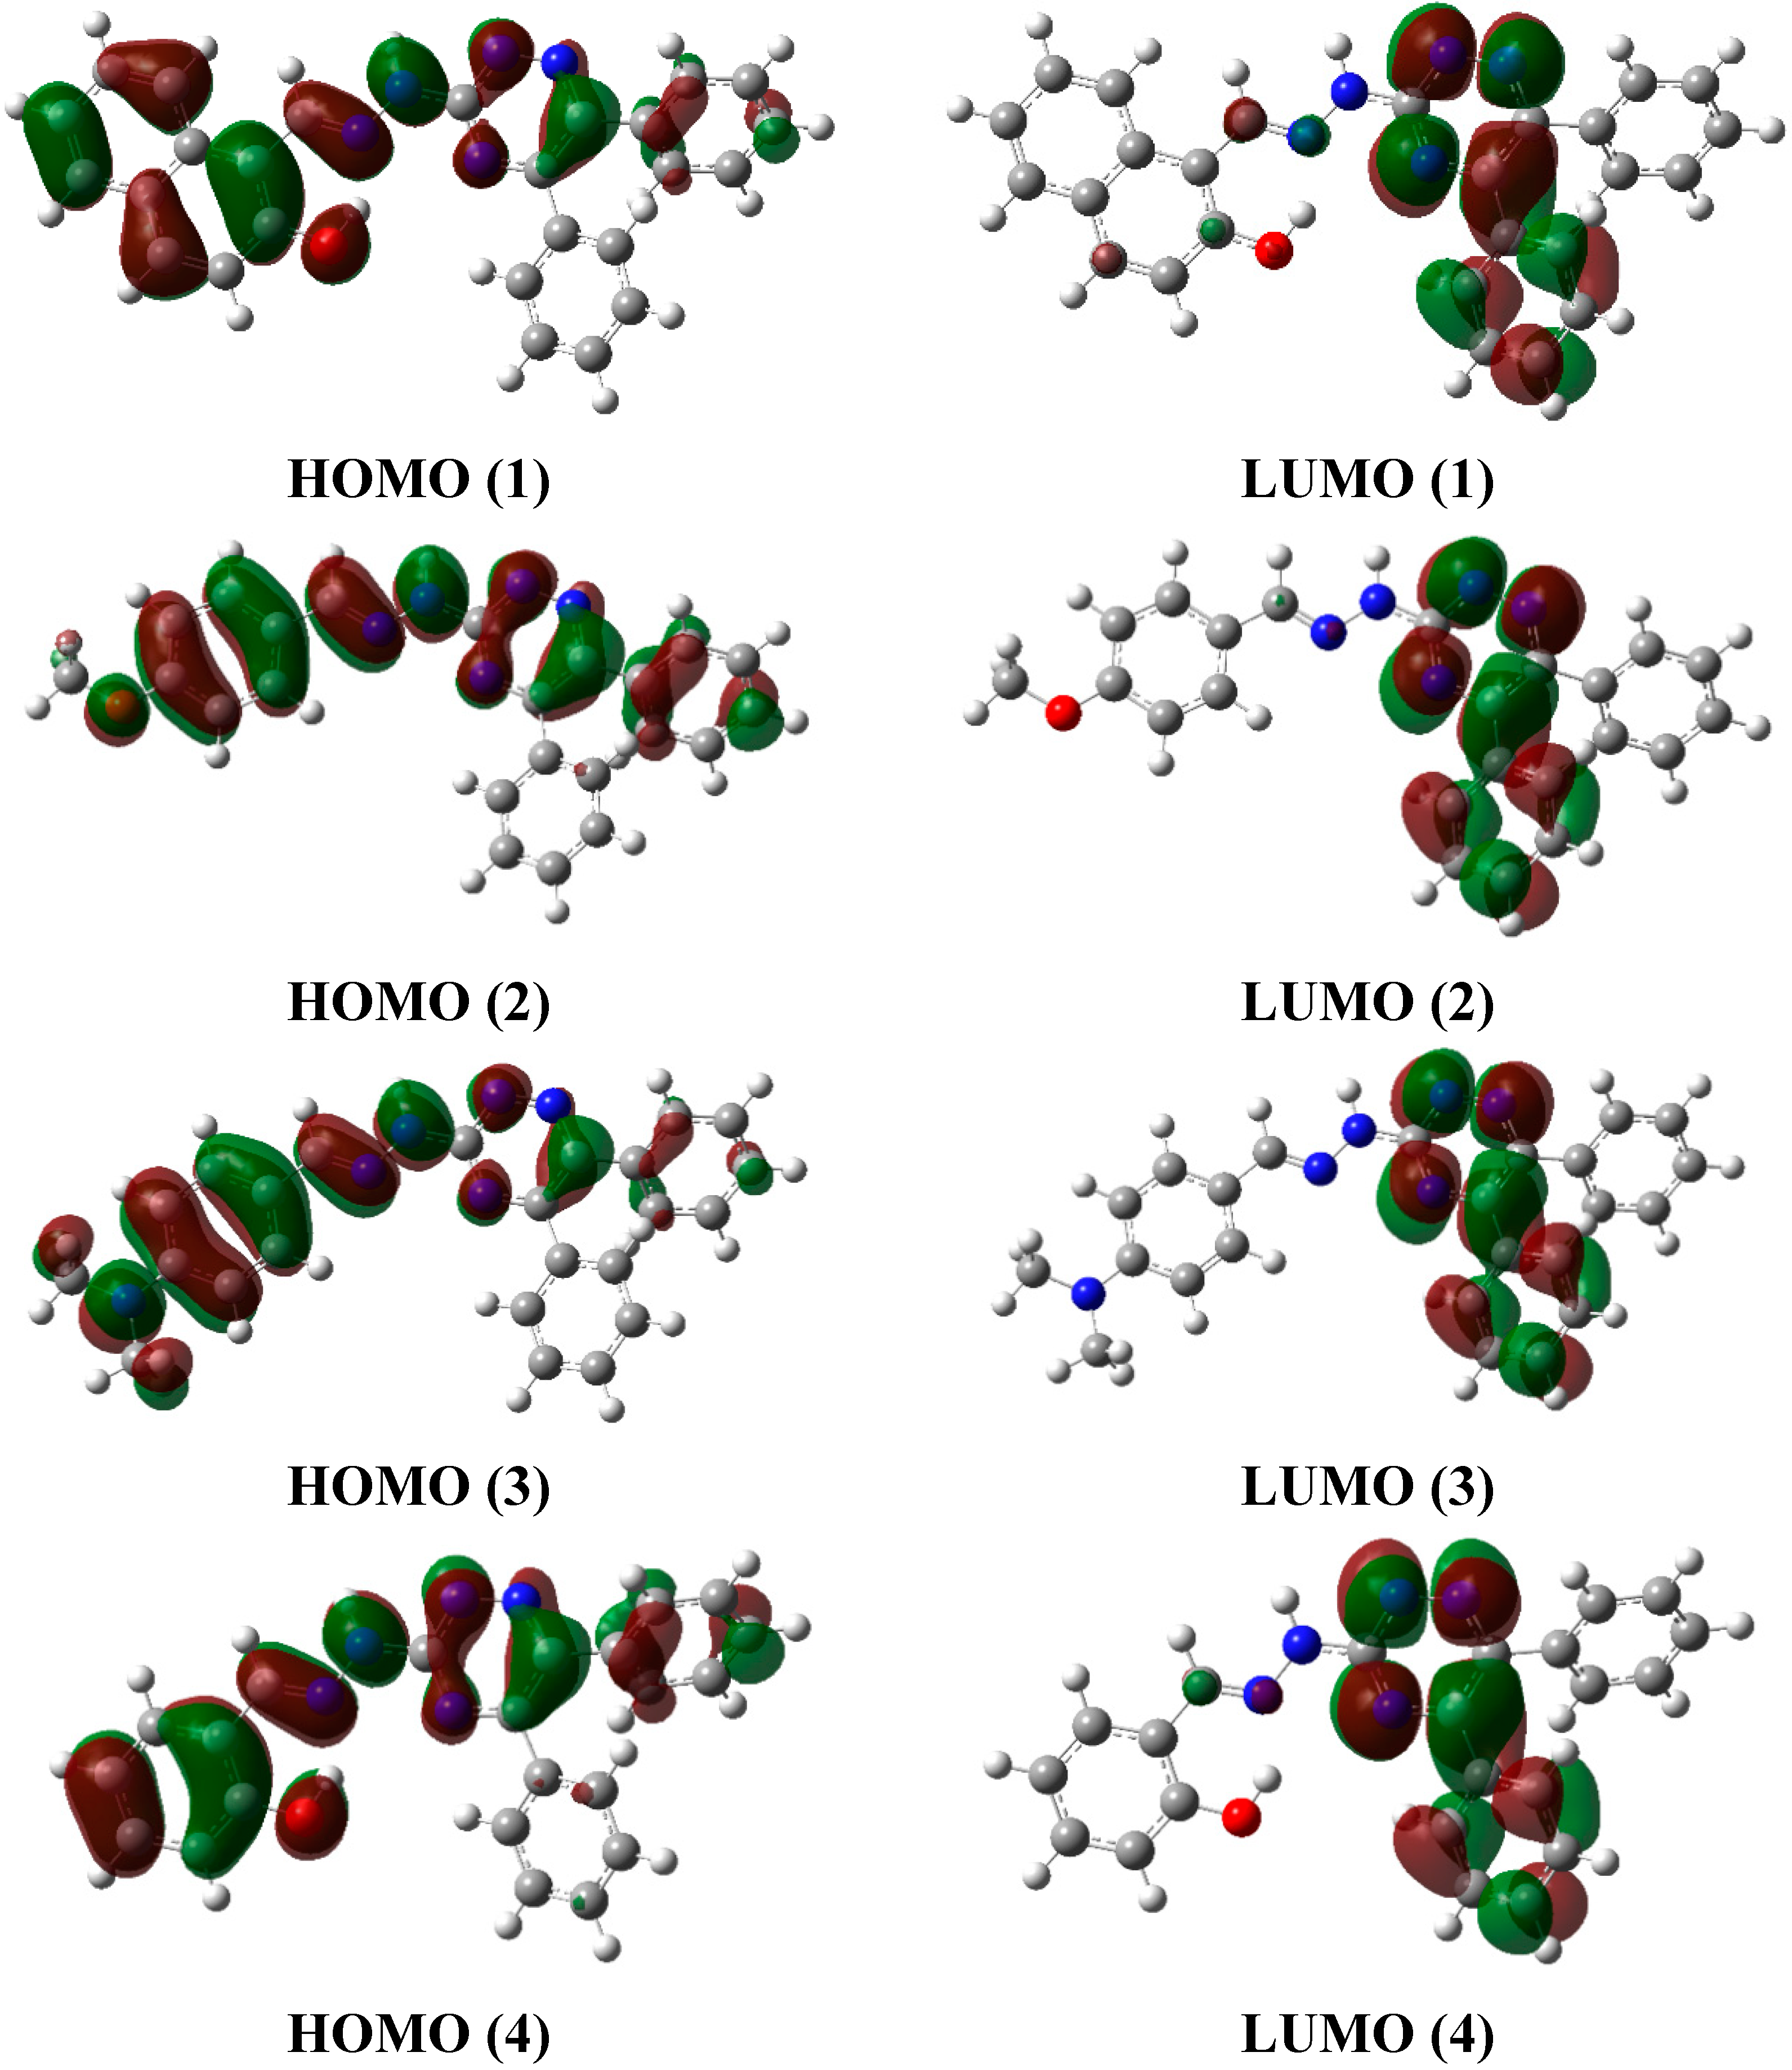
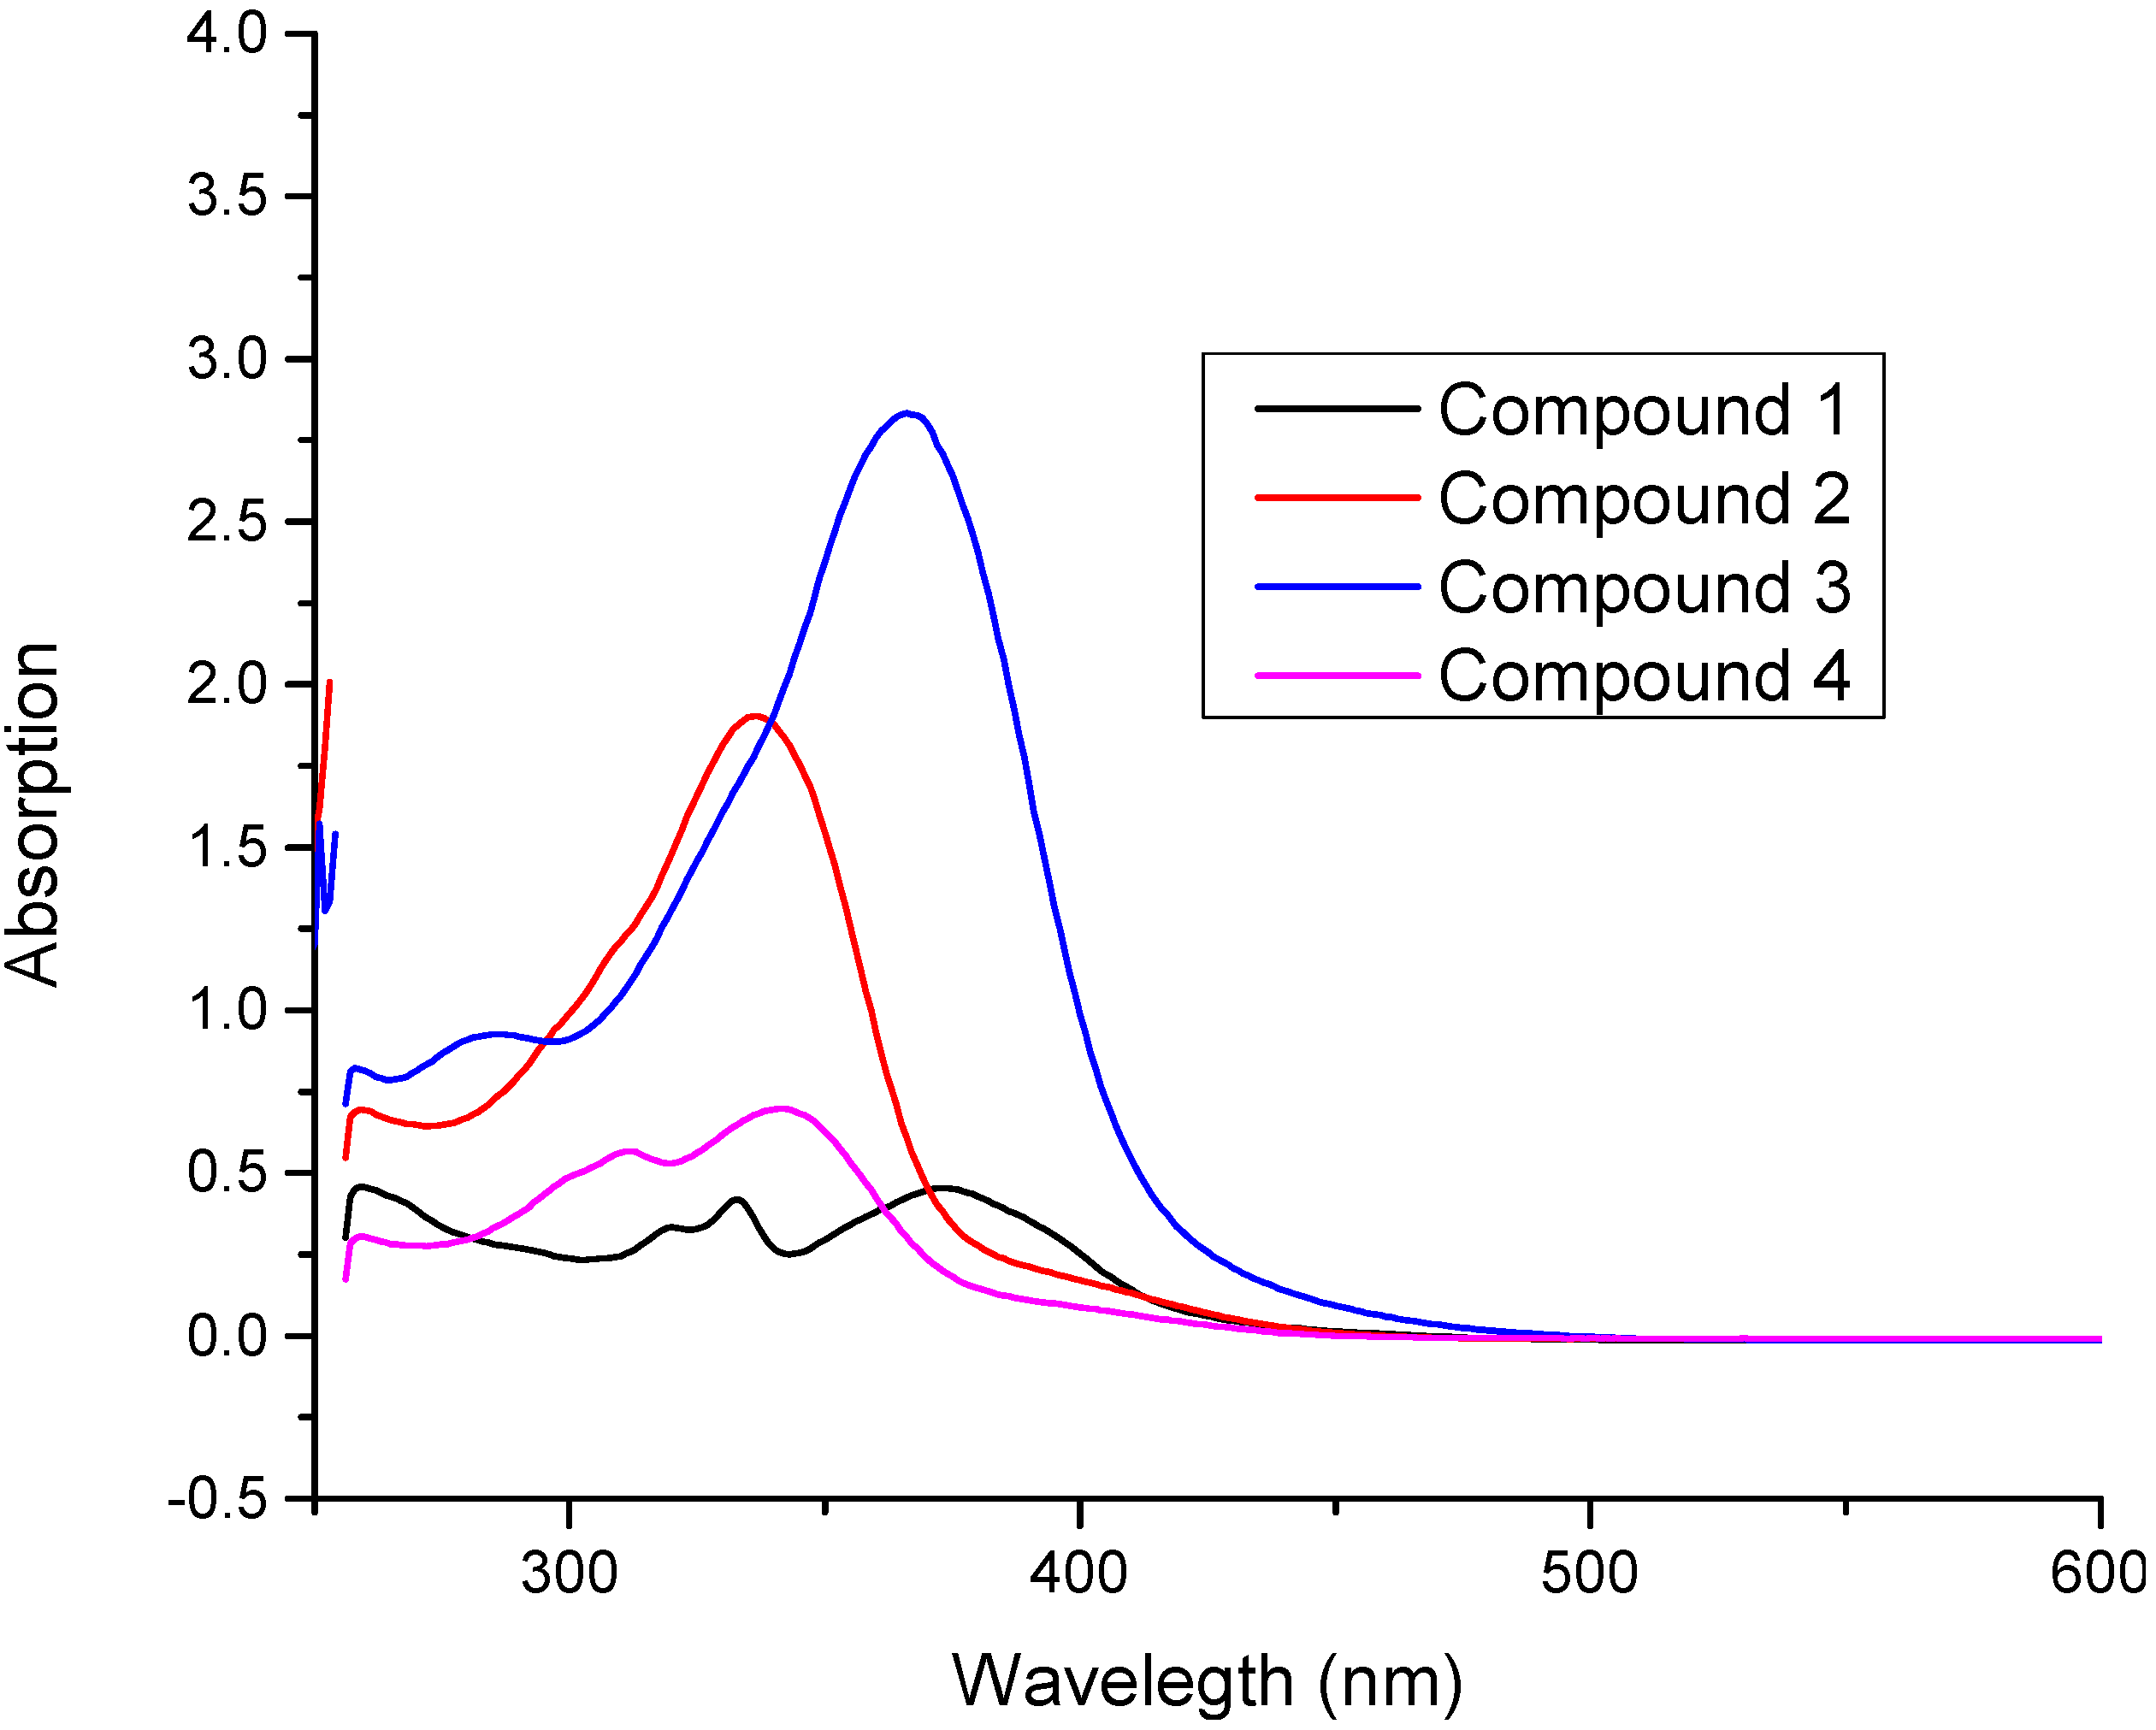
2.6. Frontier Molecular Orbital Analysis (FMO) and UV-Vis. Absorption Studies

FMO analysis is a physical property used to determine, ability to absorb light, electronic as well as optical properties of organic compounds [16]. In molecular interaction, the highest occupied molecular orbital (HOMO) and lowest unoccupied molecular orbital (LUMO) play the key role. HOMO is the orbital which has ability to donate electrons and its energy corresponds to ionization potential (I. P.), while LUMO has electrons accepting ability, and its energy corresponds to electron affinity (E. A.).
FMO analysis was computed at the same level as used for optimization along with additional keyword pop = full, and HOMO-LUMO surfaces of all four molecules 14 shown in Figure 6 and energies are listed in the Table 9. The FMO analysis showed that the HOMO is mainly concentrated on the triazine moiety, azomethine and aromatic ring attached to the azomethine moiety. The LUMO is mainly concentrated on the triazine and a phenyl ring attached to it. The HOMO-LUMO energy gap for 4 was the highest and equal to 0.133 eV and for 3 it was the lowest and equal to 0.119 a. u. (3.24 eV). The isodensities of HOMO and LUMO not only help explain the HOMO-LUMO gap but also deliver useful information regarding the stability of a compound. The isodensity in the HOMO gives a maximum spread in compound 4 (it also encompasses a benzene ring) which reflects the higher conjugation in 4. These observations indicate the HOMO in 4 should have the lowest energy among all four compounds studied, and indeed this is the case. The extended conjugation in 4 would render it more stability towards ionization (vide infra). On the other hand, HOMO is 3 has the minimum density on the hydrazone scaffold which renders it the compound with the highest energy (0.18 eV). The higher energy of HOMO in 3 is expected due to the presence of a dimethylamino group. The situation is slightly different for the LUMOs; the extent of conjugation in LUMO in all four compounds is similar (Figure 6). However, the intensities are slightly different. Relatively higher intensities are observed for compounds 1 and 4 which render them of lower energy compared to the LUMO in compounds 2 and 3. It is interesting to note that the compounds 1 and 4 have intramolecular hydrogen bonding. It can be argued that intramolecular hydrogen bonding provides low energy to the LUMO. The HOMO-LUMO gap is the sum of the effect on HOMO and LUMO. For example, in compound 4, both HOMO and LUMO are stabilized but the effect on the HOMO is larger than on the LUMO, and it ultimately results in an increased band gap. On the other hand, both HOMO and LUMO are destabilized in 3 but, the effect on the former is more pronounced than the latter, and it ultimately leads to a decrease in the band gap.
The experimental UV–Vis. absorption spectra of all compounds 14 were recorded within 200–600 nm range in dimethyl sulphoxide (DMSO), and the combined spectra are shown in Figure 7.
The theoretical absorption studies were also carried out by using TD-DFT method at B3LYP/6-31G (d, p) level of theory in gas phase, and polarizable continuum model (PCM) was applied to account for solvent effect (For simulated UV-Vis. spectra see Figure S9 and Figure S10). A comparison of characteristic experimental and simulated UV–vis. absorption wavelengths (λmax) of 14 is given in Table 10.
Figure 6. HOMO, LUMO surfaces of compounds 14 simulated at B3LYP/6-31G (d, p).
Molecules 20 05851 g006
Table 9. Frontier orbital energy (a. u).
CompoundE (HOMO)E (LUMO)ΔE (LUMO‒HOMO)
1−0.196−0.07130.124
2−0.196−0.0640.132
3−0.18−0.0600.119
4−0.204−0.0720.133
The experimental UV-vis. spectrum of compound 1 showed an absorption maximum at 374 nm, which is in excellent agreement with the computed values of 380 nm in the gas phase and 390.3 nm in DMSO. The experimental absorption maxima of 2 appeared at 337 nm, and shows excellent correlation with simulated values at 354.2 nm (gas phase) and 358.2 nm (DMSO). Similarly the theoretical and experimental absorption maxima’s of 3 and 4 showed very excellent correlations (for individual values see Table 10). The observed absorption maxima of compounds 14 can also be correlated with the HOMO-LUMO band gap. Compounds 2 and 4 have the highest band gaps (Table 9) and this is consistent with the UV results that these compounds have the highest energy of absorption (shorter absorption maximum). The band gap in compound 4 is 0.13 a. u. which corresponds to 350 nm (3.536 eV). This is identical to theoretical absorption maximum of compound 4 at 350.2 nm. Therefore, it can be concluded that the π‒π* transition in these compounds is a HOMO-LUMO transition. It is also interesting to note that compounds having intra-molecular hydrogen bonding (1 and 4) have the low molar absorptivity (Figure 7).
Figure 7. Combined experimental UV-vis. spectra of all compounds 14.
Molecules 20 05851 g007
Table 10. Experimental and simulated (B3LYP/6-31G (d, p)) UV-vis. λmax (nm) values of title compounds 14.
ExperimentalTheoretical (TD-SCF/B3LYP/6-31G (d, p))
Compoundλmax (abs.) (DMSO)λmax (osc. Strength), Gas Phaseλmax (osc. Strength) DMSOAssignment
(1)333 (0.419), 374 (0.454)380.8 (0.782)390.3 (0.945)π‒π*
(2)337 (1.903)345.2 (1.189)358.2 (1.401)π‒π*
(3)366 (2.834)370.4 (1.147)395.5 (1.196)π‒π*
(4)312 (0.567), 342 (0.697)350.2 (0.739)356.1 (1.007)π‒π*

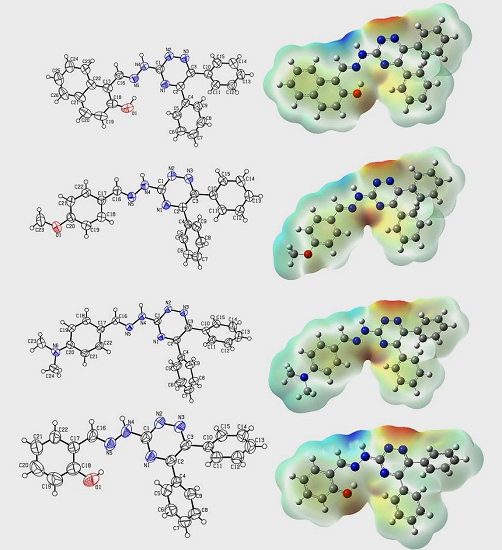
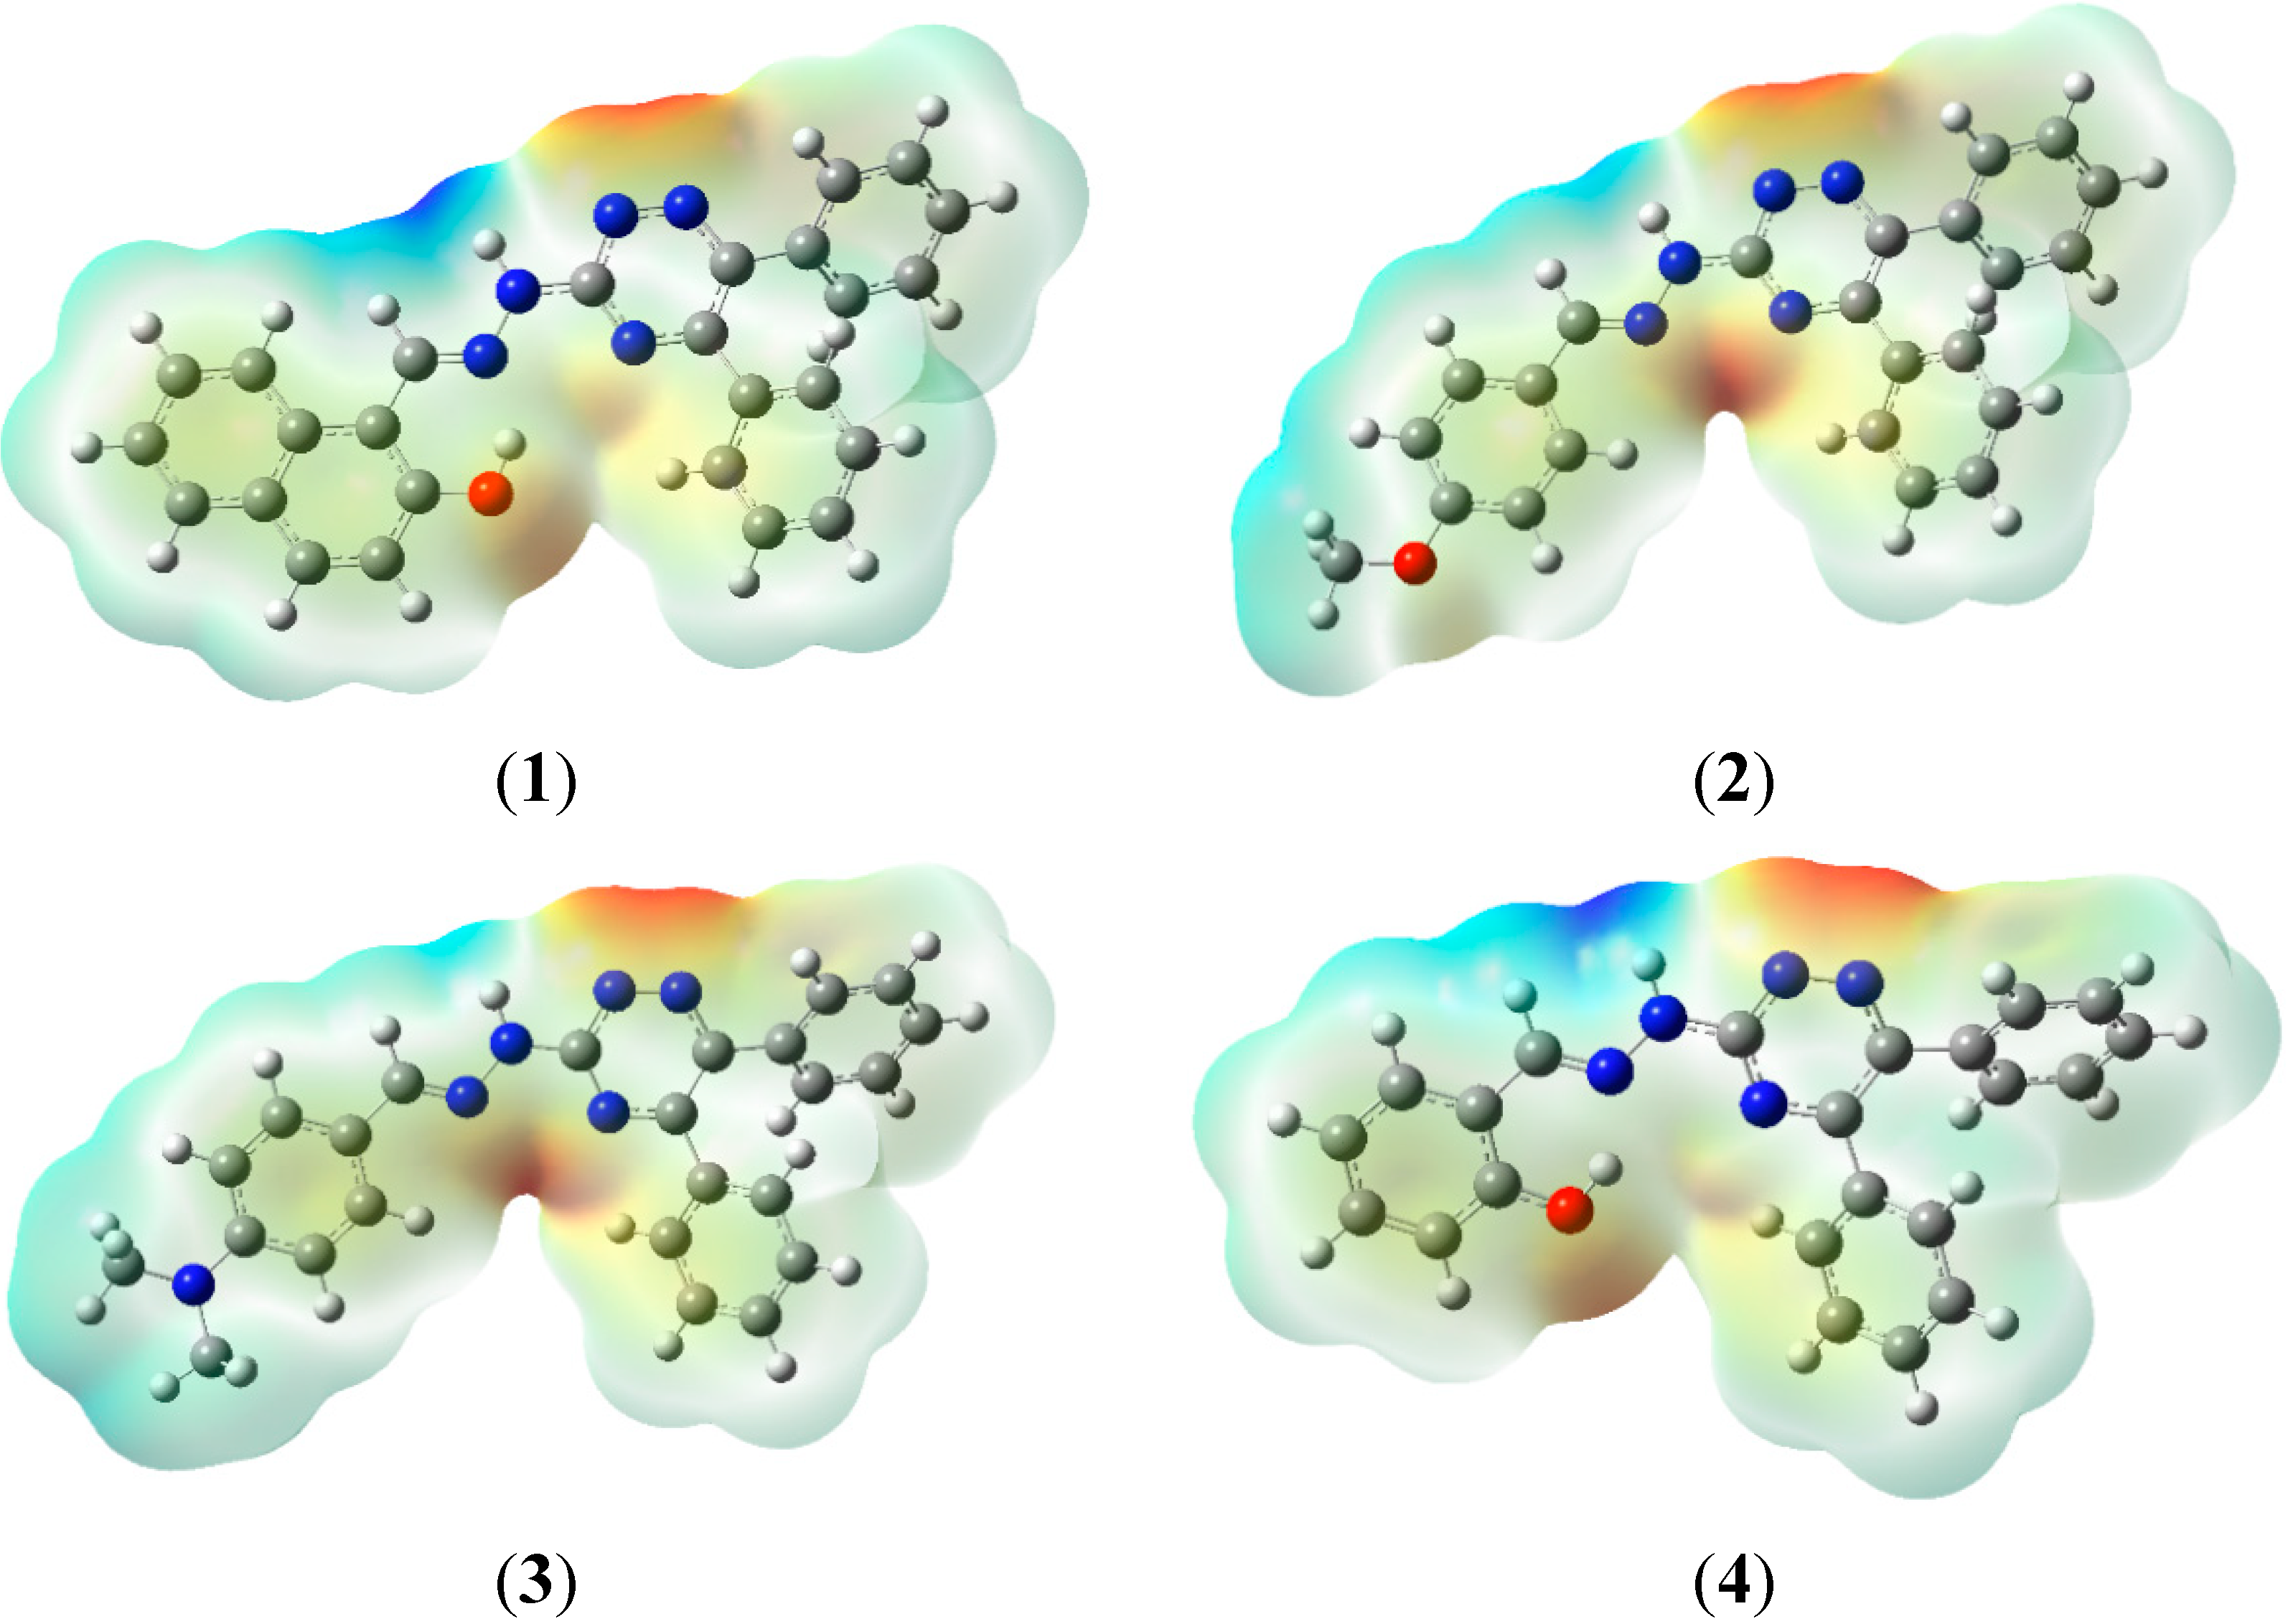
2.7. Molecular Electrostatic Potential (MEP)

One of the most interesting features of quantum chemistry is the ability to explain the reactivity of compounds under investigation. In terms of reactivity the electrostatic potential plays an important role. It determines the reactivity of a chemical system by predicting electrophilic as well as nucleophilic sites in target molecules [17]. This is one of the basic properties, which affect the behavior of a whole target molecule [18]. Mathematically, MEP can be defined by the following equation:
V ( r ) = ( Z A R A r ) ( ρ ( r ´ ) / r ´ r ) d r ´
Summation (∑) runs over all nuclei, ZA is charge of nucleus which is located at RA and ρ(r') is electron density. MEP is also proved very useful in structural biology to determine ligand-substrate interactions, change in energy upon interactions and determination of local reactivity of large target molecules under investigation, drug receptor and in enzyme-substrate interactions. The molecular electrostatic potential of compounds 14 was computed at the B3LYP/6-31G (d, p) level of DFT and the corresponding surfaces are shown in Figure 8.
Figure 8. MEP surfaces of compounds 14.
Molecules 20 05851 g008
During MEP mapping two basic regions appear i.e., red and blue, the preferred nucleophilic site is represented by red color and the preferred electrophilic site is represented by blue color. According to the MEP analysis of compound 1, a negative potential is −5.243 × 10⁻² concentrated on the oxygen of the -OH group attached to the naphthalene moiety and on nitrogens of the triazine ring (N27, N28), this is the preferred site for electrophilic attack as well as for metal atoms. Positive potential reflecting a nucleophilic site was 5.243 × 10⁻² and was concentrated on the proton attached to N32 and on the proton of the azomethine moiety (–C32=N33). For compound 2, the negative potential is −5.691 × 10⁻² concentrated on the triazine ring, whereas the corresponding positive potential value is 5.691 × 10⁻². An almost similar trend was observed during the MEP analysis of 3, having a negative potential value −6.094 × 10⁻² and positive value of 6.094 × 10⁻². Compound 4 showed a negative potential value of −5.240 × 10⁻² concentrated on the oxygen of the -OH and the nitrogens of the triazine ring (N27, N28). The value of its positive potential is 5.240 × 10⁻², concentrated on the protons attached to the azomethine moiety (–C32=N33) and showing the nucleophilic site.
Very similar to the other properties mentioned above, compounds 14 can be divided into two distinct groups based on MEP: (a) with intramolecular hydrogen bonding (b) without intramolecular hydrogen bonding. The intramolecular hydrogen bonding confers to the oxygen of the hydroxyl group a negative potential and also makes it a suitable site for electrophilic attack. The more pronounced effect in compound 1 and 4 is observed for proton attached to N4 (the proton becomes more acidic). These analyses clearly reveal that small changes in the structure can lead to dramatic changes in the reactivity

2.8. Hyperpolarizability and Non-Linear Optical Properties

Molecules having asymmetric polarization because of the presence of electron donor and electron acceptor groups in a π-conjugated system are strong candidates for NLO applications. Materials with high NLO properties are vital in optoelectronic and non-linear optics and have great effect in information technology and other industries [19]. With the advancements in laser technology, NLO materials are used as important materials for photonic communication and digital memory, in industry, national defense and medicine [20]. In order to establish the relation between molecular structure and NLO properties, first the hyperpolarizibility of compounds 14 was computed at the DFT- B3LYP/6-31G (d, p) level of theory along with additional key word POLAR and mathematically calculated by following Equation (2):
βtot = [(βxxx + βxyy + βxzz)2 + (βyyy + βyzz + βyxx)2 + (βzzz + βzxx + βzyy)2]1/2
The value of first hyperpolarazibility appears in a. u. and converted to e.s.u using Equation (2) a. u. = 8.6393 × 10⁻³³ e. s. u. The calculated first hyperpolarizibility parameters of compounds 14 are listed in Table 11.
Table 11. First hyperpolarizability parameters of 14.
Compound1234
βxxx2300.4333639.2178152.0911281.031
βxxy6.13941.559−559.94223.445
βxyy−520.79207.2331−62.360−303.73
βyyy−244.06−402.645−357.94−459.49
βxxz584.74317.3065−46.03740.0394
βxyz33.76364.60694.26142.973
βyyz1.283−3.485−15.9700.236
βxzz39.4281.523−8.30234.723
βyzz14.6814.14737.64917.0493
βzzz9.2019.715−8.1297.664
βtot. (esu)16.64729.79770.2338.957
Organic molecules having extended π-conjugation systems and electron donating groups possess higher NLO properties. As reflected from Table 11, the values of the first hyperpolarizibility show the same trend with as electron donating capacity and extended π-conjugation pattern, that is 3 > 2 > 1 > 4. Moreover, the first hyperpolarizability can also be correlated to the band gap. Compound 4 (with the highest band gap) has the lowest hyperpolarizability. On the other hand, the easy flow of electrons from one terminus of molecule to the other renders a lower hyperpolarizability value in compound 3. From the Table, it is clear that 3 has the highest value compared to others and can be a potential NLO candidate when compared to 1, 2 and 4.

2.9. Chemical Reactivity

Global chemical reactivity indices such as total energy, chemical hardness (η), electrophilicity (ω), electronic chemical potential, and dipole moment (µ) are used to describe the reactivity as well as stability of any chemical compounds [21]. The chemical hardness can be defined in term of following equation (3):
η = (EHOMO − ELUMO)/2
Using above equation chemical hardness of compound 14 were calculated and listed in Table 12 along with other parameters.
Table 12. Reactivity indices of compounds 14.
Properties1234
ETotal (eV)0.1240.1320.1190.133
EHOMO−0.196−0.196−0.18−0.204
ELUMO−0.0713−0.064−0.060−0.072
η (eV)0.0620.0660.0590.066
µ (eV)−0.133−0.13−0.120−0.138
ω (eV)0.1420.1280.1190.143
µ(Debye)1.013.125.370.57
Compounds having a high HOMO-LUMO energy gap are stable and chemically harder than compounds having a small HOMO-LUMO energy gap. From Table 12 it is clear that 4 is hard and more stable (less reactive), while 3 is soft and least stable of all (more reactive). The electrophilicity index (ω) is based on thermodynamic properties and measures the favorable change in energy when a chemical system attains saturation by addition of electrons. It can be defined as the decrease in energy due to flow of electrons from the HOMO to the LUMO in molecules. It also plays an important role in determining the chemical reactivity of system and mathematically defined by the following equation (4) [22]:
ω = µ2/2η
where, µ is the electronic chemical potential, η is chemical hardness. Results from Table 12 show that 4 is strong electrophilic while 3 is nucleophilic in nature. Electronic chemical potential (µ) describes the charge transfer within a system in the ground state. It is define as the negative of the electronegitivity [23] and defined mathematically by the following equation (5):
µ = (EHOMO + ELUMO)/2
Physically it is defined as the tendency of electrons to escape from the equilibrium state. Compounds having greater values of chemical potential are most reactive than ones with small electronic chemical potential. From the Table 12, it is clear that 3 is most reactive while 4 is least reactive of all.

3. Experimental

3.1. General Information

All chemicals and solvents were purchased from BDH (Poole, UK), and used without further purification. A Stuart Scientific SMP3, version 5.0 melting point apparatus (Bibby Scientific Limited, Staffordshire, UK) was used to record the melting points, and the reported m.p. are uncorrected. 1H-NMR spectra were recorded on an AVANCE-III 600 MHz instrument (Bruker, Fallanden, Switzerland) at 300 K, and chemical shifts are reported in ppm with reference to the residual solvent signal. FT-IR spectra were recorded neat conditions on a Thermo Scientific NICOLET iS 50 FT-IR spectrometer (Thermo Scientific, Madison, WI, USA). UV-vis. studies were performed by using Evolution 300UV/VIS spectrophotometer (Thermo Scientific).

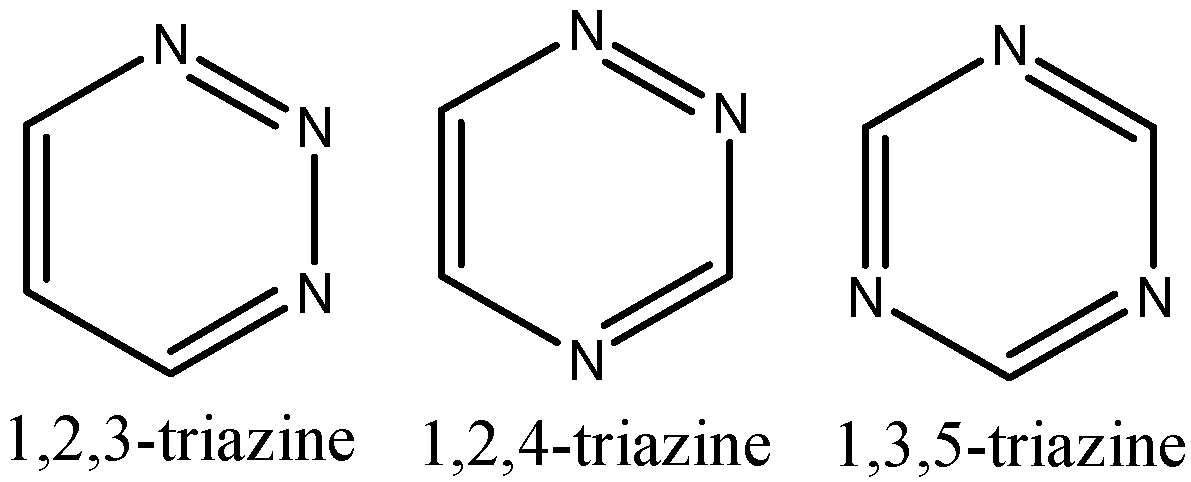
3.2. Synthesis of 5,6-Diphenyl-4H-[1,2,4]triazine-3-thione

Benzil (6 g, 28.5 mmol) was dissolved in glacial acetic acid (150 mL) and added to a solution of thiosemicarbazide (2.59 g, 28.5 mmol) in hot water (100 mL). The mixture was refluxed for 4 h, and the precipitate that appeared was filtered while the solution was hot. The orange crystals obtained were recrystallized from ethanol to give reddish crystals (yield: 5.27 g, 87.82%, m.p. 222–224 °C).

3.3. Synthesis of 3-Hydrazinyl-5,6-diphenyl-1,2,4-triazine

A mixture of 5,6-diphenyl-4H-[1,2,4]triazine-3-thione (5 g, 18.84 mmol) and hydrazine hydrate (10 mL) in isopropyl alcohol (20 mL) was refluxed for 4–6 h, until no more H2S was evolved. Acetic acid was added dropwise into mixture till neutralization to remove the excess of hydrazine. The mixture was cooled. The solid obtained was filtered off and crystalized from ethanol to give yellowish crystals (84% yield, m.p. 175–178 °C).

3.4. Synthesis of Compounds 14

In an oven dried flask containing ethanol (15 mL), 3-hydrazinyl-5,6-diphenyl-1,2,4-triazine (0.1 g, 0.379 mmol) and the respective aldehyde (0.379 mmol) were mixed together. The mixture was refluxed for 2 h with stirring and then cooled. Reaction progress was monitored by TLC. The precipitates obtained were then filtered off to yield the final products.
(Z)-((2-(5,6-Diphenyl-1,2,4-triazin-3-yl)hydrazono)methyl)naphthalene-2-ol (1): IR (neat, cm−1): ν = 756, 1062, 1179, 1239, 1280, 1367, 1517, 1611, 2810; 1H-NMR (DMSO, ppm): 12.77, (1H, s, OH,), 12.31 (1H, b, NH), 9.33 (1H, s, =CH-), 8.22 (1H, d, Ar-H, J = 8.4 Hz), 7.90 (2H, dd, Ar-H, J = 6.0 Hz, 4.2 Hz), 7.61 (1H, t, Ar-H, J = 8.4 Hz), 7.52 (2H, d, Ar-H, J = 7.2 Hz), 7.47 (1H, d, Ar-H, J = 7.8 Hz, 7.2 Hz), 7.38–7.44 (8H, m, Ar-H), 7.31 (1H, d, Ar-H, J = 9 Hz); 13C-NMR (DMSO, ppm): 157.28, 156.47, 142.87, 136.06, 135.81, 131.94, 131.29, 130.50, 129.45, 129.08, 128.95, 128.56, 128.33, 127.82, 127.62, 123.49, 120.58, 118.95, 108.97, UV-vis. λmax (DMSO) = 333 nm, 374 nm,; m.p. 310–312 °C.
(Z)-3-(2-(4-Methoxybenzylidene)hydrazinyl)methyl)-5,6-diphenyl-1,2,4-triazine (2): IR (neat, cm−1): 764, 1060, 1167, 1247, 1350, 1513, 1612; 1H-NMR (DMSO, ppm): 11.80, (1H, b, NH,), 8.22 (1H, s, =CH-), 7.66 (2H, d, Ar-H, J = 9 Hz), 7.46 (3H, dd, Ar-H, J = 7.8 Hz, 7.2 Hz), 7.36 (7H, m, Ar-H), 7.00 (2H, d, Ar-H, J = 9 Hz), 3.77 (3H, s, CH3); 13C-NMR (DMSO, ppm): 160.35, 158.56, 156.36, 150.59, 143.96, 136.17, 135.99, 130.20, 129.41, 128.92, 128.36, 128.26, 128.24, 128.17, 127.32, 114.31, 55.25; UV-vis. λmax (DMSO) = 337 nm; m.p. 267–268 °C.
(Z)-4-((2-(5,6-Diphenyl-1,2,4-triazin-3-yl)hydrazono)methyl)-N,N-dimethylaniline (3): IR (neat, cm−1): 516, 807, 1052, 1160, 1277, 1363, 1428, 1507, 1593; 1H-NMR (DMSO, ppm): 11.62, (1H, b, NH), 9.65 (1H, s, =CH-), 7.53 (2H, d, Ar-H, J = 9 Hz), 7.45 (3H, dd, Ar-H, J = 7.8, 7.2 Hz), 7.35–7.38 (7H, m, Ar-H), 6.75 (2H, d, Ar-H J = 9 Hz), 2.96 (6H, s, CH3); 13C-NMR (DMSO, ppm): 189.89, 156.28, 154.21, 151.13, 150.18, 145.07, 136.05, 130.16, 129.38, 128.96, 128.29, 128.25, 128.23, 127.95, 124.48, 122.13, 111.87, 111.05; UV-vis. λmax (DMSO) = 366 nm; m.p. 263–265 °C.
(Z)-2-((2-(5,6-Diphenyl-1,2,4-triazin-3-yl)hydrazono)methyl)-phenol (4): IR (neat, cm−1): 688, 750, 1062, 1078, 1133, 1279, 1375, 1515, 1621; 1H-NMR (DMSO, ppm): 12.26, (1H, b, NH,), 11.47, (1H, s, OH,), 8.45 (1H, s, =CH-), 7.48 (3H, d, Ar-H, J = 7.8 Hz), 7.45 (1H, dd, Ar-H, J = 7.8 Hz, 7.2 Hz), 7.41–7.42 (2H, m, Ar-H), 7.36–7.49 (5H, m, Ar-H), 7.26 (1H, t, Ar-H J = 8.4 Hz), 6.90–6.94 (2H, m, Ar-H); 13C-NMR (DMSO, ppm): 158.08, 157.13, 156.44, 151.14, 145.00, 136.05, 135.80, 130.64, 130.43, 129.46, 129.06, 128.52, 128.29, 119.30, 118.88, 116.39; UV-vis. λmax (DMSO) = 312 nm, 342 nm; m.p. 273–274 °C.

3.5. Crystallography

Compounds were crystalized in dimethyl sulfoxide (DMSO) while keeping their solution at room temperature i.e., 25 °C for about three months. Suitable crystals were selected under microscope and fixed on glass tip using glue supported by copper tube and magnetic base. These were mounted on an Agilent SuperNova (dual source) diffractometer (Agilent Technologies, Santa Clara, CA, USA) equipped with graphite-monochromatic Cu/Mo Kα radiation for data collection. The data collection was accomplished using CrysAlisPro software [24] at 296 K under the Mo Kα radiation. The structure solution was performed using SHELXS–97 and refined by full–matrix least–squares methods on F2 using SHELXL–97 [25], in-built with X-Seed [26]. All non–hydrogen atoms were refined anisotropically by full–matrix least squares methods [25]. The C-H hydrogen atoms were positioned geometrically and treated as riding atoms where C–H = 0.93 Å with Uiso(H) = 1.2 Ueq(C) for aromatic carbon atoms and C–H = 0.96 Å with Uiso(H) = 1.5 Ueq(C) for methyl carbon atoms. H atoms bonded to N in all four compounds were located in a difference maps and refined isotropically 0.89 (1) for N-H using DFIX commands. The O-H hydrogen atoms in 1 & 4 were refined geometrically with O-H = 0.82 and Uiso(H) = 1.5 Ueq(O) for oxygen atom. The figures were drawn using ORTEP-3 [27] and PLATON [28] programs inbuilt with WINGX [27]. The cifs for these compounds have been submitted to CCDC to obtain CCDC numbers (1028227, 1028228, 1028229 and 1034522 for compounds 14 respectively). These data files can be obtained free of charges on application to CCDC 12 Union Road, Cambridge CB21 EZ, UK. (Fax: (+44) 1223 336-033; e-mail: [email protected]. ac.uk).

3.6. Computational Details

Theoretical studies were performed using the Gaussian 09 software at the density functional theory (DFT) level as instituted in the program [29]. The visualization of the results/optimized geometries was achieved by using Gauss View 05 [30]. The energy minima optimization of all compounds was carried out at B3LYP/6-31G (d, p) levels of theory. The B3LYP method provides a nice balance between cost and accuracy, and it is known to perform very well for the prediction of geometries of a number of synthetic [31,32] and natural products [33,34]. Frequency simulations were performed at the same level, to confirm the optimized geometries as a true minimum (no imaginary frequency was observed). In addition, frequency simulations at B3LYP/6-311G (d, p) level were used for vibrational analysis. Nuclear magnetic resonance studies were performed at B3LYP/6-311+G (2d, p) level, by adopting GIAO method. Chemical shift values were referred by using the internal reference standard i.e., tetramethylsilane. UV-vis. absorption studies were simulated by using TD-DFT method and at B3LYP/6-31G (d, p) level of theory. MEP, FMO and first hyperpolarizability analyses were simulated at B3LYP/6-31G (d, p) level of DFT.

4. Conclusions

In this study, four triazine-based hydrazone derivatives have been synthesized in good yields, and characterized using FT-IR, UV-Vis., 1H- and 13C-NMR spectroscopic techniques. The structures of these hydrazones were also confirmed unequivocally by single crystal X-ray diffraction studies. The DFT studies showed a strong agreement between the simulated and experimental results. Intra-molecular hydrogen bonding in compounds 1 and 4 results in a decrease in certain bond lengths in the triazine core. The structural variation in the hydroazamethyl part has a significant effect on the electronic properties of compounds 14. The molar absorptivity of transitions in the UV-Vis spectra (compounds 1 and 4) is considerably decreased by the intramolecular hydrogen bonding. The absorption at the longest wavelength in the UV-Vis spectrum is a π–π* transition from the HOMO to the LUMO, and correlates with the calculated HOMO-LUMO band gap. Frontier molecular orbital analysis showed that compounds 1 and 3 have very low HOMO-LUMO energy gaps, and therefore are kinetically less stable. The molecular electrostatic potential investigations revealed that the electronegative region in all compounds was spread over the triazine moiety. Chemical reactivity indices predict the highest and lowest activity for 3 and 4, respectively. The lowest band gap is calculated for compound 3, which gives it interesting electronic properties. The first hyperpolarizability analysis of all compounds was performed and compound 3 again showed the highest value compared to 1, 2 and 4. This indicates that 3 may have a very good nonlinear optical response. Triazine-based hydrazone derivatives have very wide applications not only in the clinical field but also in other areas of chemistry and hopefully the results of this study will increase the interest of researchers working in this field.

Supplementary Materials

Cartesian co-ordinates of optimized geometries and cif files of all compounds 14 are given in supporting information. Experimental 1H-, 13C-NMR are also provided in the Supporting Information along with simulated UV-vis. spectra. Supplementary materials can be accessed at: https://www.mdpi.com/1420-3049/20/04/5851/s1.

Acknowledgments

This work was funded by the Deanship of Scientific Research (DSR), King Abdulaziz University, Jeddah, under grant no. (130-345-D1435). The authors, therefore, acknowledge with thanks DSR technical and financial support.

Author Contributions

M.N.A. and A.M.A. planed the study, synthesize the molecules, performed crystallography, spectral analysis and compiled the results. T.M. and A.B. performed the theoretical calculations and arranged the results with the help of K.A. All the authors have same contribution in making the final shape of present manuscript.

Conflicts of Interest

The authors declare no conflict of interest.

References

  1. Smolin, E.M.; Rapoport, L. s-Triazine and Derivatives. In The Chemistry of Heterocyclic Compounds; Weissberger, A., Ed.; Wiley Intercience Publisher Inc.: New York, NY, USA, 1959; Volume 13, pp. 597–626. [Google Scholar]
  2. Patel, R.V.; Kumari, P.; Rajani, D.P.; Pannecouque, C.; de Clercq, E.; Chikhalia, K.H. Antimicrobial, anti-TB, anticancer and anti-HIV evaluation of new s-triazine-based heterocycles. Future Med. Chem. 2012, 4, 1053–1065. [Google Scholar] [CrossRef] [PubMed]
  3. Khoshneviszadeh, M.; Mohammad, H.; Foroumadi, G.A.; Miri, R.; Firuzi, O.; Madadkar-Sobhani, A.; Edraki, N.; Parsa, M.; Shafiee, A. Design, synthesis and biological evaluation of novel anti-cytokine 1,2,4-triazine derivatives. Bioorg. Med. Chem. 2013, 21, 6708–6717. [Google Scholar] [CrossRef] [PubMed]
  4. El-Brollosy, N.R. Synthesis and antimicrobial evaluation of 6-azauracil non-nucleosides. Monatsh. Chem. 2008, 139, 1483–1490. [Google Scholar] [CrossRef]
  5. Mary, Y.S.; Abdul-Malek, S.; Al-Tamimi El-Brollosy, N.R.; El-Emam, A.A.; Jojo, P.J.; Panicker, C.Y.; Alsenoy, C.V. Molecular structure and vibrational spectra of 2-Ethoxymethyl-6-ethyl-2,3,4,5-tetrahydro-1,2,4-triazine-3,5-dione, a potential chemotherapeutic agent, by density functional methods. Spectrochim. Acta Part A 2014, 133, 439–448. [Google Scholar] [CrossRef]
  6. Liu, J.; Wang, K.; Zhang, X.; Li, C.; You, X. Triazine dyes as photosensitizers for dye-sensitized solar cells. Tetrahedron 2013, 69, 190–200. [Google Scholar] [CrossRef]
  7. Rafat, M.; Fleita, D.H.; Sakka, O.K. Novel Synthesis of Hydrazide-Hydrazone Derivatives and Their Utilization in the Synthesis of Coumarin, Pyridine, Thiazole and Thiophene Derivatives with Antitumor Activity. Molecules 2011, 16, 16–27. [Google Scholar]
  8. Vicini, P.; Zani, F.; Cozzini, P.; Doytchinova, I. Hydrazones of 1,2-benzisothiazole hydrazides: Synthesis, antimicrobial activity and QSAR investigations. Eur. J. Med. Chem. 2002, 37, 553–564. [Google Scholar] [CrossRef] [PubMed]
  9. Rahman, V.M.; Mukhtar, S.; Ansari, W.H.; Lemiere, G. Synthesis, stereochemistry and biological activity of some novel long alkyl chain substituted thiazolidin-4-ones and thiazan-4-one from 10-undecenoic acid hydrazide. Eur. J. Med. Chem. 2005, 40, 173–184. [Google Scholar] [CrossRef] [PubMed]
  10. Jani, G.R.; Vyas, K.B.; Franco, Z. Preparation and Antimicrobial Activity of s-Triazine Hydrazones of 7-Hydroxy Coumarin and their Metal Complexes. Eur. J. Chem. 2009, 6, 1228–1232. [Google Scholar]
  11. Taib, L.A.; Faidallah, H.M.; Şahin, Z.S.; Asiri, A.M.; Şahin, O.; Arshad, M.N. Synthesis, spectral analysis, X-ray crystal structures and evaluation of chemical reactivity of five new benzoindazole derivatives through experimental and theoretical studies. J. Mol. Struct. 2014, 1076, 272–279. [Google Scholar] [CrossRef]
  12. Javed, I.; Khurshid, A.; Arshad, M.N.; Wang, Y. Photophysical and electrochemical properties and temperature dependent geometrical isomerism in alkyl quinacridonediimines. New J. Chem. 2014, 38, 752–761. [Google Scholar] [CrossRef]
  13. Arshad, M.N.; Şahin, O.; Zia-ur-Rehman, M.; Khan, I.U.; Asiri, A.M.; Rafique, H.M. 4-hydroxy-2H-1, 2-benzothiazine-3-carbohydrazide 1, 1-dioxide-oxalohydrazide (1:1): X-ray structure and DFT calculations. J. Struct. Chem. 2013, 54, 437–442. [Google Scholar] [CrossRef]
  14. Sundaraganesan, N.; Ilakiamani, S.; Saleem, H.; Wojciechowski, P.M.; Michalska, D. FT-Raman and FT-IR spectra, vibrational assignments and density functional studies of 5-bromo-2-nitropyridine. Spectrochim. Acta A Mol. Biomol. Spectrosc. 2005, 61, 2995–3001. [Google Scholar] [CrossRef] [PubMed]
  15. Arshad, M.N.; Mahmood, T.; Khan, A.F.; Zia-Ur-Rehman, M.; Asiri, A.M.; Khan, I.U.; Un-Nisa, R.; Ayub, K.; Mukhtar, A.; Saeed, M.T. Synthesis, crystal structure and spectroscopic properties of 1,2-benzothiazine derivatives: An experimental and DFT study. Chin. J. Struct. Chem. 2015, 34, 15–25. [Google Scholar]
  16. Ebenezar, J.D.; Ramalingam, S.; Raja, C.R.; Helan, V. Precise spectroscopic [IR, Raman and NMR] investigation and gaussian hybrid computational analysis (UV-visible, NIR, MEP Maps and Kubo Gap) on l-valine. J. Theor. Comput. Sci. 2013, 1, 1–13. [Google Scholar] [CrossRef]
  17. Szabo, L.; Chiş, V.; Pirnau, A.; Leopold, N.; Cozar, O.; Orosz, S. Spectroscopic and theoretical study of amlodipine besylate. J. Mol. Struct. 2009, 924, 385–392. [Google Scholar] [CrossRef]
  18. Bartošková, M.; Friedl, Z. The Relationship between the heats of formation and the molecular electrostatic potentials of polyazaarenes. Cent. Eur. J. Energy Mater. 2013, 10, 103–112. [Google Scholar]
  19. Sagadevan, S. Investigation on the optical properties of nonlinear optical (NLO) single crystal: l-Valine zinc hydrochloride. Am. J. Opt. Photonics 2014, 2, 24–27. [Google Scholar] [CrossRef]
  20. Zhang, J.; Liang, X.; Jiang, Y.; Wang, G.; Qu, C.; Zhao, B. Computational study on the second-order nonlinear optical properties of coumarin derivatives with N-p-vinylphenyl carbazole chromophores. Asian J. Chem. 2014, 26, 7404–7408. [Google Scholar]
  21. Mebi, C.A. DFT study on structure, electronic properties, and reactivity of cis-isomers of [(NC5H4-S)2Fe(CO)2]. J. Chem. Sci. 2011, 123, 727–773. [Google Scholar] [CrossRef]
  22. Sukumar, N. A Matter of Density; Wiley: Hoboken, NJ, USA, 2012; pp. 157–201. [Google Scholar]
  23. Špirtović-Halilović, S.; Salihovic, M.; Džudžević-Čančar, H.; Trifunovic, S.; Roca, S.; Softic, D.; Završnik, D. DFT study and microbiology of some coumarin-based compounds containing a chalcone moiety. J. Serb. Chem. Soc. 2014, 79, 435–443. [Google Scholar] [CrossRef]
  24. CrysAlis PRO; Agilent Technologies: Yarnton, UK, 2012.
  25. Sheldrick, G.M. A short History of SHELX. Acta Crystallogr. 2007, A64, 112–122. [Google Scholar] [CrossRef]
  26. Barbour, L.J. A software tool for Supramolecular Crystallography. J. Supramol. Chem. 2001, 1, 189–191. [Google Scholar] [CrossRef]
  27. Farrugia, L.J. WinGX and ORTEP for windows: An update. J. Appl. Crystallogr. 2012, 45, 849–854. [Google Scholar] [CrossRef]
  28. Spek, A.L. Structure validation in chemical crystallography. Acta Crystallogr. 2009, D65, 148–155. [Google Scholar]
  29. Frisch, M.J.; Trucks, G.W.; Schlegel, H.B.; Scuseria, G.E.; Robb, M.A.; Cheeseman, J.R.; Scalmani, G.; Barone, V.; Mennucci, B.; Petersson, G.A.; et al. Gaussian 09; Revision C.01; Gaussian, Inc.: Wallingford, CT, USA, 2010. [Google Scholar]
  30. Roy, D.; Todd, K.; John, M. Gauss View; Version 5; Semichem, Inc.: Shawnee Mission, KS, USA, 2009. [Google Scholar]
  31. Hung, T.Q.; Hoang, D.H.; Thang, N.N.; Dang, T.T.; Ayub, K.; Villinger, A.; Friedrich, A.; Lochbrunner, S.; Flechsig, G.-U.; Langer, P. Palladium catalyzed synthesis and physical properties of indolo[2,3-b]quinoxalines. Org. Biomol. Chem. 2014, 12, 6151–6166. [Google Scholar] [CrossRef] [PubMed]
  32. Babar, A.; Khalid, H.; Ayub, K.; Saleem, S.; Waseem, A.; Mahmood, T.; Munawar, M.A.; Abbas, G.; Khan, A.F. Synthesis, characterization and density functional theory study of some new 2-anilinothiazoles. J. Mol. Struct. 2014, 1072, 221–227. [Google Scholar] [CrossRef]
  33. Ullah, H.; Rauf, A.; Ullah, Z.; Fazl-i-Sattar; Anwar, M.; Shah, A.-H.A.; Uddin, G.; Ayub, K. Density functional theory and phytochemical study of Pistagremic acid. Spectrochim. Acta A Mol. Biomol. Spectrosc. 2014, 118, 210–214. [Google Scholar] [CrossRef] [PubMed]
  34. Fazl-i-Sattar; Ullah, Z.; Ata-ur-Rahman; Rauf, A.; Tariq, M.; Tahir, A.A.; Ayub, K.; Ullah, H. Phytochemical, spectroscopic and density functional theory study of Diospyrin, and non-bonding interactions of Diospyrin with atmospheric gases. Spectrochim. Acta Part A Mol. Biomol. Spectrosc. 2015, 141, 71–79. [Google Scholar] [CrossRef]
  • Sample Availability: Samples of the compounds 14 are available from the authors.

