
Urine and Serum Metabolite Profiling of Rats Fed a High-Fat Diet and the Anti-Obesity Effects of Caffeine Consumption


 ,
,  and
and 
Abstract
:
1. Introduction
2. Results and Discussion
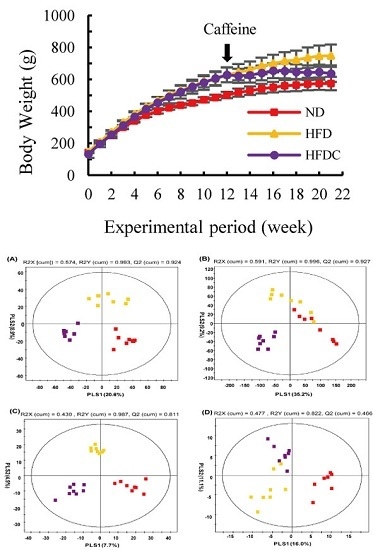
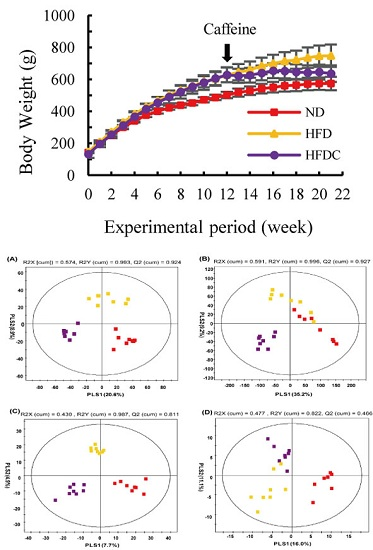
2.1. Clinical Data

| Outcome Variables | ND (1) | HFD (2) | HFDC (3) | ||||||
|---|---|---|---|---|---|---|---|---|---|
| Body weight (g) (4) | |||||||||
| After 12 weeks | 502.63 | ± | 20.43 a | 628.55 | ± | 46.22 b | 628.79 | ± | 46.36 b |
| After 21 weeks | 573.95 | ± | 42.68 a | 747.74 | ± | 69.70 c | 636.30 | ± | 51.58 b |
| Serum (mg/dL) | |||||||||
| Total cholesterol | 92.21 | ± | 20.25 b | 131.77 | ± | 40.31 a | 89.39 | ± | 23.21 b |
| HDL-cholesterol | 58.12 | ± | 23,44 b | 33.25 | ± | 12.59 a | 40.58 | ± | 11.17 ab |
| LDL-cholesterol | 30.66 | ± | 15.70 b | 63.03 | ± | 22.96 a | 35.12 | ± | 15.86 ab |
| Triglyceride | 83.42 | ± | 20.64 b | 115.99 | ± | 22.01 a | 83.99 | ± | 24.61 b |
| Free fatty acid | 36.90 | ± | 5.00 a | 26.19 | ± | 4.96 b | 35.06 | ± | 6.95 a |
| Liver (μg/mg) | |||||||||
| Total cholesterol | 2.90 | ± | 0.65 b | 4.92 | ± | 1.08 a | 2.78 | ± | 1.27 b |
| Triglyceride | 13.61 | ± | 5.71 b | 78.28 | ± | 20.92 a | 17.71 | ± | 13.93 b |
| Total lipid | 23.2 | ± | 5.48 c | 103.29 | ± | 9.52 a | 61.68 | ± | 6.16 b |
| Adipose tissue | |||||||||
| Adipocytes area (μm2) | 632.36 | ± | 157.07 ab | 747.12 | ± | 154.71 a | 534.04 | ± | 117.72 b |
| Cell number per spot | 147.57 | ± | 30.61 a | 106.38 | ± | 21.27 b | 151.22 | ± | 31.61 a |
| Adipose tissue enzyme activities | |||||||||
| GPDH (nmol/min/mg) | 22.61 | ± | 5.29 a | 43.40 | ± | 22.67 b | 24.76 | ± | 14.16 ab |
| LPL (nmol/min/mg) | 21.75 | ± | 13.23 a | 71.00 | ± | 19.75 c | 27.82 | ± | 15.74 a |
2.2. Analysis of Urine Metabolite Profiling
 : normal diet;
  : high-fat diet,
  : high fat diet with caffeine).
: normal diet; : high-fat diet, : high fat diet with caffeine).
: high fat diet with caffeine).
: normal diet; : high-fat diet, : high fat diet with caffeine).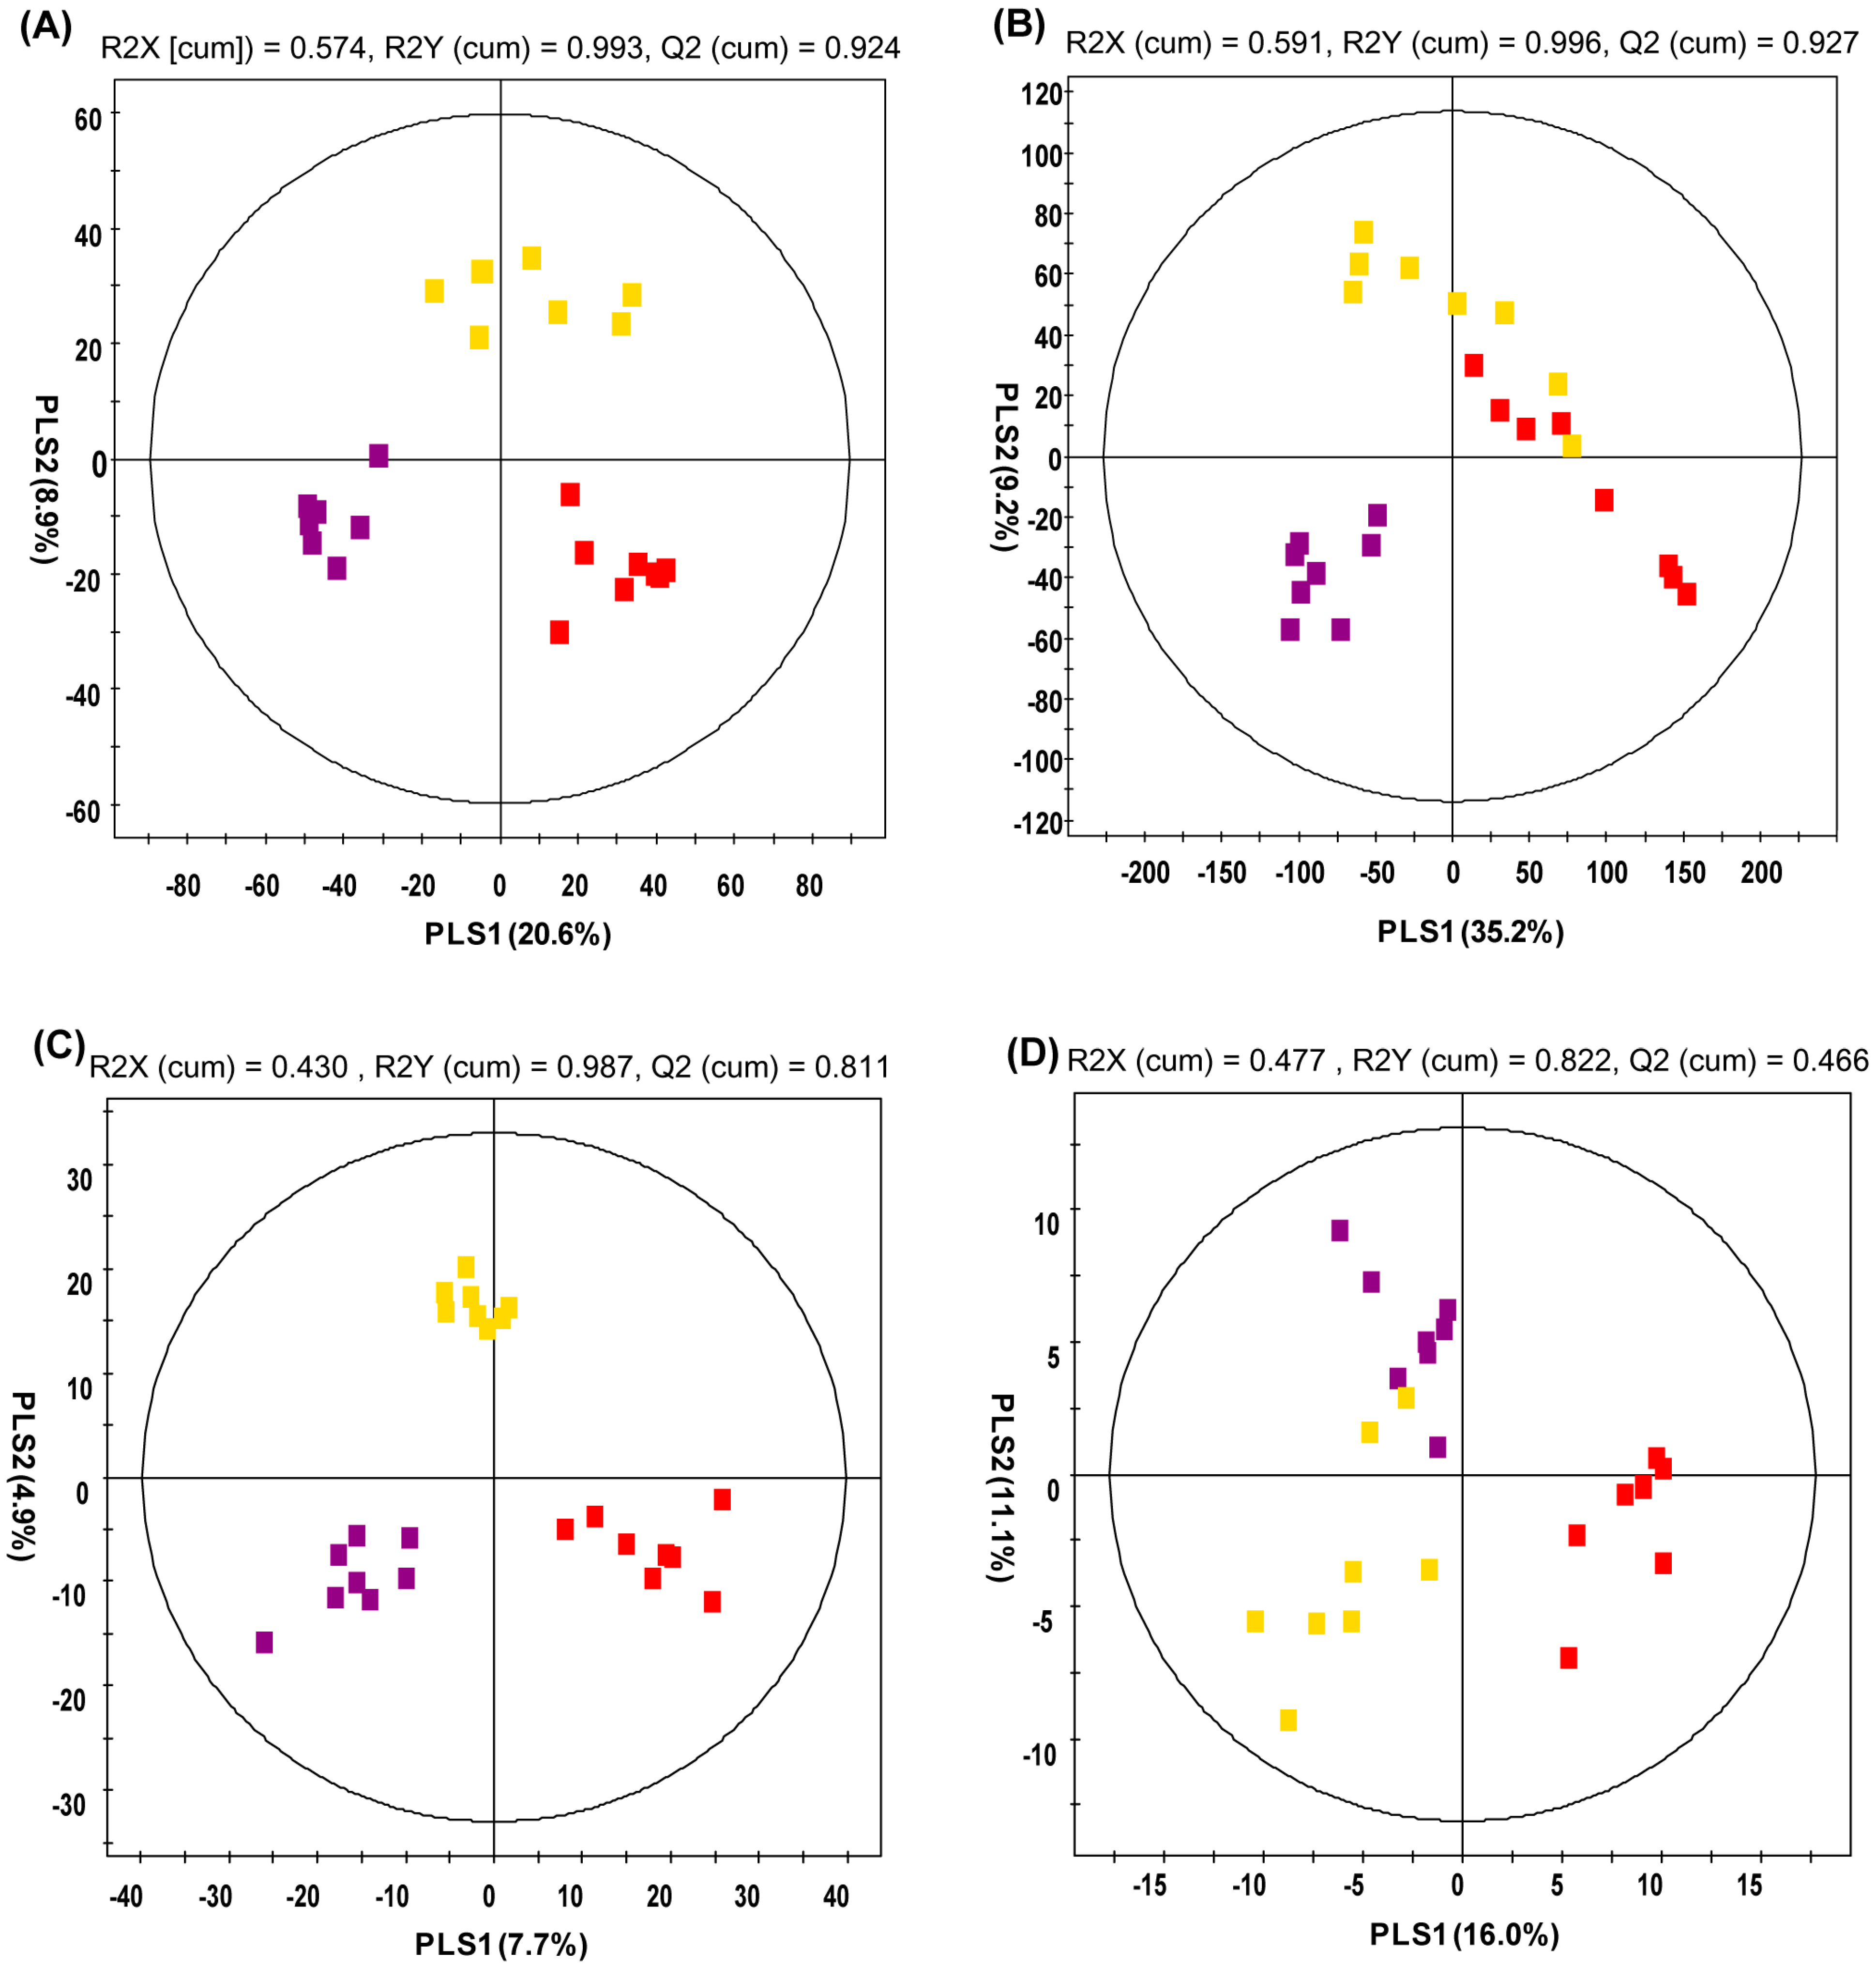
2.3. Analysis of Serum Metabolite Profiling
| RT (min) | Measured MS (m/z) | Tentative Metabolites | Molecular Formula | Error (mDa) | Adduct | Fold Change (1) | |||||||
|---|---|---|---|---|---|---|---|---|---|---|---|---|---|
| Positive | Negative | HFD/ND | HFDC/HFD | HFDC/ND | |||||||||
| 3.01 | 180.0844 | - | Hydroxyadipic acid | C6H10O5 | −2.8 | [M+NH4]+ | 1.682 * | 0.875 | 1.472 | ||||
| 3.47 | 395.0942 | 393.0828 | Dihydroferulic acid 4-O-glucuronide | C16H20O10 | −3.0 | [M+H]+ | 0.018 * | 9.641 | 0.176 * | ||||
| 3.69 | 338.0864 | 336.0749 | 3-Indole carboxylic acid glucuronide | C15H15NO8 | −5.3 | [M+H]+ | 0.071 * | 3.864 | 0.273 | ||||
| 3.93 | 340.0992 | 338.0895 | 5-hydroxy-6-methoxyindole glucuronide | C15H17NO8 | −4.0 | [M+H]+ | 0.024 * | 0.066 | 0.002 * | ||||
| 4.38 | 164.0714 | 162.0549 | 3-Methyldioxyindole | C9H9NO2 | 0.2 | [M+H]+ | 0.003 * | 6.066 | 0.016 | ||||
| Caffeine metabolites (2) | |||||||||||||
| 1.50 | 171.0899 | - | 5-Acetylamino-6-amino-3-methyluracil (AAMU) | C7H10N4O3 | 1.7 | [M+H−CO]+ | |||||||
| 2.57 | 167.0570 | - | 7-Methylxanthine | C6H6N4O2 | 0.1 | [M+H]+ | |||||||
| 2.61 | 183.0529 | - | 1-Methyluric acid | C6H6N4O3 | 1.1 | [M+H]+ | |||||||
| 2.71 | 167.0569 | - | 3-Methylxanthine | C6H6N4O2 | 0.0 | [M+H]+ | |||||||
| 2.77 | 197.0675 | - | 3,7-Dimethyluric acid | C7H8N4O3 | 0.0 | [M+H]+ | |||||||
| 2.79 | 167.0567 | - | 1-Mehtylxanthine | C6H6N4O2 | −0.2 | [M+H]+ | |||||||
| 2.97 | 197.0679 | - | 1,3-Dimethyluric acid | C7H8N4O3 | 0.4 | [M+H]+ | |||||||
| 3.03 | 181.0731 | - | Theobromine | C7H8N4O2 | 0.5 | [M+H]+ | |||||||
| 3.20 | 197.0659 | - | 1,7-Dimethyluric acid | C7H8N4O3 | −1.6 | [M+H]+ | |||||||
| 3.30 | 181.0733 | - | Paraxanthine | C7H8N4O2 | 0.7 | [M+H]+ | |||||||
| 3.40 | 211.0835 | - | 1,3,7-Trimethyluric acid | C8H10N4O3 | 0.4 | [M+H]+ | |||||||
| 3.69 | 195.0888 | - | Caffeine | C8H10N4O2 | 0.6 | [M+H]+ | |||||||
| Not-identified | |||||||||||||
| 0.87 | 109.0762 | - | N.I. | - | - | - | 2.111 | 0.291 * | 0.614 | ||||
| 1.41 | 126.0916 | - | N.I. | - | - | - | 1.825 * | 1.955 * | 3.568 * | ||||
| 1.88 | 127.0480 | - | N.I. (2) | - | - | - | |||||||
| 2.90 | 185.1050 | - | N.I. (2) | - | - | - | |||||||
| 3.09 | 185.1057 | - | N.I. (2) | - | - | - | |||||||
| 3.68 | 447.2227 | - | N.I. | - | - | - | 5.643 * | 0.738 | 4.163 * | ||||
| 3.69 | 393.1527 | - | N.I. | - | - | - | 1.972 * | 1.127 | 2.222 * | ||||
| 4.80 | 170.0599 | - | N.I. | - | - | - | 0.245 * | 1.27 | 0.312 * | ||||
| 5.82 | 231.1425 | - | N.I. | - | - | - | 3.263 * | 0.771 | 2.514 * | ||||
| 6.15 | 354.1368 | - | N.I. | - | - | - | 0.439 * | 1.097 | 0.481 * | ||||
| 9.47 | 415.3032 | - | N.I. | - | - | - | 1.286 | 0.689 * | 0.887 | ||||
| RT (min) | MS Fragment | Tentative Metabolites | Derivatized | Fold Change (1) | Ref. (2) | ||
|---|---|---|---|---|---|---|---|
| HFD/ND | HFDC/HFD | HFDC/ND | |||||
| 5.21 | 45, 73, 116, 147 | L-Alanine | (TMS)2 | 1.932 * | 1.321 | 2.552 * | STD |
| 7.56 | 45, 59, 73, 75, 100, 102, 117, 133, 147, 189, 292 | Propanoic acid | (TMS)3 | 1.675 | 2.110 * | 3.536 * | Lib |
| 7.83 | 45, 73, 100, 147, 204, 218 | L-Serine | (TMS)3 | 2.175 * | 1.259 | 2.737 * | STD |
| 8.08 | 45, 57, 73, 101, 117, 147, 219, 291 | L-Threonine | (TMS)3 | 2.622 * | 1.226 | 3.215 * | STD |
| 8.14 | 45, 59, 73, 147, 255 | Ethanesulfonic acid | (TMS)3 | 15.649 * | 0.817 | 12.780 * | Lib |
| 8.51 | 45, 53, 73, 75, 82, 109, 147 | 3-Methyl glutaconic acid | (TMS)2 | 2.323 * | 1.050 | 2.440 * | Lib |
| 9.14 | 45, 73, 103, 117, 147, 217 | L-Threitol | (TMS)4 | 2.143 * | 1.267 | 2.715 * | Lib |
| 9.44 | 45, 73, 117, 147, 220, 292 | L-Threonic acid | (TMS)4 | 2.121 * | 1.222 | 2.592 * | Lib |
| 9.54 | 45, 73, 115, 143, 171, 329 | Creatinine enol | (TMS)3 | 2.762 * | 1.111 | 3.070 * | Lib |
| 10.40 | 45, 73, 103, 147, 217, 307 | Xylose | (TMS)5 | 2.149 * | 1.460 | 3.139 * | STD |
| 10.44 | 45, 59, 73, 100, 147, 326 | Taurine | (TMS)3 | 1.952 * | 0.787 | 1.536 * | STD |
| 10.51 | 45, 73, 103, 147, 217 | Ribose | (TMS)5 | 2.914 * | 0.722 | 2.105 * | STD |
| 10.82 | 45, 73, 103, 129, 147, 217 | Xylitol | (TMS)5 | 2.117 * | 1.312 | 2.777 * | STD |
| 10.86 | 45, 73, 103, 129, 147, 217 | Adonitol | (TMS)5 | 2.674 * | 1.038 | 2.776 * | STD |
| 10.93 | 45, 73, 147, 211, 229 | Aconitic acid | (TMS)3 | 2.147 * | 1.424 | 3.058 * | Lib |
| 11.27 | 45, 73, 147, 217, 292 | Ribonic acid | (TMS)5 | 2.659 * | 1.683 * | 4.475 * | Lib |
| 11.68 | 45, 51, 73, 75, 105, 206 | Hippuric acid | TMS | 0.656 | 3.835 * | 2.516 * | Lib |
| 12.10 | 45, 73, 103, 147, 160, 205, 319 | Mannose | (TMS)5 | 2.744 * | 1.652 * | 4.534 * | STD |
| 12.32 | 45, 73, 103, 117, 147, 205, 217, 319 | Mannitol | (TMS)6 | 2.675 * | 1.859 | 4.971 * | STD |
| 13.63 | 45, 73, 89, 100, 103, 117, 129, 147, 205, 217, 319 | D-Allose | (TMS)5 | 2.625 * | 1.407 | 3.695 * | Lib |
| 14.73 | 73, 103, 147, 217, 269, 357 | Pseudo uridine | (TMS)5 | 2.237 * | 1.358 | 3.038 * | Lib |
| Caffeine Metabolites (3) | |||||||
| 11.82 | 45, 73, 103, 147, 191, 204, 217 | Caffeine | - | Lib | |||
| 12.22 | 45, 73, 84, 100, 135, 147, 237, 252 319 | Theophylline | TMS | Lib | |||
| Not Identified | |||||||
| 5.74 | 45, 59, 73, 89, 100, 104, 119, 147 | N.I. | - | 1.746 | 0.442 * | 0.772 | |
| 8.81 | 45, 59, 73, 86, 103, 117, 133, 147, 174, 218 | N.I. | - | 2.046 | 2.837 * | 5.804 * | |
| 8.83 | 45, 73, 115, 147 | N.I. | - | 3.495 * | 1.133 | 3.958 * | |
| 9.30 | 45, 73, 75, 113, 117, 147 | N.I. | - | 3.087 * | 1.239 | 3.826 * | |
| 9.74 | 55, 73, 98, 115, 147, 171, 260 | N.I. | - | 1.313 | 3.657 * | 4.801 * | |
| 10.70 | 45, 73, 75, 100, 129, 147, 157, 175 | N.I. | - | 2.208 * | 1.290 | 2.849 * | |
| 10.89 | 45, 73, 117, 147, 174 | N.I. | - | 2.322 * | 1.240 | 2.880 * | |
| 11.75 | 55, 73, 117, 129, 147, 217, 292 | N.I. | - | 1.925 | 2.092 * | 4.027 * | |
| 12.57 | 73, 103, 147, 205, 292 | N.I. | - | 4.382 * | 1.964 * | 8.606 * | |
| 12.80 | 73, 100, 117, 103, 129, 147, 217, 292, 333 | N.I. (3) | - | ||||
| 12.88 | 45, 73, 75, 83, 100, 117, 147, 241, 344 | N.I. | - | 1.108 | 1.442 * | 1.597 * | |
| 13.17 | 45, 73, 83, 100, 142, 267, 282 | N.I. (3) | - | ||||
| 13.47 | 45, 73, 100, 147, 259, 266, 325, 340 | N.I. (3) | - | ||||
| 13.49 | 45, 73, 100, 129, 147, 189, 201, 259, 319 | N.I. | - | 5.822 * | 1.128 | 6.567 * | |
| 13.58 | 45, 59, 73, 86, 100, 117, 129, 147, 174 | N.I. | - | 4.131 * | 0.659 | 2.720 * | |
| 14.03 | 45, 73, 84, 100, 141, 325, 340 | N.I. (3) | - | ||||
| 14.11 | 45, 73, 100, 147, 383, 398 | N.I. (3) | - | ||||
| RT (min) | Measured MS (m/z) | Tentative Metabolites | HMDB Formula | Error (mDa) | Adduct | Fold Change (1) | |||
|---|---|---|---|---|---|---|---|---|---|
| Positive | Negative | HFD/ND | HFDC/HFD | HFDC/ND | |||||
| 6.18 | 466.3111 | 464.2991 | Glycocholic acid | C26H43NO6 | 0.3 | [M+H]+ | 0.192 * | 1.782 | 0.342 |
| 6.84 | 431.2766 | 407.2806 | Cholic acid | C24H40O5P | 0.0 | [M+H]+ | 0.279 * | 0.348 | 0.097 * |
| 8.17 | 494.3225 | 538.3101 | LysoPC 16:1 | C24H50NO7P | 0.3 | [M+H]+ | 0.684 * | 1.035 | 0.708 |
| 9.98 | 524.3714 | 568.3626 | LysoPC 18:0 | C26H54NO7P | 1.6 | [M+H]+ | 1.279 * | 0.887 | 1.135 |
| Caffeine metabolites (2) | |||||||||
| 3.13 | 181.0727 | - | Theobromine | C7H8N4O2 | 0.1 | [M+H]+ | |||
| 3.24 | 197.0735 | 195.0514 | 1,7-Dimethyluric acid | C7H8N4O3 | 0.8 | [M+H]+ | |||
| 3.37 | 181.0720 | 179.0554 | Paraxanthine | C7H8N4O2 | -0.8 | [M+H]+ | |||
| Not-identified | |||||||||
| 4.81 | 321.1302 | - | N.I. | - | - | - | 0.248 * | 3.400 | 0.843 |
| 6.26 | 355.2635 | - | N.I. | - | - | - | 0.092 * | 0.039 | 0.004 * |
| 6.95 | 357.2794 | - | N.I. | - | - | - | 0.151 * | 0.235 * | 0.035 * |
| No. | m/z (+) | Adduct | Tentative ID | Fold Change (1) | ||
|---|---|---|---|---|---|---|
| HFD/ND | HFDC/HFD | HFDC/ND | ||||
| 1 | 468.4 | [M+H]+ | LysoPC 14:0 | 1.224 | 0.719 * | 0.880 |
| 2 | 508.5 | [M+H]+ | LysoPC P-18:0 | 1.446 * | 0.906 | 1.310 * |
| 3 | 520.5 | [M+H]+ | LysoPC 18:2 | 0.677 * | 1.133 | 0.767 * |
| 4 | 524.5 | [M+H]+ | LysoPC 18:0 | 1.596 * | 0.971 | 1.550 * |
| 5 | 542.5 | [M+H]+ | LysoPC 20:5 | 0.681 * | 1.059 | 0.721 * |
| 6 | 546.5 | [M+H]+ | LysoPC 20:3 | 1.402 * | 0.937 | 1.314 * |
| 7 | 640.5 | [M+NH4]+ | CE 16:1, DG 36:1 | 0.387 * | 1.748 * | 0.677 |
| 8 | 642.3 | [M+NH4]+ | CE 16:0, DG 36:0 | 0.624 * | 1.660 * | 1.035 |
| 9 | 690.2 | [M+NH4]+ | CE 20:4 | 0.784 | 1.548 * | 1.214 |
| 10 | 692.4 | [M+NH4]+ | CE 20:3 | 0.816 | 1.491 * | 1.216 |
| 11 | 694.5 | [M+NH4]+ | CE 20:2 | 0.578 * | 1.133 | 0.654 * |
| 12 | 764.6 | [M+NH4]+ | TG 44:2 | 1.822 * | 0.581 * | 1.059 |
| 13 | 780.6 | [M+Na]+ | PC 34:2 | 0.663 * | 1.084 | 0.719 * |
| 14 | 784.7 | [M+Na]+ | PC 34:0 | 0.744 * | 1.088 | 0.809 * |
| 15 | 794.6 | [M+NH4]+ | TG 46:1 | 1.519 * | 1.033 | 1.569 * |
| 16 | 810.7 | [M+NH4]+ | TG 47:0 | 1.454 * | 1.152 | 1.675 * |
| 17 | 822.6 | [M+NH4]+ | TG 48:1 | 1.665 * | 0.744 | 1.239 * |
| 18 | 838.7 | [M+NH4]+ | TG 49:0 | 1.574 * | 0.925 | 1.456 * |
| 19 | 842.6 | [M+NH4]+ | TG 50:5 | 0.637 * | 1.009 | 0.642 * |
| 20 | 844.6 | [M+NH4]+ | TG 50:4 | 0.633 * | 0.984 | 0.622 * |
| 21 | 850.7 | [M+NH4]+ | TG 50:1 | 2.070 * | 0.925 | 1.915 * |
| 22 | 852.7 | [M+NH4]+ | TG 50:0 | 2.032 * | 0.982 | 1.995 * |
| 23 | 860.6 | [M+NH4]+ | TG 51:3 | 0.741 * | 0.973 | 0.721 * |
| 24 | 870.6 | [M+NH4]+ | TG 52:5 | 0.364 * | 0.976 | 0.355 * |
| 25 | 872.6 | [M+NH4]+ | TG 52:4 | 0.495 * | 1.045 | 0.517 * |
| 26 | 876.7 | [M+NH4]+ | TG 52:2 | 2.197 * | 1.058 | 2.324 * |
| 27 | 878.7 | [M+NH4]+ | TG 52:1 | 2.798 * | 1.050 | 2.939 * |
| 28 | 880.7 | [M+NH4]+ | TG 52:0 | 1.733 * | 1.077 | 1.866 * |
| 29 | 886.6 | [M+NH4]+ | TG 53:4 | 0.710 * | 1.062 | 0.753 * |
| 30 | 892.6 | [M+NH4]+ | TG 53:1 | 0.555 * | 0.873 | 0.485 * |
| 31 | 896.6 | [M+NH4]+ | TG 54:6 | 0.551 * | 0.963 | 0.531 * |
| 32 | 898.6 | [M+NH4]+ | TG 54:5 | 0.682 * | 1.089 | 0.742 * |
| 33 | 904.7 | [M+NH4]+ | TG 54:2 | 1.901 * | 1.209 | 2.299 * |
| 34 | 906.7 | [M+NH4]+ | TG 54:1 | 1.663 * | 1.214 | 2.019 * |
| 35 | 916.6 | [M+NH4]+ | TG 56:10 | 0.451 * | 0.985 | 0.444 * |
| 36 | 918.6 | [M+NH4]+ | TG 56:9 | 0.244 * | 1.199 | 0.293 * |
| 37 | 920.6 | [M+NH4]+ | TG 56:8 | 0.399 * | 1.335 | 0.532 * |
| 38 | 922.6 | [M+NH4]+ | TG 56:7 | 0.605 * | 1.281 | 0.775 * |
| 39 | 928.7 | [M+NH4]+ | TG 56:4 | 1.475 * | 1.180 | 1.741 * |
| 40 | 942.6 | [M+NH4]+ | TG 58:11 | 0.263 * | 1.196 | 0.315 * |
| 41 | 944.6 | [M+NH4]+ | TG 58:10 | 0.407 * | 1.554 * | 0.633 * |
| 42 | 946.6 | [M+NH4]+ | TG 58:9 | 0.500 | 1.518 * | 0.759 * |
2.4. Analysis of Caffeine Metabolites in Urine and Serum
3. Experimental Section
3.1. Reagents
3.2. Animals and Diet
3.3. Urine, Serum, Organ, and Adipose Tissue Sample Preparation
3.4. Analyses of Serum, Urine, Liver, and Adipose Samples
3.4.1. Serum
3.4.2. Liver Lipid
3.4.3. Abdominal Adipose Tissue Enzyme Activity
3.5. The Preparation of Urine and Serum Samples for MS Analysis
3.6. Instrumental Analysis
3.6.1. UPLC-Q-TOF-MS Analysis
3.6.2. GC-TOF-MS Analysis
3.6.3. LTQ-XL-MS Lipid Analysis
3.7. Data Processing and Statistical Analysis
4. Conclusions
Supplementary Materials
Acknowledgments
Author Contributions
Conflicts of Interest
References
- Malnick, S.D.H.; Malnick, D.H.; Knobler, H. The medical complications of obesity. QJM 2006, 99, 565–579. [Google Scholar] [CrossRef] [PubMed]
- Mokdad, A.H.; Bowman, B.A.; Ford, E.S.; Vinicor, F.; Marks, J.S.; Koplan, J.P. The continuing epidemics of obesity and diabetes in the United States. JAMA 2001, 286, 1195–1200. [Google Scholar] [CrossRef] [PubMed]
- Park, Y.R.; Cho, Y.G.; Kang, J.H.; Park, H.A.; Kim, K.W.; Hur, Y.I.; Seo, J.S.; Park, N.Y. Comparison of Obesity and Overweight Prevalence Among Korean Adults According to Community Health Survey and Korea National Health and Nutrition Examination Survey. Korean J. Obes. 2014, 23, 64–68. [Google Scholar] [CrossRef]
- Bae, N.K.; Kwon, I.S.; Cho, Y.C. Ten Year Change of Body Mass Index in Korean: 1997–2007. Korean J. Obes. 2009, 18, 24–30. [Google Scholar]
- Martínez, I.; Perdicaro, D.J.; Brown, A.W.; Hammons, S.; Carden, T.J.; Carr, T.P.; Eskridge, K.M.; Walter, J. Diet-induced alterations of host cholesterol metabolism are likely to affect the gut microbiota composition in hamsters. Appl. Environ. Microbiol. 2013, 79, 516–524. [Google Scholar] [CrossRef]
- DeAngelis, R.A.; Markiewski, M.M.; Taub, R.; Lambris, J.D. A high-fat diet impairs liver regeneration in C57BL/6 mice through overexpression of the NF-kappaB inhibitor, IkappaBalpha. Hepatology 2005, 42, 1148–1157. [Google Scholar] [CrossRef] [PubMed]
- Backhed, F.; Manchester, J.K.; Semenkovich, C.F.; Gordon, J.I. Mechanisms underlying the resistance to diet-induced obesity in germ-free mice. Proc. Natl. Acad. Sci. USA 2007, 104, 979–984. [Google Scholar] [CrossRef] [PubMed]
- Kim, H.J.; Kim, J.; Noh, S.; Hur, H.J.; Sung, M.J.; Hwang, J.T.; Park, J.H.; Yang, H.J.; Kim, M.S.; Kwon, D.Y.; et al. Metabolomic analysis of livers and serum from high-fat diet induced obese mice. J. Proteome Res. 2011, 10, 722–731. [Google Scholar] [CrossRef] [PubMed]
- Bressanelloa, D.; Libertoa, E.; Collinoa, M.; Reichenbach, S.E.; Benetti, E.; Chiazza, F.; Cordero, C. Urinary metabolic fingerprinting of mice with diet-induced metabolic derangements by parallel dual secondary column-dual detection two-dimensional comprehensive gas chromatography. J. Chromatogr. A 2014, 1361, 265–276. [Google Scholar] [CrossRef] [PubMed]
- Connor, S.C.; Hansen, M.K.; Corner, A.; Smith, R.F.; Ryan, T.E. Integration of metabolomics and transcriptomics data to aid biomarker discovery in type 2 diabetes. Mol. BioSyst. 2010, 6, 909–921. [Google Scholar] [CrossRef] [PubMed]
- Shah, S.H.; Kraus, W.E.; Newgard, C.B. Metabolomic profiling for the identification of novel biomarkers and mechanisms related to common cardiovascular diseases: Form and function. Circulation 2012, 126, 1110–1120. [Google Scholar] [CrossRef] [PubMed]
- Denkert, C.; Bucher, E.; Hilvo, M.; Salek, R.; Orešič, M.; Griffin, J.; Brockmöller, S.; Klauschen, F.; Loibl, S.; Barupal, D.K.; et al. Metabolomics of human breast cancer: new approaches for tumor typing and biomarker discovery. Genome Med. 2012, 4, 37. [Google Scholar]
- Kaur, P.; Sheikh, K.; Alexander, K.; Kirilyuk, K.; Singh, R.; Ressom, H.W.; Cheema, A.K. Metabolomic profiling for biomarker discovery in pancreatic cancer. Int. J. Mass Spectrom. 2012, 310, 44–51. [Google Scholar] [CrossRef]
- Tomita, R.; Todoroki, K.; Machida, K.; Nishida, S.; Maruoka, H.; Yoshida, H.; Fujioka, T.; Nakashima, M.; Yamaguchi, M.; Nohta, H. Assessment of the efficacy of anticancer drugs by amino acid metabolomics using fluorescence derivatization-HPLC. Anal. Sci. 2014, 30, 751–758. [Google Scholar] [CrossRef] [PubMed]
- Yang, Z.; Marotta, F. Pharmacometabolomics in drug discovery & development: Applications and challenges. Metabolomics 2012, 2, e122. [Google Scholar] [CrossRef]
- Mohanpuria, P.; Kumar, V.; Yadav, S.K. Tea caffeine: metabolism, functions, and reduction strategies. Food Sci. 2010, 19, 275–287. [Google Scholar]
- Paradkar, M.M.; Irudayaraj, J. Rapid determination of caffeine content in soft drinks using FTIR–ATR spectroscopy. Food Chem. 2002, 78, 261–266. [Google Scholar] [CrossRef]
- Panchal, S.K.; Wong, W.Y.; Kauter, K.; Ward, L.C.; Brown, L. Caffeine attenuates metabolic syndrome in diet-induced obese rats. Nutrition 2012, 28, 1055–1062. [Google Scholar] [CrossRef] [PubMed]
- Vercambre, M.N.; Berr, C.; Ritchie, K.; Kang, J.H. Caffeine and cognitive decline in elderly women at high vascular risk. J. Alzheimers Dis. 2013, 35, 413–421. [Google Scholar] [PubMed]
- Kobayahi-Hattori, K.; Mogi, A.; Matsumoto, Y.; Takita, T. Effect of caffeine on the body fat and lipid metabolism of rats fed on a high-fat diet. Biosci. Biotechnol. Biochem. 2005, 69, 2219–2223. [Google Scholar] [CrossRef] [PubMed]
- Sugiura, C.; Nishimatsu, S.; Moriyama, T.; Ozasa, S.; Kawada, T.; Sayama, K. Catechins and caffeine inhibit fat accumulation in mice through the improvement of hepatic lipid metabolism. J. Obes. 2012, 2012. [Google Scholar] [CrossRef] [PubMed]
- Zhang, X.J.; Chinkes, D.L.; Aarsland, A.; Herndon, D.N.; Wolfe, R.R. Lipid metabolism in diet-induced obese rabbits is similar to that of obese humans. J. Nutr. 2008, 138, 515–518. [Google Scholar] [PubMed]
- Kim, J.Y.; Park, J.Y.; Kim, O.Y.; Ham, B.M.; Kim, H.J.; Kwon, D.Y.; Jang, Y.; Lee, J.H. Metabolic profiling of plasma in overweight/obese and lean men using ultra performance liquid chromatography and Q-TOF mass spectrometry (UPLC-Q-TOF MS). J. Proteome Res. 2010, 9, 4368–4375. [Google Scholar] [CrossRef] [PubMed]
- Kusunoki, M.; Tsutsumi, K.; Sato, D.; Nakamura, T. Lipoprotein lipase and obesity. Health 2012, 4, 1405–1412. [Google Scholar] [CrossRef]
- Xu, S.P.; Mao, X.Y.; Ren, F.Z.; Che, H.L. Attenuating effect of casein glycomacropeptide on proliferation, differentiation, and lipid accumulation of in vitro Sprague-Dawley rat preadipocytes. J. Dairy Sci. 2011, 94, 676–683. [Google Scholar] [CrossRef]
- Wang, H.; Eckel, R.H. Lipoprotein lipase: From gene to obesity. Am. J. Physiol. Endocrinol. Metab. 2009, 297, 271–288. [Google Scholar] [CrossRef]
- Moy, G.A.; McNay, E.C. Caffeine prevents weight gain and cognitive impairment caused by a high-fat diet while elevating hippocampal BDNF. Physiol. Behav. 2013, 17, 69–74. [Google Scholar] [CrossRef]
- Sinha, R.A.; Farah, B.L.; Singh, B.K.; Siddique, M.M.; Li, Y.; Wu, Y.; Ilkayeva, O.R.; Gooding, J.; Ching, J.; Zhou, J.; et al. Caffeine stimulates hepatic lipid metabolism by the autophagy-lysosomal pathway in mice. Hepatology 2014, 59, 1366–1380. [Google Scholar] [CrossRef] [PubMed]
- King, C.D.; Rios, G.R.; Green, M.D.; Tephly, T.R. UDP-glucuronosyltransferases. Curr. Drug Metab. 2000, 1, 143–161. [Google Scholar] [CrossRef] [PubMed]
- Cani, P.D.; Bibiloni, R.; Knauf, C.; Waget, A.; Neyrinck, A.M.; Delzenne, N.M.; Burcelin, R. Changes in gut microbiota control metabolic endotoxemia-induced inflammation in high-fat diet–induced obesity and diabetes in mice figure legends. Diabetes 2008, 57, 1470–1481. [Google Scholar] [CrossRef] [PubMed]
- Erridge, C.; Attina, T.; Spickett, C. M.; Webb, D.J. A high-fat meal induces low-grade endotoxemia: Evidence of a novel mechanism of postprandial inflammation. Am. J. Clin. Nutr. 2007, 86, 1286–1296. [Google Scholar] [PubMed]
- Kim, K.A.; Gu, W.; Lee, I.A.; Joh, E.H.; Kim, D.H. High fat diet-induced gut microbiota exacerbates inflammation and obesity in mice via the TLR4 signaling pathway. PLoS One 2012, 7, e47713. [Google Scholar] [CrossRef] [PubMed]
- Zhang, L.; Chu, X.; Wang, H.; Xie, H.; Guo, C.; Cao, L.; Zhou, X.; Wang, G.; Hao, H. Dysregulations of UDP-glucuronosyltransferases in rats with valproic acid and high fat diet induced fatty liver. Eur. J. Pharmacol. 2013, 721, 277–285. [Google Scholar] [CrossRef] [PubMed]
- Congiu, M.; Mashford, M.L.; Slavin, J.L.; Desmond, P.V. UDP glucuronosyltransferase mRNA levels in human liver disease. Drug Metab. Dispos. 2002, 30, 129–134. [Google Scholar] [CrossRef] [PubMed]
- Elwakkad, A.; Al-azhary, D.; Mohamed, S. The enhancement of the anti-inflammatory effect of caffeine on green tea extract and EGCG on obese rats. J. Am. Sci. 2011, 7, 128–138. [Google Scholar]
- An, Y.; Xu, W.; Li, H.; Lei, H.; Zhang, L.; Hao, F.; Duan, Y.; Yan, X.; Zhao, Y.; Wu, J.; et al. High-fat diet induces dynamic metabolic alterations in multiple biological matrices of rats. J. Proteome Res. 2013, 12, 3755–3768. [Google Scholar] [CrossRef] [PubMed]
- Wu, Q.; Zhang, H.; Dong, X.; Chen, X.F.; Zhu, Z.Y.; Hong, Z.T.; Chai, Y.F. UPLC-Q-TOF/MS based metabolomic profiling of serum and urine of hyperlipidemic rats induced by high fat diet. J. Pharm. Anal. 2014, 4, 360–367. [Google Scholar] [CrossRef]
- Jung, U.J.; Choi, M.S. Obesity and Its Metabolic Complications: The Role of Adipokines and the Relationship between Obesity, Inflammation, Insulin Resistance, Dyslipidemia and Nonalcoholic Fatty Liver Disease. Int. J. Mol. Sci. 2014, 15, 6184–6223. [Google Scholar] [CrossRef] [PubMed]
- Tamura, S.; Fujioka, H.; Nakano, T.; Amuro, Y.; Hada, T.; Nakao, N.; Higashino, K. Urinary pseudouridine as a biochemical marker in the diagnosis and monitoring of primary hepatocellular carcinoma. Am. J. Gastroenterol. 1988, 83, 841–845. [Google Scholar] [PubMed]
- Sun, Y.J.; Wang, H.P.; Liang, Y.J.; Liang, Y.J.; Yang, L.; Wu, Y.J. An NMR-based metabonomic investigation of the subacute effects of melamine in rats. J. Proteome Res. 2012, 11, 2544–2550. [Google Scholar] [CrossRef] [PubMed]
- Abbott, M.J.; Tang, T.; Sul, H.S. The Role of Phospholipase A2-derived Mediators in Obesity. Drug Discov. Today Dis. Mech. 2010, 7, e213–e218. [Google Scholar] [CrossRef] [PubMed]
- Yaligar, J.; Gopalan, V.; Kiat, O.W.; Sugii, S.; Shui, G.; Lam, B.D.; Henry, C.J.; Wenk, M.R.; Tai, E.S.; Velan, S.S. Evaluation of dietary effects on hepatic lipids in high fat and placebo diet fed rats by in vivo MRS and LC-MS techniques. PLoS One 2014, 9, e91436. [Google Scholar] [CrossRef] [PubMed]
- Kim, H.Y.; Kim, M.; Park, H.M.; Kim, J.; Kim, E.J.; Lee, C.H.; Yoon-Park, J.H. Lysophospholipid profile in serum and liver by high-fat diet and tumor induction in obesity-resistant BALB/c mice. Nutrition 2014, 30, 1433–1441. [Google Scholar] [CrossRef] [PubMed]
- Eisinger, K.; Liebisch, G.; Schmitz, G.; Aslanidis, C.; Krautbauer, S.; Buechler, C. Lipidomic Analysis of Serum from High Fat Diet Induced Obese Mice. Int. J. Mol. Sci. 2014, 15, 2991–3002. [Google Scholar] [CrossRef] [PubMed]
- Borg, M.L.; Omran, S.F.; Weir, J.; Meikle, P.J.; Watt, M.J. Consumption of a high-fat diet, but not regular endurance exercise training, regulates hypothalamic lipid accumulation in mice. J. Physiol. 2012, 590 (Pt 17), 4377–4389. [Google Scholar] [CrossRef] [PubMed]
- Simon, J.B.; Poon, R.W. Hepatic cholesterol ester hydrolase in human liver disease. Gastroenterology 1978, 75, 470–473. [Google Scholar] [PubMed]
- Murase, T.; Mizuno, T.; Omachi, T.; Onizawa, K.; Komine, Y.; Kondo, H.; Hase, T.; Tokimitsu, I. Dietary diacylglycerol suppresses high fat and high sucrose diet-induced body fat accumulation in C57BL/6J mice. J. Lipid Res. 2001, 42, 372–378. [Google Scholar] [PubMed]
- Hokanson, J.E.; Austin, M.A. Plasma triglyceride level is a risk factor for cardiovascular disease independent of high-density lipoprotein cholesterol level: A meta-analysis of population-based prospective studies. J. Cardiovasc. Risk 1996, 3, 213–219. [Google Scholar] [CrossRef] [PubMed]
- Cases, S.; Smith, S.J.; Zheng, Y.W.; Myers, H.M.; Lear, S.R.; Sande, E.; Novak, S.; Collins, C.; Welch, C.B.; Lusis, A.J.; et al. Identification of a gene encoding an acyl CoA:diacylglycerol acyltransferase, a key enzyme in triacylglycerol synthesis. Proc. Natl. Acad. Sci. USA 1998, 95, 13018–13023. [Google Scholar] [CrossRef] [PubMed]
- Zhao, S.M.; Li, W.Z.; Pan, H.B.; Huang, Y.; Yang, M.H.; Wei, H.J.; Gao, S.Z. Expression levels of candidate genes for intramuscular fat deposition in two Banna mini-pig inbred lines divergently selected for fatness traits. Genet. Mol. Biol. 2012, 35, 783–789. [Google Scholar] [CrossRef] [PubMed]
- Suzuki, Y.; Kaneko, R.; Nomura, M.; Naito, H.; Kitamori, K.; Nakajima, T.; Ogawa, T.; Hattori, H.; Seno, H.; Ishii, A. Simple and rapid quantitation of 21 bile acids in rat serum and liver by UPLC-MS-MS: Effect of high fat diet on glycine conjugates of rat bile acids. Nagoya J. Med. Sci. 2013, 75, 57–71. [Google Scholar] [PubMed]
- Cortez, M.; Carmo, L.S.; Rogero, M.M.; Borelli, P.; Fock, R.A. A high-fat diet increases IL-1, IL-6, and TNF-α production by increasing NF-κB and attenuating PPAR-γ expression in bone marrow mesenchymal stem cells. Inflammation 2013, 36, 379–386. [Google Scholar] [CrossRef] [PubMed]
- Feingold, K.R.; Spady, D.K.; Pollock, A.S.; Moser, A.H.; Grunfeld, C. Endotoxin, TNF, and IL-1 decrease cholesterol 7 α-hydroxylase mRNA levels and activity. J. Lipid Res. 1996, 37, 223–228. [Google Scholar] [PubMed]
- Lópeza, I.P.; Milagrob, F.I.; MartÍb, A.; Moreno-Aliagab, M.J.; MartÍnezb, J.A.; de Miguel, C. Gene expression changes in rat white adipose tissue after a high-fat diet determined by differential display. Biochem. Biophys. Res. Commun. 2004, 318, 234–239. [Google Scholar] [CrossRef] [PubMed]
- Caricilli, A.M.; Nascimento, P.H.; Pauli, J.R.; Tsukumo, D.M.; Velloso, L.A.; Carvalheira, J.B.; Saad, M.J. Inhibition of toll-like receptor 2 expression improves insulin sensitivity and signaling in muscle and white adipose tissue of mice fed a high-fat diet. J. Endocrinol. 2008, 199, 399–406. [Google Scholar] [CrossRef] [PubMed]
- Caubet, M.S.; Comteb, B.; Brazier, J.L. Determination of urinary 13C-caffeine metabolites by liquid chromatography–mass spectrometry: the use of metabolic ratios to assess CYP1A2 activity. J. Pharm. Biomed. Anal. 2004, 34, 379–389. [Google Scholar] [CrossRef] [PubMed]
- Folch, J.; Lees, M.; Sloane-Stanley, G.H. A simple method for the isolation and purification of total lipides from animal tissues. J. Biol. Chem. 1957, 226, 497–509. [Google Scholar] [PubMed]
- Want, E.J.; Wilson, I.D.; Gika, H.; Theodoridis, G.; Plumb, R.S.; Shockcor, J.; Holmes, E.; Nicholson, J.K. Global metabolic profiling procedures for urine using UPLC-MS. Nat. Protoc. 2010, 5, 1005–1018. [Google Scholar] [CrossRef] [PubMed]
- Chan, E.C.; Pasikanti, K.K.; Nicholson, J.K. Global urinary metabolic profiling procedures using gas chromatography-mass spectrometry. Nat. Protoc. 2011, 6, 1483–1499. [Google Scholar] [CrossRef] [PubMed]
- Matyash, V.; Liebisch, G.; Kurzchalia, T.V.; Shevchenko, A.; Schwudke, D. Lipid extraction by methyl-tert-butyl ether for high-throughput lipidomics. J. Lipid Res. 2008, 49, 1137–1346. [Google Scholar] [CrossRef] [PubMed]
- Lee, D.Y.; Kind, K.; Yoon, Y.R.; Fiehn, O.; Liu, K.H. Comparative evaluation of extraction methods for simultaneous mass-spectrometric analysis of complex lipids and primary metabolites from human blood plasma. Anal. Bioanal. Chem. 2014, 406, 7275–7286. [Google Scholar] [CrossRef] [PubMed]
- Wishart, D.S.; Jewison, T.; Guo, A.C.; Wilson, M.; Knox, C.; Liu, Y.; Djoumbou, Y.; Mandal, R.; Aziat, F.; Dong, E.; et al. HMDB 3.0—The Human Metabolome Database in 2013. Nucleic Acids Res. 2013, 41, D801–D807. [Google Scholar] [CrossRef] [PubMed]
- Fahy, E.; Sud, M.; Cotter, D.; Subramaniam, S. LIPID MAPS online tools for lipid research. Nucleic Acids Res. 2007, 35, W606–W612. [Google Scholar] [CrossRef] [PubMed]
- Kind, T.; Liu, K.H.; Lee, D.Y.; DeFelice, B.; Meissen, J.K.; Fiehn, O. LipidBlast in silico tandem mass spectrometry database for lipid identification. Nat. Methods 2013, 10, 755–758. [Google Scholar] [CrossRef] [PubMed]
- Sample Availability: No available.
© 2015 by the authors. Licensee MDPI, Basel, Switzerland. This article is an open access article distributed under the terms and conditions of the Creative Commons Attribution license ( http://creativecommons.org/licenses/by/4.0/).
Share and Cite
Kim, H.Y.; Lee, M.Y.; Park, H.M.; Park, Y.K.; Shon, J.C.; Liu, K.-H.; Lee, C.H. Urine and Serum Metabolite Profiling of Rats Fed a High-Fat Diet and the Anti-Obesity Effects of Caffeine Consumption. Molecules 2015, 20, 3107-3128. https://doi.org/10.3390/molecules20023107
Kim HY, Lee MY, Park HM, Park YK, Shon JC, Liu K-H, Lee CH. Urine and Serum Metabolite Profiling of Rats Fed a High-Fat Diet and the Anti-Obesity Effects of Caffeine Consumption. Molecules. 2015; 20(2):3107-3128. https://doi.org/10.3390/molecules20023107
Chicago/Turabian StyleKim, Hyang Yeon, Mee Youn Lee, Hye Min Park, Yoo Kyoung Park, Jong Cheol Shon, Kwang-Hyeon Liu, and Choong Hwan Lee. 2015. "Urine and Serum Metabolite Profiling of Rats Fed a High-Fat Diet and the Anti-Obesity Effects of Caffeine Consumption" Molecules 20, no. 2: 3107-3128. https://doi.org/10.3390/molecules20023107
APA StyleKim, H. Y., Lee, M. Y., Park, H. M., Park, Y. K., Shon, J. C., Liu, K.-H., & Lee, C. H. (2015). Urine and Serum Metabolite Profiling of Rats Fed a High-Fat Diet and the Anti-Obesity Effects of Caffeine Consumption. Molecules, 20(2), 3107-3128. https://doi.org/10.3390/molecules20023107