Article

QM/MM Studies of Contemporary and Novel Membrane Raft Fluorescent Probes

School of Chemistry, University of Nottingham, University Park, Nottingham NG7 2RD, UK
*
Author to whom correspondence should be addressed.
Molecules 2014, 19(7), 10230-10241; https://doi.org/10.3390/molecules190710230
Submission received: 16 June 2014 / Revised: 9 July 2014 / Accepted: 10 July 2014 / Published: 15 July 2014

Abstract

:
We have studied a number of contemporary and novel membrane probes, selected for their structural similarity to membrane raft components, in order to properly anchor themselves within a sphingolipid/cholesterol rich region. A QM/MM approach was adopted in order to understand the structural and electrostatic influences of fluorescence emission shifts of the probes in different lipid and solvation environments. The proposed modifications to the membrane probes have shown encouraging data relating not only to emission shifts within the membrane, but also their ability to anchor within a membrane raft domain and the stability to internalization within a membrane system.

1. Introduction

Hybrid quantum mechanics/molecular mechanics (QM/MM) has revolutionized the study of small molecules in solvated and complex biological environments [1]. Among the varied applications of QM/MM, the prediction of electronic spectra is a useful approach. Within this approach, one usually chooses the chromophore (or fluorophore) of interest to be described with a QM method (e.g., DFT), while describing the surrounding environment with the less computationally demanding molecular mechanics. In particular, for absorption spectra, we usually optimize the ground-state geometry of the molecule and find the vertical transition energy. The adiabatic excitation energy (often referred to as the 0-0 transition) can be found by also optimizing the geometry at the excited state of interest. Once we have this geometry, a vertical excitation energy calculation gives us the energy gap that is equivalent to the energy of fluorescence.
Fluorescent molecules are widely used as probes of membrane function by the membrane biophysics community [2,3,4,5,6,7,8,9,10,11,12,13,14]. Most natural biomolecules found within membranes possess few or no optical moieties which can easily be exploited and so the introduction of an external fluorescently labelled molecule is necessary for imaging in vitro. There are many different probes, of which two are widely used. The first type, the aminonaphthylethenylpyridinium (ANEP) dyes, are fast potentiometric membrane probes that can yield fluorescence shifts in response to changes in the membrane dipole potential, Ψd, in the sub-millisecond regime [11,15,16,17,18,19,20,21,22,23]. One particular ANEP dye, di-8-ANEPPS, has been shown both experimentally and theoretically to be sensitive only to Ψd and not to explicit molecular interactions [11,23]. Di-8-ANEPPS is also being exploited for non-linear optical imaging, potentially offering more information on the membrane environment being reported on [24]. The second type of probe are the BODIPY probes [25,26,27], which have found use in a wide range of applications, including as the lasing medium in a dye laser [28,29,30], biological imaging [31,32,33], organic light-emitting diodes [34], energy transfer cassettes [35], potential photosensitizers in photodynamic therapy [36] and dye-sensitized solar cells [37]. BODIPY dyes have emission shifts that are sensitive to solvent polarisability or solvent polarity [38,39,40,41], and that they are substantially less sensitive to hydrogen-bonding [41]. Our previous study of the core BODIPY molecule demonstrated a slight deviation from planarity of the geometry in the emitting state, using both CASPT2 and DFT [14]. Subsequent studies have found that the excited-state geometry of the S1 state can deviate significantly from planarity dependent upon the substituent attached to the BODIPY core [42].
Membrane rafts are domains found within membranes containing a high concentration of sphingolipids and cholesterol [43,44,45,46,47,48]. Thermodynamically favourable packing of cholesterol with these unsaturated lipids compared with saturated lipids helps drive the formation of these domains. They are thought to compartmentalize biological functions; in particular they are considered important in cellular signaling. It is known that a phase separation occurs leading to two regions: the liquid ordered (lo) and liquid disordered (ld) regions. The first is the raft domain, while the second is considered non-raft. There has been some effort for computational approaches to be able to accurately describe the polarizable electrostatic interactions that are partially responsible for the formation of these domains. Experimentally, it has been very difficult to characterize [49], as they are resistant to detergents commonly used to extract membranes. Within raft-like bilayers, there is a strong hydrogen-bonding interaction between the hydrogen of the sphingomyelin N-H bond and the oxygen of the cholesterol hydroxyl group [50]. Traditional membrane probes do not incorporate groups allowing this interaction and as such, these probes may not anchor properly into the raft domain.
In this work, we consider the calculation of the six molecules shown in Figure 1 using a QM/MM approach in which the probe molecules are solvated in water and also two different lipid bilayer environments, one of which represents a “raft-like” region. Molecules 1 and 3 are commercially available, while molecules 2a, 2b, 2c and 2d are modifications of a skeletal structure that is also commercially available. The modifications considered in this study represent truncated structures, in which the R-groups would normally be fatty acid tails. In particular, 2c represents a truncated structure in which the fatty acid tails most closely resemble the ester groups of the palmitoyl tails, while 2d represents a structure corresponding more closely to the sphingolipid tails, with the amide-type linkage (Figure 2). Our aim is to understand functional groups which should allow the probes to anchor properly within a raft domain, while not having a negative effect upon the emission spectra.
Figure 1. Chemical structures of the six molecules considered in this study. Molecule 2a R1 = H, R2 = H; 2b R1 = H, R2 = OH; 2c R1 = R2 = OH; 2d R1 = H, R2 = NH2.
Molecules 19 10230 g001
Figure 2. Chemical structures of the headgroup and linking region of DPPC (left) and sphingomyelin (right). In all cases, the R groups are fatty acid chains.
Molecules 19 10230 g002

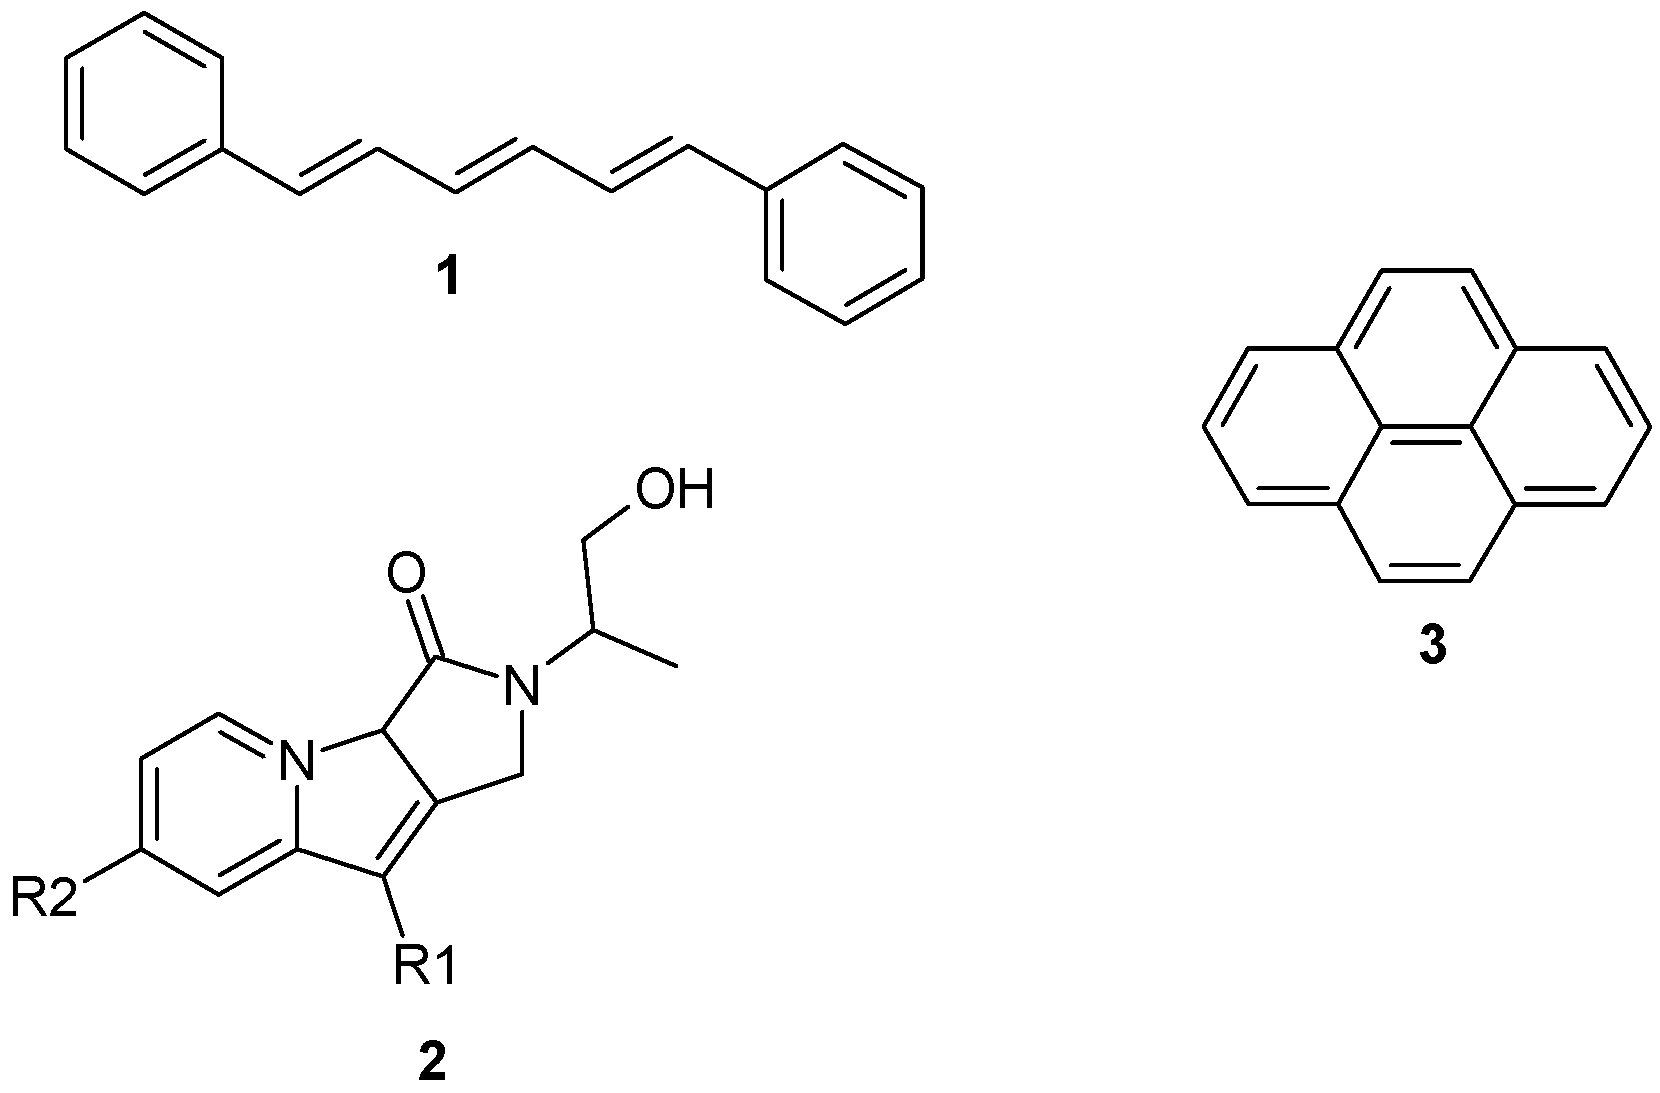
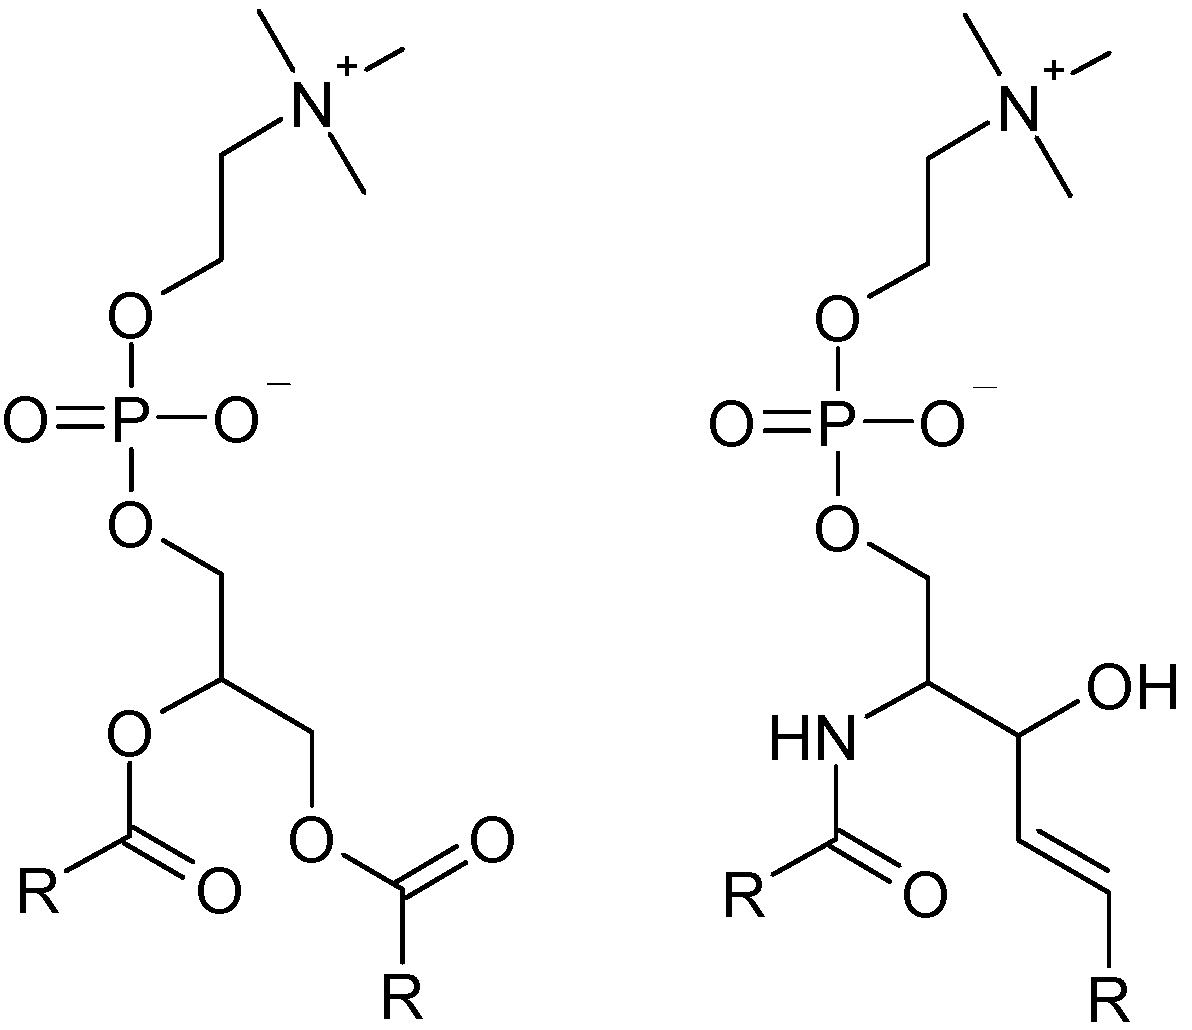
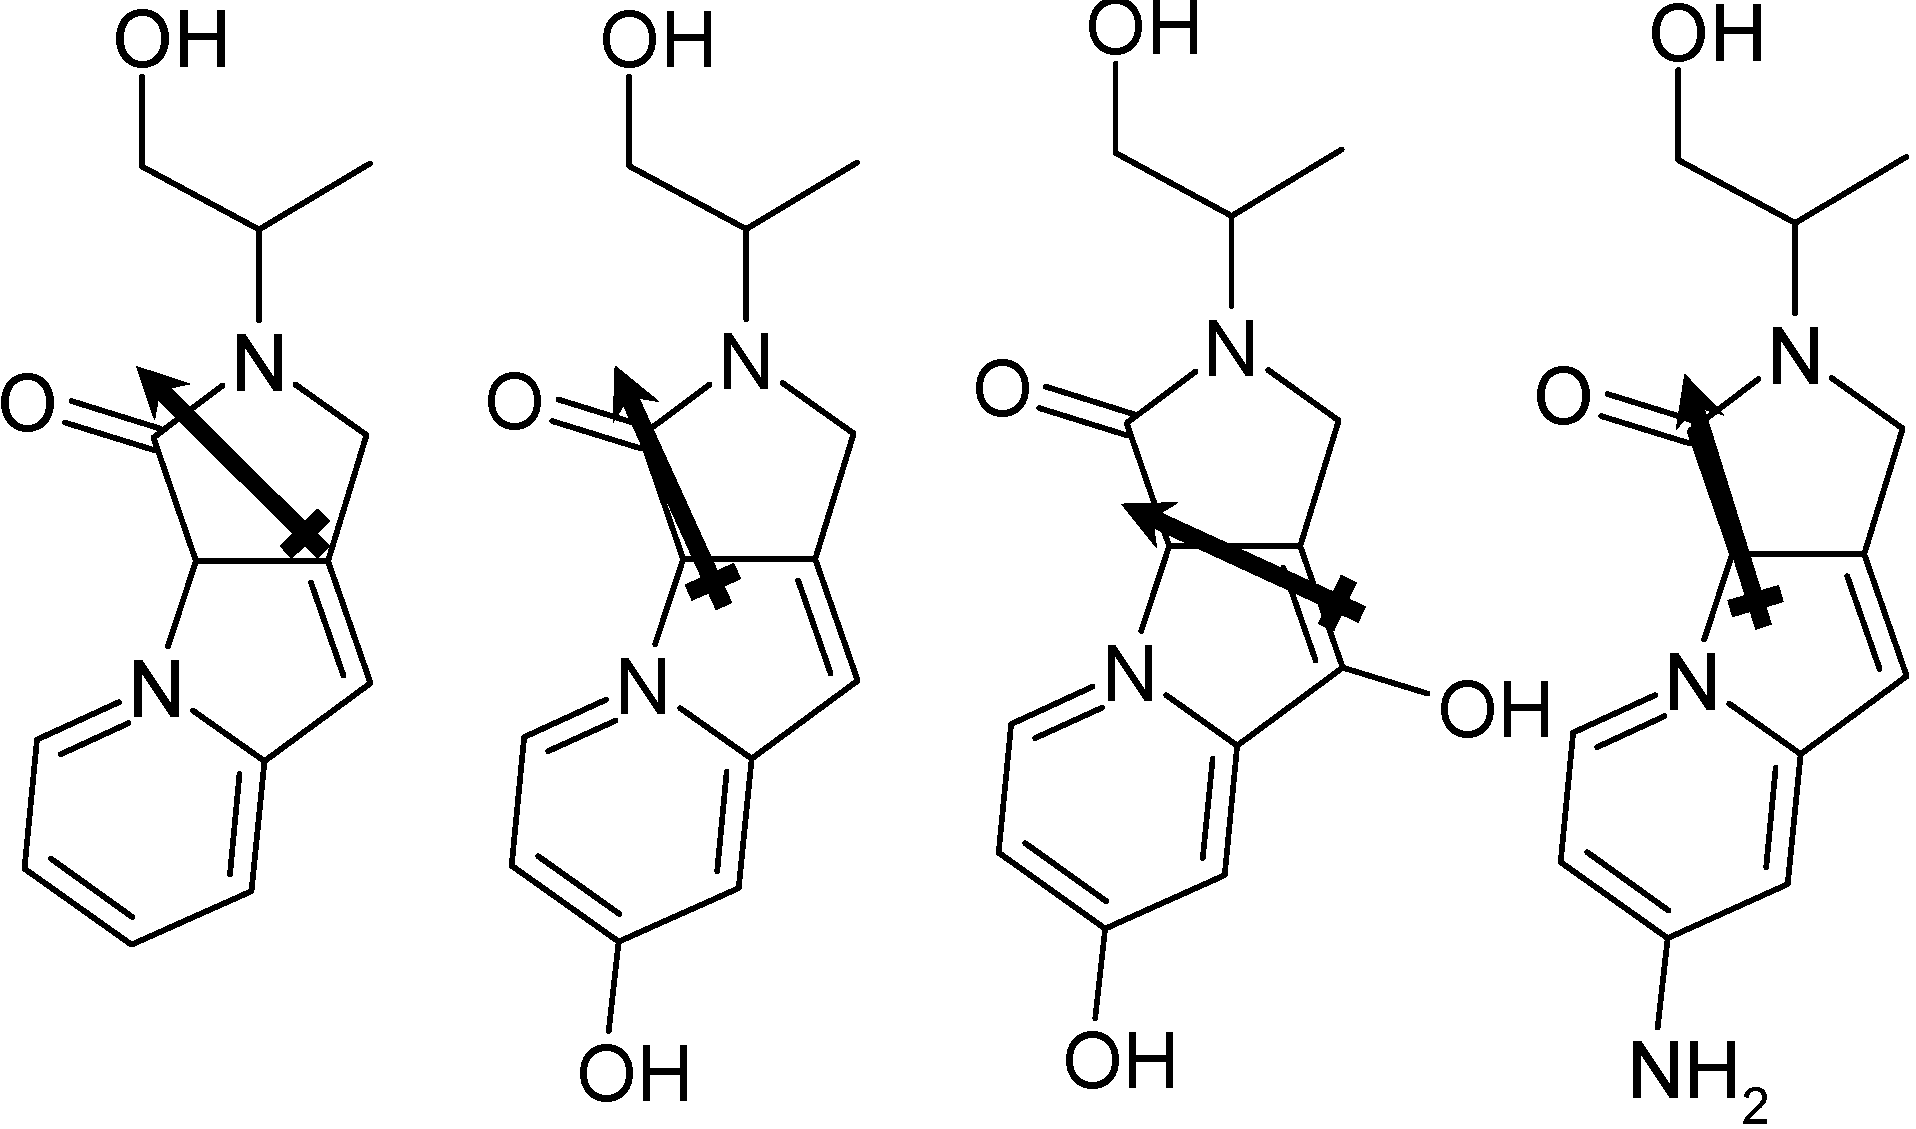
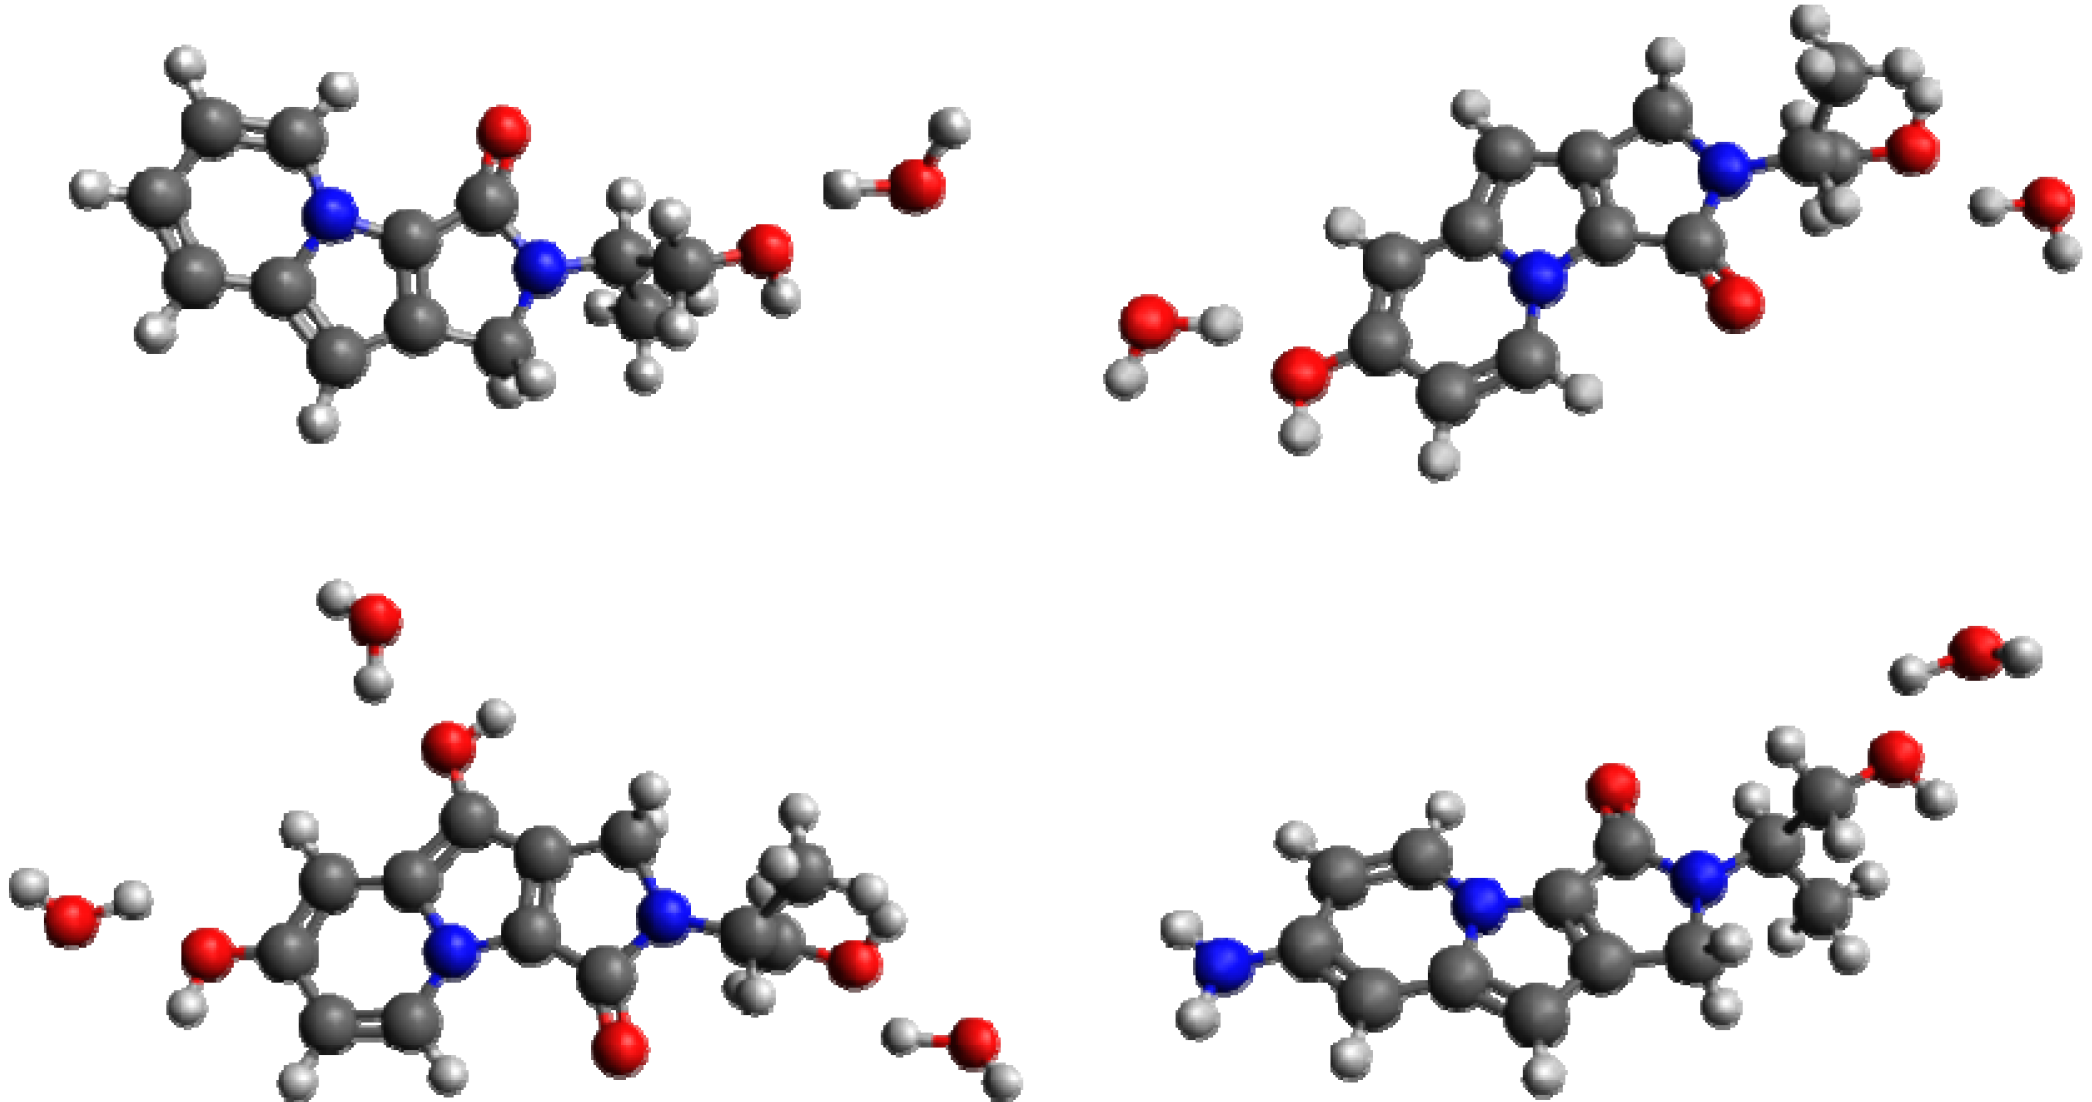
2. Results and Discussion

Given in Table 1 are the Franck-Condon vertical excitation energies, 0-0 excitation energies and fluorescence emission energies calculated in the gas-phase and using the implicit PCM solvent. Molecules 1 and 3 show very little variation in their absorption and emission energies with respect to the dielectric environment. This is to be expected, given the hydrophobic nature of these molecules. The more hydrophilic molecules show larger shifts in general, with 2b having the largest shift in the vertical absorption (0.11 eV) and emission energies between the gas phase and solvated in water (0.14 eV).
The vertical absorption and emission energies when explicit water molecules were included within the PCM model calculations are presented in Table 2. In all cases a small shift is observed. In particular, the emission energies are all red-shifted by ~0.1 eV with respect to the energies without explicit water present. Molecules 2a and 2b each have a single explicit water molecule, while 2b and 2c have 2 and 3 explicit water molecules, respectively. It can be concluded that when there is hydrogen-bonding to –OH groups at the R1 and R2 positions, there is no shift on the emission energies, but that any shift is due to the bulk electrostatic effect of the solvent. Comparing the results of the explicit water calculations to the PCM implicit solvent calculations implies that water hydrogen-bonded to the single –OH group from the skeletal structure of molecule 2 seems to cause a systematic shift of ~0.1 eV; this may simply reflect a better estimate of the energy when explicit solvent molecules are included rather than a continuum solvent. With this in mind, we come next to the results of each of the molecules solvated in water using a QM/MM approach. Molecules 1 and 3 did not exhibit any shift (data not shown). Molecule 2a shows an identical shift to that observed using explicit water molecules, while 2b and 2c show a significant red-shift from both the PCM model and explicit water emission results. Molecule 2d shows a similar result to that obtained using the PCM model. Molecules 2b and 2c both contain –OH groups on the aromatic ring and these data suggest that hydrogen-bonding at these positions may cause large shifts in the emission energy, depending on the strength of the hydrogen bond.
Table 1. Franck-Condon vertical excitation, 0-0 and emission energies calculated using LRC-ωPBE/6-31G(d) in the gas phase and solvated using the PCM model. All energies in eV.
MoleculeεVertical0-0EmissionMoleculeεVertical0-0Emission
113.923.723.462c13.883.503.11
6.023.923.733.45 6.023.953.633.18
20.73.923.733.45 20.73.963.663.19
78.43.923.733.45 78.43.963.673.19
2a14.454.113.762d14.213.843.57
6.024.494.213.83 6.024.324.063.67
20.74.504.243.84 20.74.334.103.69
78.44.504.253.84 78.44.344.113.69
2b14.273.933.58314.124.023.90
6.024.354.083.69 6.024.124.033.89
20.74.374.113.72 20.74.124.043.89
78.44.384.133.72 78.44.124.043.89
Table 2. Franck-Condon vertical excitation and emission energies calculated using LRC-ωPBE/6-31G(d) using the PCM model with additional explicit water molecules and also calculated using the QM/MM approach. All energies in eV.
Vertical ExcitationEmission
MoleculePCMExplicit Water + PCMPCMExplicit Water + PCMQM/MM
2a4.504.423.843.733.83
2b4.384.313.723.633.49
2c3.964.093.193.102.91
2d4.344.263.693.593.57
Within a membrane leaflet, a membrane probe should have a dipole moment which aligns with the large dipole moments of the lipid molecules. In the event that the dipole moment is opposed to these, then the probe molecule is likely to internalize. Figure 3 displays the qualitative direction of each of the dipole moments. The dipole moments are at ~30° to the orientation of the molecules as shown in Figure 3; each of the probes will therefore align with the dipole moments of the lipid molecules. While the QM/MM calculations include this information explicitly, it is worth considering the dipole moments in the gas phase so as to understand the orientation the probe will take within a lipid bilayer, and ensure that the fluorophore region of the probe is aligned with the membrane normal, such that the probe will be most effective.
Figure 3. Molecules 1 and 2 orientated with respect to the membrane normal. A qualitative illustration of the ground state static dipole moment for each molecule is shown.
Molecules 19 10230 g003
Given in Table 3 are the emission energies calculated in the membrane environments using QM/MM. It is important to remember that the electrostatic potential felt by these molecules will correspond to the static potential, as we are not performing dynamics. Molecules 1, 2a, 2b and 3 display almost no shift between the two membrane environments, while 2c and 2d display significant shifts. As molecules 1 and 3 are known to interact with the dipole potential, it is clear from these data that these probes interact with the dynamical potential. Molecules 2c and 2d may also interact with the dynamical potential further, but it is clear that these probe molecules, as models of potential raft-based probes, show substantial shifts between differing membrane environments, potentially allowing reporting from within membrane rafts.
Table 3. Emission energies of the fluorescent probes within two different membrane environments calculated with QM/MM. All energies in eV.
MoleculeDPPCDPPC w/30 molar % Cholesterol
13.453.44
2a3.743.75
2b3.573.57
2c2.993.47
2d3.583.37
33.913.91
The results obtained here give good grounding to the use of such probes. However, one must also consider that, in expanding calculations to include more dynamical elements, the use of combined QM/MM in which the MM region is described by a polarizable force-field is a desirable approach [50,51,52,53], as the absolute value of the membrane dipole potential for the different bilayers is obtained with quantitative accuracy, whereas with a non-polarizable force-field, the difference in dipole potential is correctly predicted, but not the absolute value.

3. Experimental Section

Calculations were performed on the six molecules shown in Figure 2. All DFT calculations were performed using Q-Chem [54,55], while the QM/MM calculations were performed using the Q-Chem – CHARMM interface [56].

3.1. Gas-Phase Calculations

Ground-state gas-phase geometries were obtained using the PBE0 functional [57] with the 6-31G(d) basis set. The excited state geometries were obtained with time-dependent DFT (TDDFT) by using the long-range corrected ωPBE (LRC-ωPBE) functional [58], which was used for all energetics reported here. Previous studies utilizing TDDFT have found problems with charge-transfer states, in which the vertical excitation energies are too low. The LRC scheme partitions the electron repulsion operator into a short-range and long-range components in the evaluation of the exchange term:
Molecules 19 10230 i001
where erf is the error function and Molecules 19 10230 i002. The first term on the right-hand side of equation 1 is the short-range component of the exchange and is evaluated with DFT, while the second term is the long-range component, which is evaluated with exact Hartree-Fock exchange.

3.2. Solvated Calculations

Ground-state and excited state geometries were obtained with the same functional and basis set combinations as for the ground-state. The first set of solvated calculations employed the polarizable continuum model (PCM) [59], with ethyl acetate (ε = 6.02), acetone (ε = 20.7) and water (ε = 78.4) used as the solvents. These solvents were selected as the dielectric constants approximately reflect the effective dielectric permittivity of the membrane interior, membrane-water interfacial region and bulk water region, respectively. For the calculation of vertical excitation energies, the reaction field was not in equilibrium with the excited state (an optical dielectric constant of 1.78 was used in all cases) [59]. For the calculation of the excited-state geometry and hence emission energies, the reaction field was in equilibrium with the excited-state, with the dielectric constant equal to that of the solvent being used (see above).
Figure 4. Molecules 2a2d clockwise from top-left, with added explicit water molecules.
Molecules 19 10230 g004
A second set of calculations were performed for molecules 2b and 2c within the PCM model, with an additional explicit water molecule per –OH group of the probe molecule (see Figure 4). A geometry optimization was performed (with LRC-ωPBE/6-31G(d) ) to bring the cluster(s) to a minimum energy conformation, before the excited-state calculations were performed (as described above).

3.3. QM/MM Water Calculations

Each of the six molecules were solvated to a minimum depth of 10 Å with TIP3P [60] water using ad-hoc parameters of the probe molecules generated by SwissParam [61], based on data from the Merck Molecular Force-Field (MMFF). Once the molecules were solvated, the probe molecule was defined as the QM region, with the MM region comprising the water molecules. Energy minimization was performed for both the ground state and excited state of each molecule using the same functional and basis set combination as the previous calculations. The structures were considered converged using the standard CHARMM tolerances.

3.4. QM/MM Membrane Calculations

The ad hoc parameters for the probe molecules (above) were used in a modified form of scripts available from the CHARMM-GUI [62,63]. Two membrane systems were considered: one with a composition of pure DPPC and the second with a binary lipid composition of 30 molar % cholesterol with DPPC (see Figure 5). The system was initially equilibrated as follows: a total of 500 steps of steepest-descent minimization were initially used to remove any bad contacts, followed by a further 1,000 steps of adapted basis Newton−Raphson (ABNR) minimization, employing the CHARMM36 all-atom lipid force-field [64]. Equilibration dynamics were performed initially using a 1 fs time step for 50 ps with a nonbond cutoff of 16 Å, with the force-based switching function starting at 10 Å and eliminating all pair contributions at 12 Å. Long-range electrostatics were treated using the Particle Mesh Ewald (PME) algorithm, using a sixth order spline interpolation. Langevin temperature control was used, with damping of 10 ps−1. Periodic boundary conditions were used, using tetragonal symmetry. A harmonic term was used to restrain the lipid headgroups from moving too far from their starting positions. The SHAKE algorithm was used to constrain all bonds to hydrogen atoms. Further equilibration for 500 ps was performed using a 2 fs time step and a Langevin barostat with a piston period of 50 fs and a decay period of 25 fs, with the harmonic term removed. In all of these steps, the probe molecule was constrained to stay planar. The final snapshot from this equilibration stage was used as the initial geometry for the QM/MM minimization, in which the probe molecule was described using DFT (the LRC-ωPBE functional and 6-31G(d) basis set), while the CHARMM36 force-field was used to account for the lipids; TIP3P was used for the water molecules. Initially, minimization with ABNR was performed for 2000 steps, with further minimization until the change in the energy of the system fell below 0.0006 kcal mol−1, to be consistent with the tolerance found within the Q-Chem program.
Figure 5. Molecule 2c within a bilayer system for the QM/MM calculation, showing the orientation of the probes.
Molecules 19 10230 g005

4. Conclusions

A selection of contemporary and novel membrane probes, selected for their structural similarity to membrane raft components, has been investigated. Molecules 2c and 2d, the most representative molecules with respect to mimicking the structure of lipid molecule linkages, have shown large shifts with respect to the surrounding electrostatic environment. While considering potential probes of membrane function within raft-like domains, we suggest that these probes could offer substantial performance improvements over traditional probes when looking at fluorescence emission spectroscopy.

Acknowledgments

DR wishes to thank the Leverhulme Trust for the award of an Early Career Fellowship. We thank the University of Nottingham for provision of time on the High-Performance Computing (HPC) facility.

Author Contributions

Both authors contributed equally to this manuscript.

Conflicts of Interest

The authors declare no conflict of interest.

References and Notes

  1. The Nobel Prize in Chemistry 2013, Nobelprize.org. Nobel Media AB 2013. Available online: http://www.nobelprize.org/nobel_prizes/chemistry/laureates/2013/ (accessed on 19 May 2014).
  2. Helms, V. Electronic excitations of biomolecules studied by quantum chemistry. Curr. Opin. Struct. Biol. 2002, 12, 169–175. [Google Scholar]
  3. Paulick, M.G.; Forstner, M.B.; Groves, J.T.; Bertozzi, C.R. A chemical approach to unraveling the biological function of the glycosylphosphatidylinositol anchor. Proc. Natl. Acad. Sci. USA 2007, 104, 20332–20337. [Google Scholar]
  4. Limon, A.; Reyes-Ruiz, J.M.; Eusebi, F.; Miledi, R. Properties of GluR3 receptors tagged with GFP at the amino or carboxyl terminus. Proc. Natl. Acad. Sci. USA 2007, 104, 15526–15530. [Google Scholar]
  5. Leake, M.C.; Chandler, J.H.; Wadhams, G.H.; Bai, F.; Berry, R.M.; Armitage, J.P. Stoichiometry and turnover in single, functioning membrane protein complexes. Nature 2006, 443, 355–358. [Google Scholar]
  6. Prescott, M.; Battad, J.; Wilmann, P.; Rossjohn, J.; Devenish, R. Recent advances in all-protein chromophore technology. Biotechnol. Annu. Rev. 2006, 12, 31–66. [Google Scholar]
  7. Zhang, Z.; Alfonta, L.; Tian, F.; Bursulaya, B.; Uryu, S.; King, D.S.; Schultz, P.G. Selective incorporation of 5-hydroxytryptophan into proteins in mammalian cells. Proc. Natl. Acad. Sci. USA 2004, 101, 8882–8887. [Google Scholar]
  8. Hogue, C.W.V.; Rashquinha, I.; Szabo, A.G.; MacManus, J.P. A new intrinsic fluorescent probe for proteins Biosynthetic incorporation of 5-hydroxytryptophan into oncomodulin. FEBS Lett. 1992, 310, 269–272. [Google Scholar]
  9. Ross, J.B.A.; Senear, D.F.; Waxman, E.; Kombo, B.B.; Rusinova, E.; Huang, Y.T.; Laws, W.R.; Hasselbacher, C.A. Spectral enhancement of proteins: Biological incorporation and fluorescence characterization of 5-hydroxytryptophan in bacteriophage lambda cI repressor. Proc. Natl. Acad. Sci. USA 1992, 89, 12023–12027. [Google Scholar]
  10. Botchway, S.W.; Barba, I.; Jordan, R.; Harmston, R.; Haggie, P.M.; William, S.P.; Fulton, A.M.; Parker, A.W.; Brindle, K.M. A novel method for observing proteins in vivo using a small fluorescent label and multiphoton imaging. Biochem. J. 2005, 390, 787–790. [Google Scholar]
  11. Robinson, D.; Besley, N.A.; O’Shea, P.; Hirst, J.D. Di-8-ANEPPS emission spectra in phospholipid/cholesterol membranes: A theoretical study. J. Phys. Chem. B 2011, 115, 4160–4167. [Google Scholar]
  12. Robinson, D.; Besley, N.A. Modelling the spectroscopy and dynamics of plastocyanin. Phys. Chem. Chem. Phys. 2010, 12, 9667–9676. [Google Scholar]
  13. Besley, N.A.; Robinson, D. Theoretical simulation of the spectroscopy and dynamics of a red copper protein. Faraday Discuss. 2011, 148, 55–70. [Google Scholar]
  14. Briggs, E.A.; Besley, N.A.; Robinson, D. QM/MM excited state molecular dynamics and fluorescence spectroscopy of BODIPY. J. Phys. Chem. A 2013, 117, 2644–2650. [Google Scholar]
  15. Bouevitch, O.; Lewis, A.; Pinevsky, I.; Wuskell, J.P.; Loew, L.M. Probing membrane potential with nonlinear optics. Biophys. J. 1993, 65, 672–679. [Google Scholar]
  16. Campagnola, P.J.; Wei, M.D.; Lewis, A.; Loew, L.M. High-Resolution nonlinear optical imaging of live cells by second harmonic generation. Biophys. J. 1999, 77, 3341–3349. [Google Scholar]
  17. Millard, A.C.; Jin, L.; Lewis, A.; Loew, L.M. Direct measurement of the voltage sensitivity of second-harmonic generation from a membrane dye in patch-clamped cells. Opt. Lett. 2003, 28, 1221–1223. [Google Scholar]
  18. Fluhler, E.; Burnham, V.G.; Loew, L.M. Spectra, membrane binding, and potentiometric responses of new charge shift probes. Biochemistry 1985, 24, 5749–5755. [Google Scholar]
  19. Zhang, J.; Davidson, R.M.; Wei, M.D.; Loew, L.M. Membrane electric properties by combined patch clamp and fluorescence ratio imaging in single neurons. Biophys. J. 1998, 74, 48–53. [Google Scholar]
  20. Loew, L.M. Potentiometric dyes: Imaging electrical activity of cell membranes. Pure Appl. Chem. 1996, 68, 1405–1409. [Google Scholar]
  21. Millard, A.C.; Jin, L.; Wei, M.D.; Wuskell, J.P.; Lewis, A.; Loew, L.M. Sensitivity of second harmonic generation from styryl dyes to transmembrane potential. Biophys. J. 2004, 86, 1169–1176. [Google Scholar]
  22. Montana, V.; Farkas, D.L.; Loew, L.M. Dual-Wavelength ratiometric fluorescence measurements of membrane potential. Biochemistry 1989, 28, 4536–4539. [Google Scholar]
  23. Goff, G.L.; Vitha, M.F.; Clarke, R.J. Orientational polarisability of lipid membrane surfaces. Biochim. Biophys. Acta 2007, 1768, 562–570. [Google Scholar]
  24. Rusu, C.F.; Lanig, H.; Othersen, O.G.; Kryschi, C.; Clark, T. Monitoring biological membrane-potential changes: A CI QM/MM study. J. Phys. Chem. B 2008, 112, 2445–2455. [Google Scholar]
  25. Benniston, A.C.; Copley, G. Lighting the way ahead with boron dipyrromethene (BODIPY) dyes. Phys. Chem. Chem. Phys. 2009, 11, 4124–4131. [Google Scholar]
  26. Treibs, A.; Kreuzer, F.H. Difluorboryl complexes of di-and tripyrrylmethene. Justus Liebigs. Ann. Chem. 1968, 718, 208–223. [Google Scholar]
  27. Ulrich, G.; Ziessel, R.; Harriman, A. The chemistry of fluorescent BODIPY dyes: Versatility unsurpassed. Angew. Chem. Int. Ed. 2008, 47, 1184–1201. [Google Scholar]
  28. Partridge, W.P.; Laurendeau, N.M.; Johnson, C.C.; Steppel, R.N. Performance of pyrromethene 580 and 597 in a commercial Nd: YAG-Pumped dye-laser system. Opt. Lett. 1994, 19, 1630–1632. [Google Scholar]
  29. García-Moreno, I.; Amat-Guerri, F.; Liras, M.; Costela, A.; Infantes, L.; Sastre, R.; López Arbeloa, F.; Bañuelos Prieto, J.; López Arbeloa, I. Structural changes in the BODIPY dye PM567 enhancing the laser action in liquid and solid media. Adv. Funct. Mater. 2007, 17, 3088–3098. [Google Scholar]
  30. Jagtap, K.K.; Maity, D.K.; Ray, A.K.; Dasgupta, K.; Ghosh, S.H. High efficiency dye laser with low fluorescence yield pyrromethene dyes: Experimental and theoretical studies. Appl. Phys. B-Laser Opt. 2011, 103, 917–924. [Google Scholar]
  31. Loudet, A.; Burgess, K. BODIPY dyes and their derivatives: Syntheses and spectroscopic properties. Chem. Rev. 2007, 107, 4891–4932. [Google Scholar]
  32. Que, E.L.; Domaille, D.W.; Chang, C.J. Metals in neurobiology: Probing their chemistry and biology with molecular imaging. Chem. Rev. 2008, 108, 1517–1549. [Google Scholar]
  33. Boens, N.; Leen, V.; Dehaen, W. Fluorescent indicators based on BODIPY. Chem. Soc. Rev. 2012, 41, 1130–1172. [Google Scholar]
  34. Santra, M.; Moon, H.; Park, M.H.; Lee, T.W.; Kim, Y.K.; Ahn, K.H. Dramatic substituent effects on the photoluminescence of boron complexes of 2-(benzothiazol-2-yl)phenols. Chem. Eur. J. 2012, 18, 9886–9893. [Google Scholar]
  35. Bozdemir, O.A.; Cakmak, S.E.; Ekiz, O.O.; Dana, A.; Akkaya, E.U. Towards unimolecular luminescent solar concentrators: Bodipy-Based dendritic energy-transfer cascade with panchromatic absorption and monochromatized emission. Angew. Chem. Int. Ed. 2011, 50, 10907–10912. [Google Scholar]
  36. Kamkaew, A.; Lim, S.H.; Lee, H.B.; Kiew, L.V.; Chung, L.Y.; Burgess, K. BODIPY dyes in photodynamic therapy. Chem. Soc. Rev. 2013, 42, 77–88. [Google Scholar]
  37. Erten-Ela, S.; Yilmaz, M.D.; Icli, B.; Dede, Y.; Icli, S.; Akkaya, E.U. A panchromatic boradiazaindacene (BODIPY) sensitizer for dye- sensitized solar cells. Org. Lett. 2008, 10, 3299–3302. [Google Scholar]
  38. Catalán, J. Toward a generalized treatment of the solvent effect based on four empirical scales: Dipolarity (SdP, a new scale), polarizability (SP), acidity (SA), and basicity (SB) of the medium. J. Phys. Chem. B 2009, 113, 5951–5960. [Google Scholar]
  39. Filarowski, A.; Kluba, M.; Ciesĺ ik-Boczula, K.; Koll, A.; Kochel, A.; Pandey, L.; de Borggraeve, W.M.; Van der Auweraer, M.; Catalán, J.; Boens, N. Generalized solvent scales as a tool for investigating solvent dependence of spectroscopic and kinetic parameters. Application to fluorescent BODIPY dyes. Photochem. Photobiol. Sci 2010, 9, 996–1008. [Google Scholar]
  40. Boens, N.; Leen, V.; Dehaen, W.; Wang, L.; Robeyns, K.; Qin, W.; Tang, X.; Beljonne, D.; Tonnelé, C.; Paredes, J.M.; et al. Visible absorption and fluorescence spectroscopy of conformationally constrained, annulated BODIPY dyes. J. Phys. Chem. A 2012, 116, 9621–9631. [Google Scholar]
  41. López Arbeloa, F.; López Arbeloa, T.; López Arbeloa, I.; García-Moreno, I.; Costela, A.; Sastre, R.; Amat-Guerri, F. Photophysical and lasing properties of pyrromethene 567 dye in liquid solution: Environment effects. Chem. Phys. 1998, 236, 331–341. [Google Scholar]
  42. Boens, N.; Jiao, L.; Zhang, P.; Yu, C.; Wang, J.; Briggs, E.A.; Besley, N.A.; Robinson, D. Structural control of the photophysical properties of meso-alkyl BODIPY dyes. University of Leuven: Leiven, Belgium, in preparation (unpublished work); 2014. [Google Scholar]
  43. Gurtovenko, A.A.; Anwar, J.; Vattulainen, I. Defect-Mediated trafficking across cell membranes: Insights from in silico modeling. Chem. Rev. 2010, 110, 6077–6103. [Google Scholar]
  44. Robinson, D.; Besley, N.A.; O’Shea, P.; Hirst, J.D. Water order profiles on phospholipid/cholesterol membrane bilayer surfaces. J. Comput. Chem. 2011, 32, 2613–2618. [Google Scholar]
  45. Mihailescu, M.; Vaswani, R.G.; Jardón-Valadez, E.; Castro-Román, F.; Freites, J.A.; ZWorcester, D.L.; Chamberlin, A.R.; Tobias, D.J.; White, S.H. Acyl-Chain methyl distributions of liquid-ordered and disordered membranes. Biophys. J. 2011, 100, 1455–1462. [Google Scholar]
  46. O’Connor, J.W.; Klauda, J.B. Lipid membranes with a majority of cholesterol: Applications to the ocular lens and aquaporin 0. J. Phys. Chem. B 2011, 115, 6455–6464. [Google Scholar]
  47. Zidar, J.; Merzel, F.; Hodoscek, M.; Rebolj, K.; Sepcic, K.; Macek, P.; Janezic, D. Liquid-Ordered phase formation in cholesterol/sphingomyelin bilayers: All-atom molecular dynamics simulations. J. Phys. Chem. B 2009, 113, 15795–15802. [Google Scholar]
  48. Simons, K.; Ikonen, E. Functional rafts in cell membranes. Nature 1997, 387, 569–572. [Google Scholar]
  49. Simons, K.; Toomre, D. Lipid rafts and signal transduction. Nat. Rev. Mol. Cell. Biol. 2000, 1, 31–39. [Google Scholar]
  50. Robinson, D. A polarizable force-field for cholesterol and sphingomyelin. J. Chem. Theory Comput. 2013, 9, 2498–2503. [Google Scholar]
  51. Chowdhary, J.; Harder, E.; Lopes, P.E.M.; Huang, L.; MacKerell, A.D., Jr.; Roux, B. A polarizable force field of dipalmitoylphosphatidylcholine based on the classical drude model for molecular dynamics simulations of lipids. J. Phys. Chem. B 2013, 117, 9142–9160. [Google Scholar]
  52. Lu, Z.; Zhang, Y. Interfacing ab initio quantum mechanical method with classical drude osillator polarizable model for molecular dynamics simulation of chemical reactions. J. Chem. Theory Comput. 2008, 4, 1237–1248. [Google Scholar]
  53. Boulanger, E.; Thiel, W. Toward QM/MM simulation of enzymatic reactions with the drude oscillator polarizable force field. J. Chem. Theory Comput. 2014, 10, 1795–1809. [Google Scholar]
  54. Shao, Y.; Molnar, L.F.; Jung, Y.; Kussman, J.; Ochsenfeld, C.; Brown, S.T. Advances in methods and algorithms in a modern quantum chemistry program package. Phys. Chem. Chem. Phys. 2006, 8, 3172–3191. [Google Scholar]
  55. Krylov, A.I.; Gill, P.M.W. Q-Chem: An engine for innovation. WIREs Comput. Mol. Sci. 2013, 3, 317–326. [Google Scholar]
  56. Woodcock, H.L.; Hodošček, M.; Gilbert, A.T.B.; Gill, P.M.W.; Schaefer, H.F.; Brooks, B.R. Interfacing Q-Chem and CHARMM to perform QM/MM reaction path calculations. J. Comput. Chem. 2007, 28, 1485–1502. [Google Scholar]
  57. Adamo, C.; Scuseria, G.E.; Barone, V. Accurate excitation energies from time-dependent density functional theory: Assessing the PBE0 model. J. Chem. Phys. 1999, 111, 2889–2899. [Google Scholar]
  58. Henderson, T.M.; Janesko, B.G.; Scuseria, G.E. Generalized gradient approximation model exchange holes for range-separated hybrids. J. Chem. Phys. 2008, 128, 194105. [Google Scholar]
  59. Liu, J.; Liang, W. Analytical second derivatives of excited-state energy within the time-dependent density functional theory coupled with a conductor-like polarizable continuum model. J. Chem. Phys. 2013, 138, 024101. [Google Scholar]
  60. Jorgensen, W.L.; Chandrasekhar, J.; Madura, D.; Impey, R.W.; Klein, M.L. Comparison of simple potential functions for simulating liquid water. J. Chem. Phys. 1983, 79, 926–935. [Google Scholar]
  61. Zoete, V.; Cuendet, M.A.; Grosdidier, A.; Michielin, O. SwissParam, a fast force field generation tool for small organic molecules. J. Comput. Chem. 2011, 32, 2359–2368. [Google Scholar]
  62. Jo, S.; Kim, T.; Im, W. Automated builder and database of protein/membrane complexes for molecular dynamics simulations. PLoS One 2007, 2, e880. [Google Scholar]
  63. Jo, S.; Lim, J.B.; Klauda, J.B.; Im, W. CHARMM-GUI membrane builder for mixed bilayers and its application to yeast membranes. Biophys. J. 2009, 97, 50–58. [Google Scholar]
  64. Klauda, J.B.; Venable, R.M.; Freites, J.A.; O’Connor, J.W.; Tobias, D.J.; Mondragon-Ramirez, C.; Vorobyov, I.; MacKerell, A.D., Jr.; Pastor, R.W. Update of the CHARMM all-atom additive force field for lipids: Validation on six lipid types. J. Phys. Chem. B 2010, 114, 7830–7843. [Google Scholar]
  • Sample Availability: Samples of the compounds are not available from the authors.

