Guest-Host Complex Formed between Ascorbic Acid and β-Cyclodextrin Immobilized on the Surface of an Electrode


 and
and
Abstract
:
1. Introduction
2. Results and Discussion
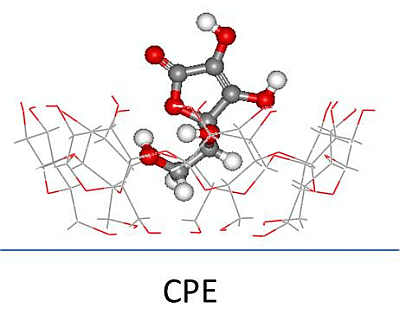
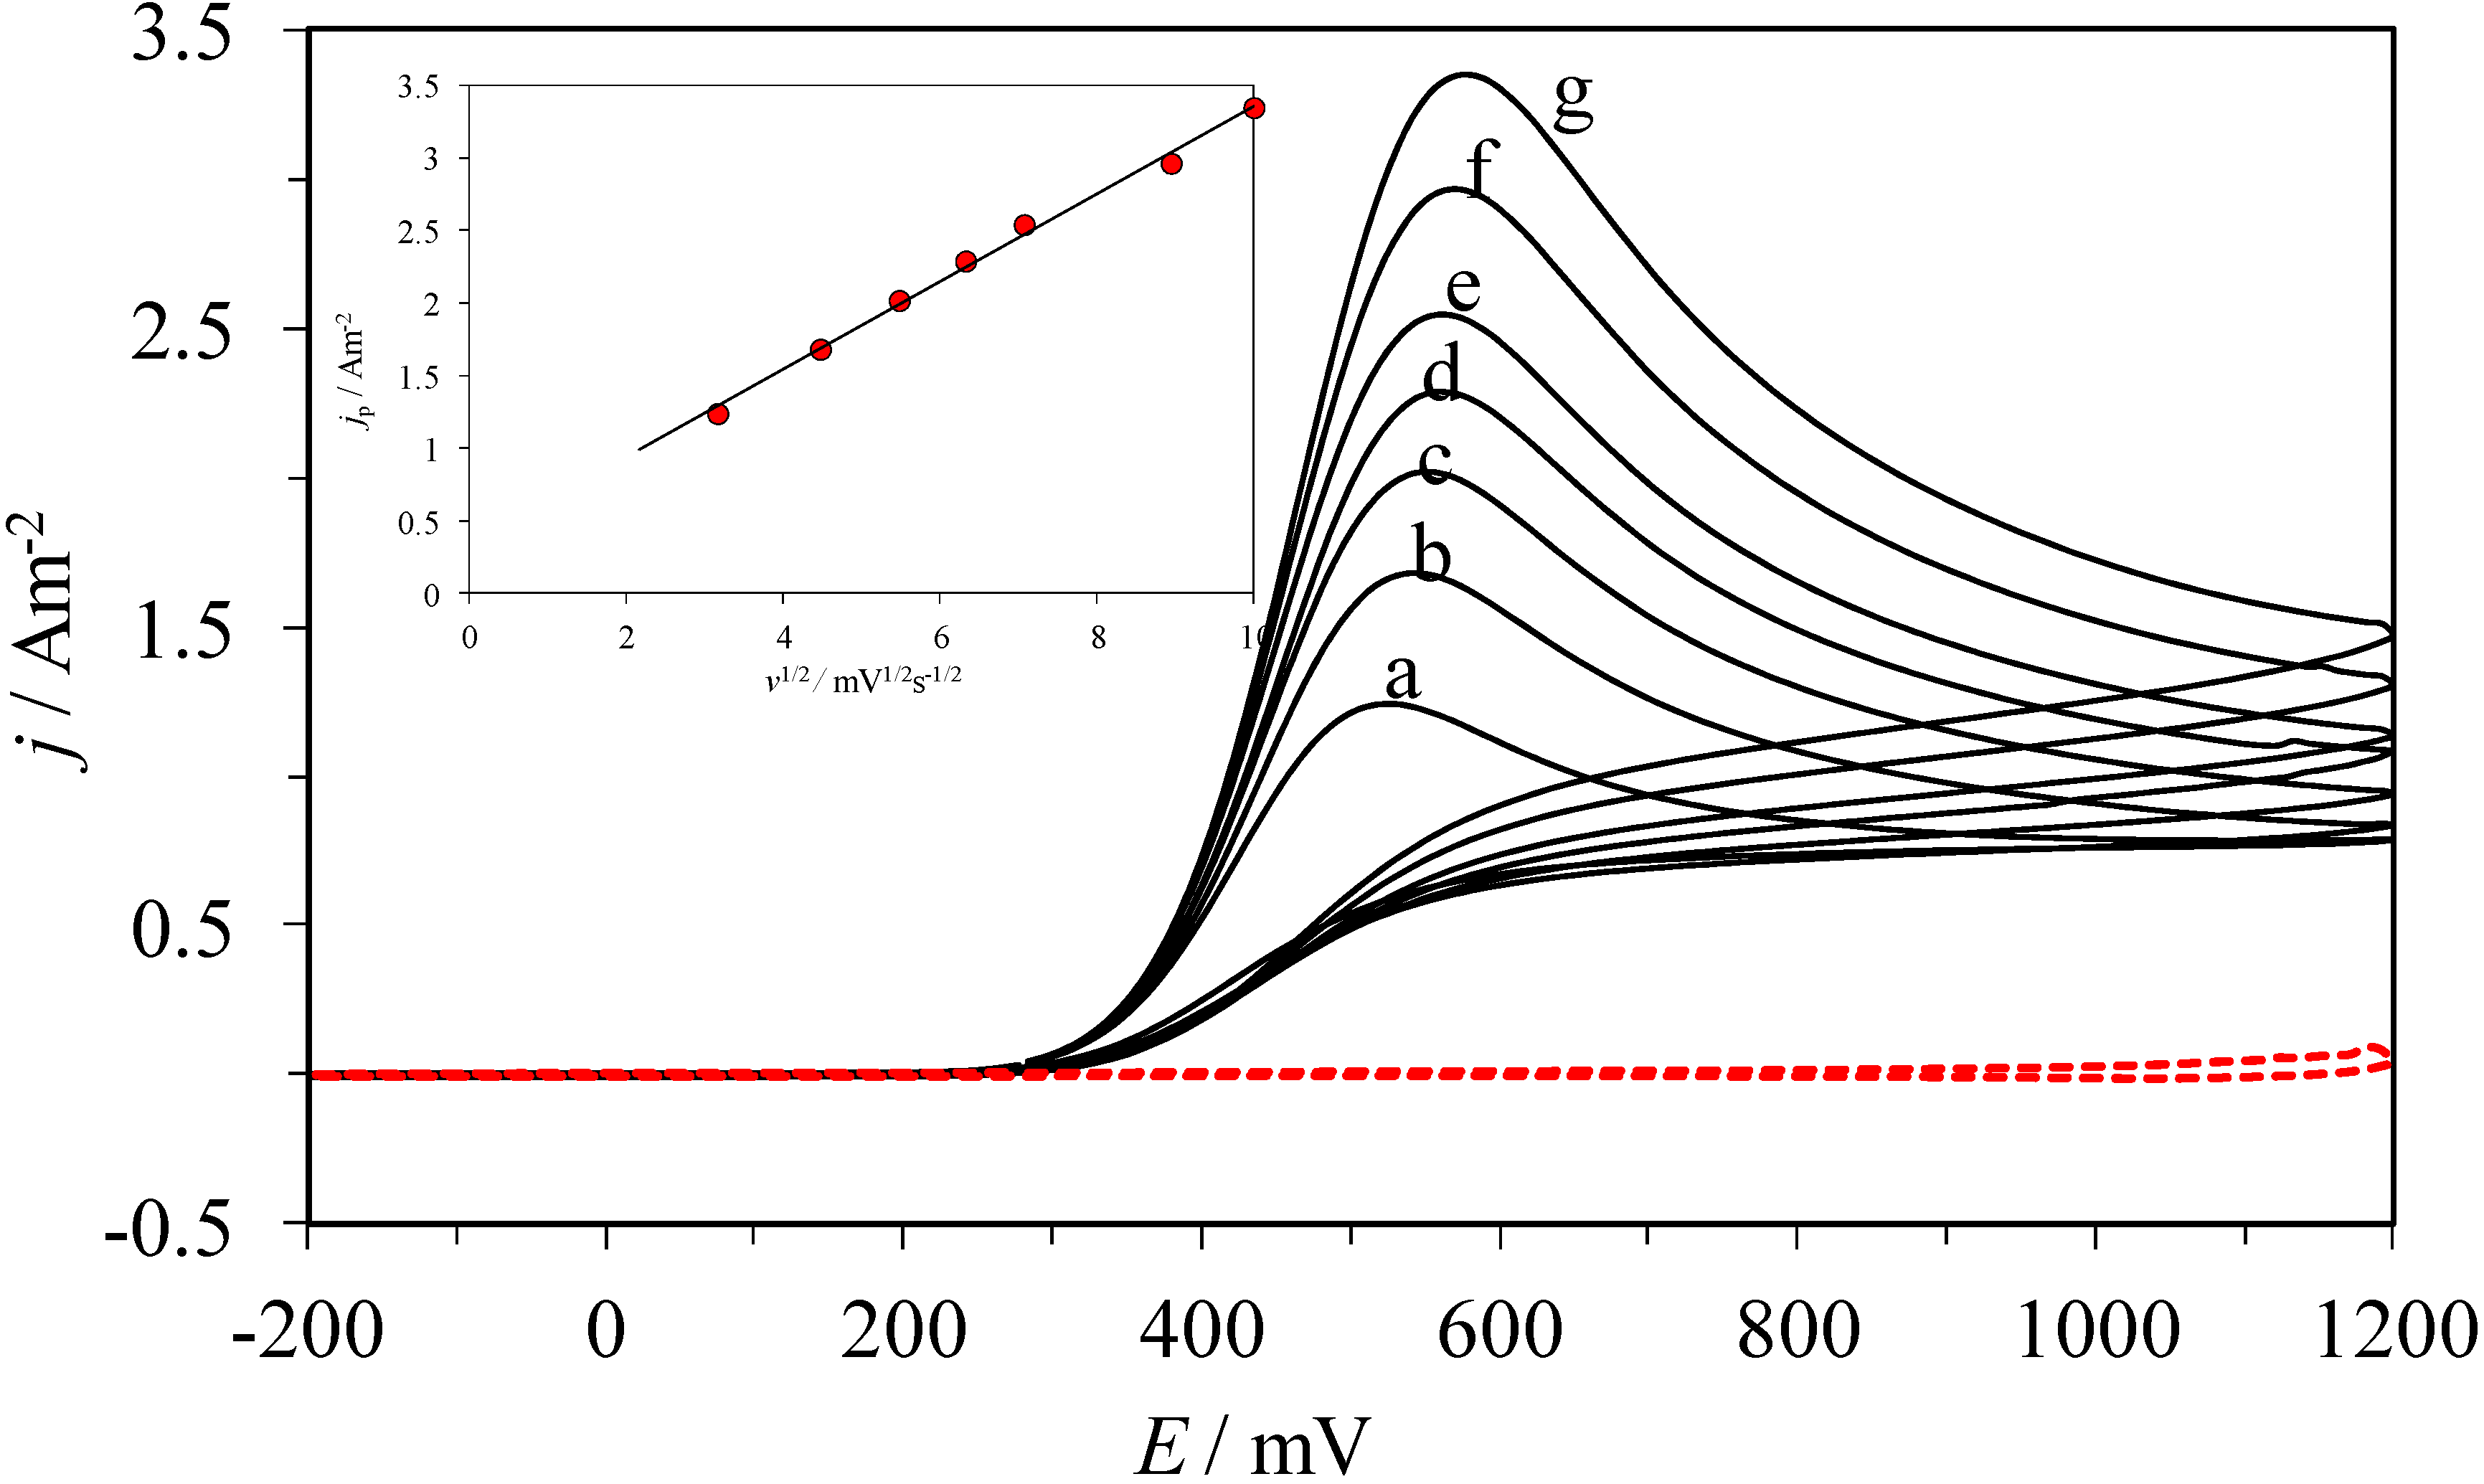
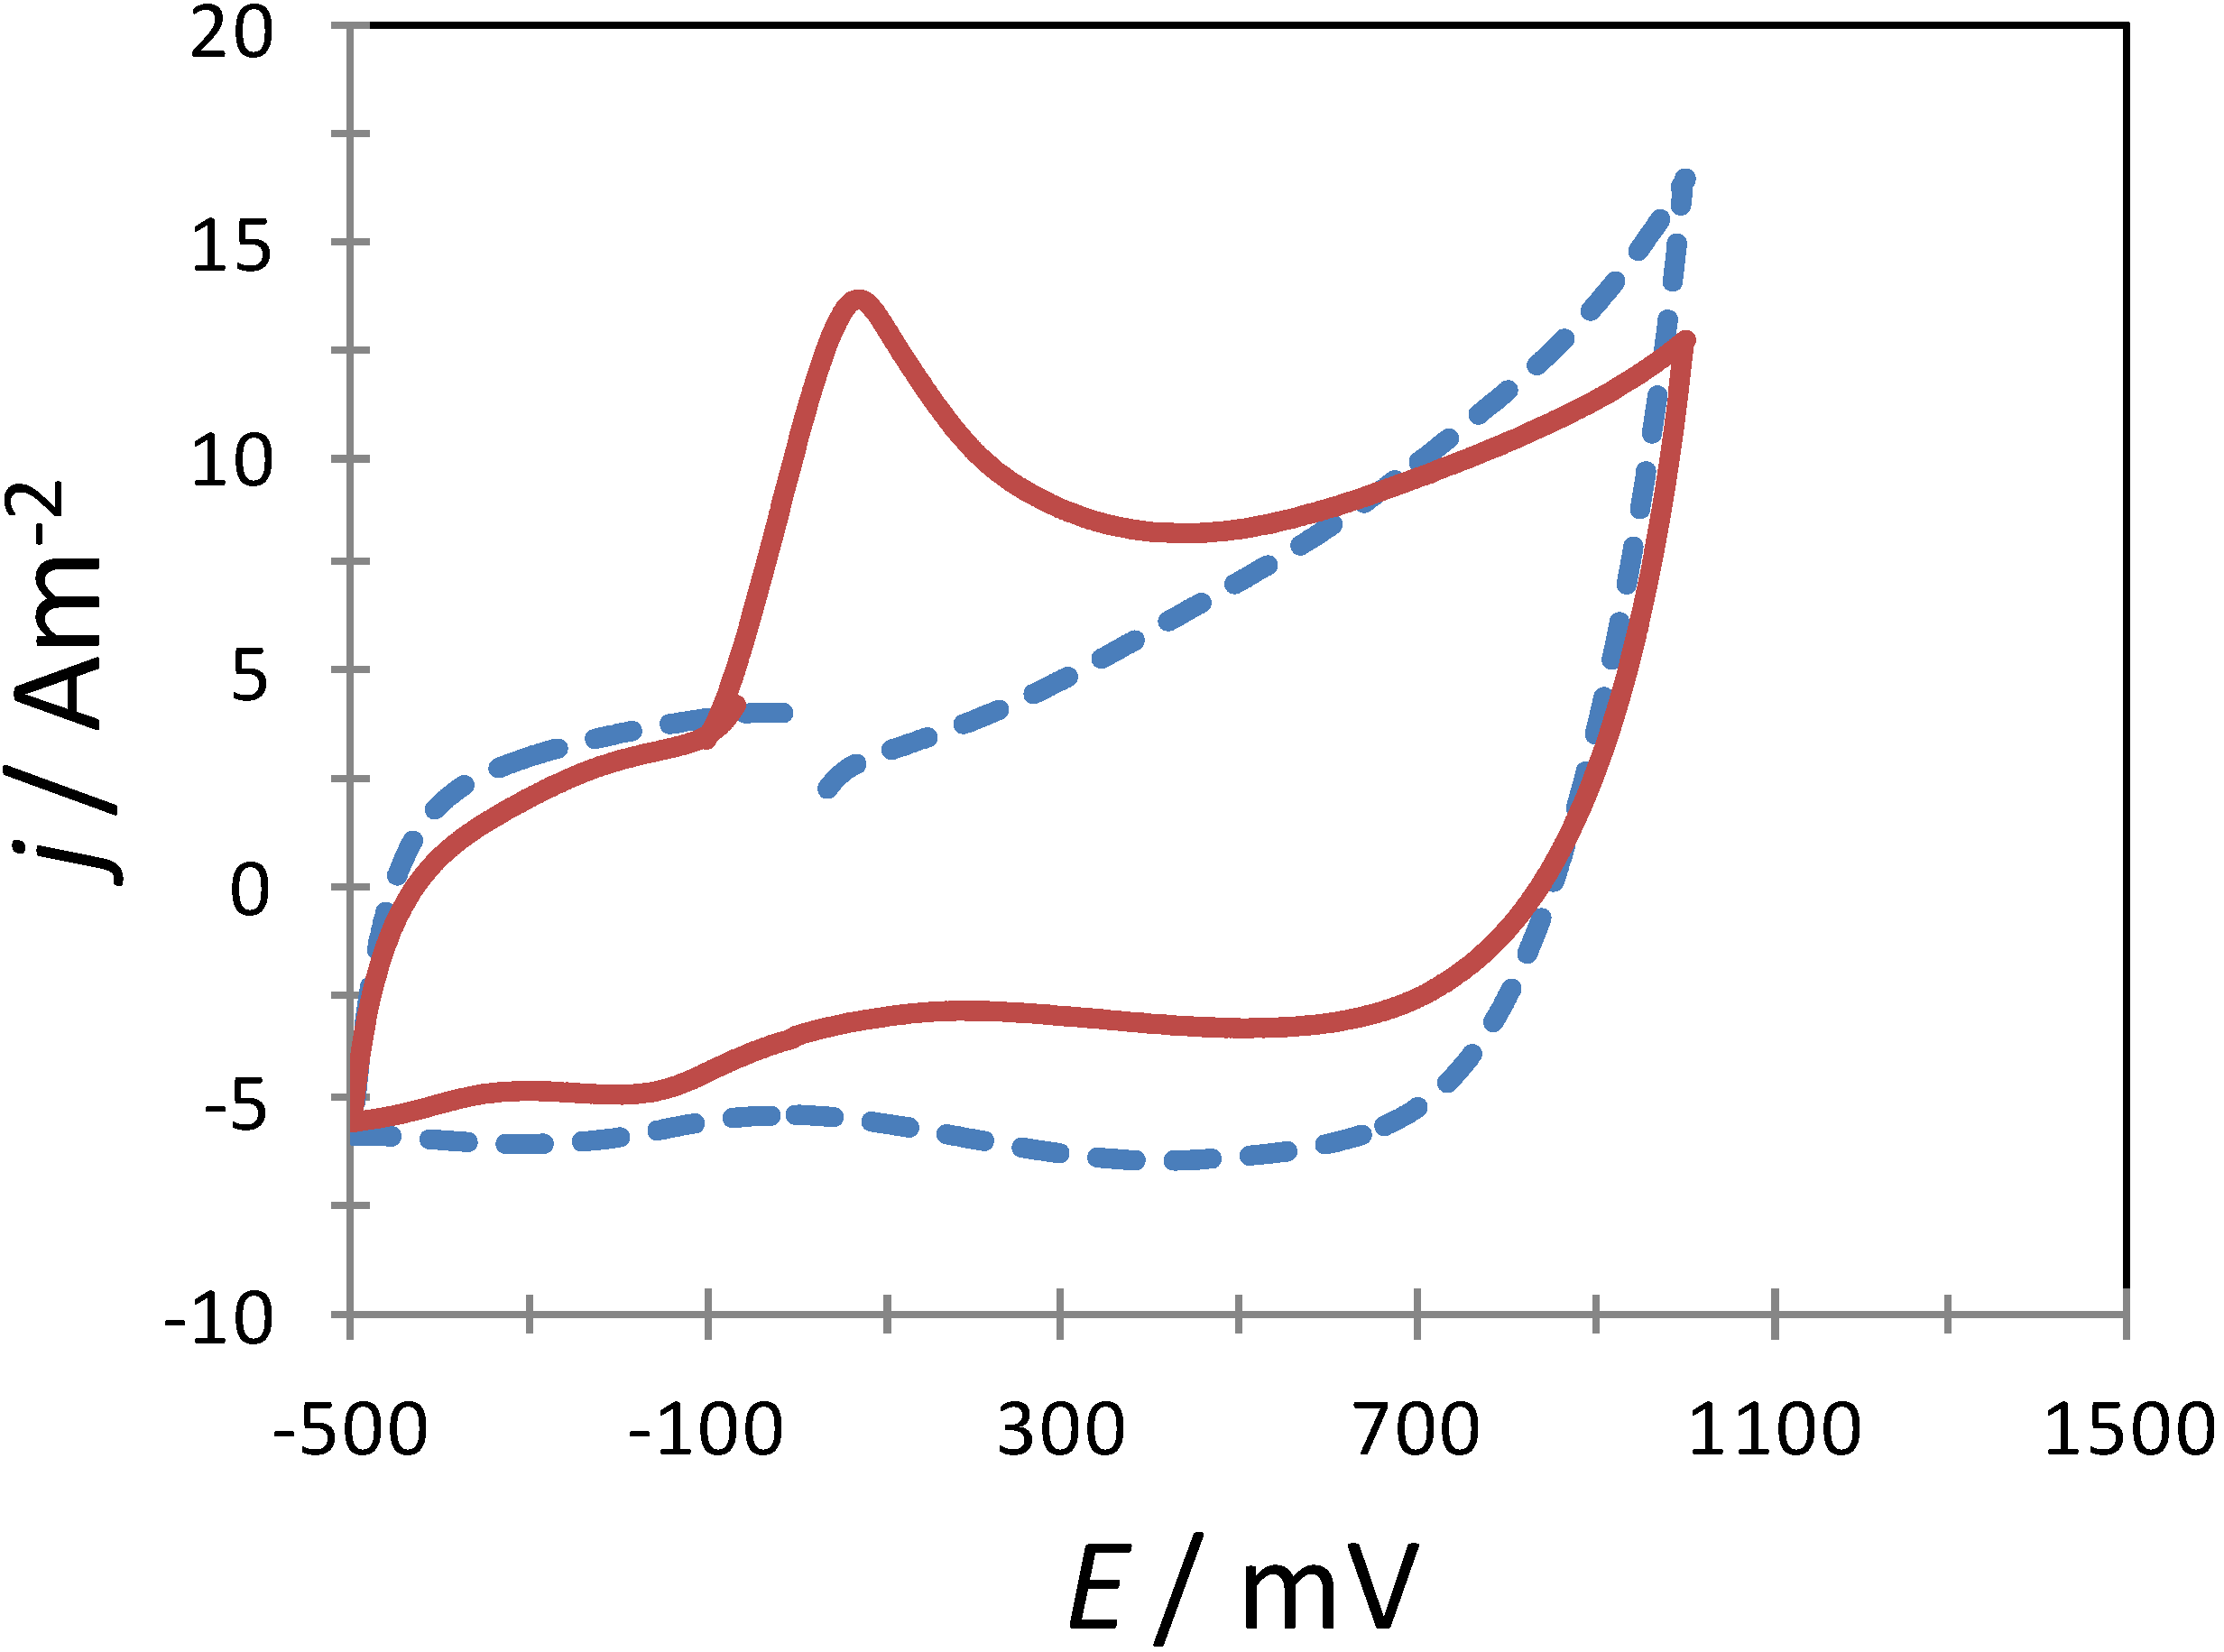
2.1. Electrochemical Behavior of AA over a CPE
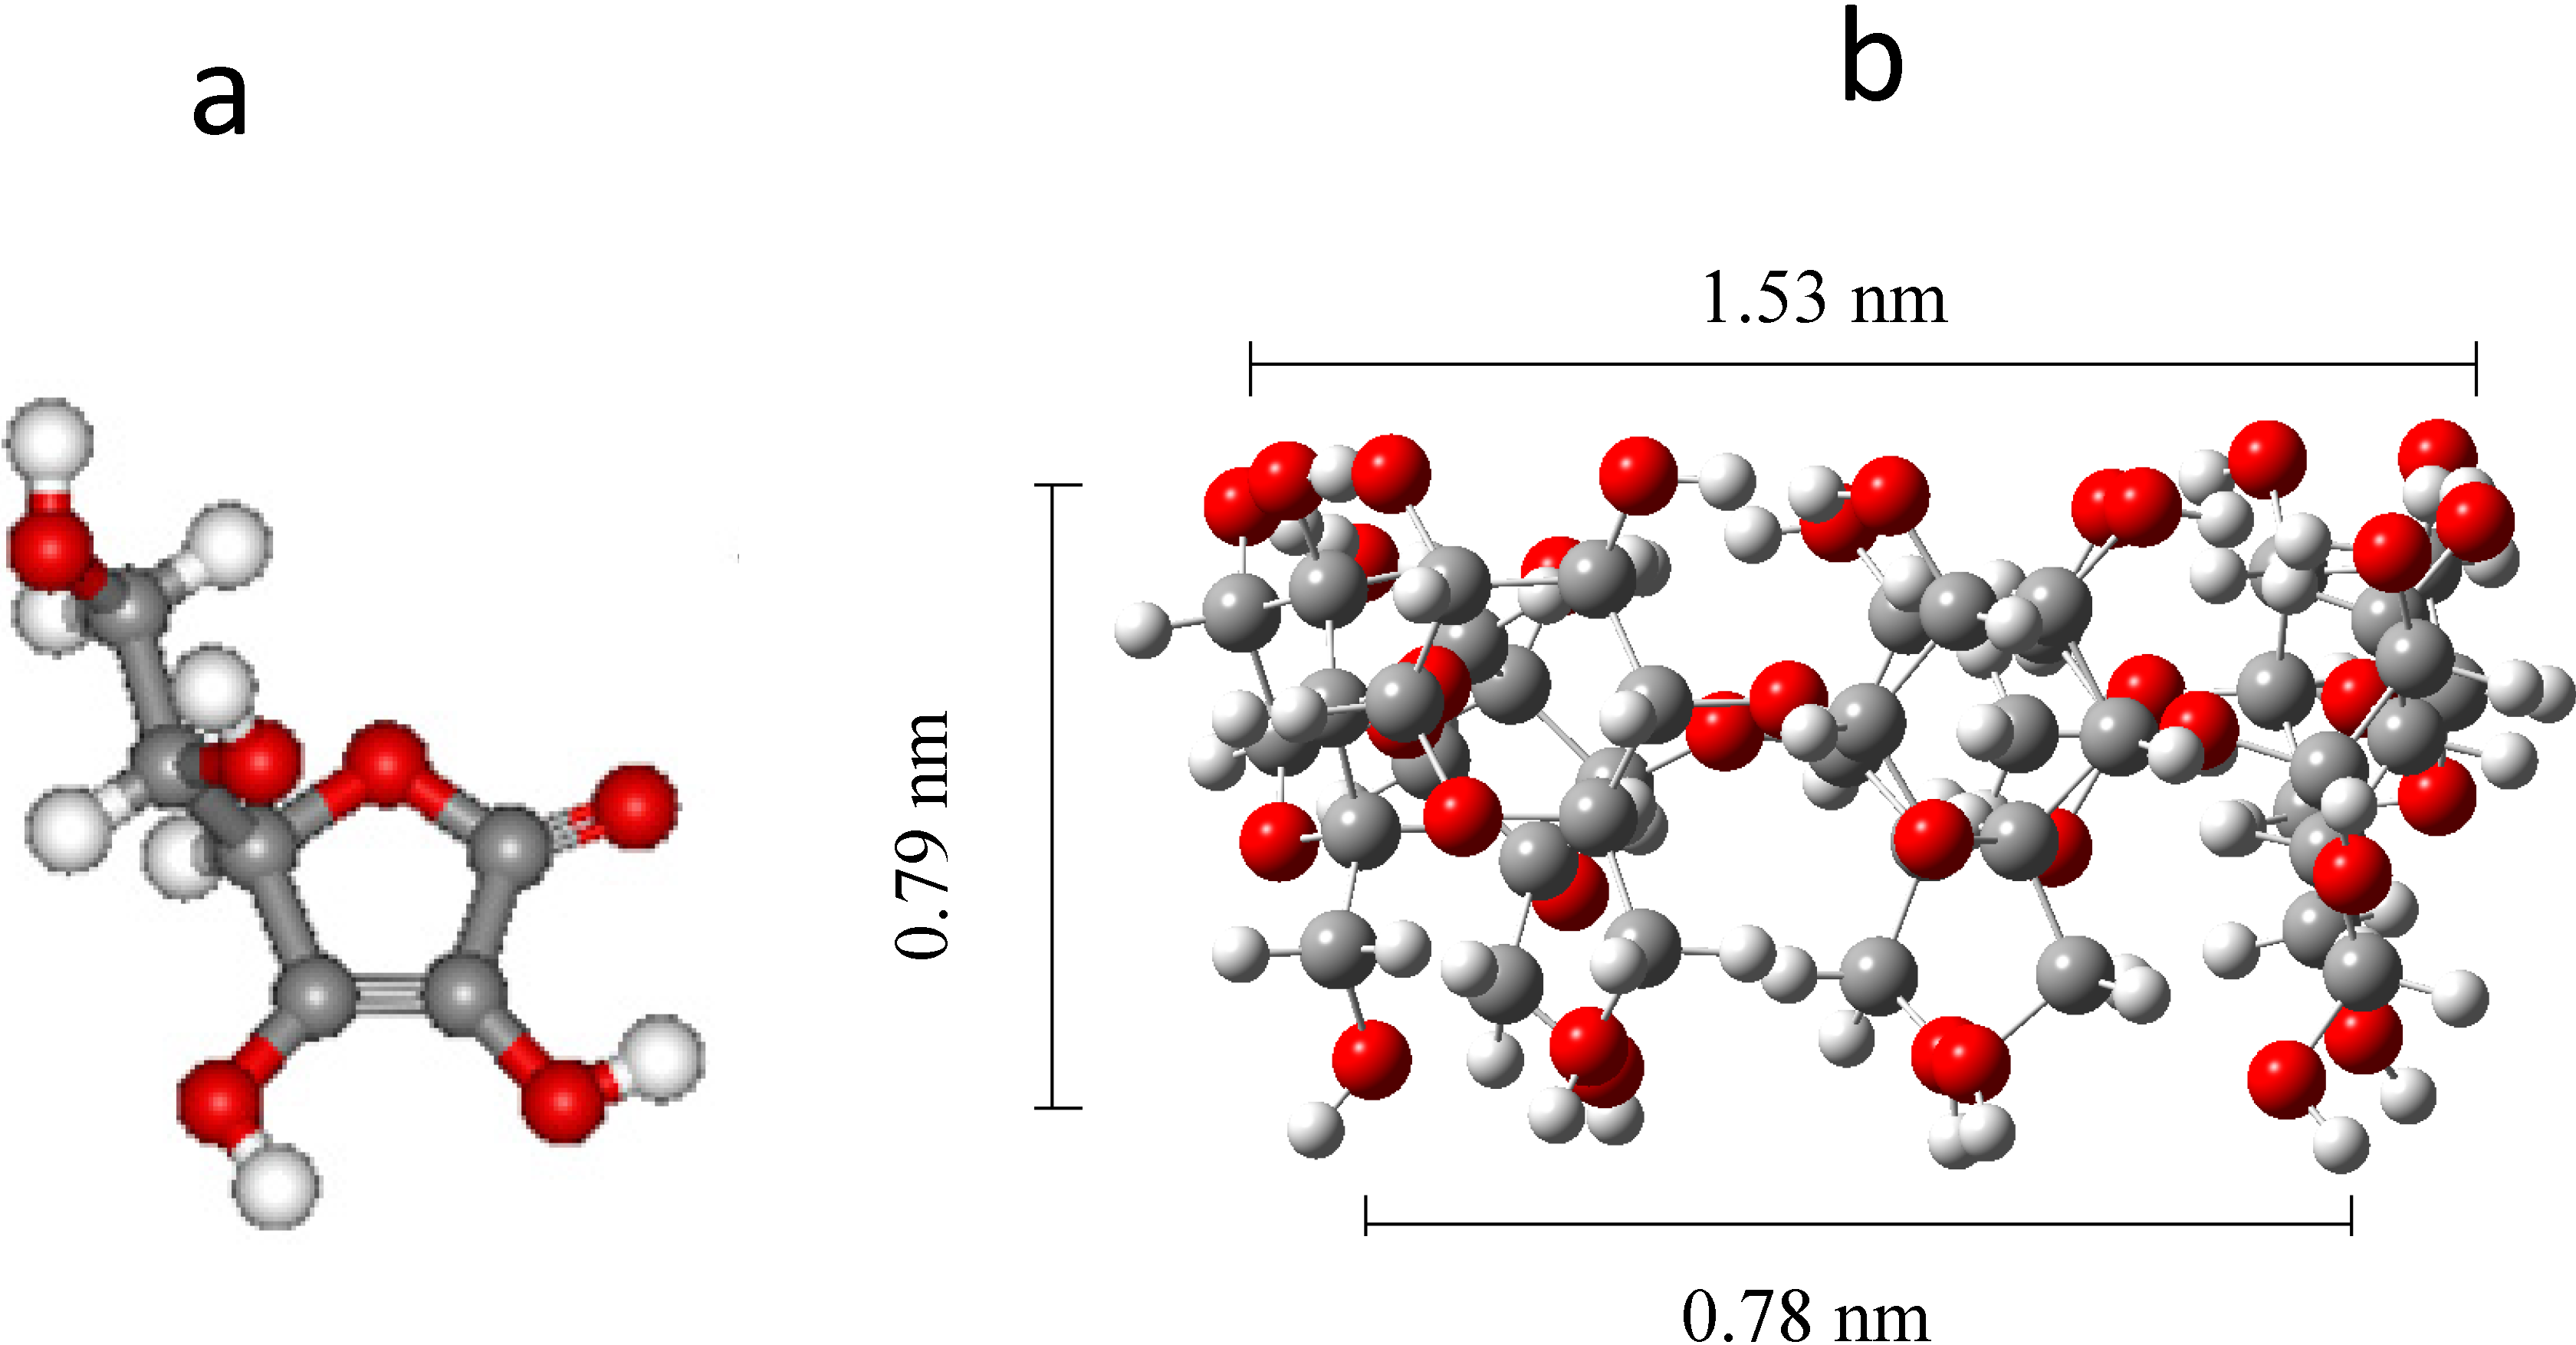
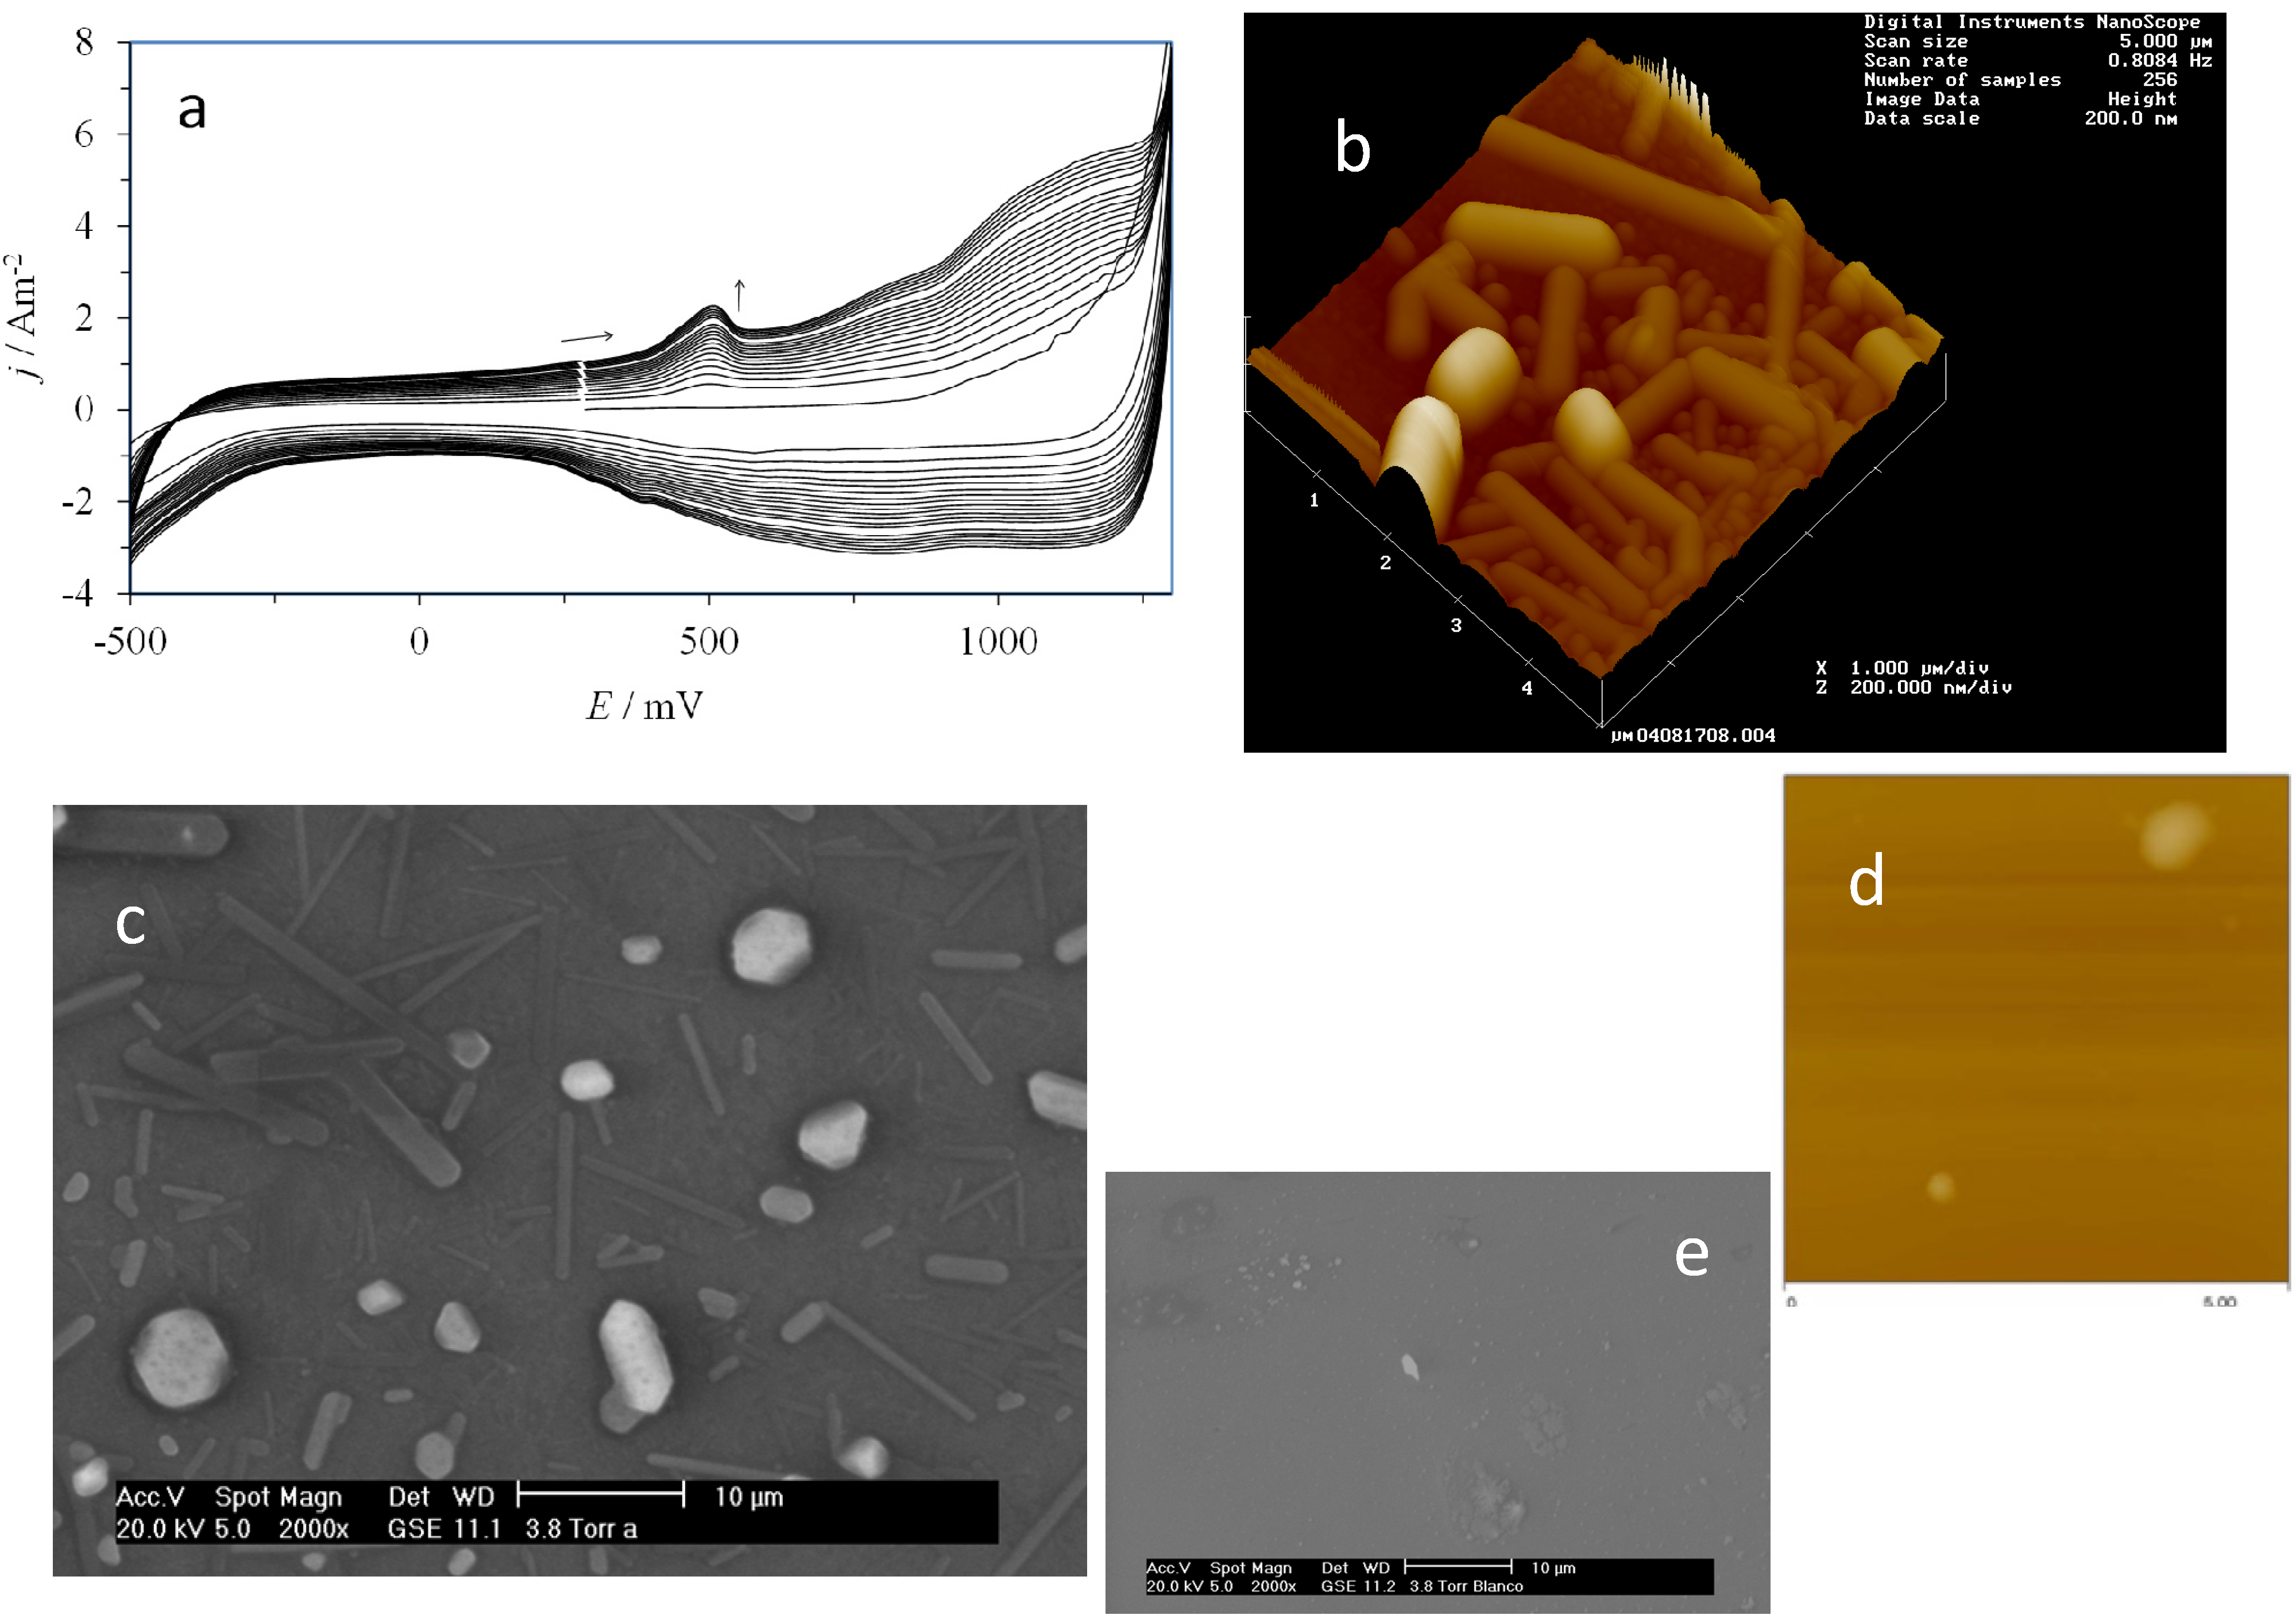
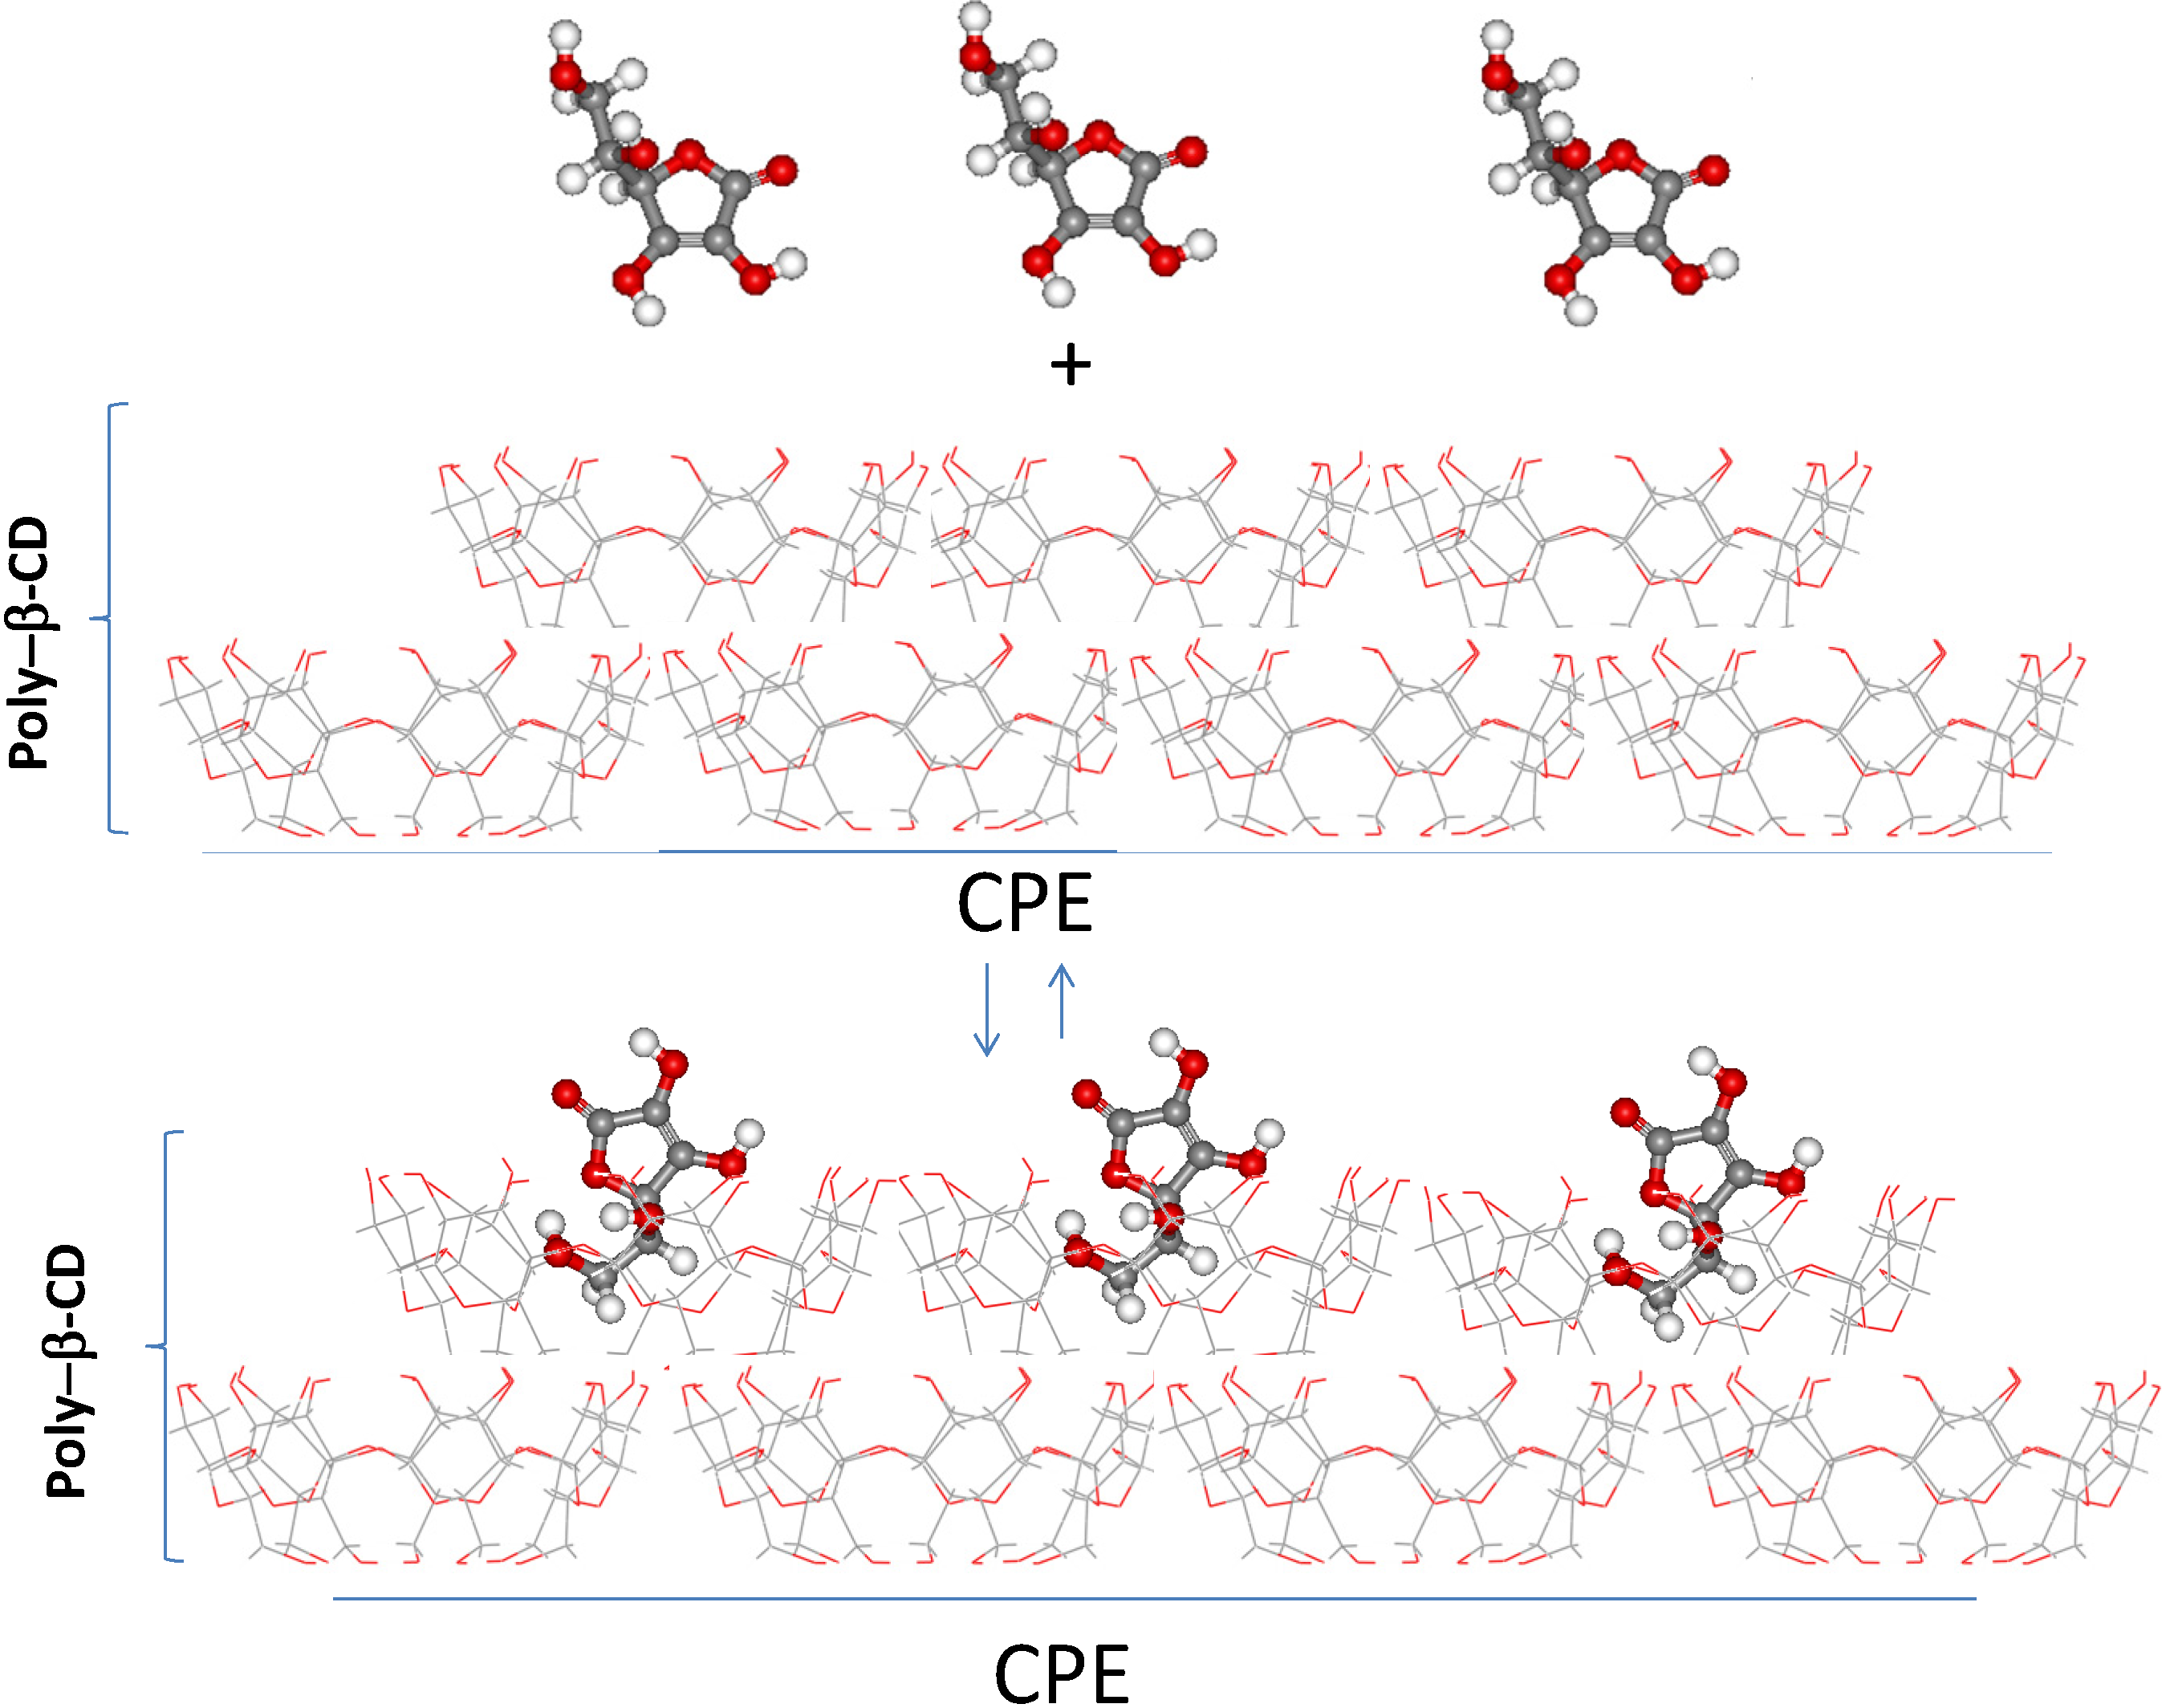
2.2. Synthesis of the β-CD Polymer, Poly-β-CD

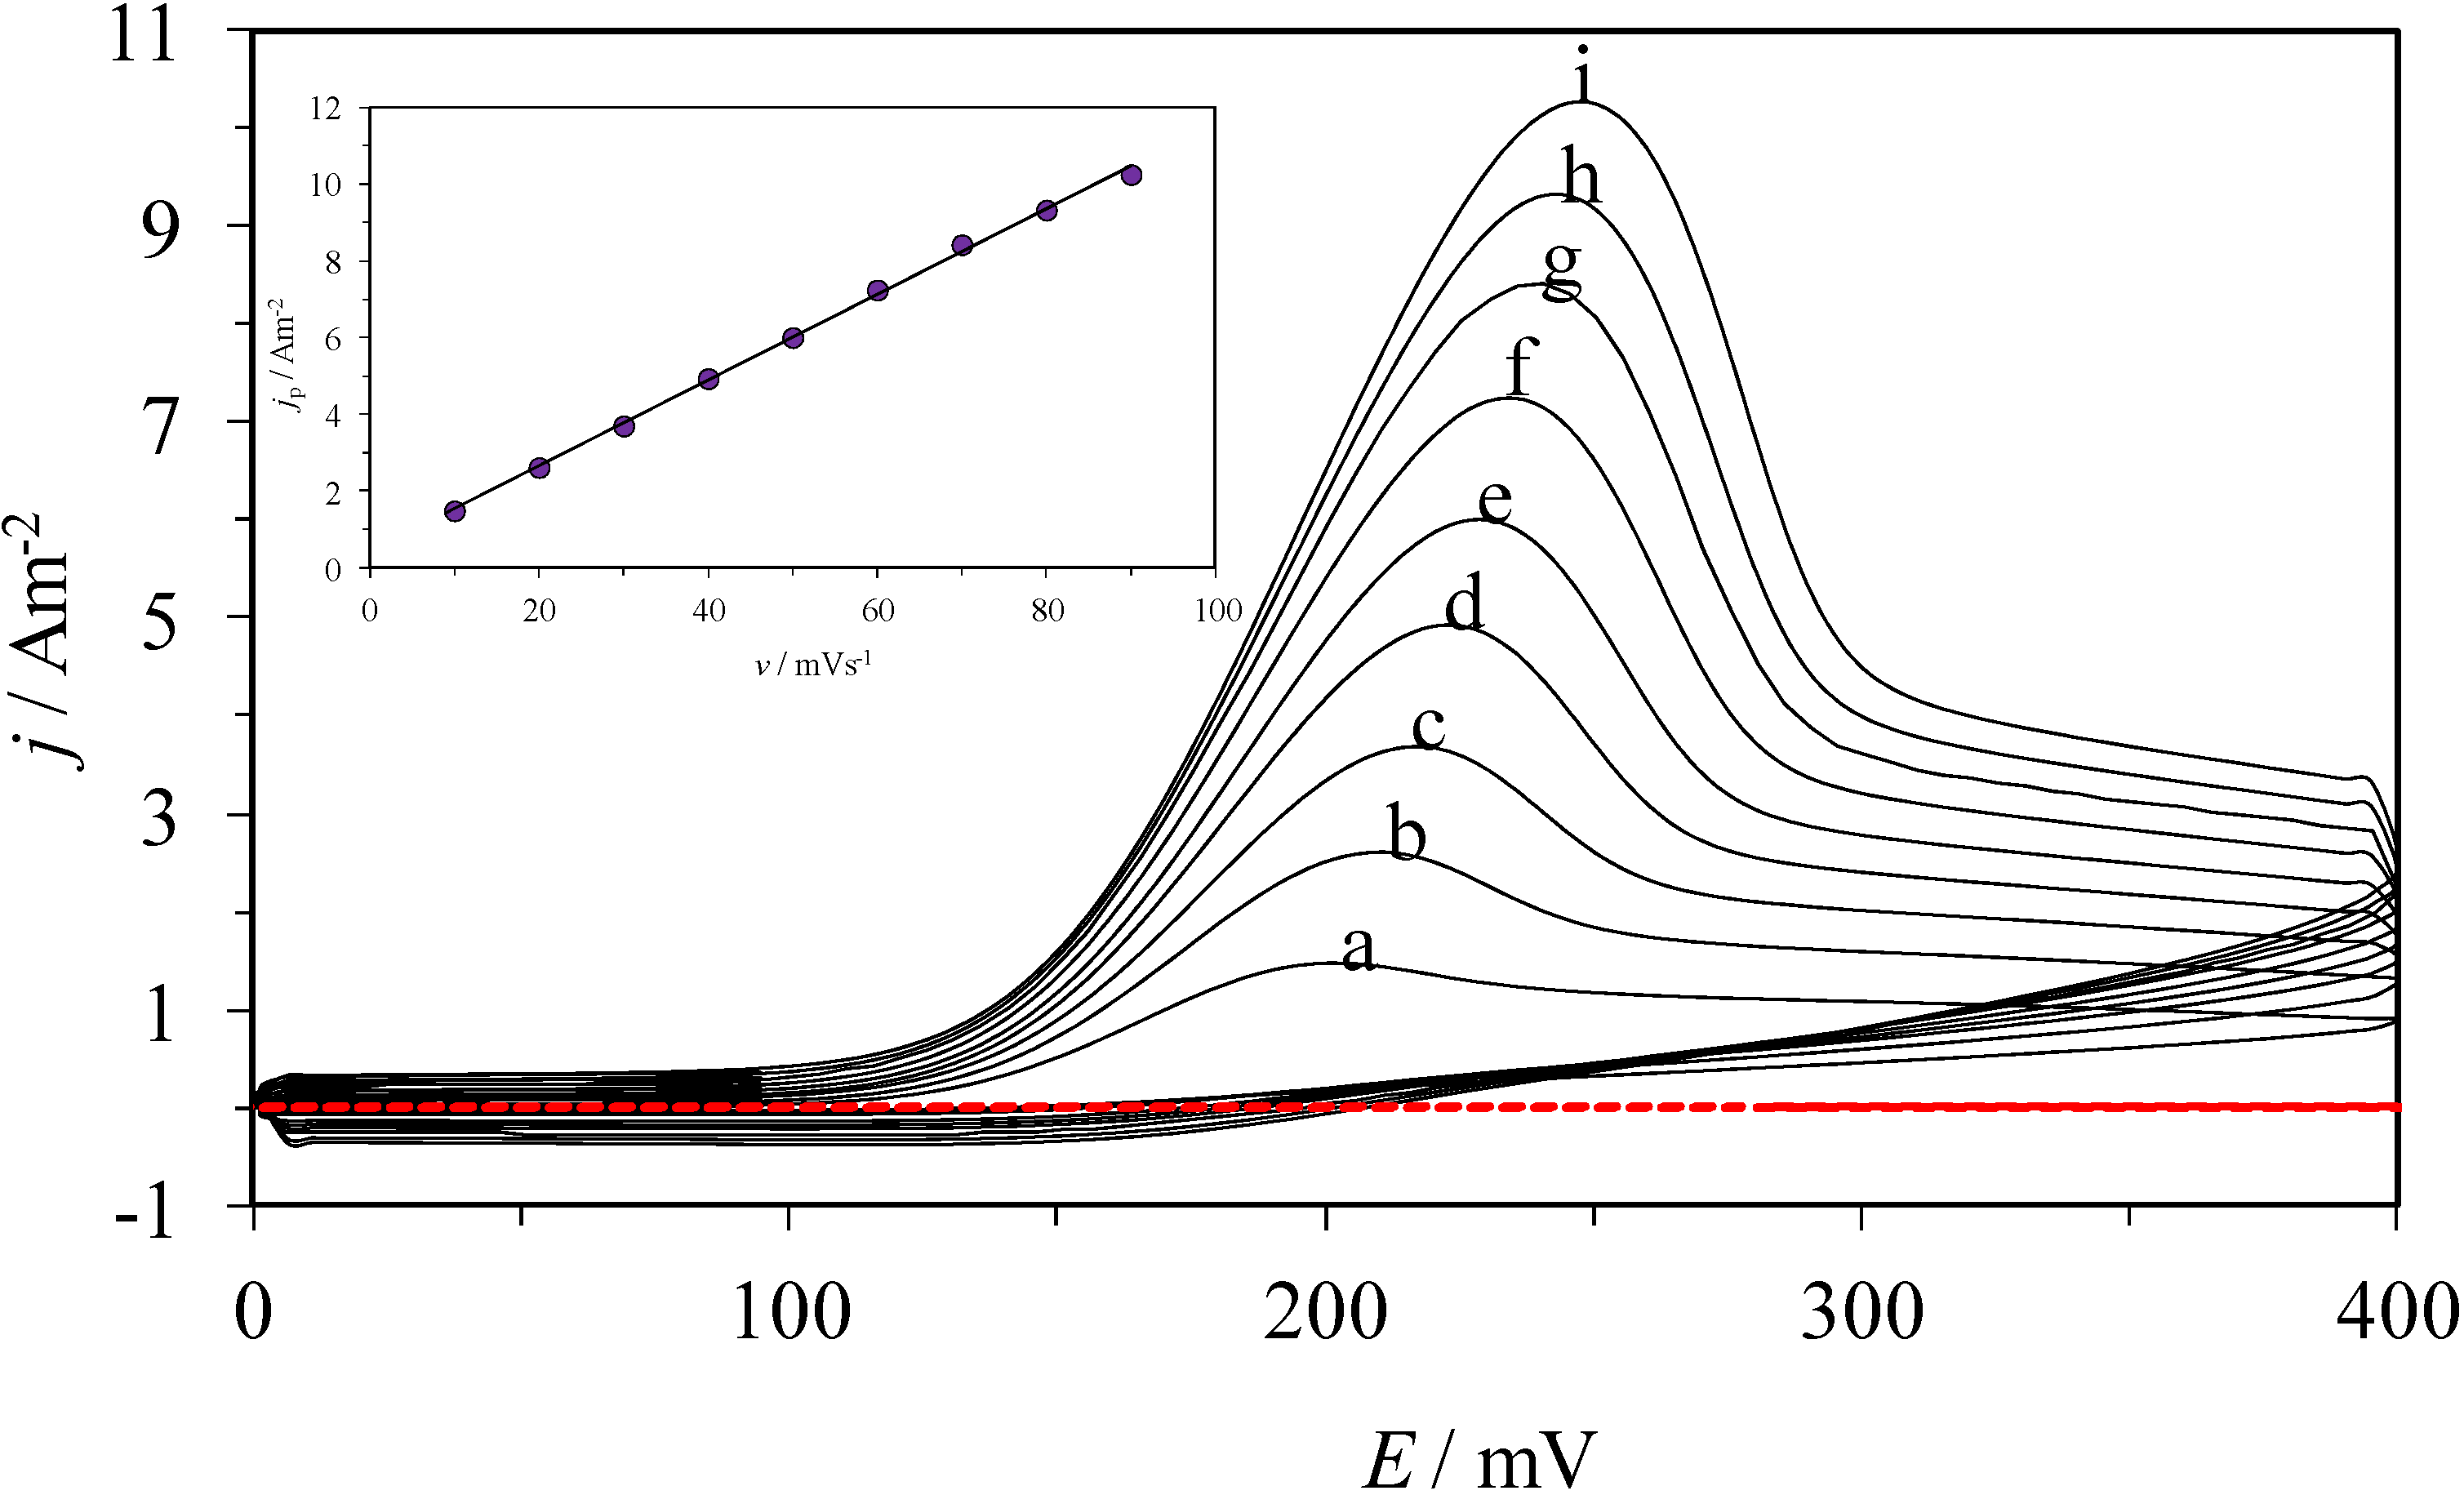
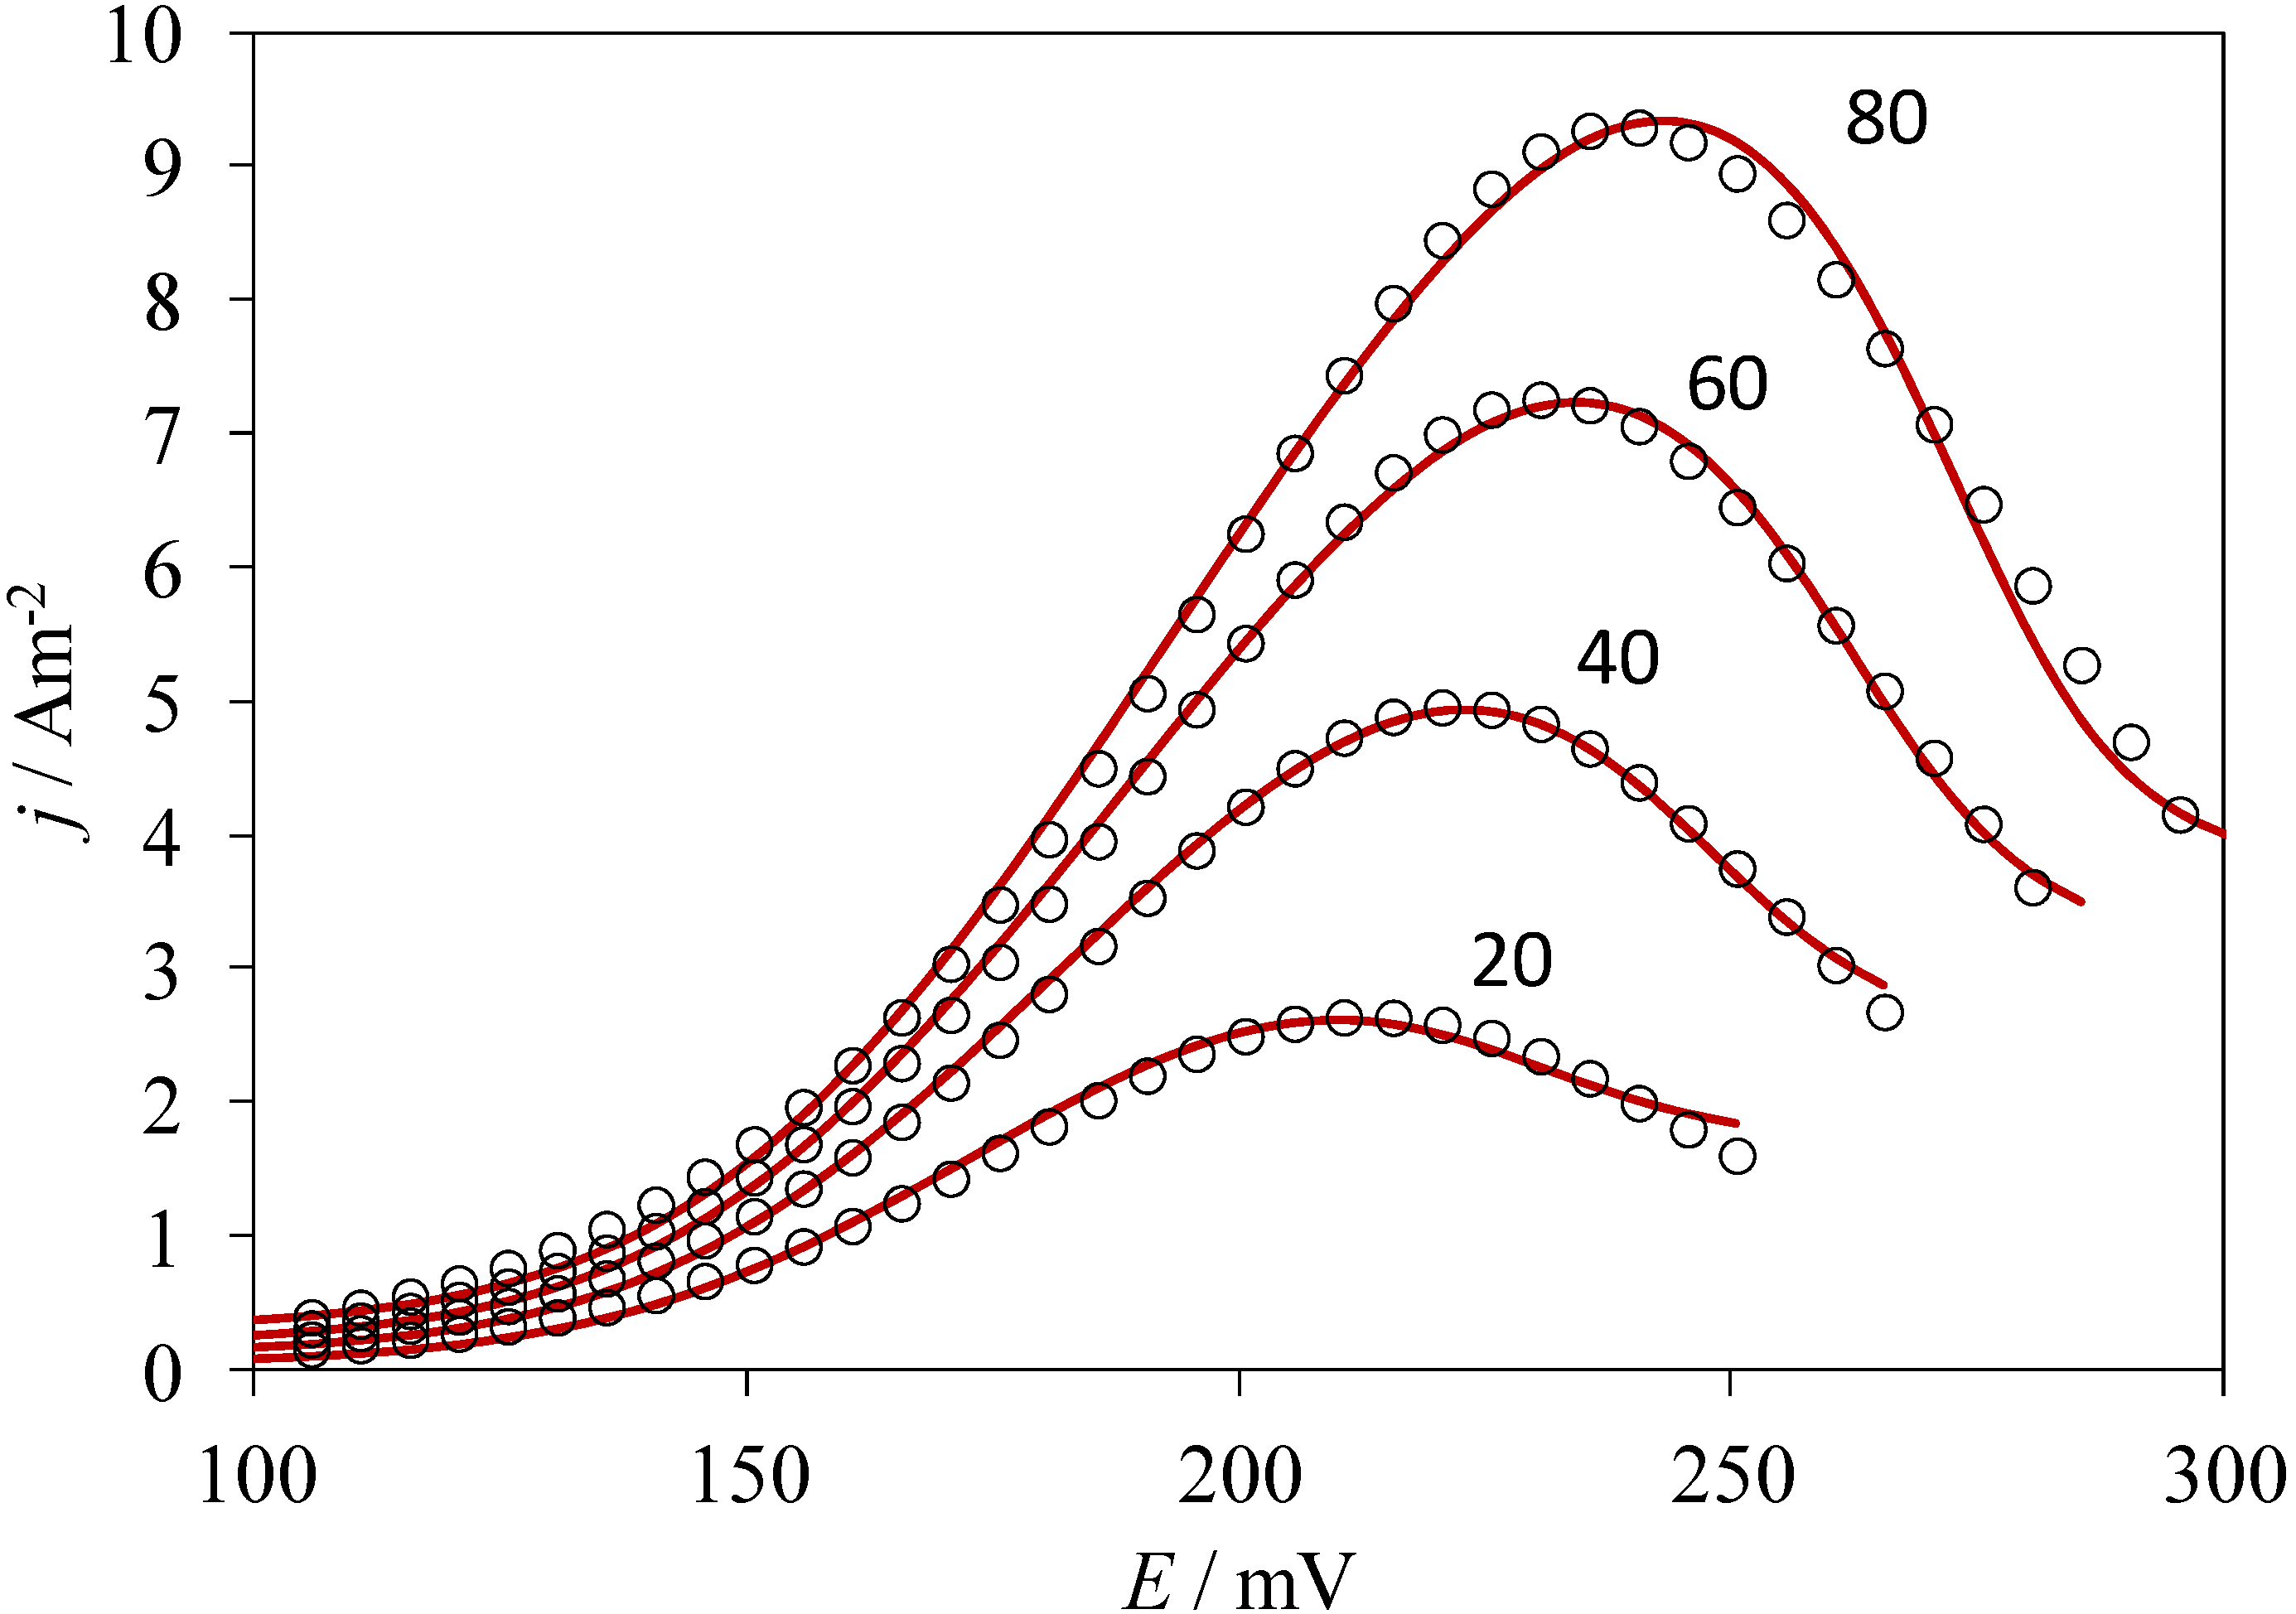
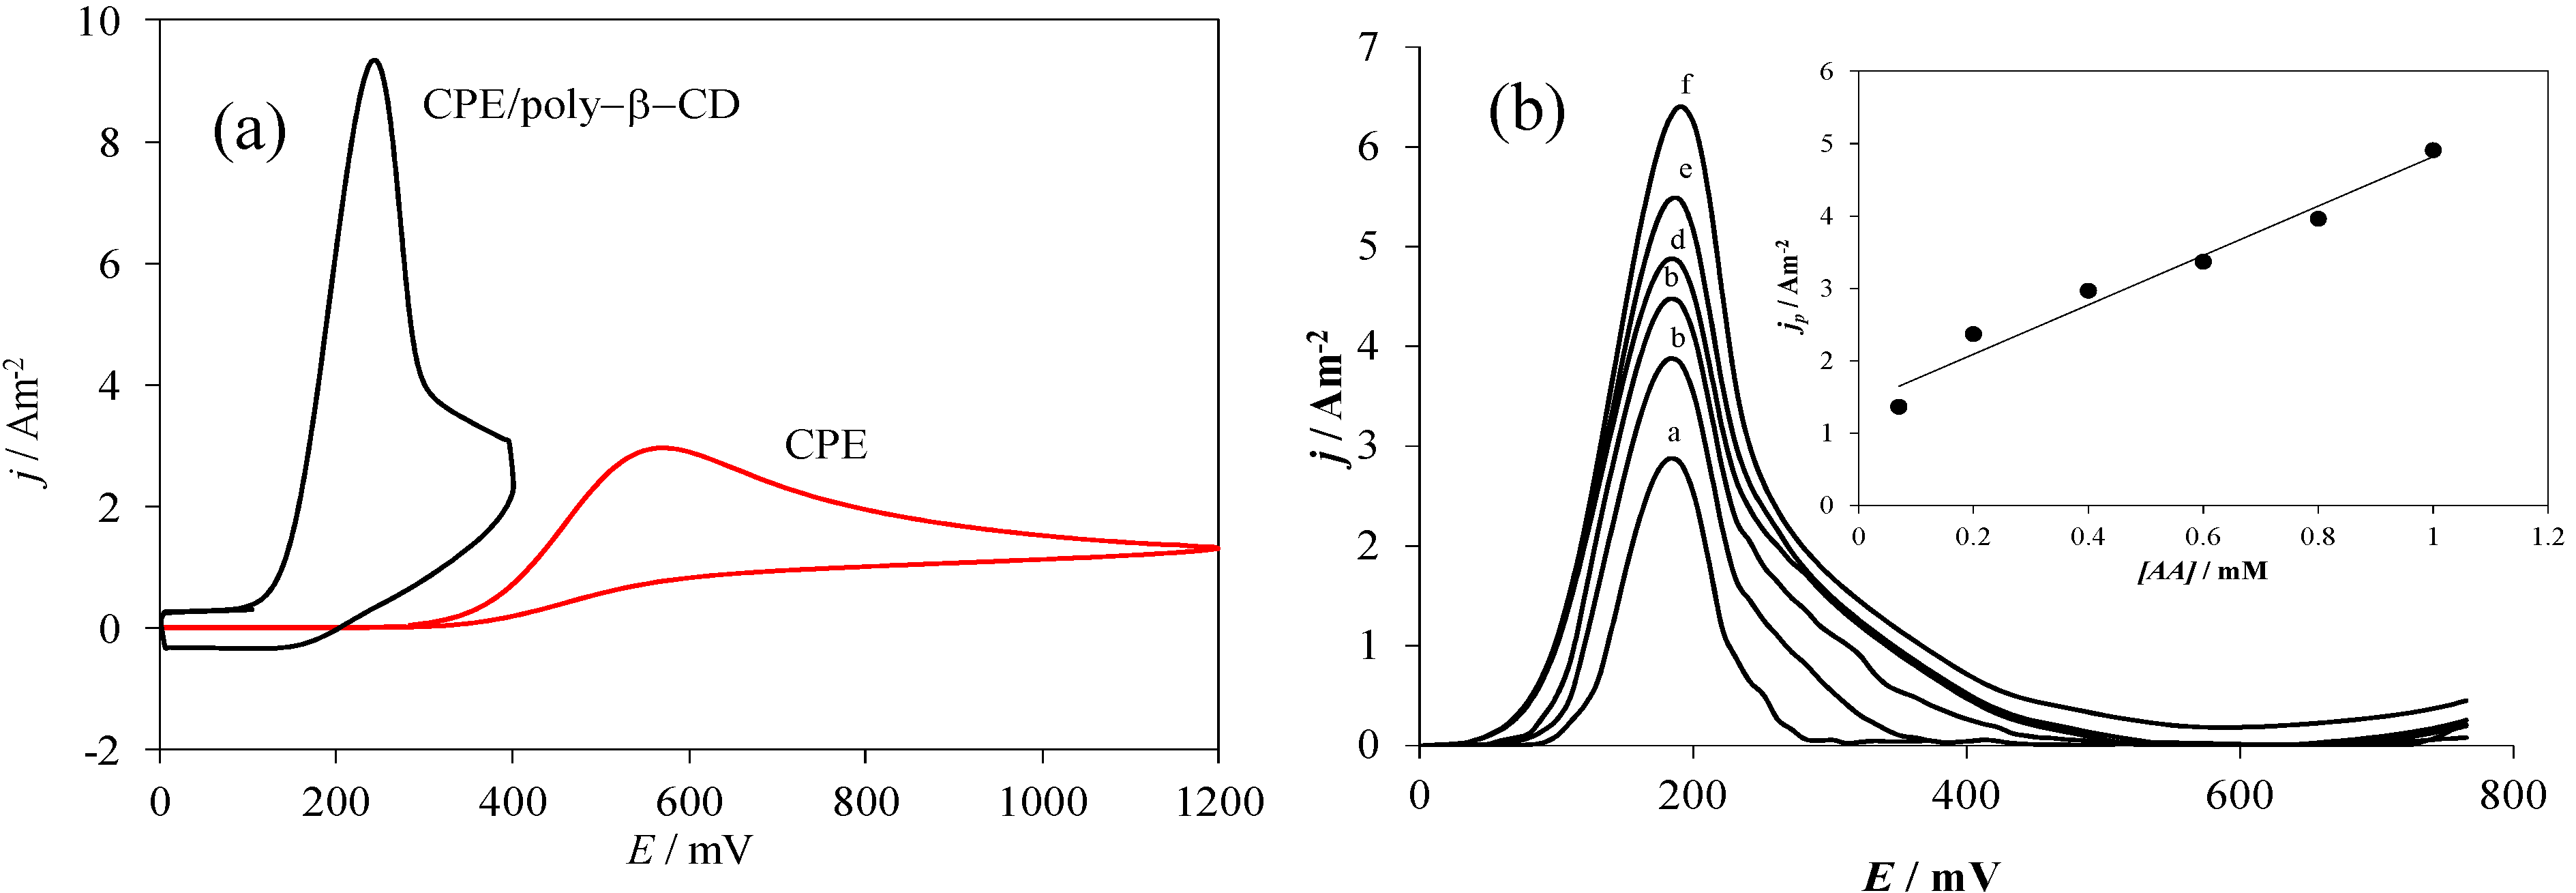
2.3. Electrochemical Behavior of AA over a CPE/Poly-β-CD Electrode


| Electrode | Ep/mV | jp/Am−2 | ∆Ep = Ep,b − Ep,m/mV | jp,m/jp,b |
|---|---|---|---|---|
| CPE | 564 | 2.96 | 0 | 1 |
| CPE/poly-β-CD | 240 | 9.19 | 324 | 3.14 |
3. Experimental
3.1. Reagents and Chemicals
3.2. Instrumentation
3.3. CPE Modified with Poly-β-CD
4. Conclusions
Supplementary Materials
Acknowledgements
Author Contributions
Conflicts of Interest
References
- Shaidarova, L.G.; Gedmina, A.V.; Chelnokova, I.A.; Budnikov, G.K. Electrocatalytic oxidation and flow-injection determination of ascorbic acid at a graphite electrode modified with a polyaniline film containing electrodeposited palladium. J. Anal. Chem. 2006, 61, 601–608. [Google Scholar] [CrossRef]
- Alarcón-Ángeles, G.; Corona-Avendaño, S.; Palomar-Pardavé, M.; Rojas-Hernández, A.; Romero-Romo, M.; Ramírez-Silva, M.T. Selective electrochemical determination of dopamine in the presence of ascorbic acid using sodium dodecyl sulfate micelles as masking agent. Electrochim. Acta 2008, 53, 3013–3020. [Google Scholar] [CrossRef]
- Corona-Avendaño, S.; Alarcón-Angeles, G.; Romero-Romo, M.; Cuán, A.; Ramírez-Silva, M.T.; Hernández-Martínez, L.; Palomar-Pardavé, M. Influence of CTAB on the electrochemical behavior of dopamine and on its analytic determination in the presence of ascorbic acid. J. Appl. Electrochem. 2010, 40, 463–474. [Google Scholar] [CrossRef]
- Corona-Avendaño, S.; Alarcón-Angeles, G.; Romero-Romo, M.; Merkoçi, A.; Rojas-Hernández, A.; Ramírez-Silva, M.T.; Palomar-Pardavé, M. Supramolecular systems construction for the selective quantitative determination of dopamine in the presence of ascorbic acid. Electrochem. Soc. Trans. 2011, 36, 385–392. [Google Scholar]
- Alarcón-Ángeles, G.; Pérez-López, B.; Palomar-Pardavé, M.; Ramírez-Silva, M.T.; Alegret, S.; Merkoçi, A. Enhanced host–guest electrochemical recognition of dopamine using cyclodextrin in the presence of carbon nanotubes. Carbon 2008, 46, 898–906. [Google Scholar] [CrossRef]
- Colín-Orozco, E.; Ramírez-Silva, M.T.; Corona-Avendaño, S.; Romero-Romo, M.; Palomar-Pardavé, M. Electrochemical quantification of dopamine in the presence of ascorbic acid and uric acid using a simple carbon paste electrode modified with SDS micelles at pH 7. Electrochim. Acta 2012, 85, 307–313. [Google Scholar] [CrossRef]
- Fragoso, A.; Almirall, E.; Cao, R.; Echegoyen, L.; González-Jonte, R. A supramolecular approach to the selective detection of dopamine in the presence of ascorbate. Chem. Commun. 2004, 19, 2230–2231. [Google Scholar]
- Wang, C.; Yuan, R.; Chai, Y.; Chen, S.; Zhang, Y.; Hu, F.; Zhang, M. Non-covalent iron(III)-porphyrin functionalized multi-walled carbon nanotubes for the simultaneous determination of ascorbic acid, dopamine, uric acid and nitrite. Electrochim. Acta 2012, 62, 109–115. [Google Scholar] [CrossRef]
- Zhang, L.; Shi, Z.; Lang, Q. Fabrication of poly(orthanilic acid)–multiwalled carbon nanotubes composite film-modified glassy carbon electrode and its use for the simultaneous determination of uric acid and dopamine in the presence of ascorbic acid. J. Solid State Electrochem. 2011, 15, 801–809. [Google Scholar] [CrossRef]
- Yang, S.; Li, G.; Yang, R.; Xia, M.; Qu, L. Simultaneous voltammetric detection of dopamine and uric acid in the presence of high concentration of ascorbic acid using multi-walled carbon nanotubes with methylene blue composite film-modified electrode. J. Solid State Electrochem. 2011, 15, 1909–1918. [Google Scholar] [CrossRef]
- Kalimuthu, P.; John, S.A. Electropolymerized film of functionalized thiadiazole on glassy carbon electrode for the simultaneous determination of ascorbic acid, dopamine and uric acid. Bioelectrochemistry 2009, 77, 13–18. [Google Scholar] [CrossRef]
- Ensafi, A.A.; Taei, M.; Khayamian, T.; Arabzadeh, A. Highly selective determination of ascorbic acid, dopamine, and uric acid by differential pulse voltammetry using poly(sulfonazo III) modified glassy carbon electrode. Sens. Actuators B 2010, 147, 213–221. [Google Scholar] [CrossRef]
- Ensafi, A.A.; Taei, M.; Khayamian, T. A differential pulse voltammetric method for simultaneous determination of ascorbic acid, dopamine, and uric acid using poly(3-(5-chloro-2-hydroxyphenylazo)-4,5-dihydroxynaphthalene-2,7-disulfonic acid) film modified glassy carbon electrode. J. Electroanal. Chem. 2009, 633, 212–220. [Google Scholar] [CrossRef]
- Lehn, J.M. Supramolecular chemistry. Science 1993, 260, 1762–1763. [Google Scholar]
- Lehn, J.M. Supramolecular Chemistry; Wiley-VCH: New York, NY, USA, 1995; pp. 1–29. [Google Scholar]
- Kaifer, A.E.; Gomez-Kaifer, M. Supramolecular Electrochemistry; Wiley-VCH: Weinheim, Germany; New York, NY, USA; Chichester, UK; Brisbane, Australia; Singapore, Singapore; Toronto, ON, Canada, 1999; pp. 89–125. [Google Scholar]
- Wang, J.; Li, M.; Shi, Z.; Li, N.; Gu, Z. Electrocatalytic oxidation of norepinephrine at a glassy carbon electrode modified with single wall carbon nanotubes. Electroanalysis 2002, 14, 225–230. [Google Scholar] [CrossRef]
- Palomar-Pardavé, M.; Alarcón-Angeles, G.; Ramírez-Silva, M.T.; Romero-Romo, M.; Rojas-Hernández, A.; Corona-Avendaño, S. Electrochemical and spectrophotometric determination of the formation constants of the ascorbic acid-β-cyclodextrin and dopamine-β-cyclodextrin inclusion complexes. J. Incl. Phenom. Macrocycl. Chem. 2011, 69, 92–99. [Google Scholar]
- Ikeda, H.; Nakamura, M.; Ise, N.; Oguma, N.; Nakamura, A.; Ikeda, T.; Toda, F.; Ueno, A. Fluorescent cyclodextrins for molecule sensing: Fluorescent properties, NMR characterization, and inclusion phenomena of n-dansylleucine-modified cyclodextrins. J. Am. Chem. Soc. 1996, 118, 10980–10998. [Google Scholar] [CrossRef]
- Roa-Morales, G.; Ramirez-Silva, T.; Galicia, L. Carbon paste electrodes electrochemically modified with cyclodextrins. J. Solid State Electrochem. 2003, 7, 355–360. [Google Scholar]
- Corona-Avendaño, S.; Ramírez-Silva, M.T.; Romero-Romo, M.; Rojas-Hernández, A.; Palomar-Pardavé, M. Influence of the HClO4 concentration on the β-CD electropolimerization over a carbon paste electrode and on dopamine’s electrochemical response. Electrochim. Acta 2013, 89, 854–860. [Google Scholar] [CrossRef]
- Ramírez, M.T.; Palomar, M.E.; González, I.; Rojas-Hernández, A. Carbon paste electrodes with electrolytic binder: Influence of the preparation method. Electroanalysis 1995, 7, 184–188. [Google Scholar] [CrossRef]
- Martínez, R.; Ramírez, M.T.; González, I. Voltammetric characterization of carbon paste electrodes with a nonconducting binder. Part I: Evidence of the influence of electroactive species dissolution into the paste on the voltammetric response. Electroanalysis 1998, 10, 336–342. [Google Scholar] [CrossRef]
- Xin, J.; Guo, Z.; Chen, X.; Jiang, W.; Li, J.; Li, M. Study of branched cationic β-cyclodextrin polymer/indomethacin complex and its release profile from alginate hydrogel. Int. J. Pharm. 2010, 386, 221–228. [Google Scholar] [CrossRef]
- Wu, W.; Liu, J.; Cao, S.; Tan, H.; Li, J.; Xu, F.; Zhang, X. Drug release behaviors of a pH sensitive semi-interpenetrating polymer network hydrogel composed of poly(vinyl alcohol) and star poly[2-(dimethylamino)ethylmethacrylate]. Int. J. Pharm. 2011, 416, 104–109. [Google Scholar] [CrossRef]
- He, Q.; Wu, W.; Xiu, K.; Zhang, Q.; Xu, F.; Li, J. Controlled drug release system based on cyclodextrin-conjugated poly(lactic acid)-β-poly(ethylene glycol) micelles. Int. J. Pharm. 2013, 443, 110–119. [Google Scholar] [CrossRef]
- Li, S.; Purdy, W.C. Cyclodextrins and their applications in analytical chemistry. Chem. Rev. 1992, 92, 1457–1470. [Google Scholar] [CrossRef]
- Gosser, D.K. Cyclic Voltametry Simulation and Analysis of Reaction Mechanisms; Wiley-VCH: Weinheim, Germany; New York, NY, USA; Chichester, UK; Brisbane, Australia; Singapore, Singapore; Toronto, ON, Canada, 1993; pp. 27–97. [Google Scholar]
- Cobos-Murcia, J.A.; Galicia, L.; Rojas-Hernández, A.; Ramírez-Silva, M.T.; Álvarez-Bustamante, R.; Romero-Romo, M.; Rosquete-Pina, G.; Palomar-Pardave, M. Electrochemical polymerisation of 5-amino-1,10-phenanthroline onto different substrates. Experimental and theoretical study. Polymer 2005, 46, 9053–9063. [Google Scholar] [CrossRef]
- Garfias-García, E.; Romero-Romo, M.; Ramírez-Silva, M.T.; Morales, J.; Palomar-Pardavé, M. Mechanism and kinetics of the electrochemical formation of polypyrrole under forced convection conditions. J. Electroanal. Chem. 2008, 613, 67–79. [Google Scholar] [CrossRef]
- De Licona-Sánchez, T.J.; Álvarez-Romero, G.A.; Mendoza-Huizar, L.H.; Galán-Vidal, C.A.; Palomar-Pardavé, M.; Romero-Romo, M.; Herrera-Hernández, H.; Uruchurtu, J.; Juárez-García, J.M. Nucleation and growth kinetics of electrodeposited sulfate-doped polypyrrole: Determination of the diffusion coefficient of SO42− in the polymeric membrane. J. Phys. Chem. B 2010, 114, 9737–9743. [Google Scholar] [CrossRef]
- Cuán, A.; Velasco, A.; Palomar-Pardavé, M.E.; Ramírez-Silva, M.T.; Romero-Romo, M.; Cortés-Romero, C.M.; Corona-Avendaño, S. Quantumchemical calculations of the structural stability of β-cyclodextrin/dopamine and β-cyclodextrin/ascorbic acid systems. Electrochem. Soc. Trans. 2013, 47, 53–67. [Google Scholar]
- Yi, S.Y.; Chan, H.Y.; Cho, H.H.; Park, Y.C.; Lee, S.H.; Bae, Z.U. Resolution of dopamine and ascorbic acid using nickel(II) complex polymer-modified electrodes. J. Electroanal. Chem. 2007, 602, 217–225. [Google Scholar] [CrossRef]
- Corona-Avendaño, S.; Alarcón-Ángeles, G.; Ramírez-Silva, M.T.; Rosquete-Pina, G.; Romero-Romo, M.; Palomar-Pardavé, M. On the electrochemistry of dopamine in aqueous solution. Part I: The role of [SDS] on the voltammetric behavior of dopamine on a carbon paste electrode. J. Electroanal. Chem. 2007, 609, 17–26. [Google Scholar] [CrossRef]
- Palomar-Pardavé, M.; Corona-Avendaño, S.; Romero-Romo, M.; Alarcón-Ángeles, G.; Merkoçi, A.; Ramírez-Silva, M.T. Supramolecular interaction of dopamine with β-cyclodextrin: An experimental and theoretical electrochemical study. J. Electroanal. Chem. 2014, 717–718, 103–109. [Google Scholar] [CrossRef]
- Sample Availability: Not available.
© 2014 by the authors. Licensee MDPI, Basel, Switzerland. This article is an open access article distributed under the terms and conditions of the Creative Commons Attribution license ( http://creativecommons.org/licenses/by/3.0/).
Share and Cite
Ramírez-Silva, M.T.; Palomar-Pardavé, M.; Corona-Avendaño, S.; Romero-Romo, M.; Alarcón-Angeles, G. Guest-Host Complex Formed between Ascorbic Acid and β-Cyclodextrin Immobilized on the Surface of an Electrode. Molecules 2014, 19, 5952-5964. https://doi.org/10.3390/molecules19055952
Ramírez-Silva MT, Palomar-Pardavé M, Corona-Avendaño S, Romero-Romo M, Alarcón-Angeles G. Guest-Host Complex Formed between Ascorbic Acid and β-Cyclodextrin Immobilized on the Surface of an Electrode. Molecules. 2014; 19(5):5952-5964. https://doi.org/10.3390/molecules19055952
Chicago/Turabian StyleRamírez-Silva, María Teresa, Manuel Palomar-Pardavé, Silvia Corona-Avendaño, Mario Romero-Romo, and Georgina Alarcón-Angeles. 2014. "Guest-Host Complex Formed between Ascorbic Acid and β-Cyclodextrin Immobilized on the Surface of an Electrode" Molecules 19, no. 5: 5952-5964. https://doi.org/10.3390/molecules19055952
APA StyleRamírez-Silva, M. T., Palomar-Pardavé, M., Corona-Avendaño, S., Romero-Romo, M., & Alarcón-Angeles, G. (2014). Guest-Host Complex Formed between Ascorbic Acid and β-Cyclodextrin Immobilized on the Surface of an Electrode. Molecules, 19(5), 5952-5964. https://doi.org/10.3390/molecules19055952