2.1. Optimization of LC-Q-TOF-MS Conditions
A series of preliminary experiments were carried out in order to optimize the LC-Q-TOF-MS conditions. After comparison with YMC-UltraHT pro C
18 (100 mm × 2.0 mm i.d., 2 μm) and Agilent Eclipse XDB C
18 (150 mm × 2.1 mm i.d., 3.5 μm) column, Agilent Eclipse Plus C
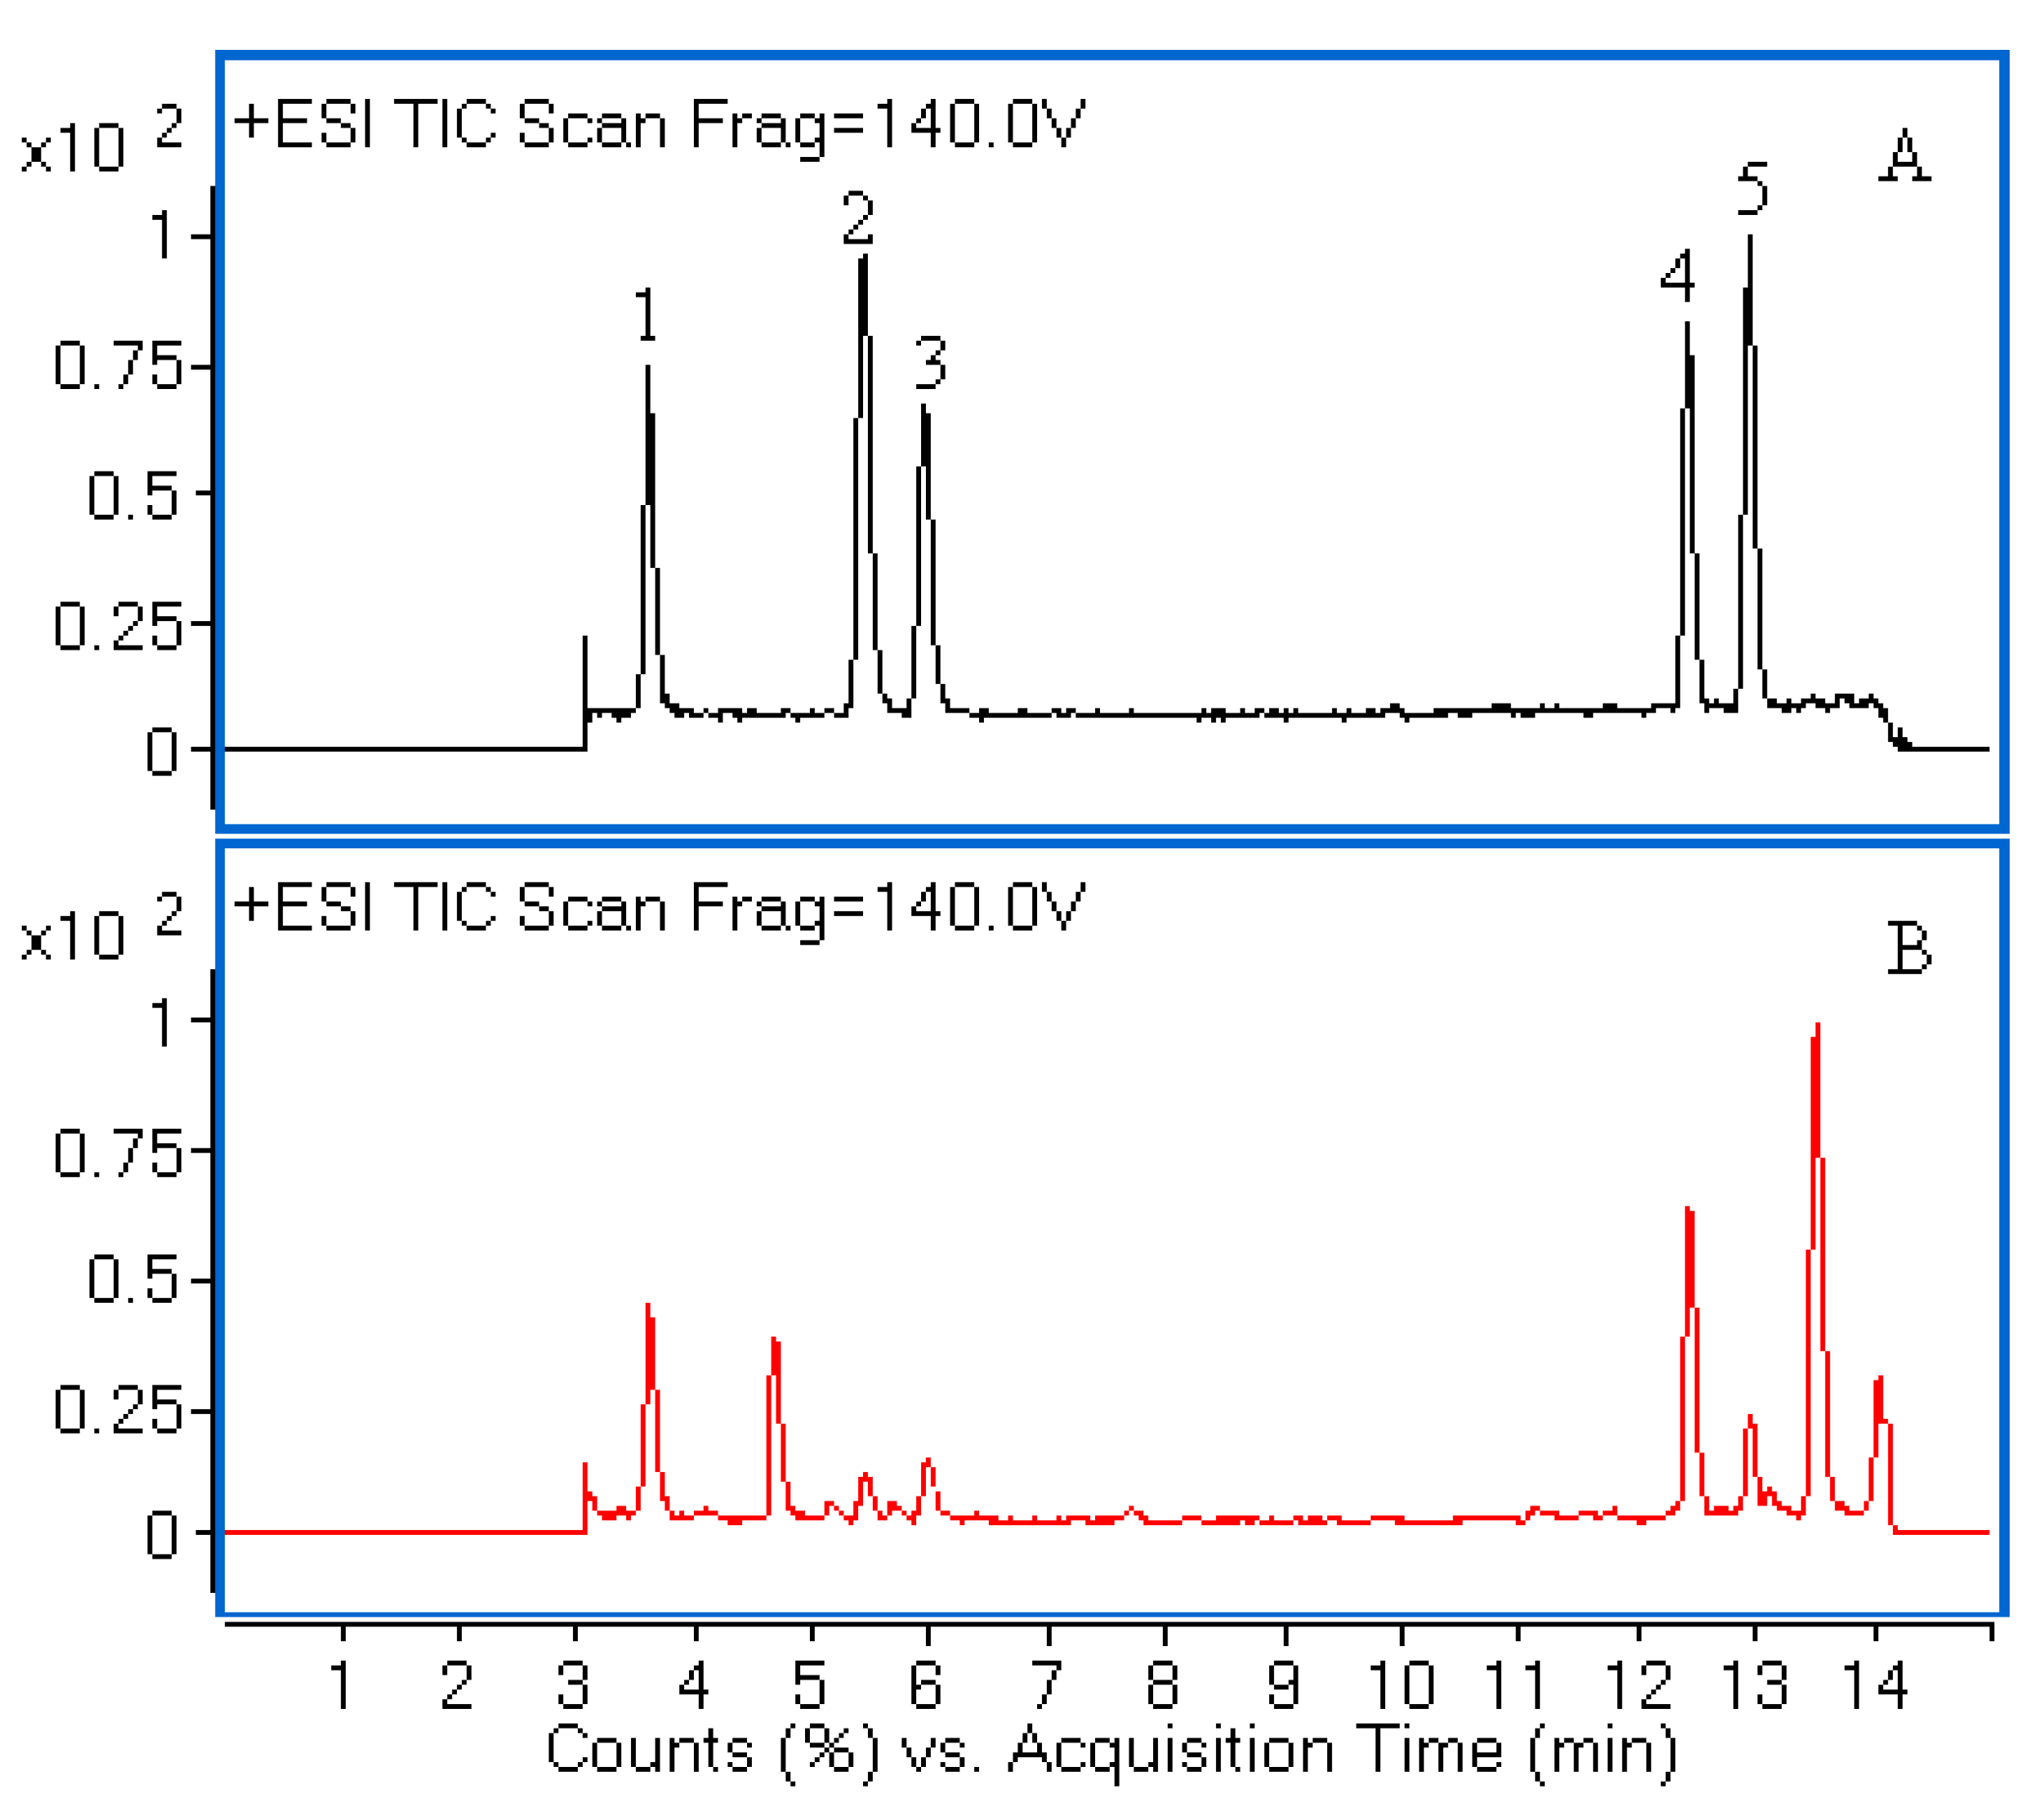
18 (150 mm × 2.1 mm i.d., 1.8 μm) column gave a better separation of the analytes within 15 min. Different mobile phase compositions such as acetonitrile-water and aqueous acetonitrile-acid solvents were tested. The acidified mobile phase (0.1% formic acid) and gradient mode were necessary to achieve a satisfactory MS response and chromatographic separation. To obtain more stable product ions and high responses, MS parameters including fragmentor voltage and drying gas temperature were optimized. Moreover, the positive mode was selected for MS analysis as it had better sensitivity of ion response than that of negative mode. The typical total ion current (TIC) chromatograms were shown in
Figure 1. The chemical structures of five compounds were characterized by comparing accurate mass and their retention times with those of standard compounds.
Figure 1.
Liquid chromatography/quadrupole-time-of-flight mass spectrometry (LC-Q-TOF-MS) total ion chromatograms (TIC) of a mixture of five standards (A) and the extract of H. sabdariffa (B). Peaks 1, 2, 3, 4 and 5 correspond to neochlorogenic acid, chlorogenic acid, cryptochlorogenic acid, rutin and isoquercitrin, respectively.
2.2. Method Validation
The regression equations, linear ranges, LODs and LOQs values of five analytes were performed using the developed LC-Q-TOF-MS method. As shown in
Table 1, the calibration curves of the proposed method were generated by using polynomial regression. Reasonable correlation coefficient values (R
2 ≥ 0.9993) indicated good correlations between the concentrations of five analytes and their peak areas within the tested ranges. In this study, LOD and LOQ values were less than 0.09 µg/mL and 0.19 µg/mL, respectively, which were small enough to meet the need for determination of the analytes in
H. sabdariffa.
Table 1.
Calibration curves, linearity, limits of detection (LOD) and limits of quantification (LOQ) of the five analytes.
Table 1.
Calibration curves, linearity, limits of detection (LOD) and limits of quantification (LOQ) of the five analytes.
| Analytes | Regression Equation | Linear Range (µg/mL) | Correlation Coefficient (R2) | LOD (µg/mL) | LOQ (µg/mL) |
|---|
| Neochlorogenic acid | y = −833.90·x2 + 139143.92·x + 6461.02 | 0.75–48.00 | 0.9997 | 0.05 | 0.19 |
| Chlorogenic acid | y = −1795.39·x2 + 239416.18·x − 4374.15 | 0.19–48.00 | 0.9993 | 0.05 | 0.19 |
| Cryptochlorogenic acid | y = −677.23·x2 + 119252.57·x + 2703.14 | 0.19–48.00 | 0.9998 | 0.09 | 0.19 |
| Rutin | y = −1265.45·x2 + 220749.21·x + 1297.41 | 0.09–48.00 | 0.9999 | 0.02 | 0.09 |
| Isoquercitrin | y = −1970.01·x2 + 256239.13·x + 3378.03 | 0.09–48.00 | 0.9997 | 0.02 | 0.09 |
As shown in
Table 2, the repeatability present as RSD (
n = 6) was between 2.77% and 4.89% of the five investigated compounds. The overall intra- and inter-day variations (RSD) of five analytes for peak areas were in the range from 1.80% to 3.10%, and 1.05% to 3.93%, respectively. Meanwhile, the retention time variations (RSD) were less than 0.21% and 0.52%, respectively (
Table 2).
Table 2.
Repeatability and precision of the investigated analytes.
Table 2.
Repeatability and precision of the investigated analytes.
| Analytes | Repeatability (RSD, n = 6) % | Intra-day | Inter-day |
|---|
| (RSD, n = 6) % | (RSD, n = 6) % |
|---|
| Retention Time | Peak Area | Retention Time | Peak Area |
|---|
| Neochlorogenic acid | 3.92 | 0.09 | 2.04 | 0.52 | 3.91 |
| Chlorogenic acid | 4.89 | 0.21 | 2.54 | 0.46 | 1.05 |
| Cryptochlorogenic acid | 4.47 | 0.15 | 1.84 | 0.47 | 1.29 |
| Rutin | 2.77 | 0.09 | 1.80 | 0.22 | 2.96 |
| Isoquercitrin | 2.81 | 0.06 | 3.10 | 0.19 | 3.93 |
The average recoveries obtained in this study ranged from 86.28% to 101.26%, while RSD were all less than 4.88% (
Table 3). Therefore, the proposed LC-Q-TOF-MS method was sensitive, precise, and accurate for quantitative evaluation of the five analytes in
H. sabdariffa.
Table 3.
Recovery test of the five compounds in H. sabdariffa leaves (n = 3).
Table 3.
Recovery test of the five compounds in H. sabdariffa leaves (n = 3).
| Analytes | Original Amount (µg) | Added (µg) | Found (µg) | Recovery (%) | RSD (%) |
|---|
| Neochlorogenic acid | 594.63 | 412.50 | 1007.11 | 99.99 | 3.88 |
| 594.63 | 825.00 | 1317.16 | 87.58 | 1.38 |
| Chlorogenic acid | 83.37 | 45.00 | 122.13 | 86.28 | 1.95 |
| 83.37 | 90.00 | 166.31 | 92.23 | 4.32 |
| Cryptochlorogenic acid | 166.01 | 100.00 | 262.57 | 96.56 | 4.76 |
| 166.01 | 200.00 | 355.90 | 94.94 | 3.13 |
| Rutin | 726.71 | 562.50 | 1296.29 | 101.26 | 4.11 |
| 726.71 | 1125.00 | 1793.28 | 94.81 | 4.03 |
| Isoquercitrin | 147.97 | 112.50 | 259.52 | 99.15 | 4.88 |
| 147.97 | 225.00 | 345.92 | 87.98 | 0.83 |
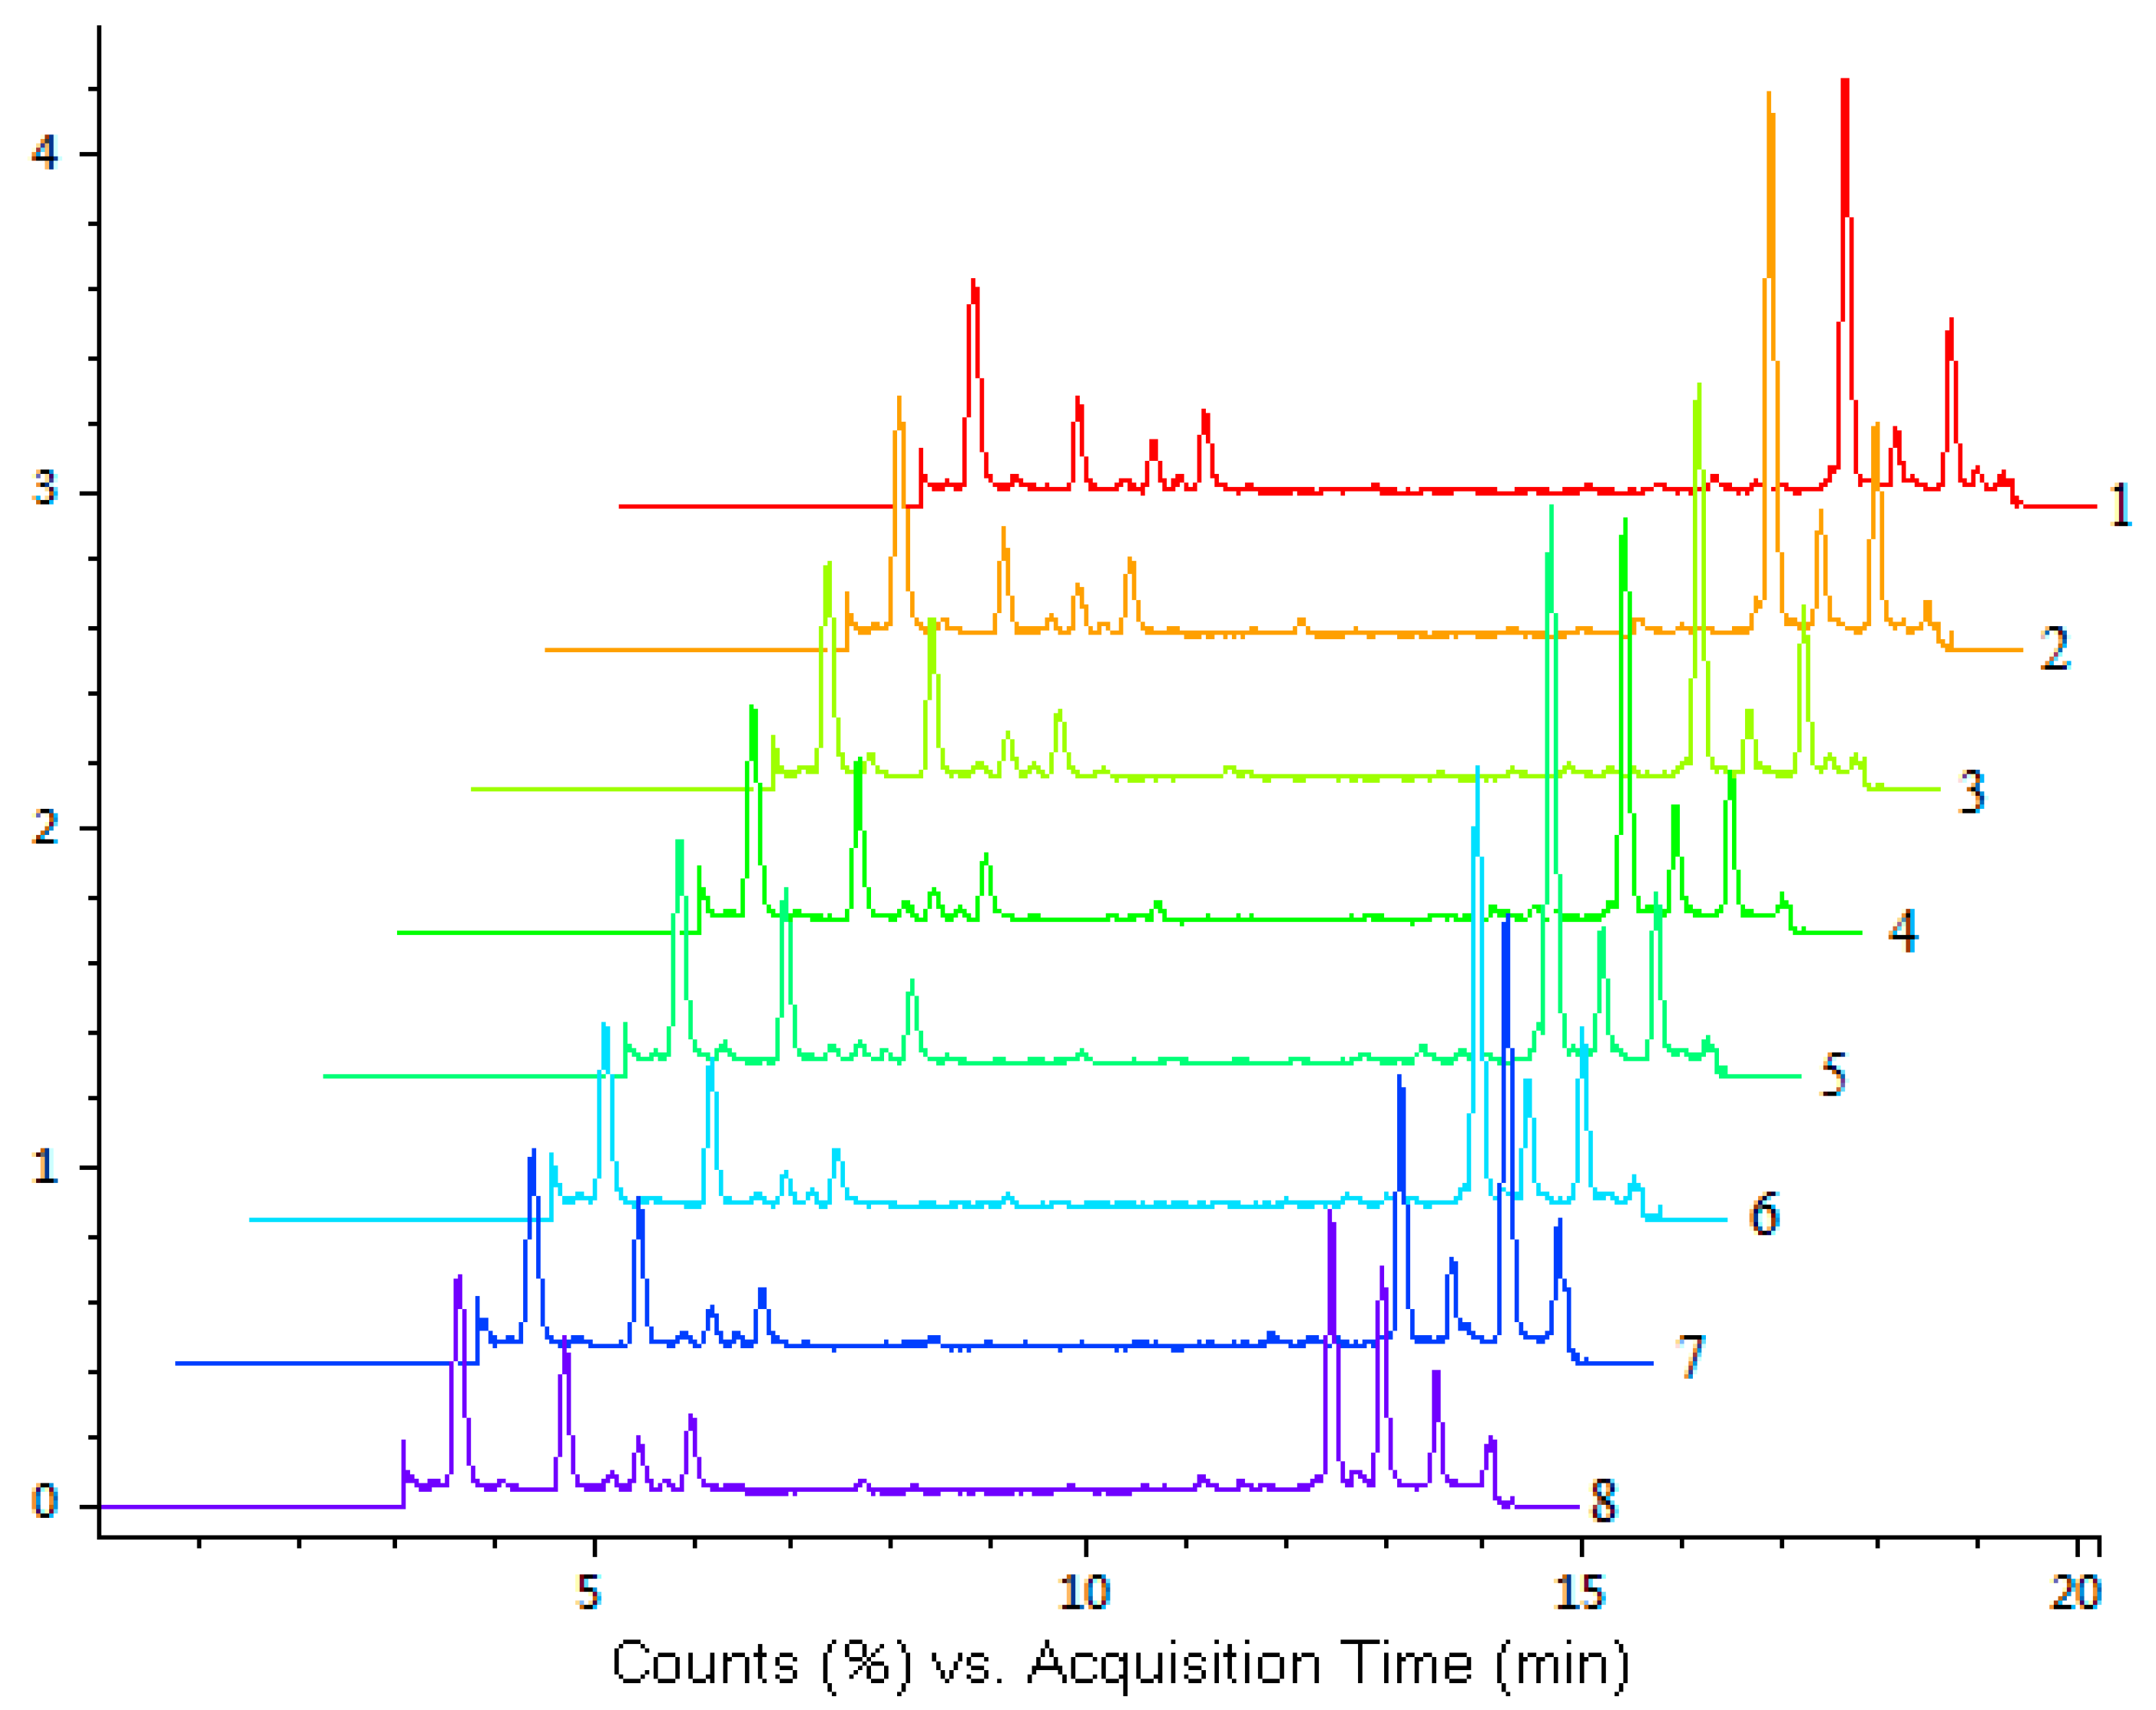
2.3. Quantitative Analysis
The developed LC-Q-TOF-MS method was subsequently applied to simultaneous quantification of the five investigated compounds in eight accessions of
H. sabdariffa. The fingerprint chromatograms of eight samples of
H. sabdariffa are shown in
Figure 2.
Figure 2.
LC-Q-TOF-MS total ion chromatograms (TIC) of eight samples of
H. sabdariffa. Different samples (No. 1–8) are listed in
Table 4.
Figure 2.
LC-Q-TOF-MS total ion chromatograms (TIC) of eight samples of
H. sabdariffa. Different samples (No. 1–8) are listed in
Table 4.
Table 4.
Investigated leaves of eight different accessions of H. sabdariffa. The plant identification (PI) numbers of accession label were assigned by the United States Department of Agriculture-Agricultural Research Service (USDA-ARS).
Table 4.
Investigated leaves of eight different accessions of H. sabdariffa. The plant identification (PI) numbers of accession label were assigned by the United States Department of Agriculture-Agricultural Research Service (USDA-ARS).
| No. | Country (Seed Source) | Accession Label |
|---|
| 1 | India | PI-180026 |
| 2 | Cuba | PI-207920 |
| 3 | Sudan | PI-267778 |
| 4 | Nigeria | PI-268100 |
| 5 | Taiwan | PI-273388 |
| 6 | Nigeria | PI-274245 |
| 7 | Senegal | PI-275413 |
| 8 | Sudan | PI-496938 |
The identification of the investigated compounds was performed by comparison of their retention time and accurate MS with those of reference standards. The molecular ion peaks and the MS data were shown in
Table 5.
Table 5.
MS data of the five compounds from H. sabdariffa by LC-Q-TOF-MS.
Table 5.
MS data of the five compounds from H. sabdariffa by LC-Q-TOF-MS.
| No. | RT (min) | [M+H]+ | Main Fragments | Calculated m/z | Error | Formula | Identification |
|---|
| mDa | ppm |
|---|
| 1. | 3.62 | 355.1023 | 163.0390 | 355.1024 | 0.10 | 0.21 | C16H18O9 | Neochlorogenic acid |
| 2. | 5.44 | 355.1026 | 163.0391 | 355.1024 | −0.65 | −0.20 | C16H18O9 | Chlorogenic acid |
| 3. | 5.96 | 355.1032 | 163.0395 | 355.1024 | −0.20 | −0.48 | C16H18O9 | Cryptochlorogenic acid |
| 4. | 12.42 | 611.1612 | 465.1025 | 611.1607 | −0.60 | −0.91 | C27H30O16 | Rutin |
| 5. | 12.95 | 465.1029 | 303.0500 | 465.1028 | −0.10 | −0.31 | C21H20O12 | Isoquercitrin |
The contents of five analytes in
H. sabdariffa are presented in
Table 6. The results showed that the content of each analyte varied greatly among different accessions of
H. sabdariffa. The variations (RSD) in the content of five analytes were in the range from 10.5% to 54.9%, which could lead to the variation of antioxidant effects. Among the tested samples, the sample No. 5 from Taiwan had the highest contents of the five analytes, while the sample No. 7 from Senegal had the lowest amount. There was no significant difference in the content between the sample No. 5 and sample No. 2. Therefore, the two accessions of
H. sabdariffa from Cuba and Taiwan had higher contents of five marker compounds compared to the other tested samples.
Table 6.
Contents (µg/g) of five antioxidant compounds in different
H. sabdariffa leaves (
n = 3). Sample No. corresponds to
Table 4. Relative standard deviation (RSD) were obtained based on the contents of eight samples. Total—the sum of the five investigated compounds. a, b, c, d, e—the same letter in column indicates homogeneous groups obtained by the ANOVA (
p = 0.05).
Table 6.
Contents (µg/g) of five antioxidant compounds in different H. sabdariffa leaves (n = 3). Sample No. corresponds to Table 4. Relative standard deviation (RSD) were obtained based on the contents of eight samples. Total—the sum of the five investigated compounds. a, b, c, d, e—the same letter in column indicates homogeneous groups obtained by the ANOVA (p = 0.05).
| No. | Contents (µg/g) (Mean ± SD) |
|---|
| Neochlorogenic Acid | Chlorogenic Acid | Cryptochlorogenic Acid | Rutin | Isoquercitrin | Total |
|---|
| 1 | 6875.0 ± 251.6 | 975.0 ± 27.2 | 2318.8 ± 79.8 | 12860.4 ± 258.5 | 966.7 ± 28.9 | 23995.9 bc |
| 2 | 7633.3 ± 41.6 | 993.8 ± 43.8 | 2181.3 ± 18.8 | 19356.3 ± 409.7 | 2270.8 ± 78.2 | 32435.5 a |
| 3 | 6577.1 ± 50.1 | 879.2 ± 9.6 | 1991.7 ± 73.2 | 12556.3 ± 151.7 | 1029.2 ± 23.7 | 23033.5 cd |
| 4 | 6912.5 ± 136.2 | 645.8 ± 20.1 | 1952.1 ± 68.6 | 12560.4 ± 534.4 | 1998.0 ± 78.8 | 24068.8 bc |
| 5 | 7512.5 ± 304.1 | 350.0 ± 16.5 | 2356.3 ± 109.5 | 20472.9 ± 653.0 | 2518.8 ± 109.5 | 33210.5 a |
| 6 | 5545.8 ± 103.9 | 677.1 ± 26.0 | 1635.4 ± 68.6 | 14058.3 ± 237.4 | 2341.7 ± 23.7 | 24258.3 b |
| 7 | 5979.2 ± 191.4 | 800.0 ± 38.0 | 1637.5 ± 65.9 | 7245.8 ± 196.1 | 1466.7 ± 34.4 | 17129.2 e |
| 8 | 6841.7 ± 469.1 | 1052.1 ± 65.7 | 2202.1 ± 78.2 | 7845.8 ± 219.6 | 4702.1 ± 78.6 | 22643.8 d |
| RSD % | 10.5 | 29.2 | 13.9 | 35.4 | 54.9 | |
2.4. Antioxidant Activity
All the samples were evaluated for their antioxidant activities by DPPH free radical scavengingassay. Bamboo leaves were used as a comparison. As shown in
Table 7, there was a good linear relationship (R
2 ≥ 0.9897) between the free radical scavenging rate and the final concentration of
H. sabdariffa leaves in the ranges 37.33–320.00 µg/mL (dry weight basis for leaf). The IC
50 value was used as a significant indicator of antioxidant ability. Moreover, the lower the IC
50 value, the higher the antioxidant activity of samples. In terms of IC
50 values, the capacity of DPPH radical scavenging activity was in a decreasing order: 2 > 5 > 1 > 6 > 4 > 3 > 8 > 7 (
Table 7). According to the
Section 3.1, all the accessions had grown under the same conditions, such as the cultivated soil, cultivated method and local climate. The leaves of
H. sabdariffa were collected at the same time. Therefore, the different antioxidant activity of
H. sabdariffa leaves may be due to the differences among these accessions. Furthermore, the differences in the antioxidant activity can be explained by the differences of the contents of antioxidant compounds.
As seen from
Table 6 to
Table 7, the content of rutin was higher than that of other investigated compounds. Meanwhile, rutin exhibited strong DPPH radical scavenging activity and its IC
50 value was 4.54 ug/mL. Rutin is one of the most important dietary flavonoid that is widely consumed from plant-derived foods. Rutin has significant pharmacological activities, such as antioxidation and health benefits. Over 130 registered therapeutic medicinal preparations are containing rutin in their formulations [
16]. The strong antioxidant ability of rutin has been proven by several studies, especially for free radical scavenging activity [
17,
18,
19]. Therefore, the high antioxidant activity of the leaves of
H. sabdariffa was associated with increased concentrations of the investigated compounds. In most of the tested samples, the five investigated analytes were considered as the major antioxidant compounds. Besides these five compounds, there are also several unknown compounds that possess antioxidant activity in
H. sabdariffa [
20]
.
Table 7.
Antioxidant activity of the eight accessions of
H. sabdariffa. Sample No. corresponds to
Table 4.
Table 7.
Antioxidant activity of the eight accessions of H. sabdariffa. Sample No. corresponds to Table 4.
| Samples | Regression Equation | R2 | IC50 (µg/mL, Dry Weight Basis for Leaf) |
|---|
| 1 | y = 0.2776·x + 5.1522 | 0.9932 | 161.91 |
| 2 | y = 0.2767·x + 7.3187 | 0.9897 | 154.65 |
| 3 | y = 0.2190·x + 5.1677 | 0.9945 | 204.72 |
| 4 | y = 0.2092·x + 8.1093 | 0.9937 | 200.29 |
| 5 | y = 0.2730·x + 6.9611 | 0.9931 | 157.65 |
| 6 | y = 0.2117·x + 9.2249 | 0.9944 | 192.61 |
| 7 | y = 0.1818·x + 5.2144 | 0.9987 | 247.44 |
| 8 | y = 0.1729·x + 14.2790 | 0.9935 | 207.73 |
| Bamboo leaves | y = 0.2497·x + 0.7810 | 0.9908 | 197.67 |
| Rutin | y = 10.492·x + 2.3650 | 0.9941 | 4.54 |
| Neochlorogenic acid | y = 9.9885·x - 0.2967 | 0.9992 | 5.04 |
| Chlorogenic acid | y = 9.6473·x + 1.5983 | 0.9982 | 5.02 |
| Cryptochlorogenic acid | y = 9.5822·x − 0.4380 | 0.9980 | 5.26 |
| Isoquercitrin | y = 12.059·x + 7.5899 | 0.9947 | 3.52 |
As to antioxidant activity of
H. sabdariffa, several studies have focus on its flower [
21,
22]. In contrast with the leaves, the calyces of
H. sabdariffa are rich in hydroxycitric acid and hibiscus acid [
23]. Previous studies have indicated that both the total content of flavonoid and radical scavenging activity of
H. sabdariffa leaves were higher than those of
H. sabdariffa flowers [
3,
13]. Furthermore, the
H. sabdariffa leaf extracts possessed stronger antioxidant capacity than mulberry leaf extracts, which are rich in polyphenolic compounds [
3,
24].
In China, antioxidant of bamboo leaves (AOB) has been listed in the national standards (standard No.GB2760) in 2004. AOB as a kind of food antioxidant has been used in edible oil, meat product, aquatic product and puffed food as a kind of natural antioxidant [
25]. In our previous study, the methanolic extract of
Bambusa textilis possessed the highest antioxidant activity among the selected bamboo species [
26]. As seen from
Table 7, the IC
50 value of bamboo leaves (
B. textilis) was 197.67 µg/mL, which was similar with the IC
50 values of
H. sabdariffa leaves. These results indicated that
H. sabdariffa leaves could be considered as a potential antioxidant source for the food industry. Further studies on the antioxidant mechanism and safety evaluation of
H. sabdariffa leaves are needed [
27].

