Characterization and Development of EST-SSR Markers Derived from Transcriptome of Yellow Catfish

Abstract
:1. Introduction
2. Results and Discussion
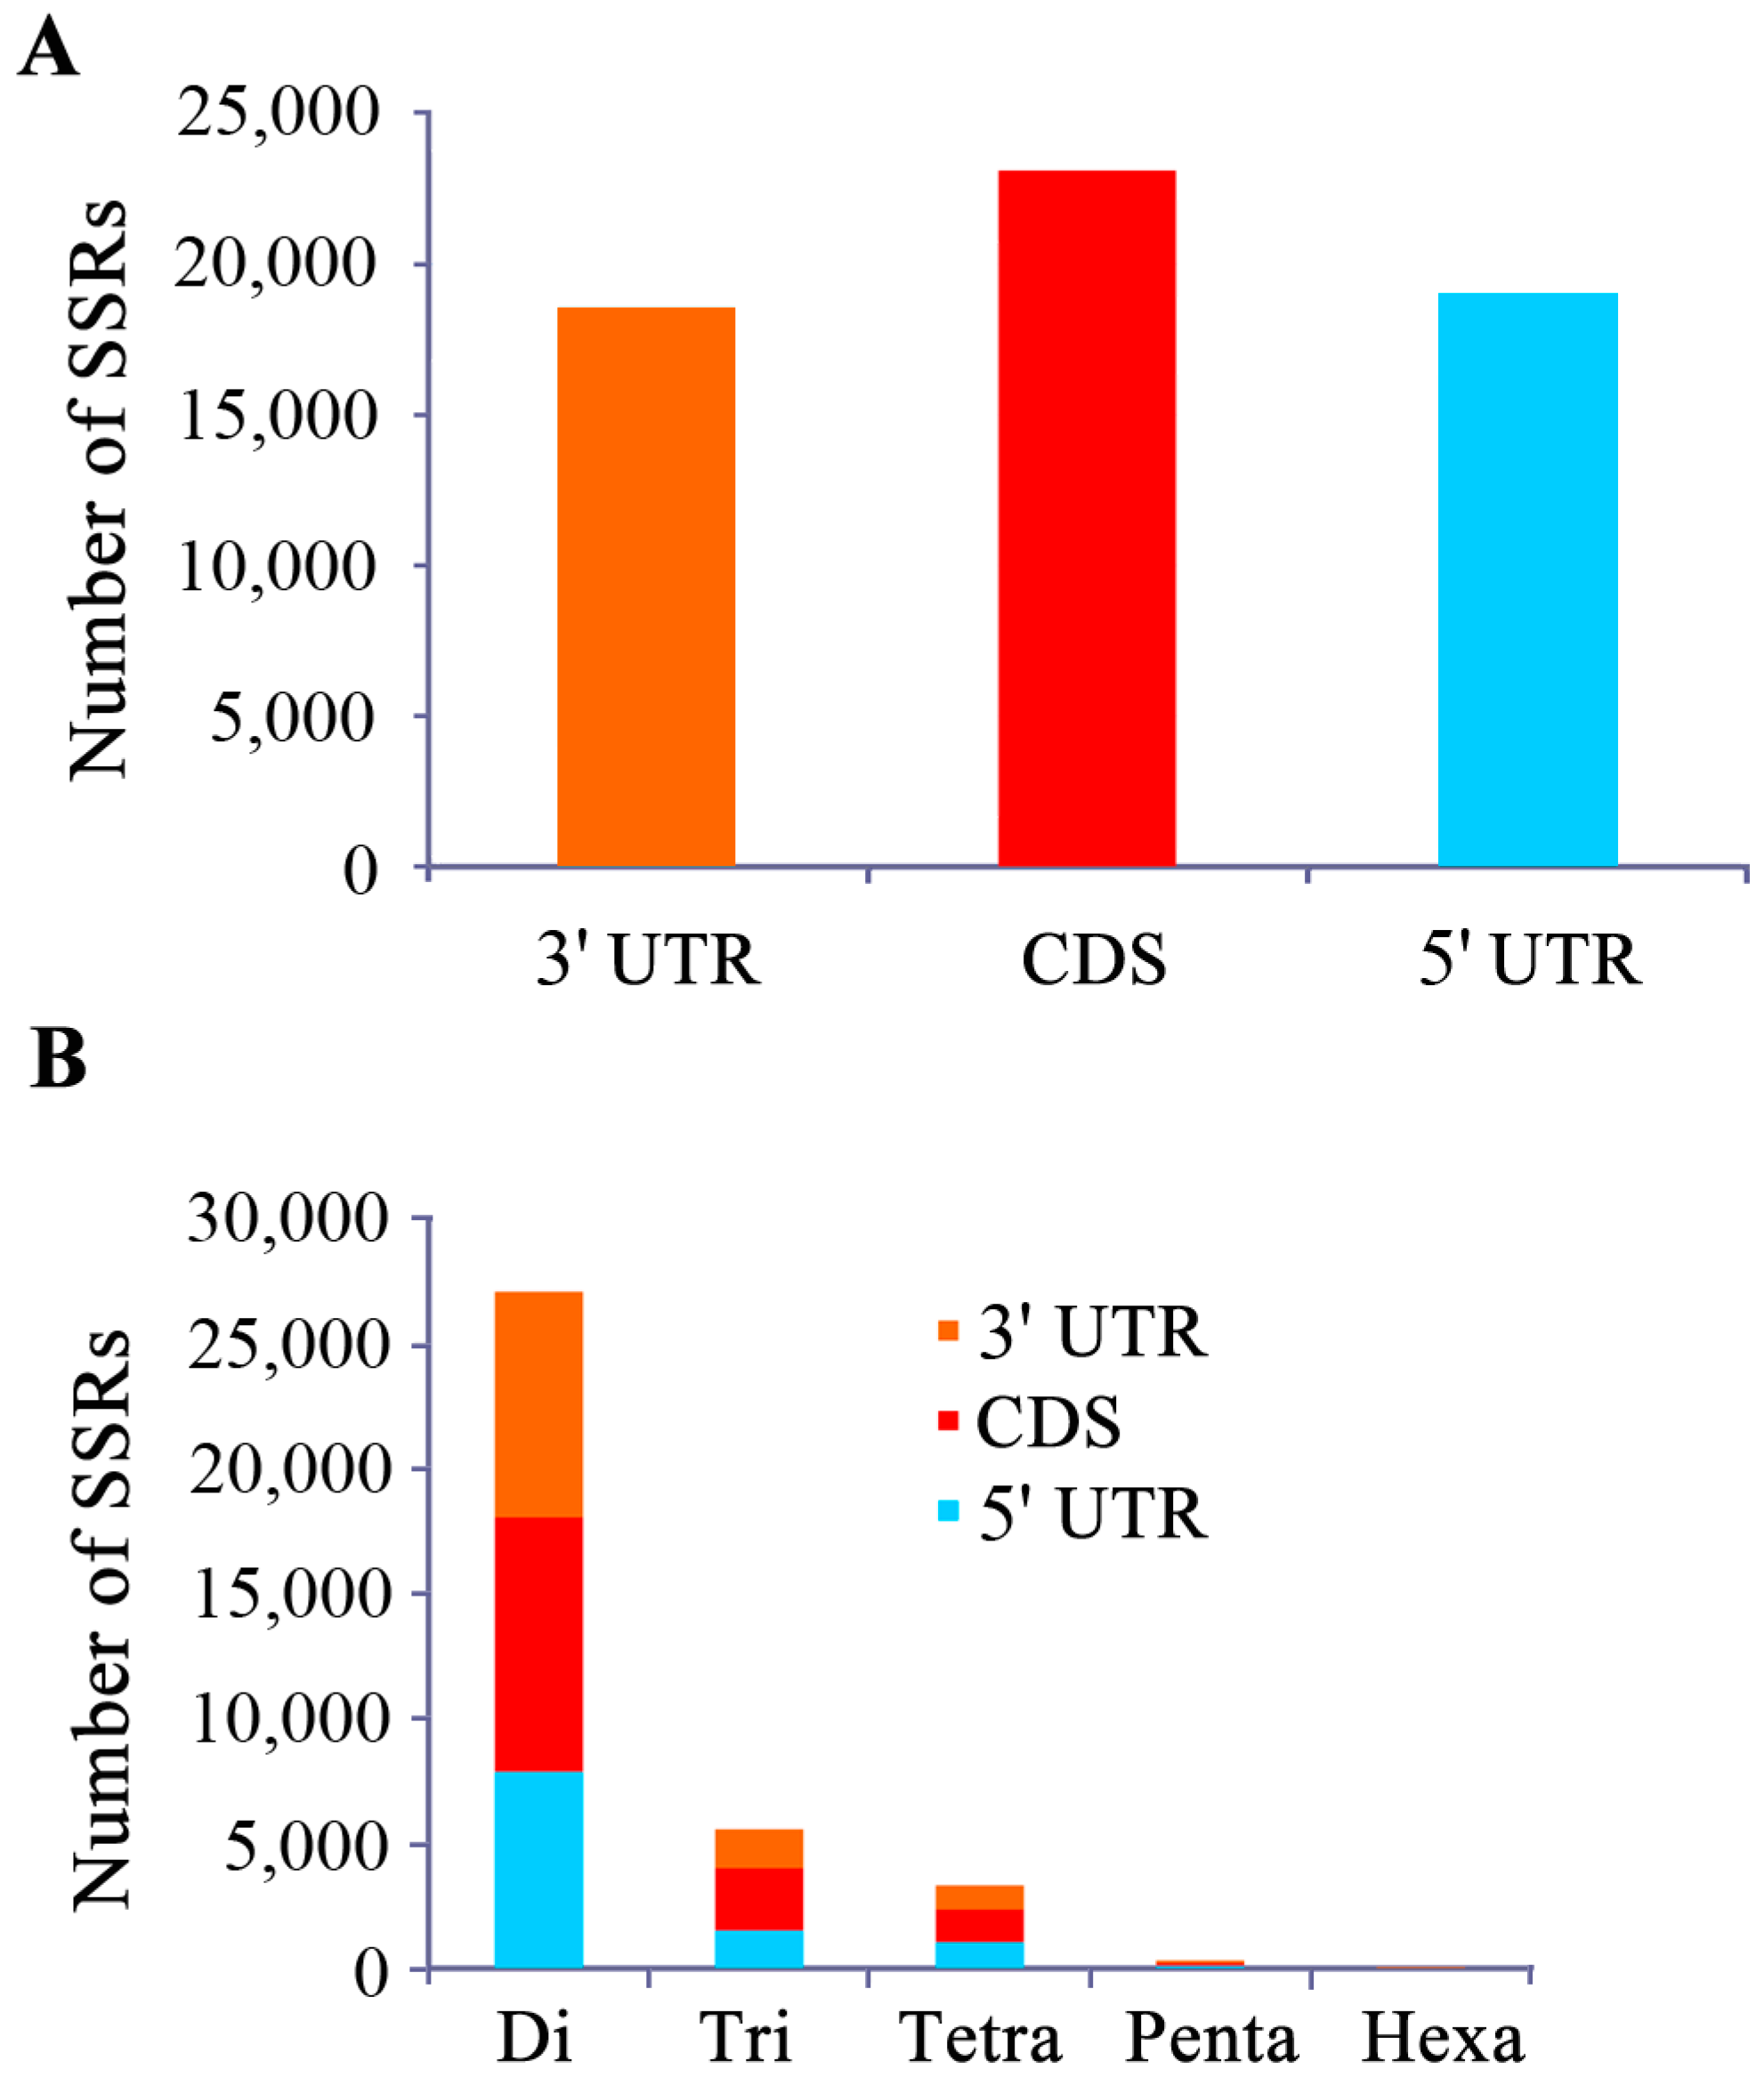
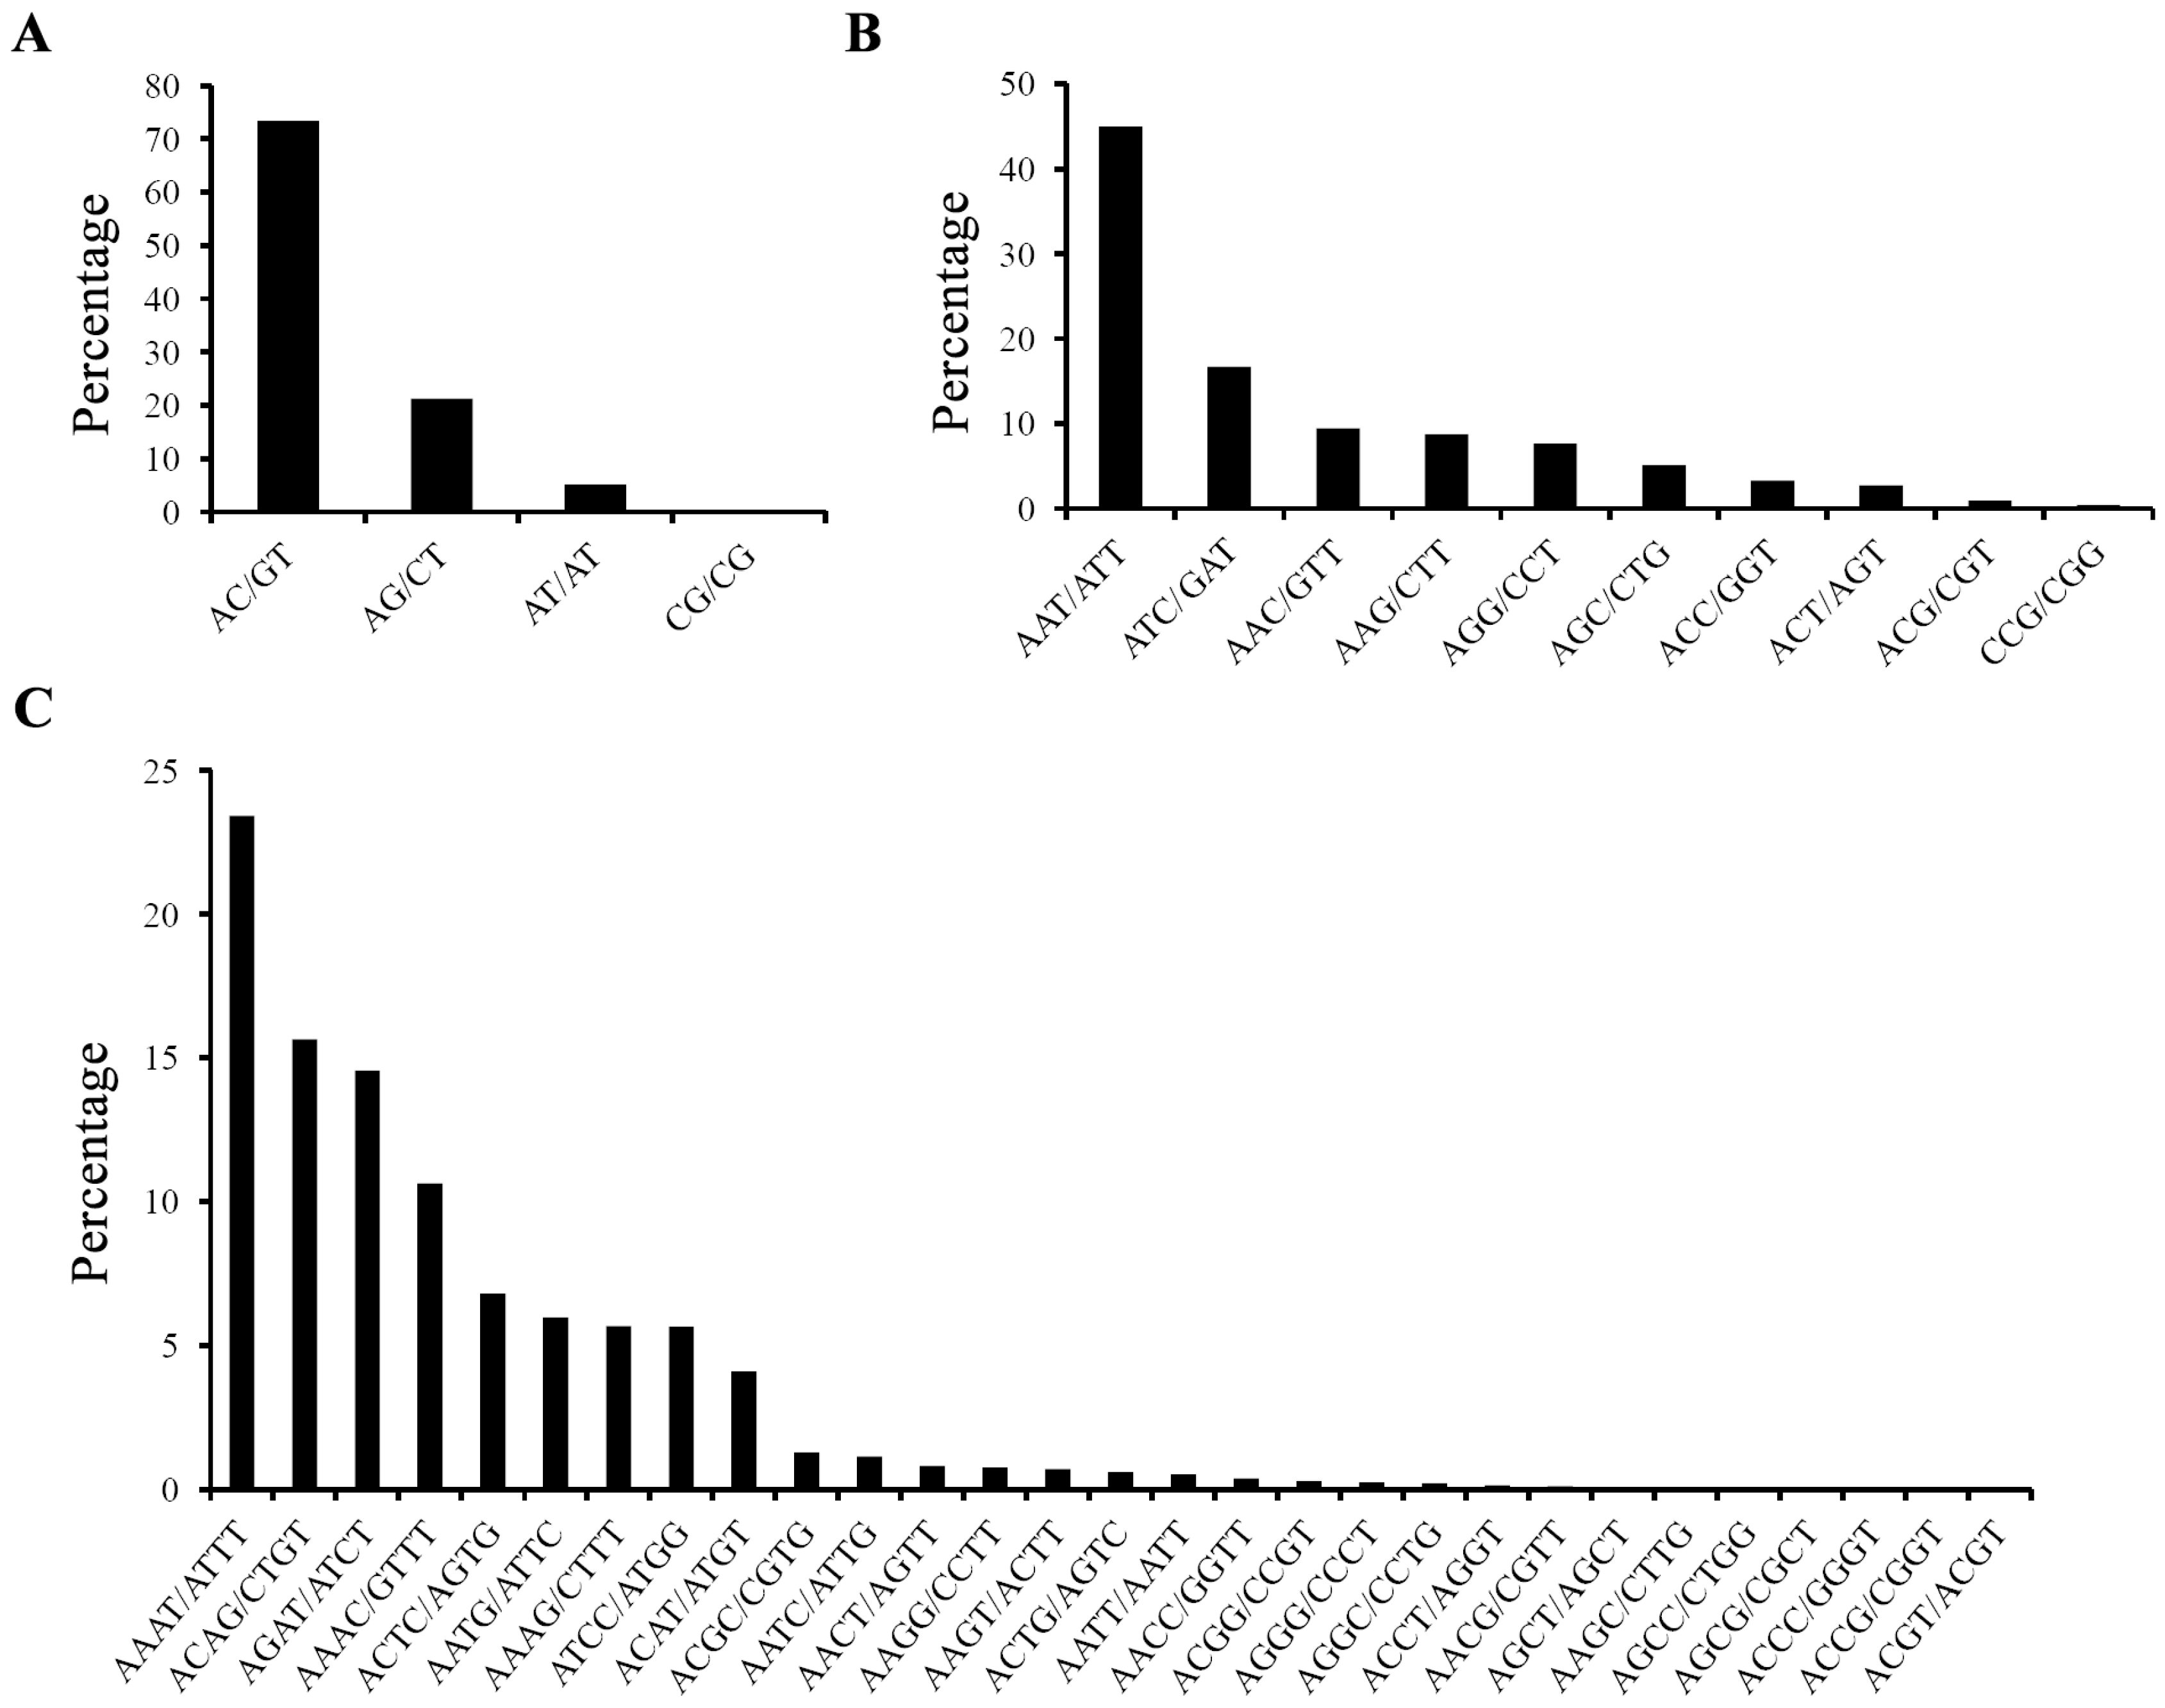
2.1. Characterization of EST-SSRs in the Yellow Catfish Transcriptome

| Repeats | Mo | Di | Tri | Tetra | Penta | Hexa | Total | Percentage (%) |
|---|---|---|---|---|---|---|---|---|
| 5 | - | 0 | 2654 | 1843 | 253 | 43 | 4793 | 5.79 |
| 6 | - | 12,561 | 1347 | 994 | 80 | 22 | 15,004 | 18.12 |
| 7 | - | 7110 | 893 | 632 | 44 | 8 | 8687 | 10.49 |
| 8 | - | 4411 | 537 | 421 | 16 | 5 | 5390 | 6.51 |
| 9 | - | 3248 | 384 | 316 | 18 | 3 | 3969 | 4.79 |
| 10 | 6769 | 2429 | 276 | 289 | 19 | 2 | 9784 | 11.82 |
| 11 | 3055 | 1972 | 263 | 225 | 15 | 0 | 5530 | 6.68 |
| 12 | 1805 | 1628 | 244 | 194 | 4 | 1 | 3876 | 4.68 |
| 13 | 995 | 1418 | 207 | 144 | 14 | 0 | 2778 | 3.36 |
| 14 | 602 | 1260 | 206 | 129 | 6 | 0 | 2203 | 2.66 |
| 15 | 392 | 1112 | 173 | 132 | 2 | 0 | 1811 | 2.19 |
| 16 | 174 | 1008 | 186 | 96 | 2 | 0 | 1466 | 1.77 |
| 17 | 136 | 896 | 141 | 110 | 1 | 0 | 1284 | 1.55 |
| 18 | 80 | 846 | 113 | 64 | 0 | 0 | 1103 | 1.33 |
| 19 | 53 | 806 | 128 | 60 | 3 | 0 | 1050 | 1.27 |
| 20 | 26 | 799 | 90 | 46 | 1 | 0 | 962 | 1.16 |
| 21 | 18 | 731 | 81 | 58 | 0 | 0 | 888 | 1.07 |
| 22 | 13 | 688 | 54 | 44 | 0 | 0 | 799 | 0.97 |
| 23 | 12 | 713 | 44 | 48 | 0 | 0 | 817 | 0.99 |
| 24 | 5 | 709 | 30 | 26 | 0 | 0 | 770 | 0.93 |
| 25 | 3 | 655 | 23 | 30 | 0 | 0 | 711 | 0.86 |
| 26 | 4 | 634 | 12 | 23 | 0 | 0 | 673 | 0.81 |
| 27 | 1 | 648 | 9 | 20 | 0 | 0 | 678 | 0.82 |
| 28 | 3 | 573 | 3 | 12 | 0 | 0 | 591 | 0.71 |
| 29 | 0 | 594 | 1 | 12 | 0 | 0 | 607 | 0.73 |
| 30 | 3 | 563 | 1 | 12 | 0 | 0 | 579 | 0.70 |
| 31 | 5 | 521 | 0 | 6 | 0 | 0 | 532 | 0.64 |
| 32 | 2 | 479 | 2 | 7 | 0 | 0 | 490 | 0.59 |
| 33 | 0 | 462 | 2 | 2 | 0 | 0 | 466 | 0.56 |
| 34 | 0 | 432 | 0 | 3 | 0 | 0 | 435 | 0.53 |
| 35 | 1 | 421 | 0 | 5 | 0 | 0 | 427 | 0.52 |
| 36 | 0 | 394 | 0 | 5 | 0 | 0 | 399 | 0.48 |
| >36 | 11 | 3212 | 0 | 19 | 0 | 0 | 3242 | 3.92 |
| Total | 14,168 | 53,933 | 8104 | 6027 | 478 | 84 | 82,794 | 100.00 |
| Percentage (%) | 17.11 | 65.14 | 9.79 | 7.28 | 0.58 | 0.10 | 100.00 |
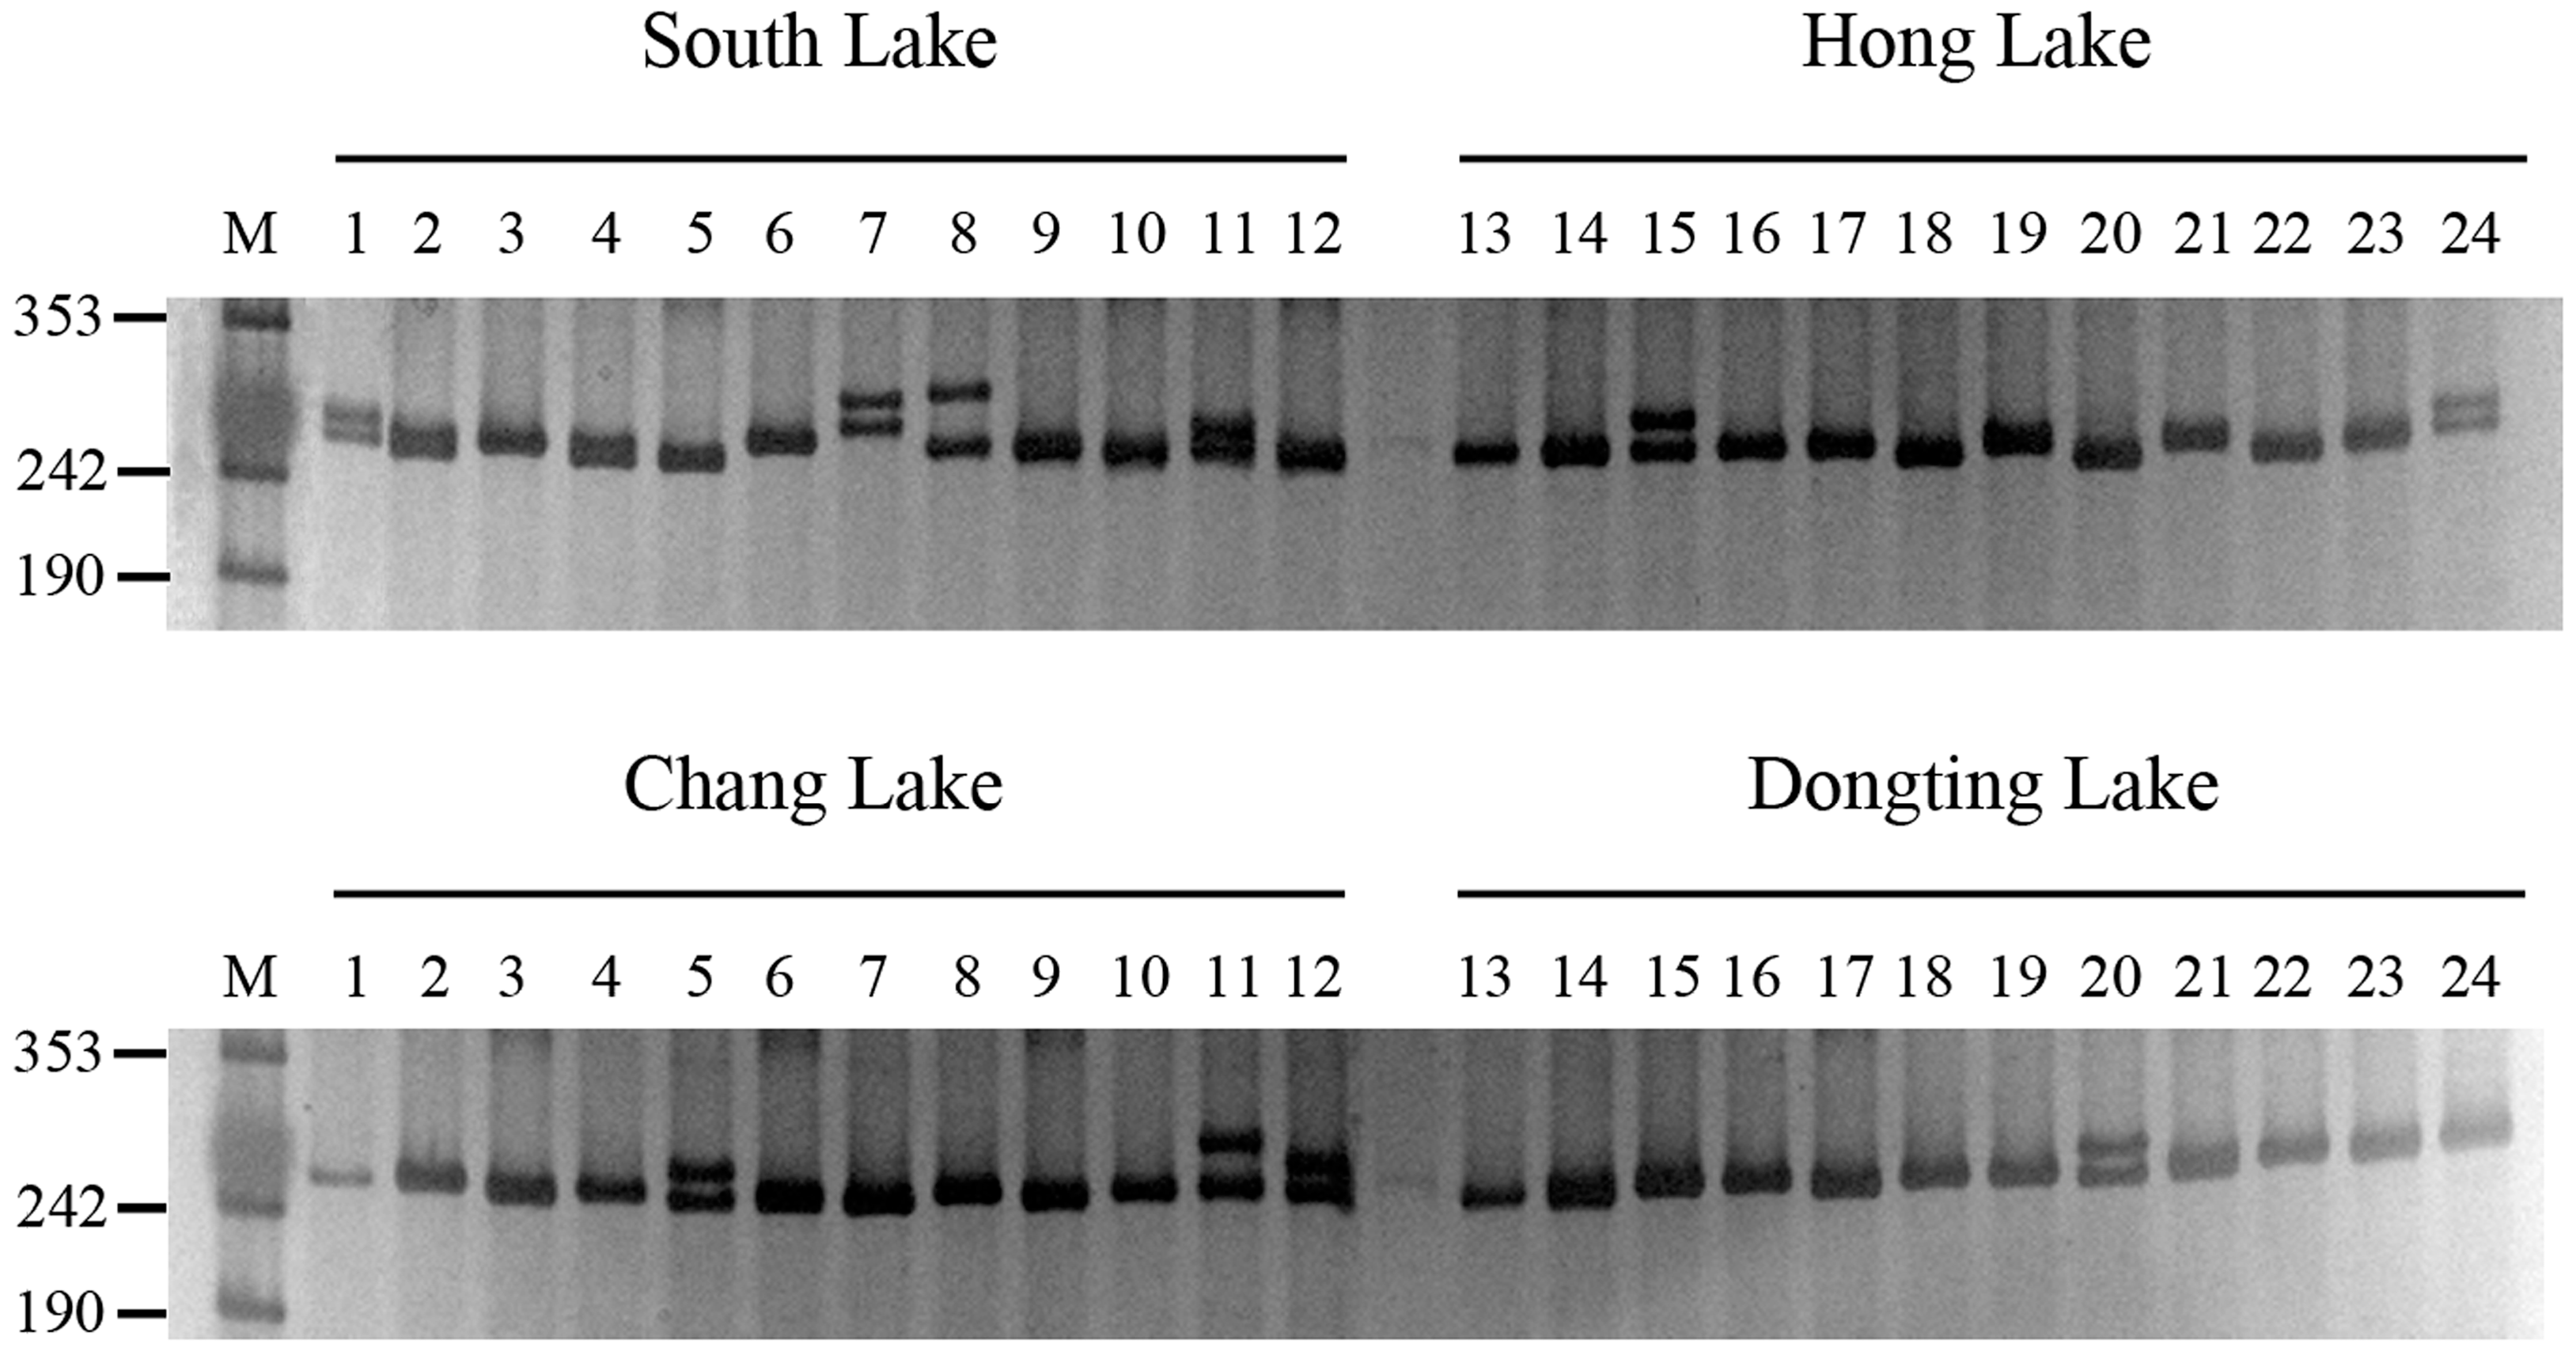
2.2. SSR Marker Development and Genetic Diversity Analysis
| EST-SSR | Repeat Motif | Primer Sequences (5'–3') | T a (°C) | Allele Size Range (bp) | Description of Putative Function | GenBank Accession No. | Heterozygosity | ||||
|---|---|---|---|---|---|---|---|---|---|---|---|
| NA | HO | HE | PIC | FIS | |||||||
| H2 | (AAT)13 | F: CTTCCAGGGGGCTTCTAAGT | 51 | 138–180 | F-box and WD repeat containing protein 7 | KM211716 | 7 | 0.604 | 0.831 | 0.80 | 0.266 |
| H6 | (ATAG)16 | F: TGTTGTAATCTCTCAATGAAGGTG | 53 | 252–348 | Transposable element Tc1 transposase | KM216910 | 13 | 0.729 | 0.865 | 0.84 | 0.148 |
| H13 | (GT)10 | F: AGAGCTAGGCCAAACTGCTG | 53 | 141–205 | Calcium binding protein 39 | KM236563 | 7 | 0.917 | 0.720 | 0.67 | −0.286 |
| H15 | (CA)15 | F: CTCGACCAGTCCTGAGCTTC | 53 | 209–240 | NF-kappa-B inhibitor beta | KM216912 | 5 | 0.271 | 0.565 | 0.47 | 0.515 |
| H16 | (CA)17 | F: GAGAGACAGCGAGCCTCAGT | 58 | 121–180 | NEDD4–like E3 ubiquitin protein ligase WWP2 | KM216871 | 16 | 1.000 | 0.924 | 0.91 | −0.094 |
| H17 | (TTA)14 | F: ACCACCTCCGAGACACGC | 57 | 110–172 | Hypothetical protein | KM216905 | 7 | 0.500 | 0.815 | 0.78 | 0.380 |
| H20 | (TTA)17 | F: ATGTGTTTCCCACAGTGCAG | 58 | 152–248 | No significant match | KM216903 | 11 | 0.542 | 0.824 | 0.80 | 0.336 |
| H28 | (TGGAGC)6 | F: GGGGCCTCTTGGGTTATTTA | 57 | 153–216 | Gonadal-soma derived growth factor precursor | KM216886 | 7 | 0.375 | 0.725 | 0.68 | 0.477 |
| H29 | (TTTTA)7 | F: GCCCTACAGCAGAGCTGAAC | 57 | 102–132 | Protein regulator of cytokinesis 1a | KM216864 | 4 | 0.417 | 0.550 | 0.47 | 0.234 |
| H32 | (TGATGT)8 | F: TTCGGGTAAAAAGTGATCCG | 58 | 197–345 | Predicted protein | KM216901 | 10 | 0.500 | 0.774 | 0.74 | 0.347 |
| H66 | (AG)7 | F: ATGGGATGACCAGGAGACAG | 59 | 263–300 | cAMP-dependent protein kinase catalytic subunit beta | KM236564 | 3 | 0.083 | 0.120 | 0.12 | 0.299 |
| H77 | (TG)7 | F: AAGCATAGATTTGCGCGTCT | 58 | 264–334 | Glucocorticoid receptor 2 | KM216888 | 3 | 0.354 | 0.298 | 0.26 | −0.201 |
| H78 | (GTAT)9 | F: GACCAAAGTGGATCGGACTC | 62 | 273–378 | Glucocorticoid receptor 2 | KM216909 | 3 | 1.000 | 0.552 | 0.44 | −0.829 |
| H84 | (AC)24 | F: TGTAAAGGGGGAAAACCACA | 58 | 202–284 | Low density lipoprotein receptor | KM216916 | 7 | 1.000 | 0.837 | 0.81 | −0.207 |
| H86 | (TG)11tc(TG)8 | F: CTCCTCCAGAGTGTCTTCGG | 59 | 255–305 | Adenylate cyclase type 5 | KM216892 | 9 | 0.917 | 0.715 | 0.66 | −0.297 |
| H89 | (TGGA)5 | F: AATGACAATAGGGTGCGGAG | 59 | 269–339 | No significant match | KM216896 | 3 | 0.208 | 0.194 | 0.18 | −0.085 |
| H96 | (GAAT)5 | F: GCACTCCGTCCAAGGTGTAT | 59 | 173–181 | No significant match | KM216857 | 2 | 0.292 | 0.252 | 0.22 | −0.171 |
| H106 | (TTCT)5 | F: TGATTTTTGGGACAGAGGAAA | 59 | 202–264 | No significant match | KM216856 | 14 | 0.604 | 0.903 | 0.88 | 0.324 |
| H107 | (TTCT)5 | F: TGATTTTTGGGACAGAGGAAA | 58 | 238–294 | No significant match | KM216891 | 5 | 0.375 | 0.622 | 0.56 | 0.391 |
| H109 | (TTTTG)6 | F: TATTTCCCTGTGGTGCTTCC | 58 | 275–315 | Heterogeneous nuclear ribonucleoprotein U protein 1 | KM216875 | 13 | 0.417 | 0.908 | 0.89 | 0.537 |
| H114 | (TCTGT)5 | F: TGAGGGGGTGCTAACTTTTG | 59 | 215–322 | Probable palmitoyltransferase ZDHHC20–like | KM216914 | 5 | 0.313 | 0.636 | 0.57 | 0.503 |
| H135 | (ATCTA)5 | F: GCATGACAGTGCTCGTTGTT | 59 | 140–225 | No significant match | KM216858 | 9 | 0.563 | 0.737 | 0.69 | 0.229 |
| H139 | (TTAGC)6 | F: GCTAGCGGCATTGTTAGCAT | 58 | 154–204 | Cyclin-dependent kinase 2 associated protein 2 | KM216895 | 4 | 0.042 | 0.609 | 0.52 | 0.931 |
| H147 | (TCTA)25 | F: TTGCCCAATTATACCACTTGC | 58 | 229-264 | Uncharacterized protein LOC101056656, partial | KM216859 | 14 | 0.563 | 0.818 | 0.79 | 0.305 |
| H149 | (ATCT)22 | F: TTGCACTTATTGGGGATGTG | 58 | 210–272 | Hypothetical protein PANDA_009670 | KM216860 | 11 | 0.604 | 0.790 | 0.76 | 0.227 |
| H151 | (TGTT)11 | F: CACTGATGATGGAATTGGGA | 59 | 143–183 | Glycogen phosphorylase, liver form | KM216904 | 5 | 0.438 | 0.711 | 0.65 | 0.378 |
| H152 | (AGTT)15 | F: GAAACGGATATTTAGTGGGGG | 59 | 191–252 | No significant match | KM216879 | 10 | 0.771 | 0.868 | 0.84 | 0.102 |
| H153 | (ACAT)12 | F: TGCCAGTATCTGACAACCCA | 58 | 164–204 | Collagen type IV alpha-3–binding protein-like | KM216898 | 8 | 0.625 | 0.762 | 0.72 | 0.172 |
| H154 | (TTTC)14 | F: GAACTGTCCTTTGCTTTCGC | 58 | 223–283 | E3 ubiquitin-protein ligase MIB2 | KM216861 | 17 | 0.604 | 0.924 | 0.91 | 0.339 |
| H155 | (AATA)15 | F: CCTTTCTATTGTGCGTTGGC | 59 | 232–344 | No significant match | KM216862 | 11 | 0.604 | 0.857 | 0.83 | 0.288 |
| H156 | (AAAT)15 | F: CATAACCGCACTGAATATGTGA | 58 | 211–259 | Family with sequence similarity 222, member B | KM216885 | 7 | 0.521 | 0.801 | 0.77 | 0.343 |
| H158 | (ATTT)16 | F: ATCCATGCATCCTTCACACA | 60 | 223–307 | No significant match | KM216894 | 6 | 0.500 | 0.753 | 0.71 | 0.329 |
| H159 | (ATCT)22 | F: TTCATTGCTTAGTCTAGTTTACATC | 58 | 217–332 | No significant match | KM216893 | 4 | 0.271 | 0.613 | 0.55 | 0.554 |
| H160 | (TTCT)11 | F: CGTTGCACATTGGTGGTTTA | 59 | 217–278 | No significant match | KM216865 | 14 | 0.417 | 0.751 | 0.73 | 0.440 |
| H161 | (CCAT)11 | F: AGCAACAGTCGAGGAGCATA | 59 | 161–202 | Hypothetical protein PANDA_019388 | KM216854 | 8 | 0.792 | 0.779 | 0.74 | −0.027 |
| H163 | (AAAT)11 | F: GCCTTGATCAGCTTTCTTCC | 58 | 286–382 | No significant match | KM216884 | 4 | 0.583 | 0.659 | 0.59 | 0.106 |
| H165 | (CACT)11 | F: GCGGAGACGCTTTCTGTATC | 58 | 171–255 | Muscle creatine kinase | KM216887 | 9 | 0.583 | 0.823 | 0.79 | 0.284 |
| H166 | (TGTT)11 | F: AGCGTTAGCGTTAGCATCGT | 58 | 157–233 | Hypothetical protein ZEAMMB73_428483 | KM216899 | 14 | 0.729 | 0.838 | 0.81 | 0.121 |
| H168 | (ATCC)10 | F: TGATCACGTGACCTCAGAGC | 58 | 258–334 | No significant match | KM216863 | 5 | 0.417 | 0.537 | 0.46 | 0.216 |
| H169 | (CATC)11 | F: CGATCACATGTCACTCCTCC | 58 | 221–292 | Rho GTPase-activating protein 7–like | KM216906 | 7 | 0.563 | 0.805 | 0.77 | 0.294 |
| H171 | (ATAC)10 | F: GATTCACCCAAAATGACATGG | 58 | 173–248 | Tribbles homolog 3 | KM216872 | 10 | 0.271 | 0.492 | 0.48 | 0.444 |
| H172 | (AGAA)10 | F: AGTGGTTCCGTTGAGGGTTT | 58 | 255–328 | No significant match | KM216913 | 6 | 0.500 | 0.762 | 0.72 | 0.337 |
| H176 | (AATA)10 | F: TGAAGGTCAGAAATGCAGAGC | 58 | 118–145 | No significant match | KM216876 | 5 | 0.833 | 0.761 | 0.71 | −0.107 |
| H203 | (TGAT)8 | F: CAGAGCCGGTGTTTCTTTTC | 58 | 131–157 | Protein LBH-like | KM216869 | 9 | 0.521 | 0.786 | 0.75 | 0.330 |
| H216 | (CTTT)8 | F: GATGATGAGTTGCATGACGC | 58 | 113–151 | No significant match | KM216874 | 6 | 0.625 | 0.729 | 0.69 | 0.134 |
| H217 | (ATTT)8 | F: CTCGAATGGAAAAACCATCTG | 58 | 231–257 | No significant match | KM216908 | 5 | 0.458 | 0.656 | 0.59 | 0.294 |
| H228 | (TTTA)8 | F: CGGAGACGCTTAAGGACTTG | 61 | 204–272 | Zgc:63767 protein | KM216915 | 12 | 0.354 | 0.835 | 0.81 | 0.572 |
| H229 | (ATTT)8 | F: TTTTGCAAACGAATATCACCA | 58 | 197–252 | No significant match | KM216907 | 11 | 0.479 | 0.765 | 0.74 | 0.367 |
| H233 | (ATCA)8 | F: CCACTCGGAAAGCTCAGAAC | 58 | 244–286 | No significant match | KM216890 | 8 | 0.229 | 0.497 | 0.47 | 0.534 |
| H237 | (TCTT)8 | F: TGGAGTAGTGCTGGTTCACG | 58 | 248–301 | No significant match | KM216880 | 12 | 0.458 | 0.841 | 0.82 | 0.449 |
| H246 | (ATA)9 | F: GACGCAGCTCGTGAATGTTA | 58 | 223–294 | No significant match | KM216883 | 10 | 0.625 | 0.821 | 0.79 | 0.230 |
| H249 | (ATT)13 | F: GGGGAATAGTTATGAAAATGGG | 58 | 276–326 | No significant match | KM216877 | 9 | 0.229 | 0.684 | 0.62 | 0.662 |
| H251 | (AATG)9 | F: CTGAGATAGGCACAGGCTCC | 58 | 244–324 | C1orf43–like protein | KM216866 | 9 | 0.375 | 0.656 | 0.63 | 0.423 |
| H254 | (ATAA)8 | F: TTCACTCAAATTCGTGTTCAAA | 58 | 282–319 | No significant match | KM216870 | 7 | 0.646 | 0.685 | 0.64 | 0.048 |
| H256 | (GAAT)8 | F: CAATGCACAAGCATGTAGGG | 58 | 212–346 | No significant match | KM216902 | 15 | 0.792 | 0.879 | 0.86 | 0.090 |
| H259 | (ATTT)12 | F: CAGCATGGCCTTTCTTTGTT | 56 | 263–326 | No significant match | KM216853 | 8 | 0.333 | 0.613 | 0.59 | 0.451 |
| H260 | (TCTG)17 | F: GGATGTGGAGAGGCTTTGAA | 58 | 218–248 | No significant match | KM216855 | 6 | 0.208 | 0.620 | 0.55 | 0.660 |
3. Experimental Section
3.1. Fish Samples
3.2. SSR Identification and Development of Primer Pairs
3.3. Genomic DNA Extraction, PCR Amplification and Electrophoresis
3.4. Evaluation of SSR Polymorphism and Genetic Diversity Analysis
4. Conclusions
Acknowledgments
Author Contributions
Conflicts of Interest
References
- Wang, Z.W.; Zhu, H.P.; Wang, D.; Jiang, F.F.; Guo, W.; Zhou, L.; Gui, J.F. A novel nucleo-cytoplasmic hybrid clone formed via androgenesis in polyploid gibel carp. BMC Res. Notes 2011, 4. [Google Scholar] [CrossRef]
- Gutierrez, A.P.; Lubieniecki, K.P.; Fukui, S.; Withler, R.E.; Swift, B.; Davidson, W.S. Detection of quantitative trait loci (QTL) related to grilsing and late sexual maturation in Atlantic salmon (Salmo salar). Mar. Biotechnol. 2014, 16, 103–110. [Google Scholar]
- Wang, D.; Mao, H.L.; Chen, H.X.; Liu, H.Q.; Gui, J.F. Isolation of Y- and X-linked SCAR markers in yellow catfish and application in the production of all-male populations. Anim. Genet. 2009, 40, 978–981. [Google Scholar]
- Kumla, S.; Doolgindachbaporn, S.; Sudmoon, R.; Sattayasai, N. Genetic variation, population structure and identification of yellow catfish, Mystus nemurus (C&V) in Thailand using RAPD, ISSR and SCAR marker. Mol. Biol. Rep. 2012, 39, 5201–5210. [Google Scholar]
- Fishery Bureau of Ministry of Agriculture PRC. China Fishery Statistical Yearbook; China Agriculture Press: Beijing, China, 2010. [Google Scholar]
- Gui, J.; Zhu, Z. Molecular basis and genetic improvement of economically important traits in aquaculture animals. Chin. Sci. Bull. 2012, 57, 1751–1760. [Google Scholar]
- Mei, J.; Gui, J.F. Genetic basis and biotechnological manipulation of sexual dimorphism and sex determination in fish. Sci. Chin. Life Sci. 2014, 57. in press. [Google Scholar]
- Toth, G.; Gaspari, Z.; Jurka, J. Microsatellites in different eukaryotic genomes: Survey and analysis. Genome Res. 2000, 10, 967–981. [Google Scholar]
- Chung, J.W.; Kim, T.S.; Suresh, S.; Lee, S.Y.; Cho, G.T. Development of 65 novel polymorphic cDNA-SSR markers in common vetch (Vicia sativa subsp. sativa) using next generation sequencing. Molecules 2013, 18, 8376–8392. [Google Scholar]
- Poetsch, M.; Bahnisch, E.; Ludescher, F.; Dammann, P. Maximising the power of discrimination is important in microsatellite-based paternity analysis in songbirds. J. Ornithol. 2012, 153, 873–880. [Google Scholar]
- Keong, B.P.; Siraj, S.S.; Daud, S.K.; Panandam, J.M.; Rahman, A.N.A. Identification of quantitative trait locus (QTL) linked to dorsal fin length from preliminary linkage map of molly fish, Poecilia sp. Gene 2014, 536, 114–117. [Google Scholar]
- Song, W.T.; Li, Y.Z.; Zhao, Y.W.; Liu, Y.; Niu, Y.Z.; Pang, R.Y.; Miao, G.D.; Liao, X.L.; Shao, C.W.; Gao, F.T.; et al. Construction of a High-Density Microsatellite Genetic Linkage Map and Mapping of Sexual and Growth-Related Traits in Half-Smooth Tongue Sole (Cynoglossus semilaevis). PLoS One 2012, 7. [Google Scholar] [CrossRef]
- Jia, X.D.; Wang, T.; Zhai, M.; Li, Y.R.; Guo, Z.R. Genetic diversity and identification of Chinese-grown pecan using ISSR and SSR markers. Molecules 2011, 16, 10078–10092. [Google Scholar]
- Ribas, L.; Pardo, B.G.; Fernandez, C.; Alvarez-Dios, J.A.; Gomez-Tato, A.; Quiroga, M.I.; Planas, J.V.; Sitja-Bobadilla, A.; Martinez, P.; Piferrer, F. A combined strategy involving Sanger and 454 pyrosequencing increases genomic resources to aid in the management of reproduction, disease control and genetic selection in the turbot (Scophthalmus maximus). BMC Genomics 2013, 14. [Google Scholar] [CrossRef]
- Wang, J.; Yu, X.; Zhao, K.; Zhang, Y.; Tong, J.; Peng, Z. Microsatellite Development for an Endangered Bream Megalobrama pellegrini (Teleostei, Cyprinidae) Using 454 Sequencing. Int. J. Mol. Sci. 2012, 13, 3009–3021. [Google Scholar]
- Dan, C.; Mei, J.; Wang, D.; Gui, J.F. Genetic differentiation and efficient sex-specific marker development of a pair of Y- and X-linked markers in yellow catfish. Int. J. Biol. Sci. 2013, 9, 1043–1049. [Google Scholar]
- Lawson, M.J.; Zhang, L. Housekeeping and tissue-specific genes differ in simple sequence repeats in the 5'-UTR region. Gene 2008, 407, 54–62. [Google Scholar]
- Fuganti, R.; Machado Mde, F.; Lopes, V.S.; Silva, J.F.; Arias, C.A.; Marin, S.R.; Binneck, E.; Abdelnoor, R.V.; Marcelino, F.C.; Nepomuceno, A.L. Size of AT(n) insertions in promoter region modulates Gmhsp17.6-L mRNA transcript levels. J. Biomed. Biotechnol. 2010. [Google Scholar] [CrossRef]
- Nagpure, N.S.; Rashid, I.; Pati, R.; Pathak, A.K.; Singh, M.; Singh, S.P.; Sarkar, U.K. FishMicrosat: A microsatellite database of commercially important fishes and shellfishes of the Indian subcontinent. BMC Genomics 2013, 14, 630. [Google Scholar] [CrossRef]
- Dutta, S.; Kumawat, G.; Singh, B.P.; Gupta, D.K.; Singh, S.; Dogra, V.; Gaikwad, K.; Sharma, T.R.; Raje, R.S.; Bandhopadhya, T.K.; et al. Development of genic-SSR markers by deep transcriptome sequencing in pigeonpea [Cajanus cajan (L.) Millspaugh]. BMC Plant. Biol. 2011, 11, 17. [Google Scholar] [CrossRef]
- Botstein, D.; White, R.L.; Skolnick, M.; Davis, R.W. Construction of a genetic linkage map in man using restriction fragment length polymorphisms. Am. J. Hum. Genet. 1980, 32, 314–331. [Google Scholar]
- Yadav, H.K.; Ranjan, A.; Asif, M.H.; Mantri, S.; Sawant, S.V.; Tuli, R. EST-derived SSR markers in Jatropha curcas L.: Development, characterization, polymorphism, and transferability across the species/genera. Tree Genet. Genomes 2010, 7, 207–219. [Google Scholar]
- Sample Availability: All samples are available from the authors.
© 2014 by the authors. Licensee MDPI, Basel, Switzerland. This article is an open access article distributed under the terms and conditions of the Creative Commons Attribution license ( http://creativecommons.org/licenses/by/4.0/).
Share and Cite
Zhang, J.; Ma, W.; Song, X.; Lin, Q.; Gui, J.-F.; Mei, J. Characterization and Development of EST-SSR Markers Derived from Transcriptome of Yellow Catfish. Molecules 2014, 19, 16402-16415. https://doi.org/10.3390/molecules191016402
Zhang J, Ma W, Song X, Lin Q, Gui J-F, Mei J. Characterization and Development of EST-SSR Markers Derived from Transcriptome of Yellow Catfish. Molecules. 2014; 19(10):16402-16415. https://doi.org/10.3390/molecules191016402
Chicago/Turabian StyleZhang, Jin, Wenge Ma, Xiaomin Song, Qiaohong Lin, Jian-Fang Gui, and Jie Mei. 2014. "Characterization and Development of EST-SSR Markers Derived from Transcriptome of Yellow Catfish" Molecules 19, no. 10: 16402-16415. https://doi.org/10.3390/molecules191016402
APA StyleZhang, J., Ma, W., Song, X., Lin, Q., Gui, J.-F., & Mei, J. (2014). Characterization and Development of EST-SSR Markers Derived from Transcriptome of Yellow Catfish. Molecules, 19(10), 16402-16415. https://doi.org/10.3390/molecules191016402