Article

Combined Mass Spectrometry-Based Metabolite Profiling of Different Pigmented Rice (Oryza sativa L.) Seeds and Correlation with Antioxidant Activities

1
Department of Bioscience and Biotechnology, Konkuk University, Seoul 143-701, Korea
2
National Academy of Agricultural Science, Rural Development Administration, Suwon 441-707, Korea
3
Department of Genetic Engineering and Crop Biotech Institute, College of Life Sciences, Kyung Hee University, Suwon 446-701, Korea
*
Author to whom correspondence should be addressed.
Molecules 2014, 19(10), 15673-15686; https://doi.org/10.3390/molecules191015673
Submission received: 8 August 2014 / Revised: 26 September 2014 / Accepted: 27 September 2014 / Published: 29 September 2014
(This article belongs to the Section Metabolites)

Abstract

:
Nine varieties of pigmented rice (Oryza sativa L.) seeds that were black, red, or white were used to perform metabolite profiling by using ultra-performance liquid chromatography-quadrupole-time-of-flight mass spectrometry (UPLC-Q-TOF-MS) and gas chromatography (GC) TOF-MS, to measure antioxidant activities. Clear grouping patterns determined by the color of the rice seeds were identified in principle component analysis (PCA) derived from UPLC-Q-TOF-MS. Cyanidin-3-glucoside, peonidin-3-glucoside, proanthocyanidin dimer, proanthocyanidin trimer, apigenin-6-C-glugosyl-8-C-arabiboside, tricin-O-rhamnoside-O-hexoside, and lipids were identified as significantly different secondary metabolites. In PCA score plots derived from GC-TOF-MS, Jakwangdo (JKD) and Ilpoom (IP) species were discriminated from the other rice seeds by PC1 and PC2. Valine, phenylalanine, adenosine, pyruvate, nicotinic acid, succinic acid, maleic acid, malonic acid, gluconic acid, xylose, fructose, glucose, maltose, and myo-inositol were significantly different primary metabolites in JKD species, while GABA, asparagine, xylitol, and sucrose were significantly distributed in IP species. Analysis of antioxidant activities revealed that black and red rice seeds had higher activity than white rice seeds. Cyanidin-3-glucoside, peonidin-3-glucoside, proanthocyanidin dimers, proanthocyanidin trimers, and catechin were highly correlated with antioxidant activities, and were more plentiful in black and red rice seeds. These results are expected to provide valuable information that could help improve and develop rice-breeding techniques.

Graphical Abstract

1. Introduction

Rice (Oryza sativa L.) is a staple cereal food, particularly in Asia, which accounts for 95% of global rice production and consumption [1]. Rice can be divided into two types: pigmented and non-pigmented. Non-pigmented rice is consumed by approximately 85% of the world’s population, while pigmented rice has been mostly consumed as a specialty in China, Japan, and Korea for its flavor and health benefits [2]. Black rice is frequently mixed with white rice during cooking to enhance flavor and nutritional value, and red rice is often used to make bread, ice cream, and liquor [3,4]. Recently, pigmented rice has attracted interest because it was reported to have potent antioxidant activities and a higher content of phenolic components [5]. The major active components of pigmented rice seeds are the anthocyanins and proanthocyanidins [6]. Anthocyanins possess antioxidant [7], anti-inflammatory [8], antitumor [9], and hypoglycemic effects [10]. Compared with anthocyanidins, proanthocyanidins, which can found in some cereals, legume seeds, and various fruits, have superior antioxidant activities [11].
Recently, metabolite profiling has been used as a valuable tool in many plant studies, including plant-derived food analysis [12], crop metabolite profiling [13], plant metabolite analysis [14,15], and in the development of plant-derived medicines [16]. The use of gas chromatography coupled with time-of-flight mass spectrometry (GC-TOF-MS) for metabolite analysis offers a number of advantages, including high reproducibility, rapid scan times, high sample throughput, and peak deconvolution (i.e., the capability to resolve overlapping peaks) [17]. The use of ultra-performance liquid chromatography-quadrupole-time-of-flight-mass spectrometry (UPLC-Q-TOF-MS) for metabolite analysis also offers many advantages, including accurate mass measurement, high resolution, and compound structure prediction [18].
Previously, rice metabolites have been extensively studied [19,20,21]. Gas chromatography–mass spectrometry (GC-MS) based metabolite analysis revealed differences in sugars, sugar alcohols, organic acids, amino acids, and fatty acid methyl esters among colored rice grains and also in the germination process [19,22]. Liquid chromatography–mass spectrometry (LC-MS) based targeted metabolite analysis of anthocyanin, carotenoid, and flavonoid compounds has also been performed [13,19,20,21,22,23]. In the case of Korean rice seeds, several studies have been reported. In particular, Park et al. and Kim et al. intensively revealed metabolites in a variety of Korean rice seeds including, Heugkwang (HK), Heugnam (HN), Heugjinju (HJJ), Hongjinju (HoJJ), Jeogjinju (JJJ), Hwaseong (HS), and Ilpoom (IP) cultivars by using GC-TOF-MS [21,24]. However, one of the Korean rice species Jakwangdo (JKD) has not been well studied, especially by using a metabolomics approach. Furthermore, all of these previous studies focused only on target metabolite analysis, or only the primary metabolites of rice seed. To the best of our knowledge, no previous metabolomics studies have used both GC-TOF-MS and UPLC-Q-TOF-MS, to compare overall metabolite differences between different Korean cultivars of rice seeds. In the present study, we performed metabolite profiling of nine different Korean pigmented rice (O. sativa) seeds by UPLC-Q-TOF-MS and GC-TOF-MS. In addition, we selected significantly different metabolites among different colors of rice seeds, and used them to perform a correlation analysis with the antioxidant activities.

2. Results and Discussion

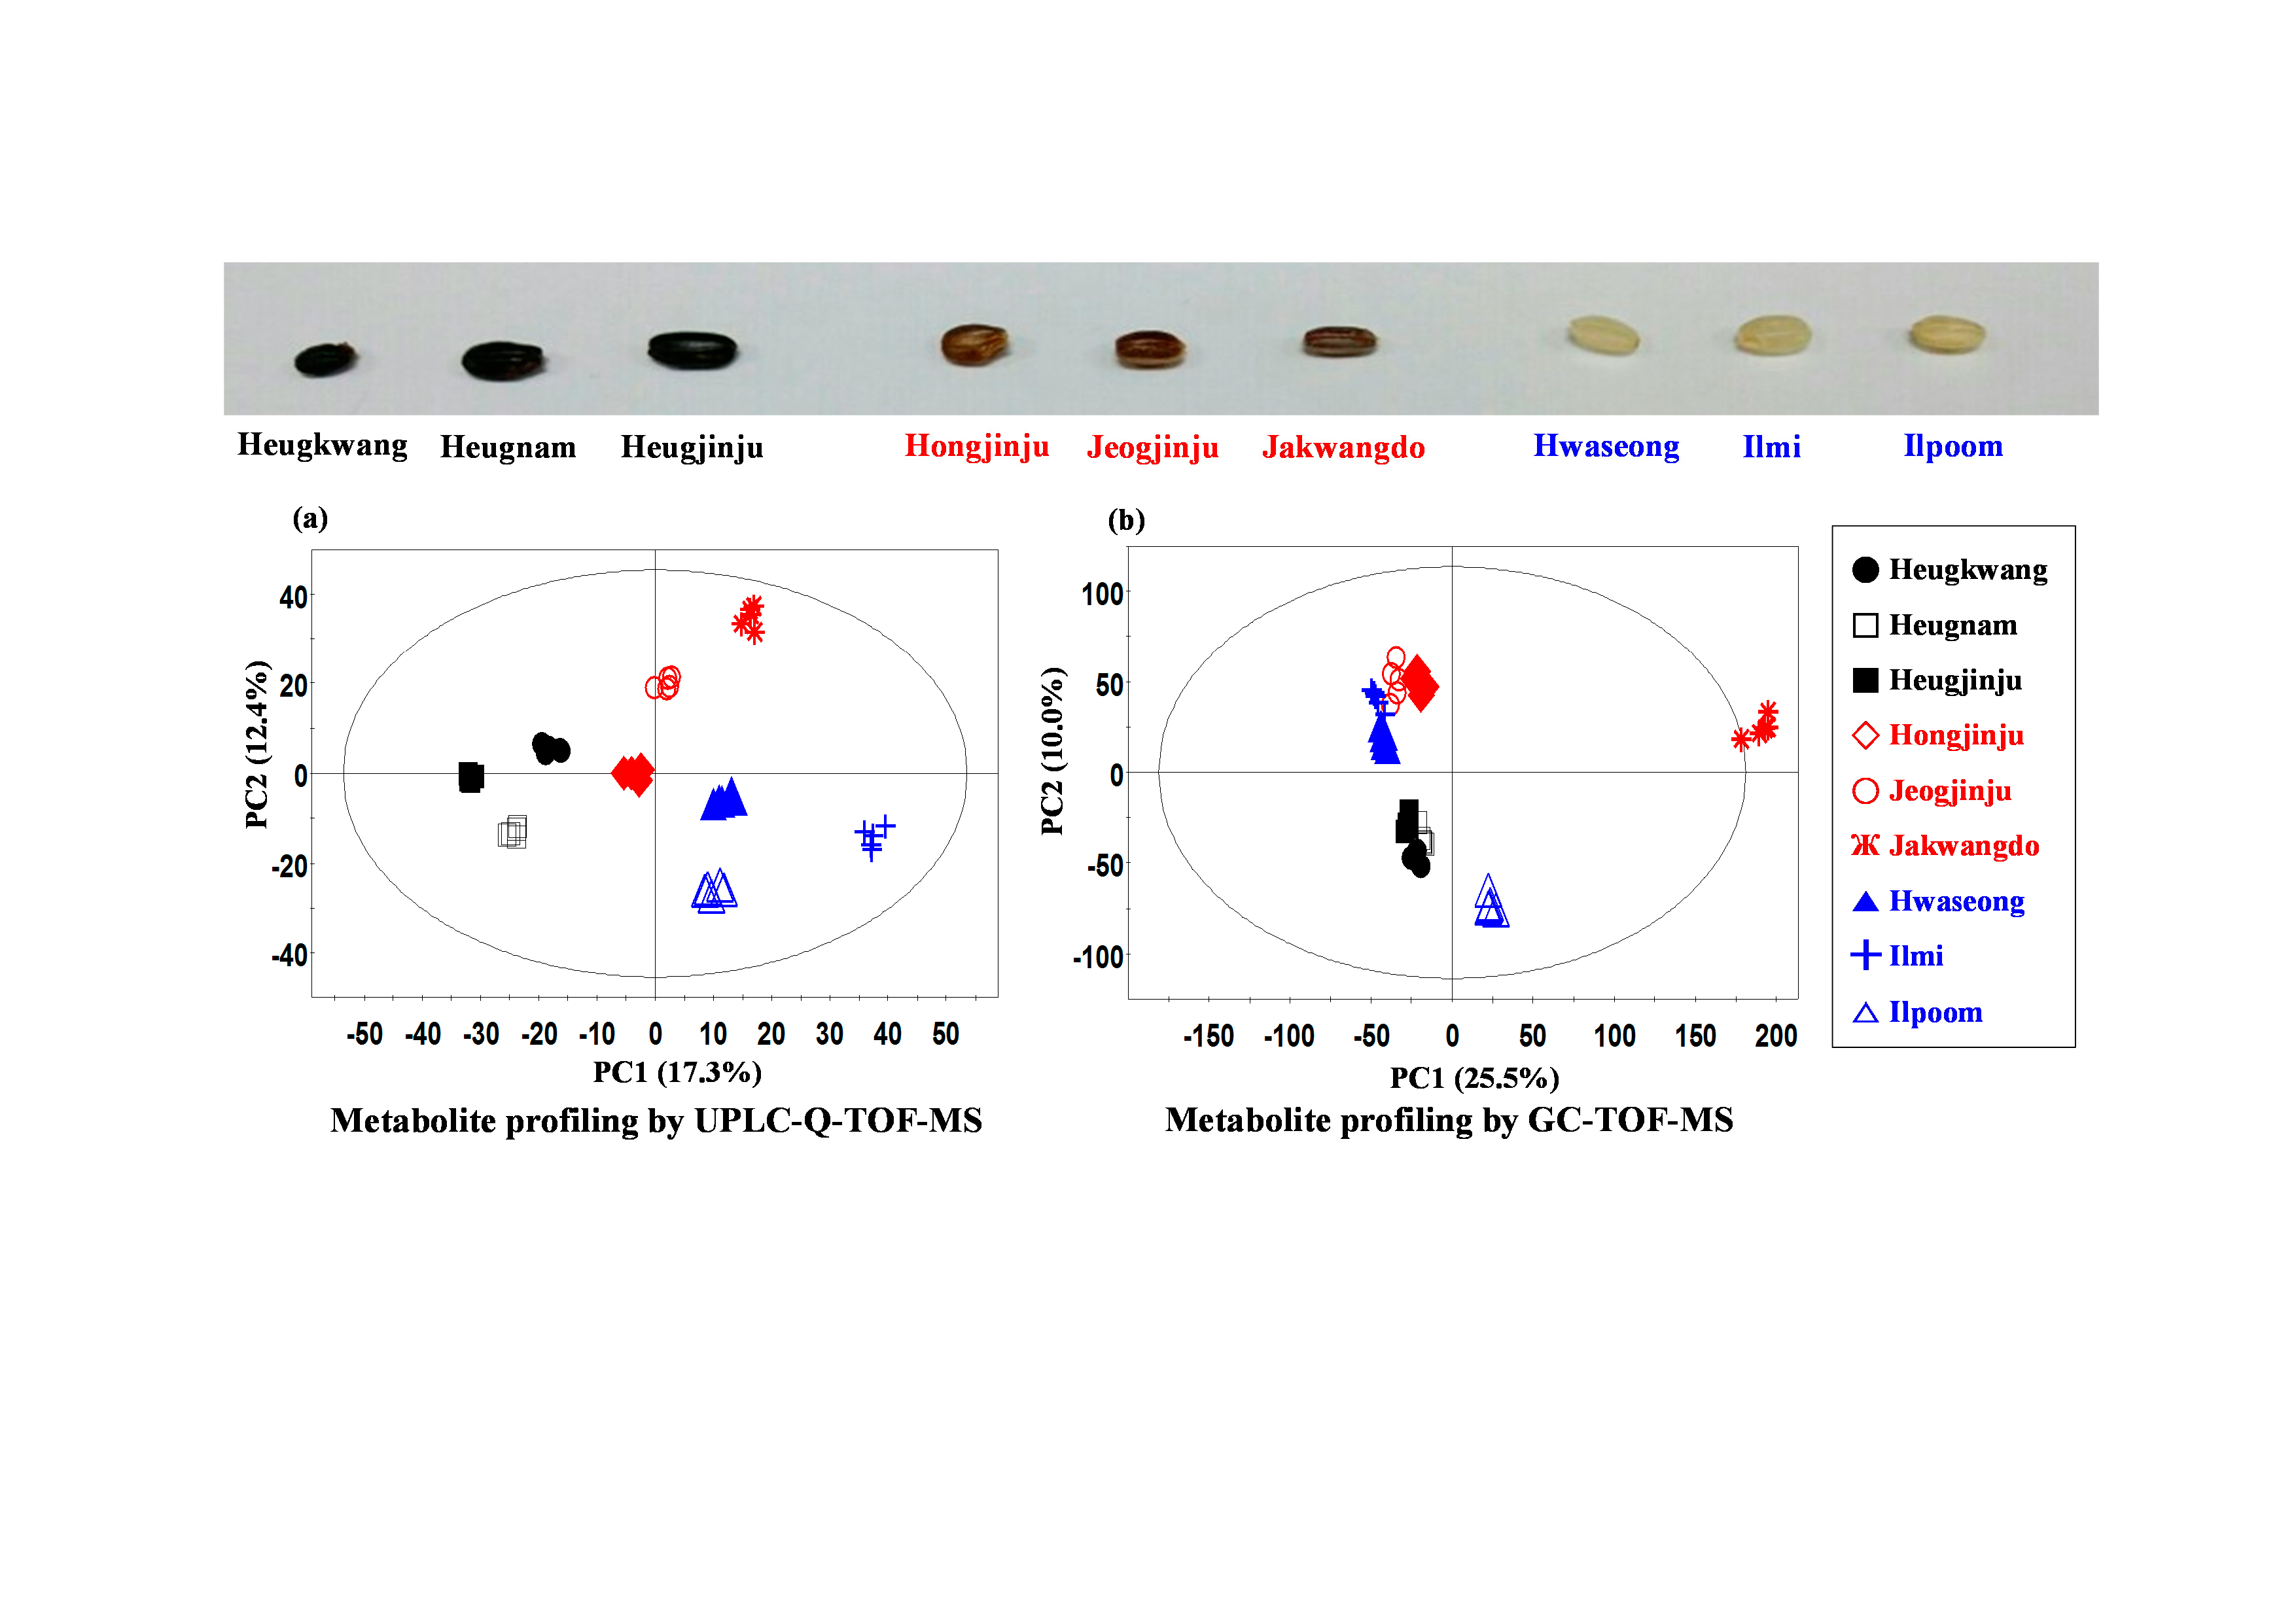
2.1. Metabolite Profiling of Different Pigmented Rice Seeds by UPLC-Q-TOF-MS

Seeds from nine species of rice were analyzed by UPLC-Q-TOF-MS, and multivariate analysis was performed. Using principle component analysis (PCA), clear color grouping distributions can be seen on the score plot (Figure 1a). Black color rice seeds, including HK, HN, and HJJ, and white color rice seeds, including HS, IM, and IP, were clearly distinguished by PC 1 (17.3%). Red color rice seeds were separated from black and white color rice seeds by PC 2 (12.4%). Similar formations could be seen in the partial least squares discriminant analysis (PLS-DA) (Figure 1b). Eleven secondary metabolites, such as cyanidin-3-glucoside, peonidin-3-glucoside, proanthocyanidin dimer, proanthocyanidin trimer, apigenin-6-c-glucosyl-8-c-arabionoside, tricin-O-rhamnoside-O-hexoside, pinellic acid, lysoPC 14:0, lysoPC 18:2, lysoPC 16:0, and lysoPC 18:1, were identified as being significantly different among the nine varieties of rice seeds. Assignment of metabolites was carried out using high-resolution mass data (i-fit, ppm), MSn fragment patterns, UV absorbance value, standard compounds, and references (Supplementary data, Table 1S). As shown in Figure 1c, relative contents of secondary metabolites among the nine varieties of rice seeds are shown by box-whisker plots. Cyanidin-3-glucoside and peonidin-3-glucoside, which are anthocyanin compounds, were detected only in black rice seeds. On the other hand, proanthocyanidin dimers and proanthocyanidin trimers, which are proanthocyanidin compounds, were only detected in red rice seeds. Usually, the anthocyanin contents were high in black rice seeds, and proanthocyanidin contents were high in red rice seeds. Finocchiaro et al. also suggested a similar distribution pattern of anthocyanin and proanthocyanidin in black and red rice seeds, respectively [25]. However, in our study anthocyanin compounds were only detected in black rice seeds and not in red rice seeds. Similarly, proanthocyanidin compounds were only detected in red rice seeds and were not detected in black rice seeds. However, our results are consistent with those of other studies that were unable to detect anthocyanin compounds in HoJJ and JJJ seeds [20]. Catechin, which is known as a precursor [26] of proanthocyanidins showed high distribution in JKD. In case of flavonoid compounds, tricin-O-rhamnoside-O-hexoside, and apigenin-6-C-glucosyl-8-C-arabionoside showed relatively high content in white rice seeds. These compounds are well known in white rice seeds [27,28,29]. In the case of lipids, lysoPCs are one of the main phospholipids present in rice and were found to have similar distribution patterns among rice seeds of the same color. However, there was some variability in distribution patterns between rice seeds of different colors. Pinellic acid has been isolated from rice cultivars in other studies [30], and a relatively high content of pinellic acid was found in JKD and IP seeds. Consequently, the color-specific patterns identified on the PCA score plot were mainly attributed to color-related metabolites anthocyanins and their precursors, proanthocyanidins and flavonoids.
Figure 1. The principal component analysis (PCA) score plots (a), partial least-square discriminant analysis (PLS-DA) score plots (b), and box-whisker plots (c) of nine different varieties of rice seeds analyzed by UPLC-Q-TOF-MS. Black rice seed: ● HK (Heugkwang), □ HN (Heugnam), ■ HJJ (Heugjinju); Red rice seed: Molecules 19 15673 i001 HoJJ (Hongjinju), Molecules 19 15673 i002 JJJ (Jeogjinju), Molecules 19 15673 i003 JKD (Jakwangdo); White rice seed: Molecules 19 15673 i004 HS (Hwaseong), Molecules 19 15673 i005 IM (Ilmi), Molecules 19 15673 i006 IP (Ilpoom). * Target identified.
Molecules 19 15673 g001

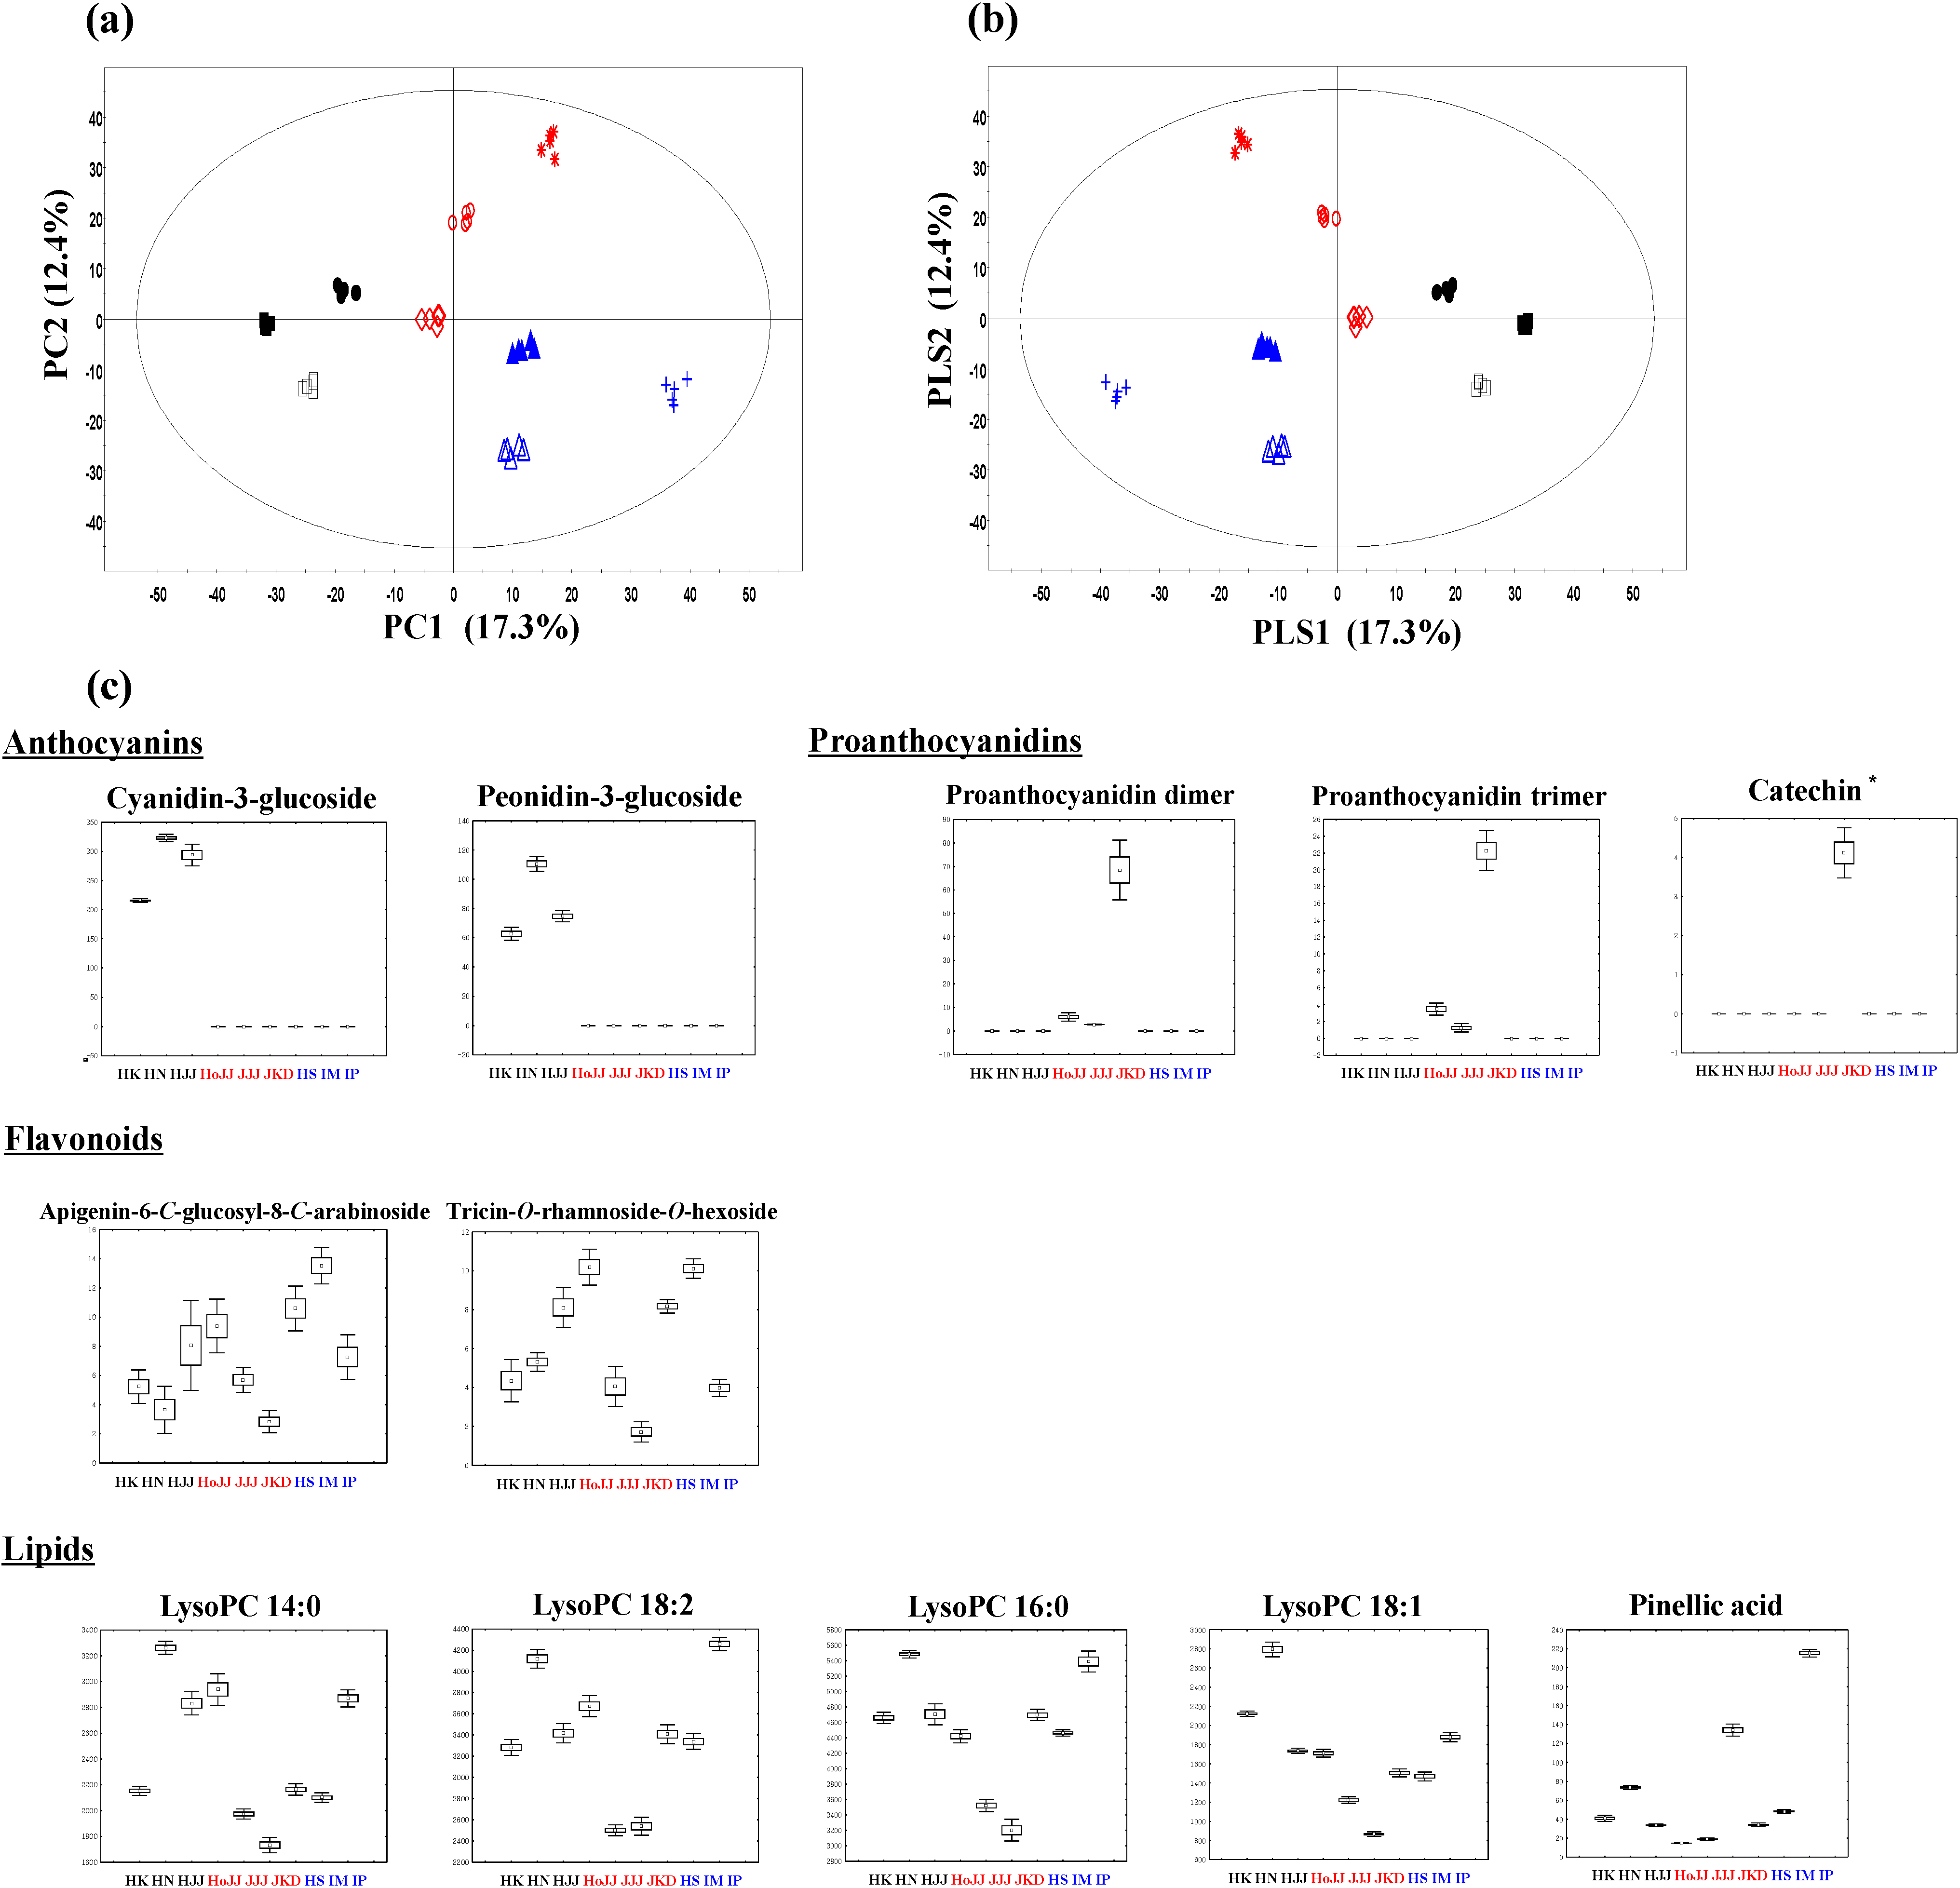
2.2. Metabolite Profiling of Different Pigmented Rice Seeds by GC-TOF-MS

To identify different primary metabolites between nine species of rice seeds, we performed GC-TOF-MS analysis, which we combined with multivariate analysis. According to the PCA plot (Figure 2a), JKD and IP species were distinguished from other species by PC1 (25.5%). Along with PC2 (10.0%), red rice (JKD, HoJJ, and JJJ) and white rice (IM and HS) were separated from white rice (IP) and black rice (HK, HN, and HJJ). On the basis of standard compounds, we identified a total of a 25 metabolites including 11 amino acids, seven sugars and sugar alcohols, and seven organic acids, as significantly different among nine rice seeds using VIP values (VIP > 0.7) and p values (p < 0.05). The retention times and MS fragment ions of these metabolites are summarized in Supplementary data, Table S2. The 25 identified metabolites from nine different varieties of rice seeds are presented by box-whisker plots (Figure 2c). Among them, glucose, sucrose, glutamic acid, and aspartic acid influence taste and function of the rice seeds, in particular, these metabolites directly affect the sweetness and palatability of cooked rice [31,32]. Valine, phenylalanine, adenosine, nicotinic acid, succinic acid, maleic acid, malonic acid, gluconic acid, xylose, fructose, glucose, myo-inositol, and maltose showed higher distribution in JKD species. The IP species-specific compounds were GABA, asparagine, sucrose, and xylitol. Functionally, GABA has been shown to suppress blood pressure and improve sleeplessness [33], and nicotinic acid has a lipid regulating effect [34]. Phenylalanine, which showed high contents in JKD, is a precursor of catechin and proanthocyanidin in the biosynthesis of phenylpropanoid compounds [26,35].
Figure 2. The principal component analysis (PCA) score plots (a), partial least-square discriminant analysis (PLS-DA) score plots (b), and box-whisker plots (c) of nine different varieties of rice seeds analyzed by UPLC-Q-TOF-MS. Black rice seed: ● HK (Heugkwang), □ HN (Heugnam), ■ HJJ (Heugjinju); Red rice seed: Molecules 19 15673 i001 HoJJ (Hongjinju), Molecules 19 15673 i002 JJJ (Jeogjinju), Molecules 19 15673 i003 JKD (Jakwangdo); White rice seed: Molecules 19 15673 i004 HS (Hwaseong), Molecules 19 15673 i005 IM (Ilmi), Molecules 19 15673 i006 IP (Ilpoom).
Molecules 19 15673 g002

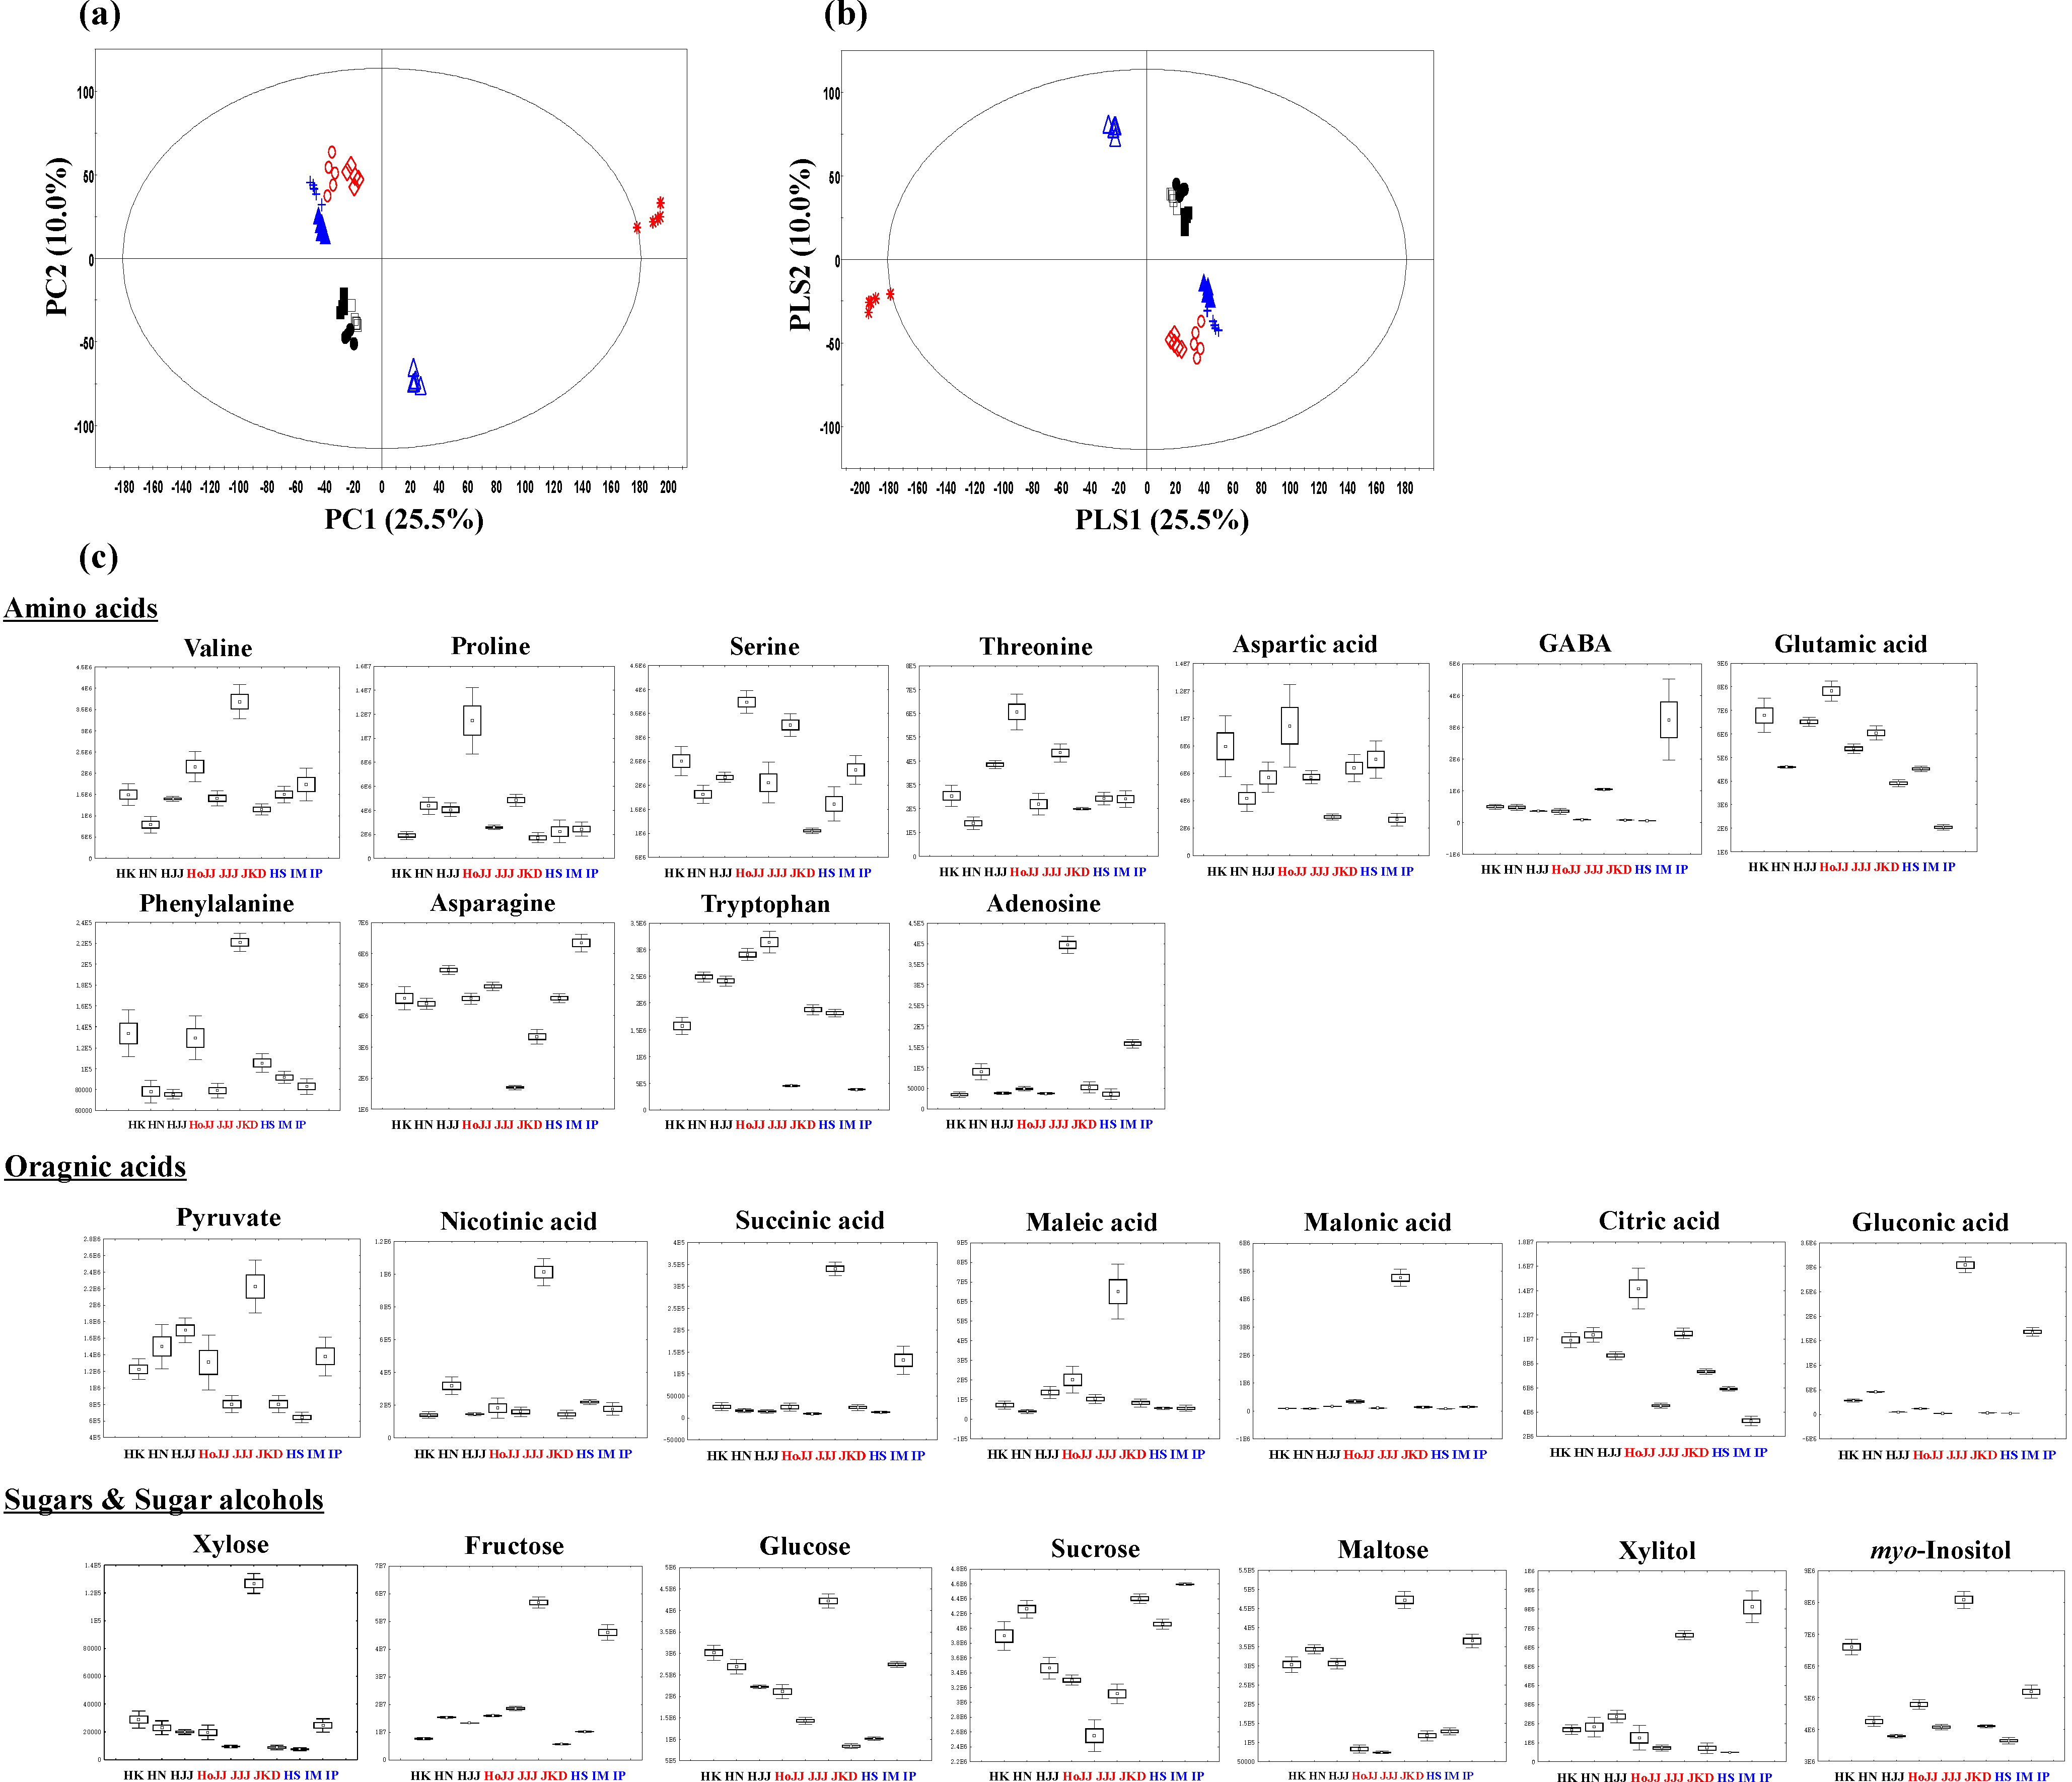
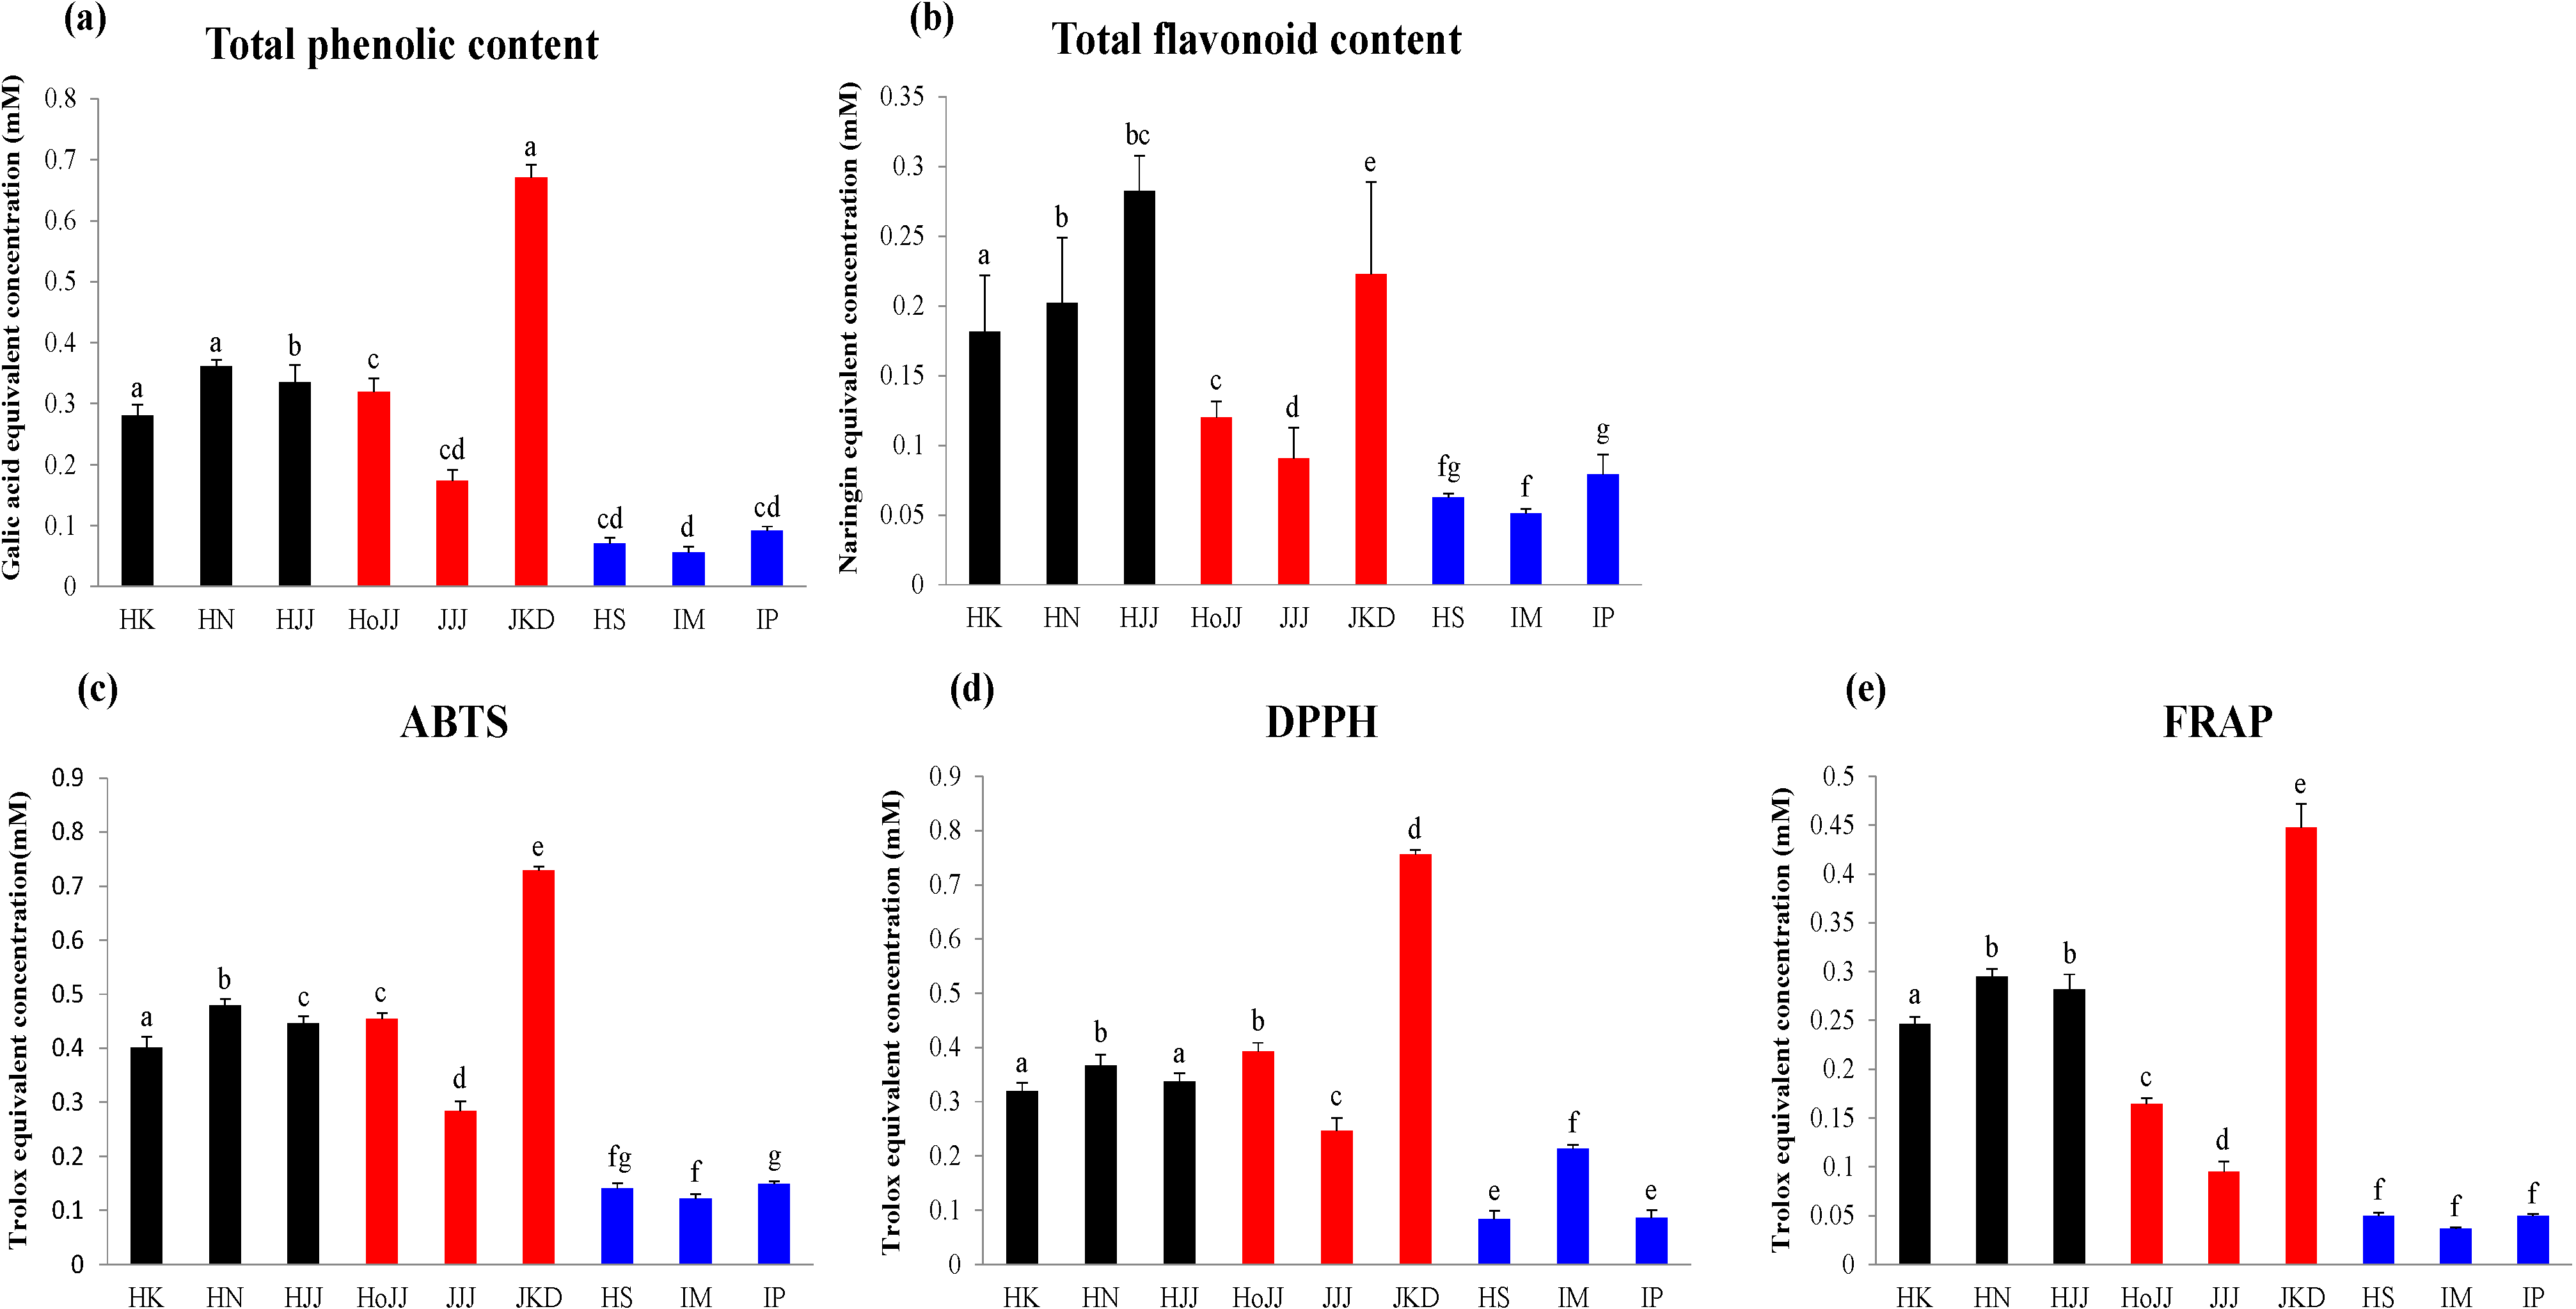
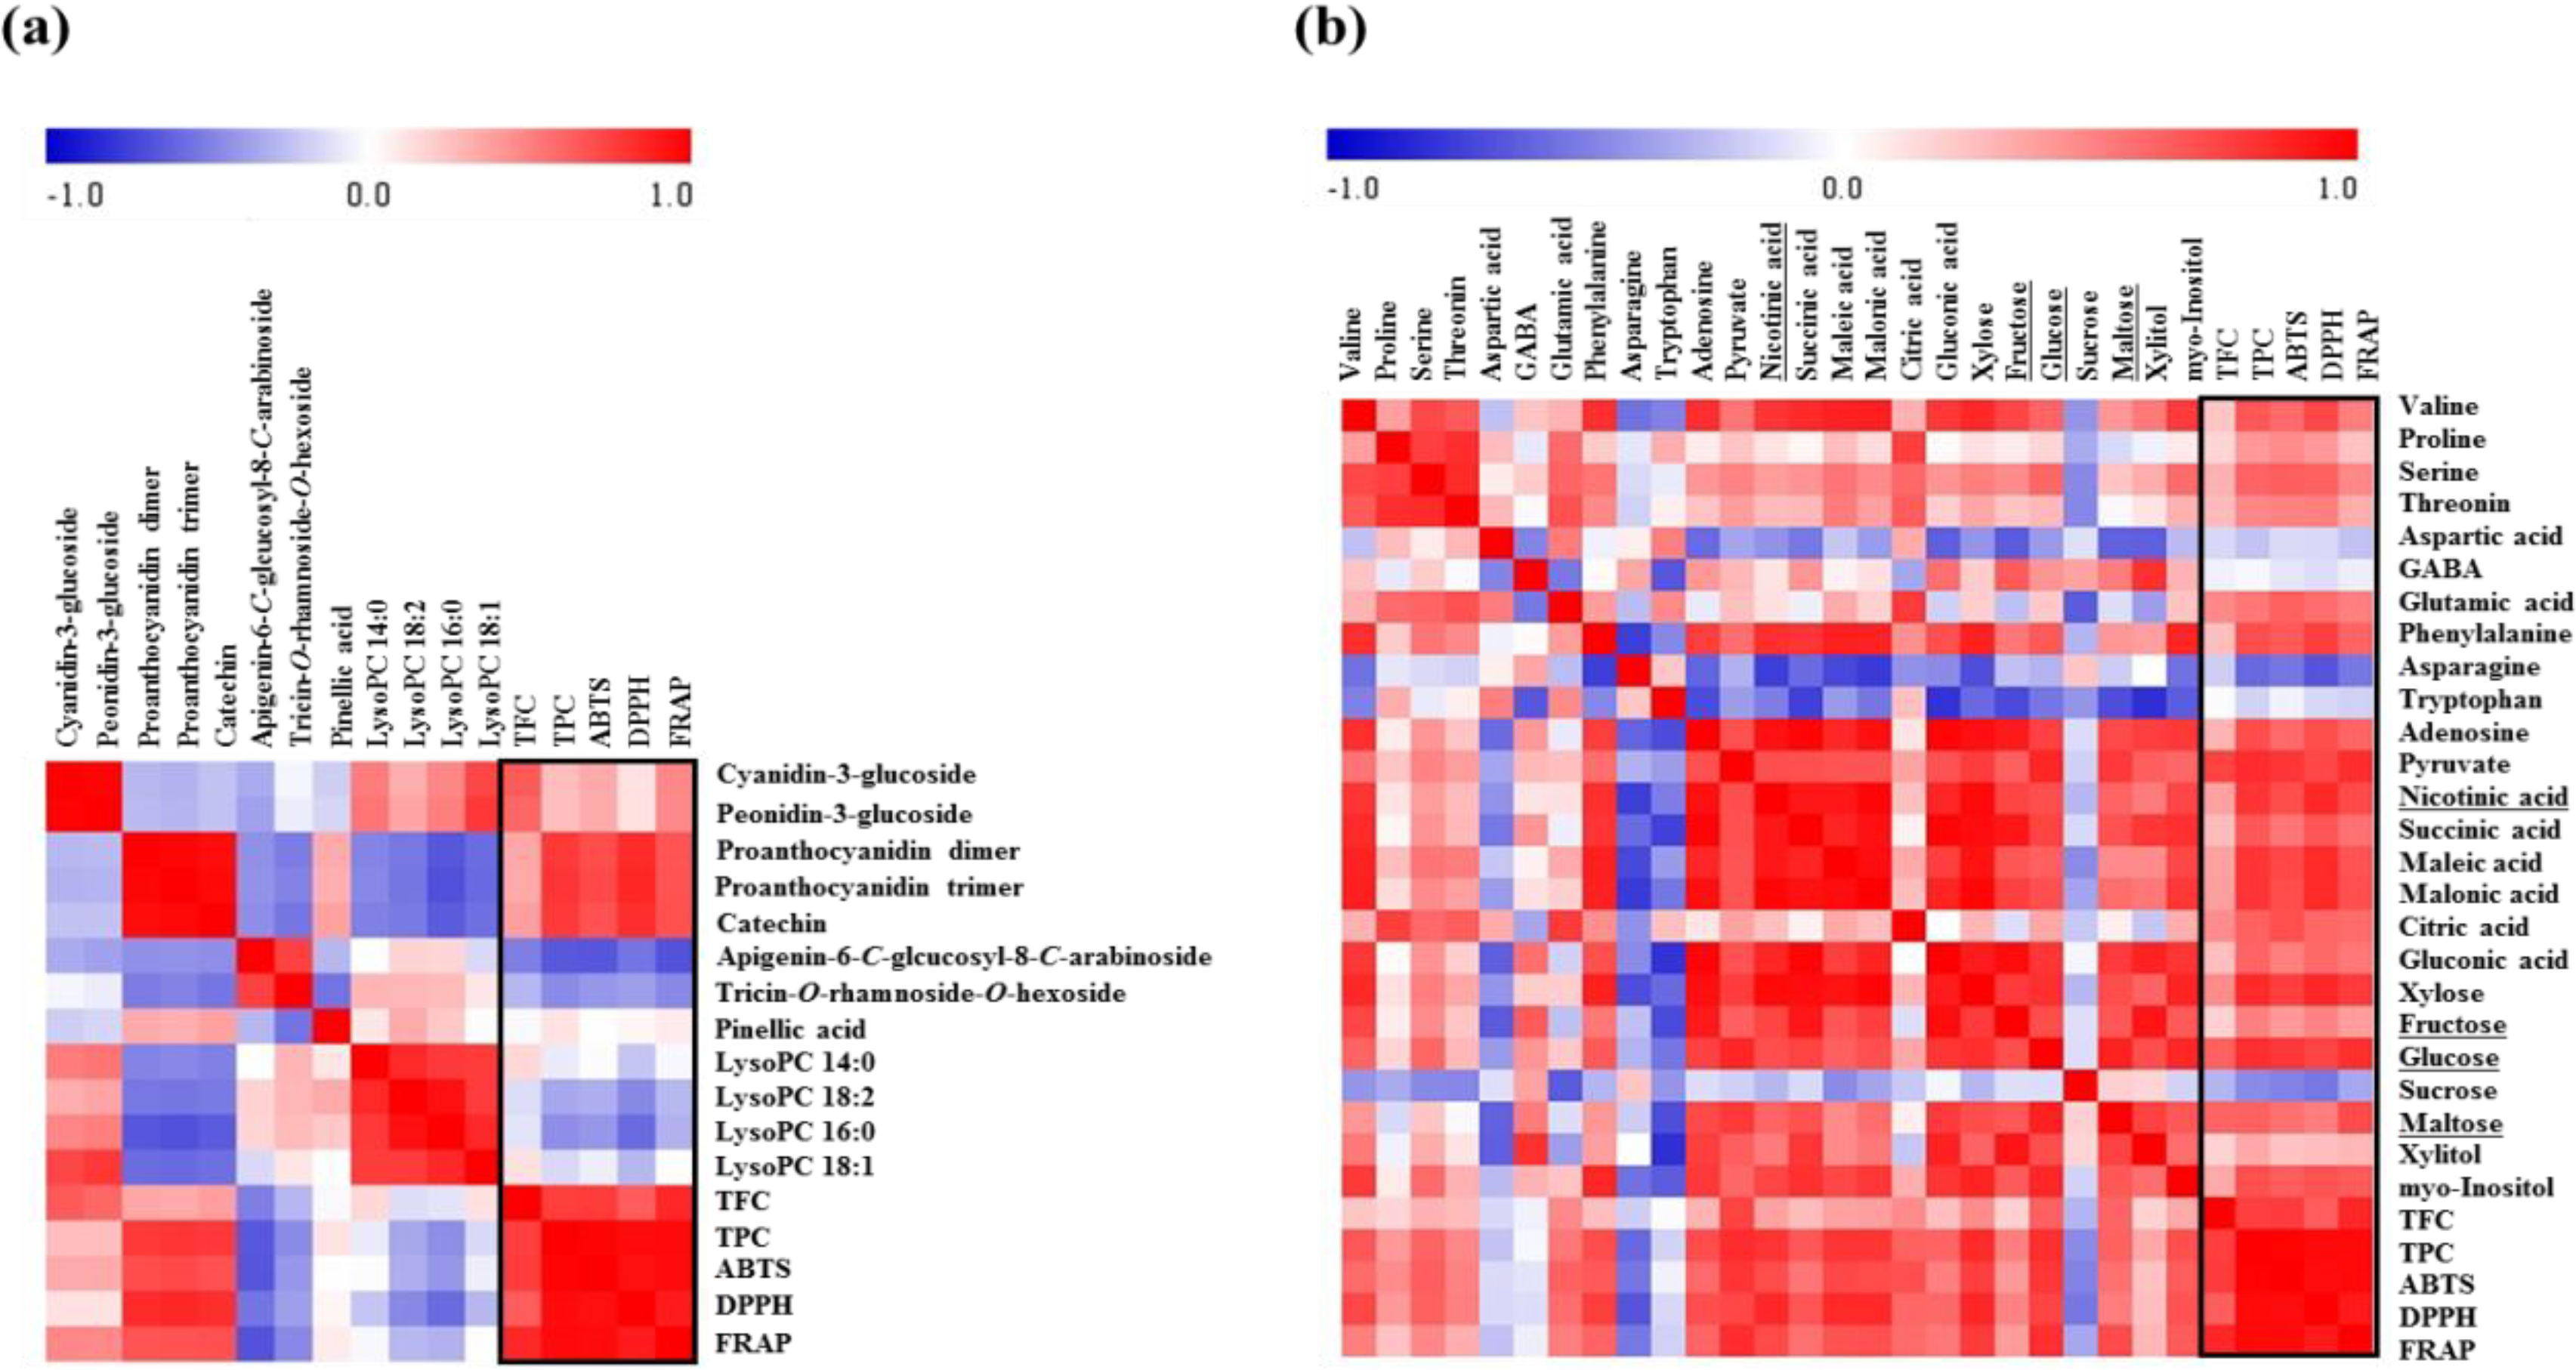
2.3. Correlation between Rice Seed Metabolites and Antioxidant Activities

To compare antioxidant activities between rice seeds, we measured antioxidant activity by using the following assays: ABTS, DPPH, and FRAP, TFC, and TPC (Figure 3). According to the results of the antioxidant activity assays, black and red rice seeds showed higher antioxidant activities than white rice seeds. In particular, one of the red seeds, JKD, showed the highest antioxidant activity. Results of TFC, showed the following order of antioxidant activities: black > red > white rice seeds. In TPC, the black and red rice seeds showed high total phenolic content compared with that in the white rice seeds, especially, the JKD species, which had the highest total phenolic contents. According to other studies, TPC showed a positive correlation with antioxidant activity (ABTS, DPPH, and FRAP) [36]. Anthocyanin and proanthocyanidin compounds possess antioxidant activities [2,6]. In particular, proanthocyanidin compounds are known to have considerable antioxidant activities, even higher than those possessed by anthocyanin compounds [11]. As shown in Figure 1c, cyanidin-3-glucoside and peonidin-3-glucoside were only detected in black rice seeds in the following order HN > HJJ > HK. Proanthocyanidin dimers and trimers were only detected in red rice seeds and were found to be particularly high in JKD species. Catechin, which is known as an antioxidant, was detected only in JKD seeds [36]. JKD seeds were found to possess remarkably high contents of TPC, proanthocyanidin dimers, proanthocyanidin trimers, and catechin, which correlate with their antioxidant activities. To visualize the correlation between metabolites and antioxidant activities, we produced a correlation map using Pearson’s correlation coefficient (Figure 4). As shown in Figure 4a, TPC and TFC showed a high positive correlation with antioxidant activities. Five secondary metabolites, cyanidin-3-glucoside, peonidin-3-glucoside, proanthocyanidin dimer, proanthocyanidin trimer, and catechin, showed positive correlation with antioxidant activities, while apigenin-6-C-glucosyl-8-C-arabionoside, tricin-O-rhamnoside-O-hexoside, and lipids showed negative correlation with antioxidant activities. Cyanidin-3-glucoside, peonidin-3-glucoside, proanthocyanidin dimer, proanthocyanidin trimer, and catechin have been reported to have high antioxidant activities in several studies [2,6]. In Figure 4b, correlation maps between metabolites analyzed by GC-TOF-MS and antioxidant activities are shown. Some amino acids (valine, proline, serine, threonine, glutamic acid, phenylalanine, and adenosine), organic acids (pyruvate, nicotinic acid, succinic acid, maleic acid, malonic acid, citric acid, gluconic acid), and sugars and sugar alcohols (xylose, fructose, glucose, myo-inositol, maltose) showed positive correlations with each other and also positively correlated with antioxidant activities (Figure 4b). Among these, fructose, glucose, and maltose were found to have measurable free radical scavenging activities by different methods in other studies, which can explain the antioxidant potentials of these compounds [37]. Furthermore, nicotinic acid has previously been reported to have antioxidant activities [38]. We suspected that JKD species would possess high antioxidant activities because of their high content of antioxidant compounds. This information will be useful for functional breeding in future.
Figure 3. Total flavonoid contents (a), total phenolic contents (b), and antioxidant activity assays, ABTS (c), DPPH (d), and FRAP (e) of nine different varieties of rice seeds. Values represent averages of triplicate measurements. Different letters indicate significantly different values, according to Duncan’s multiple range test.
Molecules 19 15673 g003
Figure 4. Correlation map of metabolites analyzed by UPLC-Q-TOF-MS and antioxidant activities (a) and correlation map of metabolites analyzed by GC-TOF-MS and antioxidant activities (b). Each square indicates r (Pearson’s correlation coefficient values for a pair of metabolites or antioxidant activities). The red color represents positive (0 < r < 1) correlation and blue color represents negative (−1 < r < 0) correlation.
Molecules 19 15673 g004

3. Experimental Section

3.1. Chemicals and Reagents

Water, methanol, and chloroform were purchased from Fisher Scientific (Pittsburgh, PA, USA). Methoxyamine hydrochloride, N-methyl-N-(trimethylsilyl) (MSTFA), pyridine, formic acid, 6-hydroxy-2,5,7,8-tetramethylchromane-2-carboxylic acid (Trolox), 1,1-diphenyl-2-picrylhydrazyl (DPPH), 2,2'-azinobis(3-ethylbenzothiazoline-6-sulfonic acid) diammonium salt (ABTS), 2,4,6,-tris(2-pyridyl)-s-triazine (TPTZ), Iron(III) chloride hexahydrate, acetic acid, sodium acetate, hydrochloride, Folin—Ciocalteu’s phenol reagent, sodium carbonate, diethylene glycol, potassium persulfate, and standard compounds were obtained from Sigma Chemical Co. (St. Louis, MO, USA).

3.2. Plant Materials

Rice (Oryza sativa L.) seeds were obtained from the Agricultural Genetic Resources Center at the National Academy of Agricultural Science (Suwon, Korea) and from the division of Rice Research at the National Institute of Crop Science (Suwon, Korea). Nine differently pigmented rice cultivars were used in this study and were categorized according to their pericarp color as follows; black: heugkwang (HK), heugnam (HN), and heugjinju (HJJ); red: hongjinju (HoJJ), jeogjinju (JJJ) and jakwangdo (JKD); and white: hwaseong (HS), ilmi (IM), and ilpoom (IP). Rice seeds were stored at 4 °C in a cold room before analysis.

3.3. Sample Preparation

The seeds were manually dehulled with a wooden rice dehuller and ground to a powder by using a mortar and pestle. The milled rice powders were stored at −80 °C until further use. Rice powders (100 mg) were extracted in 1 mL of mixed solvent (methanol/water/chloroform = 2.5:1:1 by vol.) by using a thermomixer (Eppendorf AG, Germany) at 700 rpm for 30 min at 37 °C. After the addition of 0.4 mL of water, samples were centrifuged for 10 min at 10,000 rpm at 25 °C. The polar phase was collected into a new tube and then dried in a speed vacuum concentrator (Biotron, Seoul, Korea). Prior to GC-TOF-MS analysis, methoximation and silylation were performed. The methyloxime derivative was added by dissolving the dried extracts in 50 μL of methoxyamine hydrochloride (20 mg/mL) in pyridine, and shaking for 90 min at 30 °C. After methoximation, the samples were silylated with 50 μL of MSTFA for 30 min at 37 °C. Prior to UPLC-Q-TOF-MS analysis, dried samples were resuspended in methanol.

3.4. GC-TOF-MS Analysis

We performed GC-TOF-MS by using an Agilent 7890A gas chromatograph system (Agilent, Atlanta, GA, USA) equipped with an Agilent 7693 autosampler, coupled to a Pegasus HT TOF mass spectrometer (Leco Corp., St. Joseph, MI, USA). We used an Rtx-5MS fused-silica capillary column (i.d. 30 m × 0.25 mm, 0.25 μm particle size; Restek Corp., Bellefonte, PA, USA) with helium gas at a constant flow rate of 1.0 mL/min. The temperature program was as follows: initial temperature of 75 °C for 2 min; followed by an increase to 300 °C at 15 °C/min; and a final 3-min hold at 300 °C. The injector and transfer line temperatures were 250 °C and 240 °C, respectively. The scanned mass range was 50–1000 m/z, and the electron energy was set at −70 eV.

3.5. UPLC-Q-TOF-MS and LC-IT-MS/MS Analysis

We performed UPLC by using a Waters Acquity UPLC system (Water Corp., Milford, MA, USA), equipped with a binary solvent delivery system, an autosampler, and a UV detector. The UPLC system contained an Acquity BEH C18 (i.d. 100 mm × 2.1 mm, 1.7-μm particle size; Waters Crop). The mobile phases, A and B, were composed of 0.1% (v/v) formic acid in water, and 0.1% (v/v) formic acid in acetonitrile, respectively. The initial condition was 5% solvent B for 1 min. The linear gradient was then increased from 5% solvent B to 100% solvent B over 9 min. The injection volume was 5 μL, and the flow rate was 0.3 mL/min. The Waters Q-TOF Premier (Micromass MS Technologies, Manchester, UK) was operated on both negative and positive ion modes with a mass range of 100–1000 m/z. The capillary and cone voltages were set to 3.0 kV and 30 V, respectively. The source temperature was set at 100 °C; the desolvation gas flow was 700 L/h at a temperature of 300 °C; the collision gas flow was 0.3 mL/min; and the collision energy was set at 5 eV. The V mode was used for mass spectrometry, and data were collected in the centroid mode with a scan accumulation time of 0.2 s. Leucine enkephalin was used as reference lock mass (m/z 554.2615 [−] and 556.2771 [+], 10 μL/min), using independent LockSpray interference.
We performed (LC-ESI-IT-MS/MS) by using a 212-LC binary gradient solvent delivery pump, a ProStar™ 410 autosampler, and a ProStar™ 335 photodiode array detector, coupled to a Varian 500-MS ion trap-mass spectrometer equipped with an electrospray interface (Varian Tech., Palo Alto, CA, USA). We separated 10 μL of sample on a PurSuit XRs C18 column (i.d. 100 mm × 2.0 mm; 3 μm particle size; Varian tech) with water (mobile A) and acetonitrile (mobile B) containing 0.1% formic acid at a flow rate of 0.2 mL/min. For sample analysis, the initial solvent condition was 10% solvent B; the gradient was then gradually increased from 10% solvent B to 100% solvent B over 25 min. We used a photodiode array set at 200–600 nm for detection and managed by PolyView 2000 (version 6.9) (Varian, Walnut Creek, CA). We performed tandem MS analysis using scan type turbo data-dependent scanning (DDS) through an m/z range of 50–2000. The parameters of negative and positive ion modes applied for each sample were as follows: drying temperature, 300 °C; needle voltage, 5 kV; drying gas pressure (nitrogen), 10 psi; and nebulizer gas pressure (air), 35 psi. Data were recorded in continuous mode within a mass scan mode of 15,000/s. The mass scan average was set at three microscans (2.19 s/scan).

3.6. Determination of Antioxidant Activities Using ABTS, DPPH, and FRAP Assays

We performed ABTS assay by following the method described by Re et al. with some modifications [39]. Briefly, we mixed 7 mM ABTS solution with 2.45 mM potassium persulfate solution, and stored the mixture for 12 h in the dark at room temperature. The solution was diluted until the absorbance measured at 734 nm reached 0.7 ± 0.03 by using a microplate reader. Next, we mixed 20 μL of each rice extract with 180 μL of diluted ABTS solution in 96-well plates, and incubated for 6 min in the dark. We then measured the absorbance at 734 nm using a microplate reader (BioTek Instruments, Winooski, VT, USA).
We performed the DPPH assay according to the method of Dietz et al. with some modifications [40]. We mixed 20 μL of each rice extract with 180 μL of DPPH ethanol solution (0.2 mM) in 96-well plates, and incubated for 20 min at room temperature. We then measured the absorbance at 515 nm, using a microplate reader.
We performed the ferric ion reducing antioxidant power (FRAP) assay according to the method of Benzie et al. with some modifications [41]. The FRAP reagent was freshly prepared by mixing acetate buffer (pH 3.6), 10 mM TPTZ (in 40 mM HCl solution), and 20 mM FeCl3·6H2O (in distilled water) at a ratio of 10:1:1. Next, we mixed 10 μL of rice extracts with 300 μL of FRAP solution in 96-well plates and incubated for 6 min at 37 °C. Then, we measured the absorbance at 570 nm using a microplate reader. All of the experiments were performed in triplicate, and all of the results are presented as the trolox equivalent antioxidant capacity, with concentration ranges of 0.0156–2 mM. All of the assays were performed same rice extracts of mass spectrometry analysis, and the analysis was conducted at a working concentration of 50 ppm.

3.7. Determination of Total Phenolic Contents (TPC) and Total Flavonoid Contents (TFC)

Total phenolic contents were determined as described by Singleton et al. with some modifications [42]. Briefly, we mixed 20 μL of extract from each sample and 100 μL of 0.2 N Folin-Ciocalteu’s phenol reagents in 96-well plates. After 5 min reaction in the dark, 80 μL of 7.5% Na2CO3 solution (in distilled water) was added to the mixture, which was then incubated for 60 min at room temperature. The absorbance was measured at 750 nm by using a microplate reader. The results are presented as the gallic acid equivalent concentration (ppm), with concentration ranges of 31.25–500 ppm.
Total flavonoid contents were also measured. Briefly, 20 μL of extract from each sample, 20 μL of 1 N NaOH, and 180 μL of 90% diethylene glycol (in distilled water) was placed in 96-well plates and was mixed and incubated for 60 min at room temperature. The absorbance was measured at 405 nm by using a microplate reader. The results are presented as the naringin equivalent concentration (ppm). The standard solution concentration curve ranged from 15.625 to 200 ppm. All experiments were carried out in triplicate.

3.8. Data Processing and Multivariate Analysis

We processed the GC-TOF-MS raw data files with Chroma TOF software (version 4.44; Leco Ltd., St. Joseph, MI, USA), and the UPLC-Q-TOF-MS raw data files with MassLynx software (version 4.1; Waters Corp, Milford, MA, USA). Each of the software packages converted the raw data files into netCDF (*.cdf) format. After conversion, we processed the CDF files with the MetAlign software [43] to obtain peak detection, alignment, and retention time correction. The resulting data were exported to Excel files (Microsoft, Redmond, WA, USA), and multivariate statistical analysis was performed with SIMCA-P+ software (version 12.0; Umetrics, Umea, Sweden). The log-transformed MS data were mean-centered with unit variance scaling. We performed principal component analysis (PCA) and partial least-square discriminant analysis (PLS-DA) to compare metabolite differences between samples. We selected metabolites with variable importance in the projection (VIP) values of > 0.7, and a p value < 0.05 was considered significant. Significantly different metabolites were represented by box-whisker plots using Statistica, version 7.0 (StatSoft Inc., Tulsa, OK, USA). For the TFC, TPC analysis, and antioxidant activity tests (ABTS, DPPH, and FRAP) differences were tested by analysis of variance and Duncan’s multiple range tests using PASW Statistics 18 (SPSS Inc., Chicago, IL, USA). Pairwise correlations between metabolites and TFC, TPC, and antioxidant activities were calculated by Pearson’s correlation coefficient test using PASW Statistics 18 (SPSS, Chicago, IL, USA) and correlation map represented using MEV software version 4.8 (multiple array viewer) [44].

4. Conclusions

In conclusion, we performed unbiased metabolomics profiling of pigmented rice seeds using UPLC-Q-TOF-MS and GC-TOF-MS. A PCA score plot, analyzed by UPLC-Q-TOF-MS, was clarified by the color of rice seeds viz., black, red, and white. Cyanidin-3-glucoside, peonidin-3-glucoside, proanthocyanidin dimers, proanthocyanidin trimers, and catechin exhibited color specific distributions across seed varieties, and were also found to have positive correlations with antioxidant activities. According to the PCA score plots derived from GC-TOF-MS, JKD and IP species were discriminated from other species of rice seed. Among significantly different primary metabolites, valine, phenylalanine, adenosine, pyruvate, nicotinic acid, succinic acid, maleic acid, malonic acid, gluconic acid, xylose, fructose, glucose, maltose, and myo-inositol were found in high concentrations in JKD species, while GABA, asparagine, and sucrose were highly concentrated in IP species. These include the antioxidants fructose, glucose, maltose, and nicotinic acid. We expected that JKD species, which are a red rice seed, would possess high antioxidant activities because of the high content of antioxidant compounds in this variety. This finding will be helpful for future functional breeding.

Supplementary Materials

Supplementary materials can be accessed at: https://www.mdpi.com/1420-3049/19/10/15673/s1. List of tentatively identified secondary metabolites from different of rice seeds using UPLC-Q-TOF-MS (Table S1) and significantly different primary metabolites identified from different species of rice seeds extracts using GC-TOF-MS (Table S2).

Supplementary Files

Supplementary File 1

Acknowledgments

This work was supported by a grant from the Next-Generation BioGreen 21 Program (No. PJ00952004), Rural Development Administration and as part of Konkuk University’s research support program for its faculty on sabbatical leave in 2013, and by the National Research Foundation of Korea (NRF) grant funded by the Korea government (MEST 2010-0019306).

Author Contributions

Choong Hwan Lee designed this research. Ga Ryun Kim performed the experiment and data analysis. Ga Ryun Kim, Eun Sung Jung, and Sarah Lee conducted the data interpretation. Sun-Hyung Lim and Sun-Hwa Ha cultivated materials and received sample information. Ga Ryun Kim wrote the paper.

Conflicts of Interest

The authors declare no conflict of interest.

References

  1. Bhattacharjee, P.; Singhal, R.S.; Kulkarni, P.R. Basmati rice: A review. Int. J. Food Sci. Technol. 2002, 37, 1–12. [Google Scholar] [CrossRef]
  2. Deng, G.F.; Xu, X.R.; Zhang, Y.; Li, D.; Gan, R.Y.; Li, H.B. Phenolic compounds and bioactivities of pigmented rice. Crit. Rev. Food Sci. 2013, 53, 296–306. [Google Scholar] [CrossRef]
  3. Yoshida, H.; Tomiyama, Y.; Mizushina, Y. Lipid components, fatty acids and triacylglycerol molecular species of black and red rices. Food Chem. 2010, 123, 210–215. [Google Scholar] [CrossRef]
  4. Abdel-Aal, E.S.M.; Young, J.C.; Rabalski, I. Anthocyanin composition in black, blue, pink, purple, and red cereal grains. J. Agric. Food Chem. 2006, 54, 4696–4704. [Google Scholar] [CrossRef] [PubMed]
  5. Vuchapong, J.; Sookserm, M.; Srijesdaruk, V.; Swatsitang, P.; Srijaranai, S. High performance liquid chromatigraphic analysis of phenolic compounds and their antioxidant activities in rice varieties. LWT-Food Sci. Technol. 2010, 43, 1325–1330. [Google Scholar] [CrossRef]
  6. Min, B.; Gu, L.; McClung, A.M.; Bergman, C.J.; Chen, M.H. Free and bound total phenolic concentrations, antioxidant capacities, and profiles of proanthocyanidins and anthocyanins in whole grain rice (Oryza sativa L.) of different bran colours. Food Chem. 2012, 133, 715–722. [Google Scholar] [CrossRef]
  7. Nam, S.H.; Choi, S.P.; Kang, M.Y.; Koh, H.J.; Kozukue, N.; Friedman, M. Antioxidative activities of bran extracts from twenty one pigmented rice cultivars. Food Chem. 2006, 94, 613–620. [Google Scholar] [CrossRef]
  8. Tsuda, T.; Horio, F.; Osawa, T. Cyanidin 3-O-beta-d-glucoside suppresses nitric oxide production during a zymosan treatment in rats. J. Nutr. Sci. Vitaminol. 2002, 48, 305–310. [Google Scholar] [CrossRef] [PubMed]
  9. Chang, W.; Mi, M.T.; Ling, W.H. Effects of anthocyanin-rich extract from black rice alone or combined with chemotherapeutic agents on proliferation of different cacner cells. Acta Acad. Med. Mlitaris. 2007, 29, 1943–1946. [Google Scholar]
  10. Guo, H.H.; Ling, W.H.; Wang, Q.; Liu, C.; Hu, Y.; Xia, M.; Feng, X.; Xia, X.D. Effect of Anthocyanin-Rich Extract from Black Rice (Oryza sativa L. indica) on Hyperlipidemia and Insulin Resistance in Fructose-Fed Rats. Plant Food. Hum. Nutr. 2007, 62, 1–6. [Google Scholar] [CrossRef]
  11. Gunaratne, A.; Wu, K.; Li, D.; Bentota, A.; Corke, H.; Cai, Y.Z. Antioxidant activity and nutritional quality of traditional red-grained rice varieties containing proanthocyanidins. Food Chem. 2013, 138, 1153–1161. [Google Scholar] [CrossRef] [PubMed]
  12. Davies, H.V.; Shepherd, L.V.T.; Stewart, D.; Frank, T.; Röhling, R.M.; Engel, K.H. Metabolome variability in crop plant species—when, where, how much and so what? Regul. Toxicol. Pharm. 2010, 58, S54–S61. [Google Scholar]
  13. Frank, T.; Meuleye, B.S.; Miller, A.; Shu, Q.Y.; Engel, K.H. Metabolite profiling of two low phytic acid (lpa) rice mutants. J. Agric. Food Chem. 2007, 55, 11011–11019. [Google Scholar] [CrossRef] [PubMed]
  14. Lee, S.; Do, S.G.; Kim, S.Y.; Kim, J.; Jin, Y.; Lee, C.H. Mass spectrometry-based metabolite profiling and antioxidant activity of aloe vera (Aloe barbadensis Miller) in different growth stages. J. Agric. Food Chem. 2012, 60, 11222–11228. [Google Scholar] [CrossRef] [PubMed]
  15. Jung, E.S.; Lee, S.; Lim, S.H.; Ha, S.H.; Liu, K.H.; Lee, C.H. Metabolite profiling of the short-term responses of rice leaves (Oryza sativa cv. Ilmi) cultivated under different LED lights and its correlations with antioxidant activities. Plant Sci. 2013, 210, 61–69. [Google Scholar] [CrossRef] [PubMed]
  16. Shyur, L.F.; Yang, N.S. Metabolomics for phytomedicine research and drug development. Curr. Opin. Chem. Biol. 2008, 12, 66–71. [Google Scholar] [CrossRef] [PubMed]
  17. Fernie, A.R.; Schauer, N. Metabolomics-assisted breeding: a viable option for crop improvement? Trends Genet. 2009, 25, 39–48. [Google Scholar] [CrossRef] [PubMed]
  18. Li, L.; Luo, G.A.; Liang, Q.L.; Hu, P.; Wang, Y.M. Rapid qualitative and quantitative analyses of Asian ginseng in adulterated American ginseng preparations by UPLC/Q-TOF-MS. J. Pharmaceut. Biomed. 2010, 52, 66–72. [Google Scholar] [CrossRef]
  19. Frank, T.; Reichardt, B.; Shu, Q.; Engel, K.H. Metabolite profiling of colored rice (Oryza sativa L.) grains. J. Cereal Sci. 2012, 55, 112–119. [Google Scholar] [CrossRef]
  20. Kim, J.K.; Lee, S.Y.; Chu, S.M.; Lim, S.H.; Suh, S.C.; Lee, Y.T.; Cho, H.S.; Ha, S.H. Variation and correlation analysis of flavonoids and carotenoids in Korean pigmented rice (Oryza sativa L.) cultivars. J. Agric. Food Chem. 2010, 58, 12804–12809. [Google Scholar] [CrossRef] [PubMed]
  21. Kim, J.K.; Park, S.Y.; Lim, S.H.; Yeo, Y.; Cho, H.S.; Ha, S.H. Comparative metabolic profiling of pigmented rice (Oryza sativa L.) cultivars reveals primary. J. Cereal Sci. 2013, 57, 14–20. [Google Scholar] [CrossRef]
  22. Shu, X.L.; Frank, T.; Shu, Q.Y.; Engel, K.H. Metabolite profiling of germinating rice seeds. J. Agric. Food Chem. 2008, 56, 11612–11620. [Google Scholar] [CrossRef] [PubMed]
  23. Sriseadka, T.; Wongpornchai, S.; Rayanakorn, M. Quantification of flavonoid in black rice by liquid chromatography-negative electrospray ionization tandem mass spectrometry. J. Agric. Food Chem. 2012, 60, 11723–11732. [Google Scholar] [CrossRef] [PubMed]
  24. Park, S.Y.; Ha, S.H.; Lim, S.H.; Jung, J.Y.; Lee, S.M.; Yeo, Y.; Kim, J.K. Determination of phenolic acids in Korean rice (Oryza sativa L.) cultivars using gas chromatography-time-of-flight mass spectrometry. Food Sci. Biotechnol. 2012, 21, 1141–1148. [Google Scholar] [CrossRef]
  25. Finocciaro, F.; Ferrari, B.; Gianinetti, A. A study of biodiversity of flavonoid content in the rice caryopsis evidencing simultaneous accumulation of anthocyanins and proanthocyanidins in a black-grained genotype. J. Cereal Sci. 2010, 10, 28–34. [Google Scholar] [CrossRef]
  26. Lim, S.H.; Ha, S.H. Marker development for the identification of rice seeds color. Plant Biotechnol. Rep. 2013, 7, 391–398. [Google Scholar] [CrossRef]
  27. Ferreres, F.; Andrade, P.B.; Valentão, P.; Gil-Izquierdo, A. Further knowledge on barley (Hordeum vulgare L.) leaves O-glycosyl-C-glycosyl flavones by liquid chromatography-UV diode-array detection-electrospray ionisation mass spectrometry. J. Chromatogr. A. 2008, 1182, 56–64. [Google Scholar] [CrossRef] [PubMed]
  28. Markham, K.R.; Tanner, G.J.; Caasi-Lit, M.; Whitecross, M.I.; Nayudu, M.; Mitchell, K.A. Possible protective role for 3',4'-dihydrowyflavones induced by enhanced UV-B in a UV-tolerant rice cultivar. Phytochemistry 1998, 49, 1913–1919. [Google Scholar] [CrossRef]
  29. Moheb, A.; Ibrahim, R.K.; Roy, R.; Sarhan, F. Changes in wheat leaf phenolome in response to cold acclimation. Phytochemistry 2011, 72, 2294–2307. [Google Scholar] [CrossRef] [PubMed]
  30. Suemune, H.; Harabe, T.; Sakai, K. Syntheses of unsaturated trihydroxy C-18 fatty acids isolated from rice plants suffering from rice blast disease. Chem. Pharm. Bull. 1988, 36, 3632–3637. [Google Scholar] [CrossRef]
  31. Kasai, M.; Ohishi, K.; Shimada, A.; Hatae, K. Taste properties of cooked rice based on an analysis of the cooked rice extracts. J. Cookery Sci. Jap. 2001, 34, 373–379. [Google Scholar]
  32. Saikusa, T.; Horino, T.; Mori, Y. Distribution of free amino acids in the rice kernel and kernel fractions and the effect of water soaking on the distribution. J. Agric. Food Chem. 1994, 42, 1122–1125. [Google Scholar] [CrossRef]
  33. Okada, T.; Sugishita, T.; Murakami, T.; Murai, H.; Saikusa, T.; Horino, T.; Onoda, A.; Kajimoto, O.; Takahashi, R.; Takahashi, T. Effect of the defatted rice germ enriched with GABA for sleeplessness, depression, autonomic disorder by oral administration. J. Jpn. Soc. Food Sci. 2000, 47, 596–603. [Google Scholar] [CrossRef]
  34. Ganji, S.H.; Zhang, L.H.; Kamanna, V.S.; Kashyap, M.L. Effect of niacin on lipoproteins and atherosclerosis. Future Med. 2006, 1, 549–557. [Google Scholar]
  35. Swain, T.; Williams, C.A. The role of phenylalanine in flavonoid biosynthesis. Phytochemistry 1970, 9, 2115–2122. [Google Scholar] [CrossRef]
  36. Sompong, R.; Siebenhandl-Ehn, S.; Linsberger-Martin, G.; Berghofer, E. Physicochemical and antioxidative properties of red and black rice varieties from Thailand, China and Sri Lanka. Food Chem. 2011, 124, 132–140. [Google Scholar] [CrossRef]
  37. Morelli, R.; Russo-Volpe, S.; Bruno, N.; Scalzo, R.L. Fenton-dependent damage to carbohydrates: Free radical scavengin activity of some simple sugars. J. Agric. Food Chem. 2003, 51, 7418–7425. [Google Scholar] [CrossRef] [PubMed]
  38. Ogata, S.; Takeuchi, M.; Teradaira, S.; Yamamoto, N.; Iwata, K.; Okumura, K.; Taguchi, H. Radical scavenging activities of niacin-related compounds. Biosci. Biotechnol. Biochem. 2002, 66, 641–645. [Google Scholar] [CrossRef] [PubMed]
  39. Re, R.; Pellegrini, N.; Proteggente, A.; Pannala, A.; Yang, M.; Rice-Evans, C. Antioxidanat activity applying an improved ABTS radical cation decolorization assay. Free Radic. Biol. Med. 1999, 26, 1231–1237. [Google Scholar] [CrossRef] [PubMed]
  40. Dietz, B.M.; Kang, Y.H.; Liu, G.; Eggler, A.L.; Yao, P.; Chadwick, L.R.; Pauli, G.F.; Farnsworth, N.R.; Mesecar, A.D.; van Breemen, R.B.; et al. Xanthohumol isolated from Humulus lupulus inhibits menadione-induced DNA damage through induction of quinone reductase. Chem. Res. Toxicol. 2005, 18, 1296–1305. [Google Scholar] [CrossRef] [PubMed]
  41. Benzie, I.F.F.; Strain, J.J. The ferric reducing ability if plasma (FRAP) as a measure of “antioxidant power”: The FRAP assay. Anal. Biochem. 1996, 239, 70–76. [Google Scholar] [CrossRef] [PubMed]
  42. Singleton, V.L.; Orthofer, R.; Lamuela-Raventos, R.M. Analysis of total phenols and other oxidation substrates and antioxidants by means of folin-ciocalteu reagent. Methods Enzymol. 1999, 299, 152–178. [Google Scholar]
  43. Wageningen UR for Quality of Life. Available online: http://www.metalign.nl (accessed on 25 September 2014).
  44. TM4: Microarray Software Suite. Available online: http://www.tm4.org/ (accessed on 25 September 2014).
  • Sample Availability: No available.

