The experiments were focused on the evolution of the polyphenolic composition, antioxidant potential, and color of Madeira wines submitted to the traditional accelerated ageing, with the purpose of establishing the influence of temperature on this class of compounds.
2.1. Polyphenolic Composition
The effect of the accelerated ageing on the polyphenolic composition was evaluated in total terms by spectrophotometric measurements and individual polyphenols by HPLC-DAD.
Table 1 summarizes the attained results in terms of total polyphenols (TP), total monomeric anthocyanins (TMA) and total flavonoids (TF). The results show that young wines produced from
TNM grapes (red wines) present similar levels of TP when compared with the white variety
Malvasia. This may be related to the fact that the fermentation of Madeira wines is usually performed as in white table wines, in the absence (or limited contact) of grape solids. Ageing can also affect the content of phenols, as they can suffer hydrolysis, oxidations and complexations, while temperature is known to increase degradation [
28]. Actually, Folin-Ciocalteu’s assay (frequently used to assess the TP) reveal that the process of
estufagem promoted some changes on the phenolic composition, but did not greatly affect the total content of polyphenols of the Madeira wines submitted to this procedure.
Although a maximum decrease of 25% was found in the 70 °C experiment with
Malvasia wine, the variations obtained for the other two wines in the same experiment were not significant (
p < 0.050). Under standard conditions (45 °C for three months) it was observed that the maximum loss was smaller and even non-significant in
TNM sweet (
Table 1). These results showed that temperature did not produce a consistent effect and that
estufagem can be applied without a high impact on the polyphenolic composition After the heating step at 45 °C, the TP was found to vary from 617.10 to 492.16 mg(GAE)/L in
Malvasia, and from 469.98 to 434.42 and 609.98 to 493.09 mg(GAE)/L in sweet and dry
TNM, respectively (
Table 1). TP final values range from 434.42 to 573.57 mg(GAE)/L, which were comparable with those presented in the literature for white wines [
29,
30,
31], or slightly higher [
32,
33,
34].
Table 1.
Total polyphenols (TP), total flavonoids (TF) and total monomeric anthocyanins (TMA) in Madeira wines at the initial stage and at the end of each month of heating at 45 °C (3 months) and 70 °C (1 month).
Table 1.
Total polyphenols (TP), total flavonoids (TF) and total monomeric anthocyanins (TMA) in Madeira wines at the initial stage and at the end of each month of heating at 45 °C (3 months) and 70 °C (1 month).
| Samples | TP mg(GAE)/L | ± SD | TMA mg(Cyd-3-glu)/L | ± SD | TF QE(mg/L) | ± SD |
|---|
| TNM sweet | 0 m | 469.98ab | 13.63 | 15.02a | 0.01 | 28.96a | 0.39 |
| 1 m, 45 °C | 332.17c | 9.58 | 4.43b | 0.03 | 23.47b | 1.55 |
| 2 m, 45 °C | 474.15b | 15.64 | 3.16c | 0.03 | 38.06c | 0.33 |
| 3 m, 45 °C | 434.42a | 9.03 | 0.93d | 0.02 | 30.70d | 0.54 |
| 1 m, 70 °C | 444.01ab | 17.21 | 1.62e | 0.05 | 51.44e | 0.60 |
| TNM dry | 0 m | 609.98a | 25.83 | 22.05a | 0.05 | 49.42a | 0.56 |
| 1 m, 45 °C | 576.68ab | 23.60 | 2.99b | 0.10 | 45.97ab | 0.31 |
| 2 m, 45 °C | 561.02b | 4.17 | 5.05c | 0.02 | 45.80b | 0.25 |
| 3 m, 45 °C | 493.09c | 3.04 | 2.50d | 0.02 | 45.39b | 0.16 |
| 1 m, 70 °C | 573.57ab | 6.37 | 0.30e | 0.04 | 82.87c | 2.92 |
| Malvasia | 0 m | 617.10a | 7.22 | - | 28.48a | 0.11 |
| 1 m, 45 °C | 565.11ab | 47.84 | - | 33.60a | 0.32 |
| 2 m, 45 °C | 517.12bc | 18.02 | - | 46.48b | 1.60 |
| 3 m, 45 °C | 492.16bd | 40.92 | - | 47.76b | 0.48 |
| 1 m, 70 °C | 466.02cd | 18.06 | - | 133.74c | 4.18 |
Although only responsible for up to 4% of the phenolics of
TNM wines, anthocyanins may also contribute to the decrease of the TP. The loss of anthocyanins was proved by the progressive decrease of the total monomeric anthocyanins (TMA) obtained in
TNM wines (
Table 1). The initial TF values were in general very low, ranging from 28.48 to 49.42 mg(QE)/L, as result of the small skin contact in winemaking. These values were close to those obtained by Mitić
et al. [
33] (between 45 and 81 mg/L, as catechin equivalents) when they analyzed 10 Serbian white wines using the same test. The flavonoids do not represent more than 8% of the total polyphenolic content of the wines at the initial circumstances and, surprisingly, the aluminium chloride assays revealed that TF values increased with the heating period, especially when overheating temperature was applied. This was not expected since it is frequently referred that flavonoids participate in several reactions, namely anthocyanin and flavanols degradation [
11], which could induce the decrease on the TF values. Eventually, other substances with capacity of reducing aluminium (III) are formed during this period and respond positively to this test. Regarding the HPLC-DAD analysis, sixteen polyphenols were identified in the current sample set of Madeira wines (
Table 2,
Table 3 and
Table 4), including non-flavonoids (six hydroxybenzoic acids, three hydroxycinnamic acids and one stilbene) and flavonoids (three flavonols and three flavan-3-ols). Additionally, two furans were also identified—5-hydroxymethylfurfural (HMF) and furfural.
Table 2.
Individual polyphenols and furans (mg/L) in TNM sweet wine during heating at 45 °C (3 months) and 70 °C (1 month).
Table 2.
Individual polyphenols and furans (mg/L) in TNM sweet wine during heating at 45 °C (3 months) and 70 °C (1 month).
| | TNM sweet |
|---|
| 0 m | ± SD | 1 m, 45 °C | ± SD | 2 m, 45 °C | ± SD | 3 m, 45 °C | ± SD | 1 m, 70 °C | ± SD |
|---|
| Non-flavonoids | | | | | | | | | | |
| Hydroxybenzoics | | | | | | | | | | |
| | Gallic acid | 3.70a | 0.01 | 4.91b | 0.07 | 5.29c | 0.03 | 6.23d | 0.12 | 9.16e | 0.09 |
| | Protocatechuic acid | 2.57a | 0.11 | 2.35b | 0.06 | 1.97c | 0.02 | 1.55d | 0.08 | 1.64d | 0.05 |
| | p-Hydroxybenzoic acid | 0.94a | 0.05 | 0.57b | 0.02 | 0.77c | 0.03 | 0.51b | 0.02 | 1.00a | 0.06 |
| | Vanillic acid | 2.52a | 0.09 | 2.57a | 0.06 | 2.23b | 0.06 | 2.24b | 0.11 | 3.08c | 0.08 |
| | Syringic acid | 4.89a | 0.06 | 5.29b | 0.08 | 5.03a | 0.18 | 5.03a | 0.06 | 5.93c | 0.04 |
| | Ellagic acid | n.d. | | n.d. | | n.d. | | n.d. | | n.d. | |
| | Total | 14.62 | | 15.69 | | 15.29 | | 15.56 | | 20.81 | |
| Hydroxycinnamates | | | | | | | | | | |
| | trans-Caftaric acid | 14.53a | 0.01 | 13.37b | 0.01 | 11.31c | 0.02 | 10.82d | 0.05 | 3.24e | 0.04 |
| | cis-Coutaric acid | 4.45a | 0.04 | 3.71b | 0.02 | 2.91c | 0.01 | 2.73d | 0.11 | 0.62e | 0.02 |
| | trans-Coutaric acid | 7.87a | 0.02 | 7.66b | 0.01 | 7.07c | 0.03 | 6.67d | 0.15 | 2.99e | 0.06 |
| | trans-Fertaric acid | 0.91a | 0.02 | 0.82b | 0.02 | 0.71c | 0.02 | 0.78b | 0.01 | 1.80d | 0.05 |
| | Unk 5 * | 2.20a | 0.04 | 2.57b | 0.10 | 2.34c | 0.03 | 2.40c | 0.03 | 2.70d | 0.02 |
| | Caffeic acid | 1.72a | 0.02 | 1.82a | 0.07 | 2.06b | 0.02 | 2.53c | 0.10 | 3.34d | 0.15 |
| | Unk 6 * | 1.96a | 0.05 | 2.07b | 0.02 | 1.91a | 0.01 | 2.05b | 0.02 | 2.09b | 0.01 |
| | p-Coumaric acid | 0.58a | 0.01 | 0.85b | 0.02 | 1.02c | 0.01 | 1.27d | 0.01 | 4.31e | 0.09 |
| | Ferulic acid | n.q. | | 0.45a | 0.02 | 0.47a | 0.00 | 0.68b | 0.03 | 0.45a | 0.02 |
| | Total | 34.22 | | 33.32 | | 29.81 | | 29.93 | | 21.52 | |
| Stilbene | | | | | | | | | | |
| | trans-Resveratrol | n.d. | | n.d. | | n.d. | | n.d. | | n.d. | |
| Flavonoids | | | | | | | | | | |
| Flavonols | | | | | | | | | | |
| | Unk 7 ** | 8.03a | 0.07 | 7.13b | 0.06 | 5.71c | 0.09 | 5.30d | 0.04 | 0.56e | 0.03 |
| | Myricetin | n.d. | | n.d. | | n.d. | | n.d. | | n.d. | |
| | Quercetin | n.q. | | n.q. | | n.q. | | 0.53a | 0.01 | 0.67b | 0.01 |
| | Kaempferol | n.q. | | n.q. | | n.q. | | n.q. | | n.q. | |
| | Total | 8.03 | | 7.13 | | 5.71 | | 5.83 | | 1.23 | |
| Flavan-3-ols | | | | | | | | | | |
| | (−)-Epigallocatechin | n.d. | | n.d. | | n.d. | | n.d. | | n.d. | |
| | (+)-Catechin | 3.94a | 0.02 | 2.49b | 0.05 | 1.48c | 0.02 | 0.93d | 0.03 | 0.47e | 0.00 |
| | (−)-Epicatechin | 0.92a | 0.01 | 0.65b | 0.03 | 0.47c | 0.03 | 0.40d | 0.01 | 0.36d | 0.01 |
| | Total | 4.86 | | 3.13 | | 1.95 | | 1.32 | | 0.84 | |
| Furans | | | | | | | | | | |
| | HMF | 1.56a | 0.02 | 17.90b | 0.00 | 49.32c | 0.03 | 97.50d | 0.12 | 1728.07e | 2.80 |
| | Furfural | n.d. | | n.q. | | 2.02a | 0.05 | 3.08b | 0.05 | 20.26c | 0.18 |
| | Total | 1.56 | | 17.90 | | 51.34 | | 100.58 | | 1748.32 | |
Table 3.
Individual polyphenols and furans (mg/L) in TNM dry wine during heating at 45 °C (3 months) and 70 °C (1 month).
Table 3.
Individual polyphenols and furans (mg/L) in TNM dry wine during heating at 45 °C (3 months) and 70 °C (1 month).
| | TNM dry |
|---|
| 0 m | ± SD | 1 m, 45 °C | ± SD | 2 m, 45 °C | ± SD | 3 m, 45 °C | ± SD | 1 m, 70 °C | ± SD |
|---|
| Non-flavonoids | | | | | | | | | | |
| Hydroxybenzoics | | | | | | | | | | |
| | Gallic acid | 9.47a | 0.37 | 9.81a | 0.01 | 9.91a | 0.14 | 9.50a | 0.05 | 10.44b | 0.08 |
| | Protocatechuic acid | 6.84a | 0.39 | 3.53b | 0.15 | 2.47c | 0.14 | 2.19c | 0.09 | 4.74d | 0.06 |
| | p-Hydroxybenzoic acid | 1.15a | 0.02 | 1.31b | 0.05 | 1.22ab | 0.06 | 1.28ab | 0.04 | 1.67c | 0.06 |
| | Vanillic acid | 4.92a | 0.17 | 3.81b | 0.11 | 3.42c | 0.03 | 3.23c | 0.06 | 3.27c | 0.08 |
| | Syringic acid | 3.39a | 0.16 | 3.72b | 0.05 | 4.27c | 0.09 | 4.11c | 0.08 | 4.90d | 0.04 |
| | Ellagic acid | n.q. | | n.q. | | n.q. | | n.q. | | n.q. | |
| | Total | 25.77 | | 22.18 | | 21.29 | | 20.31 | | 25.02 | |
| Hydroxycinnamates | | | | | | | | | | |
| | trans-Caftaric acid | 37.34a | 0.14 | 32.78b | 0.02 | 27.63c | 0.01 | 27.64c | 0.04 | 5.71d | 0.02 |
| | cis-Coutaric acid | 5.14a | 0.02 | 4.37b | 0.05 | 3.69c | 0.04 | 3.67c | 0.00 | 0.64d | 0.01 |
| | trans-Coutaric acid | 20.55a | 0.15 | 19.60b | 0.04 | 17.37c | 0.08 | 17.32c | 0.01 | 5.03d | 0.12 |
| | trans-Fertaric acid | n.d. | | n.d. | | n.d. | | n.d. | | n.d. | |
| | Unk 5 * | 2.20a | 0.06 | 2.66b | 0.01 | 2.68b | 0.03 | 2.66b | 0.03 | 2.93c | 0.01 |
| | Caffeic acid | 2.75a | 0.09 | 4.29b | 0.03 | 5.18c | 0.04 | 5.21c | 0.04 | 6.00d | 0.02 |
| | Unk 6 * | 1.63a | 0.03 | 2.19b | 0.03 | 2.19b | 0.08 | 2.19b | 0.06 | 2.62c | 0.03 |
| | p-Coumaric acid | 1.61a | 0.03 | 2.31b | 0.05 | 2.78c | 0.04 | 2.77c | 0.00 | 8.32d | 0.02 |
| | Ferulic acid | 0.45a | 0.01 | 0.66b | 0.02 | 0.66b | 0.01 | 0.65b | 0.02 | 0.51c | 0.02 |
| | Total | 71.69 | | 68.85 | | 62.19 | | 62.12 | | 31.76 | |
| Stilbene | | | | | | | | | | |
| | trans-Resveratrol | 0.63a | | 0.51b | 0.01 | n.q. | | n.q. | | n.q. | |
| Flavonoids | | | | | | | | | | |
| Flavonols | | | | | | | | | | |
| | Unk 7 ** | 6.13a | 0.03 | 4.93b | 0.07 | 4.04c | 0.06 | 3.98c | 0.10 | 0.46d | 0.01 |
| | Myricetin | 0.71a | 0.03 | 0.75a | 0.01 | 0.72a | 0.01 | n.q. | | 1.15b | 0.03 |
| | Quercetin | 0.82a | 0.01 | 0.89b | 0.01 | 0.81a | 0.01 | 0.81a | 0.01 | 1.53c | 0.01 |
| | Kaempferol | n.q. | | n.q. | | n.q. | | n.q. | | n.q. | |
| | Total | 7.66a | | 6.57 | | 5.56 | | 4.79 | | 3.15 | |
| Flavan-3-ols | | | | | | | | | | |
| | (−)-Epigallocatechin | 3.54a | 0.12 | 3.18b | 0.06 | 1.47c | 0.04 | 1.41c | 0.05 | n.d. | |
| | (+)-Catechin | 16.19a | 0.02 | 13.06b | 0.06 | 6.16c | 0.06 | 6.20c | 0.04 | 4.27d | 0.11 |
| | (−)-Epicatechin | 4.78a | 0.18 | 3.21b | 0.06 | 1.46c | 0.07 | 1.30c | 0.06 | 1.07d | 0.03 |
| | Total | 24.52 | | 19.45 | | 9.08 | | 8.91 | | 5.33 | |
| Furans | | | | | | | | | | |
| | HMF | n.d. | | 1.61a | 0.01 | 2.70b | 0.03 | 2.68b | 0.03 | 41.28c | 0.05 |
| | Furfural | n.d. | | n.q. | | 1.66a | 0.01 | 1.65b | 0.00 | 12.20c | 0.02 |
| | Total | 0.00 | | 1.61 | | 4.36 | | 4.33 | | 53.47 | |
Table 4.
Individual polyphenols and furans (mg/L) in Malvasia wine during heating at 45 °C (3 months) and 70 °C (1 month).
Table 4.
Individual polyphenols and furans (mg/L) in Malvasia wine during heating at 45 °C (3 months) and 70 °C (1 month).
| | Malvasia |
|---|
| 0 m | ± SD | 1 m, 45 °C | ± SD | 2 m, 45 °C | ± SD | 3 m, 45 °C | ± SD | 1 m, 70 °C | ± SD |
|---|
| Non-flavonoids | | | | | | | | | | |
| Hydroxybenzoics | | | | | | | | | | |
| | Gallic acid | 11.62a | 0.42 | 13.73bc | 0.07 | 13.85b | 0.02 | 13.27cd | 0.08 | 12.93d | 0.12 |
| | Protocatechuic acid | 3.40a | 0.01 | 2.67b | 0.15 | 2.66b | 0.03 | 2.95c | 0.05 | 3.48a | 0.15 |
| | p-Hydroxybenzoic acid | 0.92a | 0.03 | 0.88a | 0.04 | 0.68b | 0.03 | 0.61c | 0.01 | 0.90a | 0.01 |
| | Vanillic acid | 1.71a | 0.03 | 0.93b | 0.04 | 0.66c | 0.01 | 0.57d | 0.02 | 0.55d | 0.01 |
| | Syringic acid | n.d. | | n.d. | | n.d. | | 0.93a | 0.05 | 0.75b | 0.03 |
| | Ellagic acid | n.d. | | n.d. | | n.d. | | n.d. | | n.d. | |
| | Total | 17.66 | | 18.21 | | 17.85 | | 18.33 | | 18.61 | |
| Hydroxycinnamates | | | | | | | | | | |
| | trans-Caftaric acid | 37.33a | 0.07 | 30.47b | 0.02 | 23.31c | 0.02 | 16.87d | 0.02 | 7.25e | 0.04 |
| | cis-Coutaric acid | 7.40a | 0.03 | 6.32b | 0.02 | 5.28c | 0.31 | 3.91d | 0.13 | 0.93e | 0.00 |
| | trans-Coutaric acid | 15.51a | 0.08 | 13.27b | 0.06 | 10.76c | 0.01 | 8.20d | 0.04 | 4.88e | 0.00 |
| | trans-Fertaric acid | 3.08a | 0.05 | 2.71b | 0.16 | 2.14c | 0.03 | 1.60d | 0.02 | 0.86e | 0.02 |
| | Unk 5 * | 0.62a | 0.01 | 0.48b | 0.01 | n.q. | | n.q. | | n.d. | |
| | Caffeic acid | 1.71a | 0.03 | 3.10b | 0.02 | 3.60c | 0.02 | 3.55d | 0.05 | 6.72e | 0.02 |
| | Unk 6 * | n.d. | | n.d. | | n.d. | | n.d. | | n.d. | |
| | p-Coumaric acid | 0.76a | 0.01 | 1.35b | 0.00 | 1.63c | 0.02 | 1.65c | 0.05 | 7.72d | 0.09 |
| | Ferulic acid | 0.37a | 0.02 | 0.66b | 0.01 | 0.72c | 0.04 | 0.62b | 0.01 | 1.00d | 0.02 |
| | Total | 66.77 | | 58.36 | | 47.42 | | 36.39 | | 29.36 | |
| Stilbene | | | | | | | | | | |
| | trans-Resveratrol | n.q. | | n.q. | | n.q. | | n.d. | | n.d. | |
| Flavonoids | | | | | | | | | | |
| Flavonols | | | | | | | | | | |
| | Unk 7 ** | 7.25a | 0.07 | 6.80b | 0.11 | 5.31c | 0.18 | 3.79d | 0.06 | 0.48e | 0.03 |
| | Myricetin | n.d. | | n.d. | | n.d. | | n.d. | | n.d. | |
| | Quercetin | 0.64a | 0.01 | 0.96b | 0.01 | 0.85c | 0.00 | 0.65a | 0.01 | 0.75d | 0.01 |
| | Kaempferol | n.q. | | n.q. | | n.q. | | n.q. | | n.q. | |
| | Total | 7.89 | | 7.76 | | 6.17 | | 4.44 | | 1.24 | |
| Flavan-3-ols | | | | | | | | | | |
| | (−)-Epigallocatechin | 0.55a | 0.01 | n.q. | | n.q. | | n.q. | | 0.60b | 0.02 |
| | (+)-Catechin | 6.98a | 0.05 | 4.23b | 0.06 | 1.25c | 0.03 | 0.49d | 0.02 | n.q. | |
| | (−)-Epicatechin | 1.47a | 0.04 | 0.90b | 0.02 | 0.49c | 0.03 | 0.39d | 0.01 | 0.37d | 0.02 |
| | Total | 9.00 | | 5.12 | | 1.74 | | 0.88 | | 0.97 | |
| Furans | | | | | | | | | | |
| | HMF | 1.48a | 0.00 | 12.17b | 0.01 | 30.42c | 0.01 | 52.10d | 0.15 | 1651.50e | 2.78 |
| | Furfural | n.d. | | n.q. | | 1.80a | 0.02 | 2.33b | 0.05 | 19.48c | 0.01 |
| | Total | 1.48 | | 12.17 | | 32.22 | | 54.43 | | 1670.98 | |
Moreover, the most important unknown peaks were tentatively identified, by the elution order and UV spectrum when compared with those found in literature. The first six unknown peaks exhibit cinnamic-type UV spectra, and it is believed that they correspond to hydroxycinnamates, currently found in wines. In fact, evidences indicate that some of them are hydroxycinnamoyltartaric acids. These compounds were identified by Buiarelli
et al. [
35] in wine by using HPLC-tandem mass spectrometry. Using a standard C
18-column, they established the following elution order: caftaric, coutaric, fertaric, caffeic,
p-coumaric and ferulic. Darias-Martín
et al. [
36] also reported that the
cis forms elute before
trans ones. Consequently, comparing the UV spectra with those obtained by Guerrero
et al. [
37], Mozetič
et al. [
38] and Gutiérrez
et al. [
18], Unk 1 (maximum at 326 nm with a shoulder at 300 nm) was identified as
trans-caftaric acid, Unk 2 and Unk 3 as
cis- and
trans-coutaric acids, with maximums at 310 and 313 nm, respectively, and Unk 4 as fertaric acid (maximum at 327 nm with a shoulder at 287 nm), probably the
trans form, the most common in wines. Unk 5 and 6 should correspond to the hydroxycinnamates family, but their identification was not established. Unk 7 has a UV spectrum similar to rutin (standard available) and may have structural similarities.
Before heating, hydroxycinnamates represent on average 59% of the non-anthocyanin polyphenols, followed by hydroxybenzoic acids (about 20%). Caftaric acid was the most abundant compound found in all wines, varying from 14.53 (
Table 2) to 37.34 mg/L (
Table 3) (caffeic acid equivalents). Similar amounts were found by Fernández-Pachón and colleagues [
39] in sherry wines (6.29 to 42.90 mg/L). During the heating step, a noticeable decrease of caftaric, coutaric and fertaric acids was registered, especially when heating conditions were more severe. Conversely, caffeic,
p-coumaric and ferulic contents improved during the same period and with the temperature increase, suggesting the hydrolysis of the correspondent hydroxycinnamoyltartaric acids (
Table 2,
Table 3 and
Table 4).
Flavan-3-ols, initially ranging from 0.55 mg/L for (−)-epigallocatechin (
Table 3) to 16.19 mg/L for (+)-catechin (
Table 3), also progressively declined during the heating process. Similar findings have also been pointed out by others researchers during wine standard ageing [
10,
21,
38]. The decrease of hydroxycinnamic acid esters and flavanols—yellow pigments [
4]—due to oxidation is referenced to contribute to the development of the brownish shades in white wines, although flavanols have been considered more effective in browning, especially (−)-epicatechin [
13].
Some hydroxybenzoic acids increased during the heating period (gallic and syringic acid) and others declined (protocatechuic,
p-hydroxybenzoic and vanillic acids). Gallic acid was the major hydroxybenzoate and its growth during ageing is usually explained by the hydrolysis of gallic tannins [
6,
40]. The values found (3.70 to 13.85 mg/L) are slightly above of those found by Darias-Martín
et al. [
36] in white wines from the Canary Islands (0.97 to 1.64 mg/L), but similar to those reported by Fernández-Pachón
et al. [
39] in sherry wines (4.42 to 10.70 mg/L). Syringic acid increase during ageing is usually related with the anthocyanins cleavage or the breakdown of lignin during wine wood-ageing [
41], which could explain the result obtained for
TNM wines (
Table 2 and
Table 3). The degradation of the others hydroxybenzoates may be related with the formation of ethyl esters of vanillic and
p-hydroxybenzoic acids, and methyl esters of vanillic and protocatechuic acids, already found in wines [
6]. Only trace amounts of ellagic acid were detected.
Flavonols, common in the skins of both red and white grapes in glycoside form, with the aglycone form prevailing in wines, were found but represent a small fraction (less than 13%). The results were consistent with the absence or limited contact with grape solids during fermentation, and the highest values were found in
TNM dry wines. Unk 7 is important and decreases with heating. Quercetin was found in small amounts (ranging from 0.53 to 1.53 mg/L) and did not present a regular trend with the heating process, like myricetin, only found in the
TNM dry wine (about 0.71 mg/L). Traces of kaempferol were found, but below the quantification limit and
trans-resveratrol (not detected in sweet wines and up to 0.63 mg/L in
TNM dry wine) was clearly affected by temperature (
Table 2,
Table 3 and
Table 4). This value is within the range of 0.1–0.8 mg/L found in white wines [
6]. On the other hand, HMF and furfural levels, formed essentially from sugar degradation, are clearly improved with temperature, as pointed out in a previous work [
42], especially HMF in the sweet wines (
Table 2,
Table 4). The low levels obtained for the dry wine (less than 3 mg/L,
Table 3), except in overheating conditions, suggest the need of accurate control of the temperature used in the
estufagem, and eventually different heating temperatures should be considered according to the wine sweetness.
Generally speaking, the HPLC-DAD results showed that the content of simple (non-polymeric polyphenols) non-anthocyanin polyphenols, present in the studied Madeira wines, diminish significantly during the
estufagem process. The decline at standard conditions (45 °C, 3 months) represents in average 27% while the overheating experiment (70 °C, 1 month) promoted a decrease of about 43% (
Table 5), revealing that temperature potentiate the transformation of this kind of phenolics. The obtain data also demonstrated that flavonoids decrease had a preponderant effect on this result.
Table 5 also indicates that non-flavonoids are the most abundant polyphenols in these wines, even after
estufagem.
Table 5.
Total of polyphenols (mg/L) during the heating at 45 °C (3 months) and 70 °C (1 month) of the studied Madeira wines, regarding HPLC-DAD analysis.
Table 5.
Total of polyphenols (mg/L) during the heating at 45 °C (3 months) and 70 °C (1 month) of the studied Madeira wines, regarding HPLC-DAD analysis.
| Samples | Total polyphenols (mg/L) | Dec. % | Non-flavonoids (mg/L) | Dec. % | Flavonoids (mg/L) | Dec. % |
|---|
| TNM sweet | 0 m | 61.73 | - | 48.84 | - | 12.89 | - |
| 1 m, 45 °C | 59.29 | 4.0 | 49.02 | -0.4 | 10.27 | 20.4 |
| 2 m, 45 °C | 52.76 | 14.5 | 45.10 | 7.6 | 7.66 | 40.6 |
| 3 m, 45 °C | 52.63 | 14.7 | 45.49 | 6.9 | 7.15 | 44.6 |
| 1 m, 70 °C | 44.39 | 28.1 | 42.33 | 13.3 | 2.06 | 84.0 |
| TNM dry | 0 m | 130.27 | - | 98.09 | - | 32.18 | - |
| 1 m, 45 °C | 117.55 | 9.8 | 91.53 | 6.7 | 26.02 | 19.1 |
| 2 m, 45 °C | 98.12 | 24.7 | 83.48 | 14.9 | 14.64 | 54.5 |
| 3 m, 45 °C | 96.13 | 26.2 | 82.43 | 16.0 | 13.70 | 57.4 |
| 1 m, 70 °C | 65.26 | 49.9 | 56.78 | 42.1 | 8.48 | 73.6 |
| Malvasia | 0 m | 101.32 | - | 84.43 | - | 16.89 | - |
| 1 m, 45 °C | 89.44 | 11.7 | 76.56 | 9.3 | 12.88 | 23.7 |
| 2 m, 45 °C | 73.18 | 27.8 | 65.27 | 22.7 | 7.91 | 53.2 |
| 3 m, 45 °C | 60.04 | 40.7 | 54.72 | 35.2 | 5.32 | 68.5 |
| 1 m, 70 °C | 50.18 | 50.5 | 47.97 | 43.2 | 2.21 | 86.9 |
2.2. Antioxidant Potential
The antioxidant potential (AP) was determined by three different tests: ABTS, DPPH and FRAP, and the results are listed in
Table 6. The DPPH assay presented the highest values (on average 382.22 mg(Trolox)/L) and the FRAP the lowest (about 55.39 mg(QE)/L). FRAP assay measures the reducing capacity of antioxidants and depends totally on the electron transference mechanisms while DPPH and ABTS assays determines the radical scavenging activity by electron and hydrogen transfer [
43]. DPPH (R
2 = 0.725) and ABTS (R
2 = 0.7411) assays likely reflect better the AP of the studied wines rather than FRAP assay (R
2 = 0.1158), since the correlation with the TP is higher. When HPLC-DAD results (total polyphenols) are correlated with the different antioxidant assays, it is observed that DPPH (R
2 = 0.813) traduce better the AP rather than ABTS assay (R
2 = 0.645), while the antioxidant activity measured by the FRAP assay does not correspond to the identified phenolics, since it is not found any type of correlation (R
2 = 0.000). It's evident that other antioxidants than phenols react in the FRAP system, hypothesizing the presence of non-phenolic antioxidants.
Table 6.
Antioxidant potential of Madeira wines during the heating at 45 °C (3 months) and 70 °C (1 month) expressed in terms of ABTS, DPPH and FRAP assays.
Table 6.
Antioxidant potential of Madeira wines during the heating at 45 °C (3 months) and 70 °C (1 month) expressed in terms of ABTS, DPPH and FRAP assays.
| Samples | ABTS assay | DPPH assay | FRAP assay |
|---|
| mg(GAE)/L | ± SD | mg(Trolox)/L | ± SD | IC50 (µL) | ± SD | mg(QE)/L | ± SD |
|---|
| TNM sweet | 0 m | 150.76a | 1.16 | 313.99a | 12.34 | 49.99a | 2.56 | 40.65a | 2.18 |
| 1 m, 45 °C | 103.07b | 2.52 | 276.66b | 13.27 | 65.51b | 0.86 | 19.88b | 0.69 |
| 2 m, 45 °C | 174.07c | 3.16 | 308.73a | 16.45 | 50.93a | 1.51 | 51.50c | 2.37 |
| 3 m, 45 °C | 153.93a | 3.50 | 305.52a | 2.36 | 53.85a | 2.39 | 53.49c | 0.92 |
| 1 m, 70 °C | 149.82a | 1.23 | 234.84c | 5.37 | 68.90b | 3.49 | 42.98a | 0.29 |
| TNM dry | 0 m | 268.61a | 0.13 | 502.93a | 19.46 | 25.68a | 0.49 | 36.83a | 3.22 |
| 1 m, 45 °C | 249.74b | 9.13 | 496.66a | 13.50 | 25.84a | 0.78 | 28.67b | 2.42 |
| 2 m, 45 °C | 235.36c | 8.50 | 504.98a | 9.22 | 27.06b | 0.28 | 33.67ab | 1.90 |
| 3 m, 45 °C | 198.45d | 7.25 | 409.66b | 9.42 | 36.79c | 0.31 | 102.46c | 4.31 |
| 1 m, 70 °C | 218.21e | 6.32 | 403.53b | 5.13 | 34.30d | 0.68 | 120.27d | 1.86 |
| Malvasia | 0 m | 183.93a | 4.95 | 445.92a | 7.00 | 32.56a | 0.73 | 70.21a | 3.39 |
| 1 m, 45 °C | 214.76b | 9.34 | 426.01a | 3.55 | 34.67a | 0.55 | 75.30b | 1.25 |
| 2 m, 45 °C | 219.29b | 8.08 | 389.33b | 22.98 | 39.07b | 0.65 | 60.76c | 2.55 |
| 3 m, 45 °C | 177.06a | 2.85 | 362.99bc | 6.36 | 43.10c | 0.45 | 55.33c | 3.89 |
| 1 m, 70 °C | 144.65c | 0.39 | 351.60c | 6.39 | 60.54d | 2.79 | 38.81d | 1.85 |
The results showed that changes occurred in the AP during the heating step do not follow a typical trend. A decrease of up to 26% (ABTS assay) was observed after estufagem under standard conditions (45 °C, 3 months), while similar results were observed after heating a 70 °C in only 1 month. Taking into account that estufagem is an accelerated oxidative process, this decrease do not cause a negative impact enough to change this procedure. The above results clearly show that the changes observed in polyphenols by HPLC-DAD might indicate the formation of other antioxidants with ageing.
At the end of the heating procedure the AP values were in the range 234.84–409.66 mg/L in terms of TEAC (or 0.94–1.64 mM) slightly above of the results obtained by Fernández-Pachón
et al. [
39] in sherry wines (0.49–0.98 mM), and comparable to those found by de Quirós
et al. [
44] in Spanish white wines (0.77–2.01 mM).
2.3. Color Study
As color is one of the principal attributes of a wine and it is considered decisive for the choice of consumers, color studies can be a helpful tool in the recognition of the typical characteristics of a wine or on the influence of the vinification procedures. As Madeira wines can present pronounced color changes during
estufagem, Glories and CIELab systems were applied. Glories parameters,
%Ye,
%Re and
%Bl, are presented in
Figure 1 while color intensity (
CI), tonality (
To) and the absorbance reading at 420 nm are reported in
Table 7.
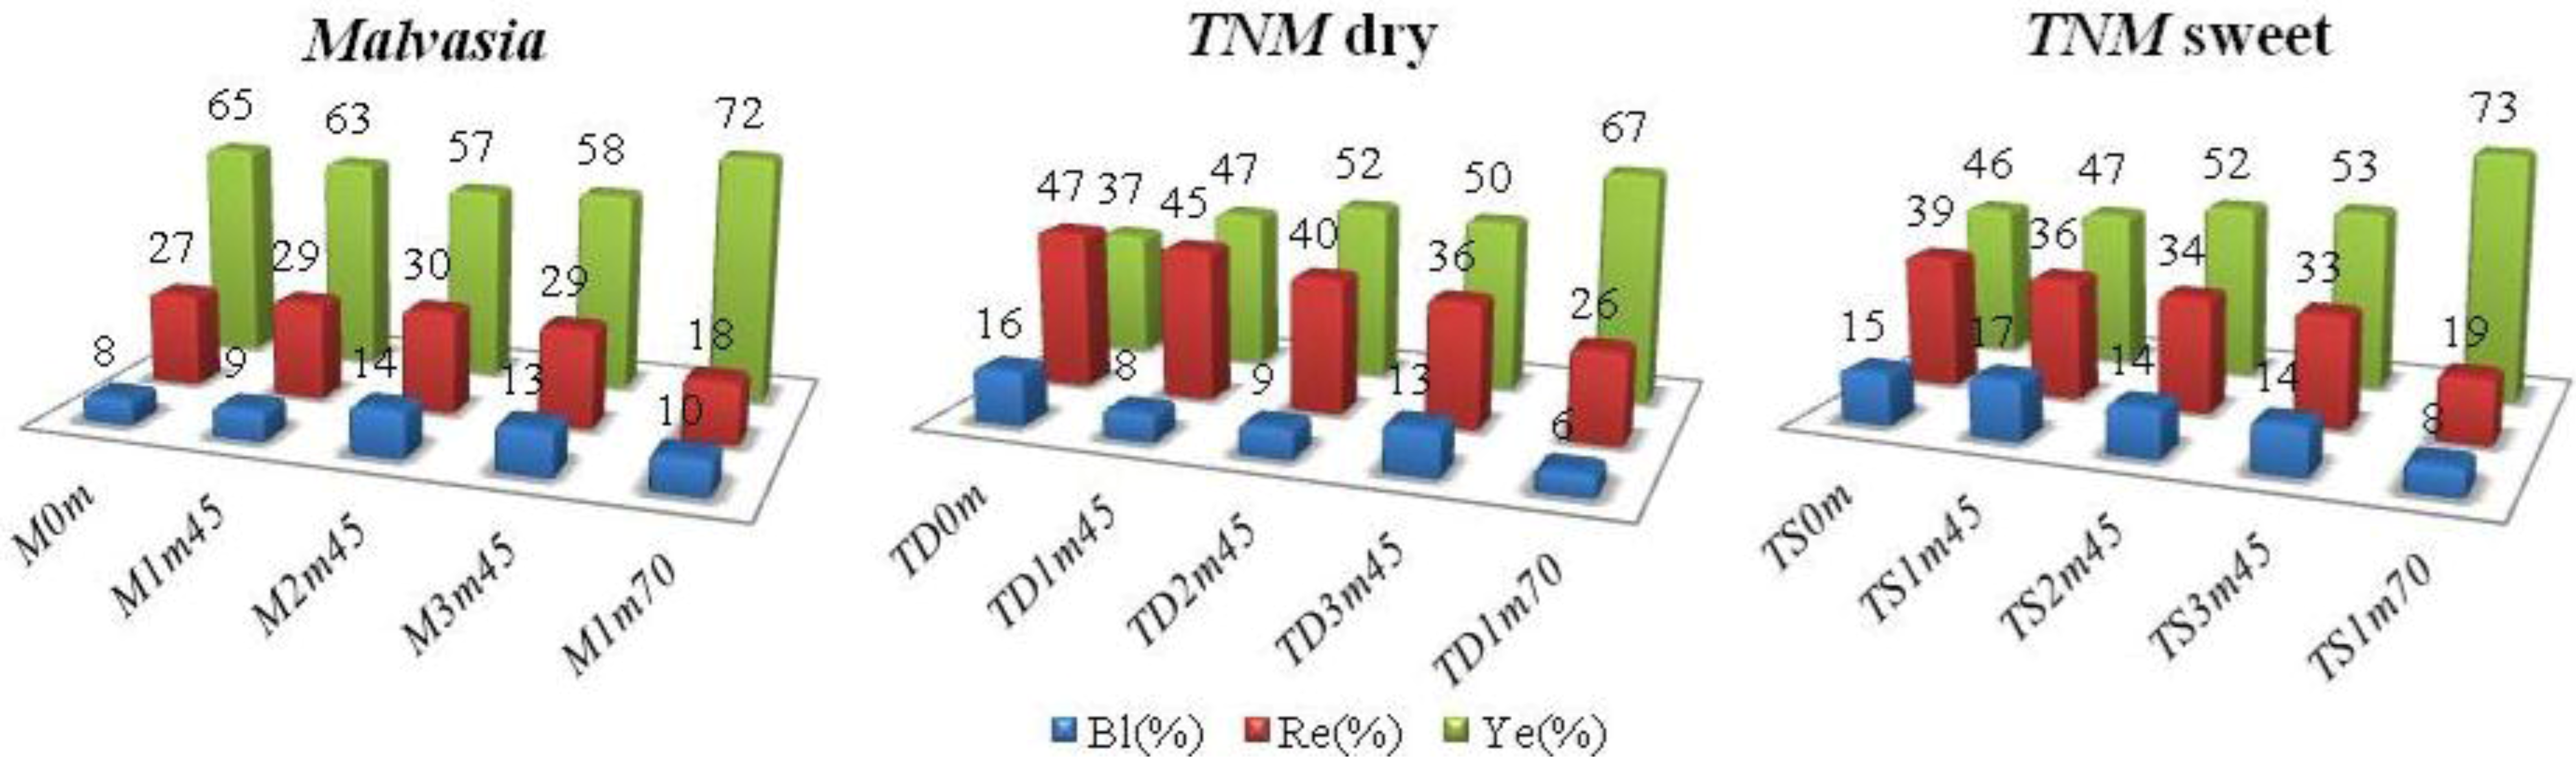
Figure 1.
Glories parameters, %Ye, %Re and %Bl, of Madeira wines during the heating at 45 °C (3 months) and 70 °C (1 month). Sample identification: M, TD and TS stand for Malvasia, TNM dry and TNM sweet wines, respectively, while the following two digits correspond to the heating period and the last two represent the heating temperature.
Table 7.
Glories chromatic parameters: intensity (CI), tonality (To) and absorbance readings at 420 nm of Madeira wines submitted to heating at 45 °C (3 months) and 70 °C (1 month).
Table 7.
Glories chromatic parameters: intensity (CI), tonality (To) and absorbance readings at 420 nm of Madeira wines submitted to heating at 45 °C (3 months) and 70 °C (1 month).
| Wines | A420 | ± SD | CI | ± SD | To | ± SD |
|---|
| TNM sweet | 0 m | 1.435a | 0.033 | 3.14a | 0.09 | 1.17a | 0.00 |
| 1 m, 45 °C | 1.840b | 0.117 | 3.93b | 0.30 | 1.31b | 0.01 |
| 2 m, 45 °C | 1.174c | 0.120 | 2.27c | 0.27 | 1.52c | 0.03 |
| 3 m, 45 °C | 1.167c | 0.052 | 2.19c | 0.13 | 1.63d | 0.03 |
| 1 m, 70 °C | 2.149d | 0.019 | 2.94a | 0.05 | 3.87e | 0.08 |
| TNM dry | 0 m | 1.580a | 0.019 | 4.22a | 0.06 | 0.80a | 0.00 |
| 1 m, 45 °C | 1.064b | 0.004 | 2.27b | 0.01 | 1.05b | 0.00 |
| 2 m, 45 °C | 1.311c | 0.007 | 2.53c | 0.02 | 1.31c | 0.00 |
| 3 m, 45 °C | 1.743d | 0.043 | 3.46d | 0.10 | 1.39d | 0.00 |
| 1 m, 70 °C | 0.948e | 0.003 | 1.41e | 0.00 | 2.55e | 0.00 |
| Malvasia | 0 m | 0.692a | 0.001 | 1.07a | 0.00 | 2.36a | 0.00 |
| 1 m, 45 °C | 1.070b | 0.004 | 1.71b | 0.01 | 2.19b | 0.00 |
| 2 m, 45 °C | 1.253c | 0.030 | 2.21c | 0.06 | 1.92c | 0.01 |
| 3 m, 45 °C | 0.859d | 0.011 | 1.47d | 0.03 | 2.05d | 0.02 |
| 1 m, 70 °C | 2.135e | 0.016 | 2.97e | 0.05 | 4.03e | 0.11 |
The results show that before heating, red color (about 47%) predominates in
TNM dry wine (
TD0m), while the yellow tones characterize the studied sweet wines, especially
Malvasia (
M0m) with 65% (
Figure 1) and limited contribution of blue hue (up to 16%). The heating process clearly affects color, expressed in the increase of
%Ye (reaches about 35% and 15% in the dry and sweet wine submitted to heating at 45 °C for 3 months,
TD3m45 and
TS3m45, respectively) and the decrease of
%Re (intensified at overheating temperatures, up to 81% in
TD1m70 and 59% in
TS1m70). The decrease of the reddish and the increase of the yellowish shades are in agreement with the observations reported by other authors [
15,
19] and can be associated with the degradation of anthocyanins to form new polymeric complexes. Indeed, the anthocyanin degradation was confirmed by the TMA analysis (
Table 1). In
Malvasia wine, the yellow pigments were always preponderant (at least 57%), as expected for a white variety.
TNM wines presented high
CI values before heating (
Table 7) which decreased with
estufagem, following the decreasing of red hues, while
To slightly increased. Almost the opposite was observed for
Malvasia.
Usually used as a browning index in white wines, the absorbance at 420 nm did not reveal a consistent trend during the heating period (45 °C), but increased significantly in sweet wines under overheating conditions (70 °C). These results are in agreement with those of Mayén
et al. [
20] who found that A
420 did not increase during the browning of white wines from Pedro Ximenez and Baladi grapes, at accelerated ageing (50 °C) in corked bottles, but however, increased when the bottles were opened and exposed to air. On the other hand, Kallithraka
et al. [
10] reported that A
420 of white wines significantly increased only after accelerated ageing at 55 °C over a period of 10 days. In addition, Fernandez-Zurbano
et al. [
21] established three categories for the browning of white dry wines, considering intense when absorbance (AU) was higher than 0.5, moderate between 0.2 and 0.5 AU and light when less than 0.2 AU was registered. Considering these categories, Madeira wines present an intense browning at the end of the thermal processing, especially when sweet wines were heated at 70 °C, for 1 month (
Table 7).
TNM wines at the initial stage already present very high A
420 values, possibly due to the presence of anthocyanins and others phenolics. At overheating conditions, reactions between polyphenolic compounds and sugars degradation, namely caramelization, might be favored.
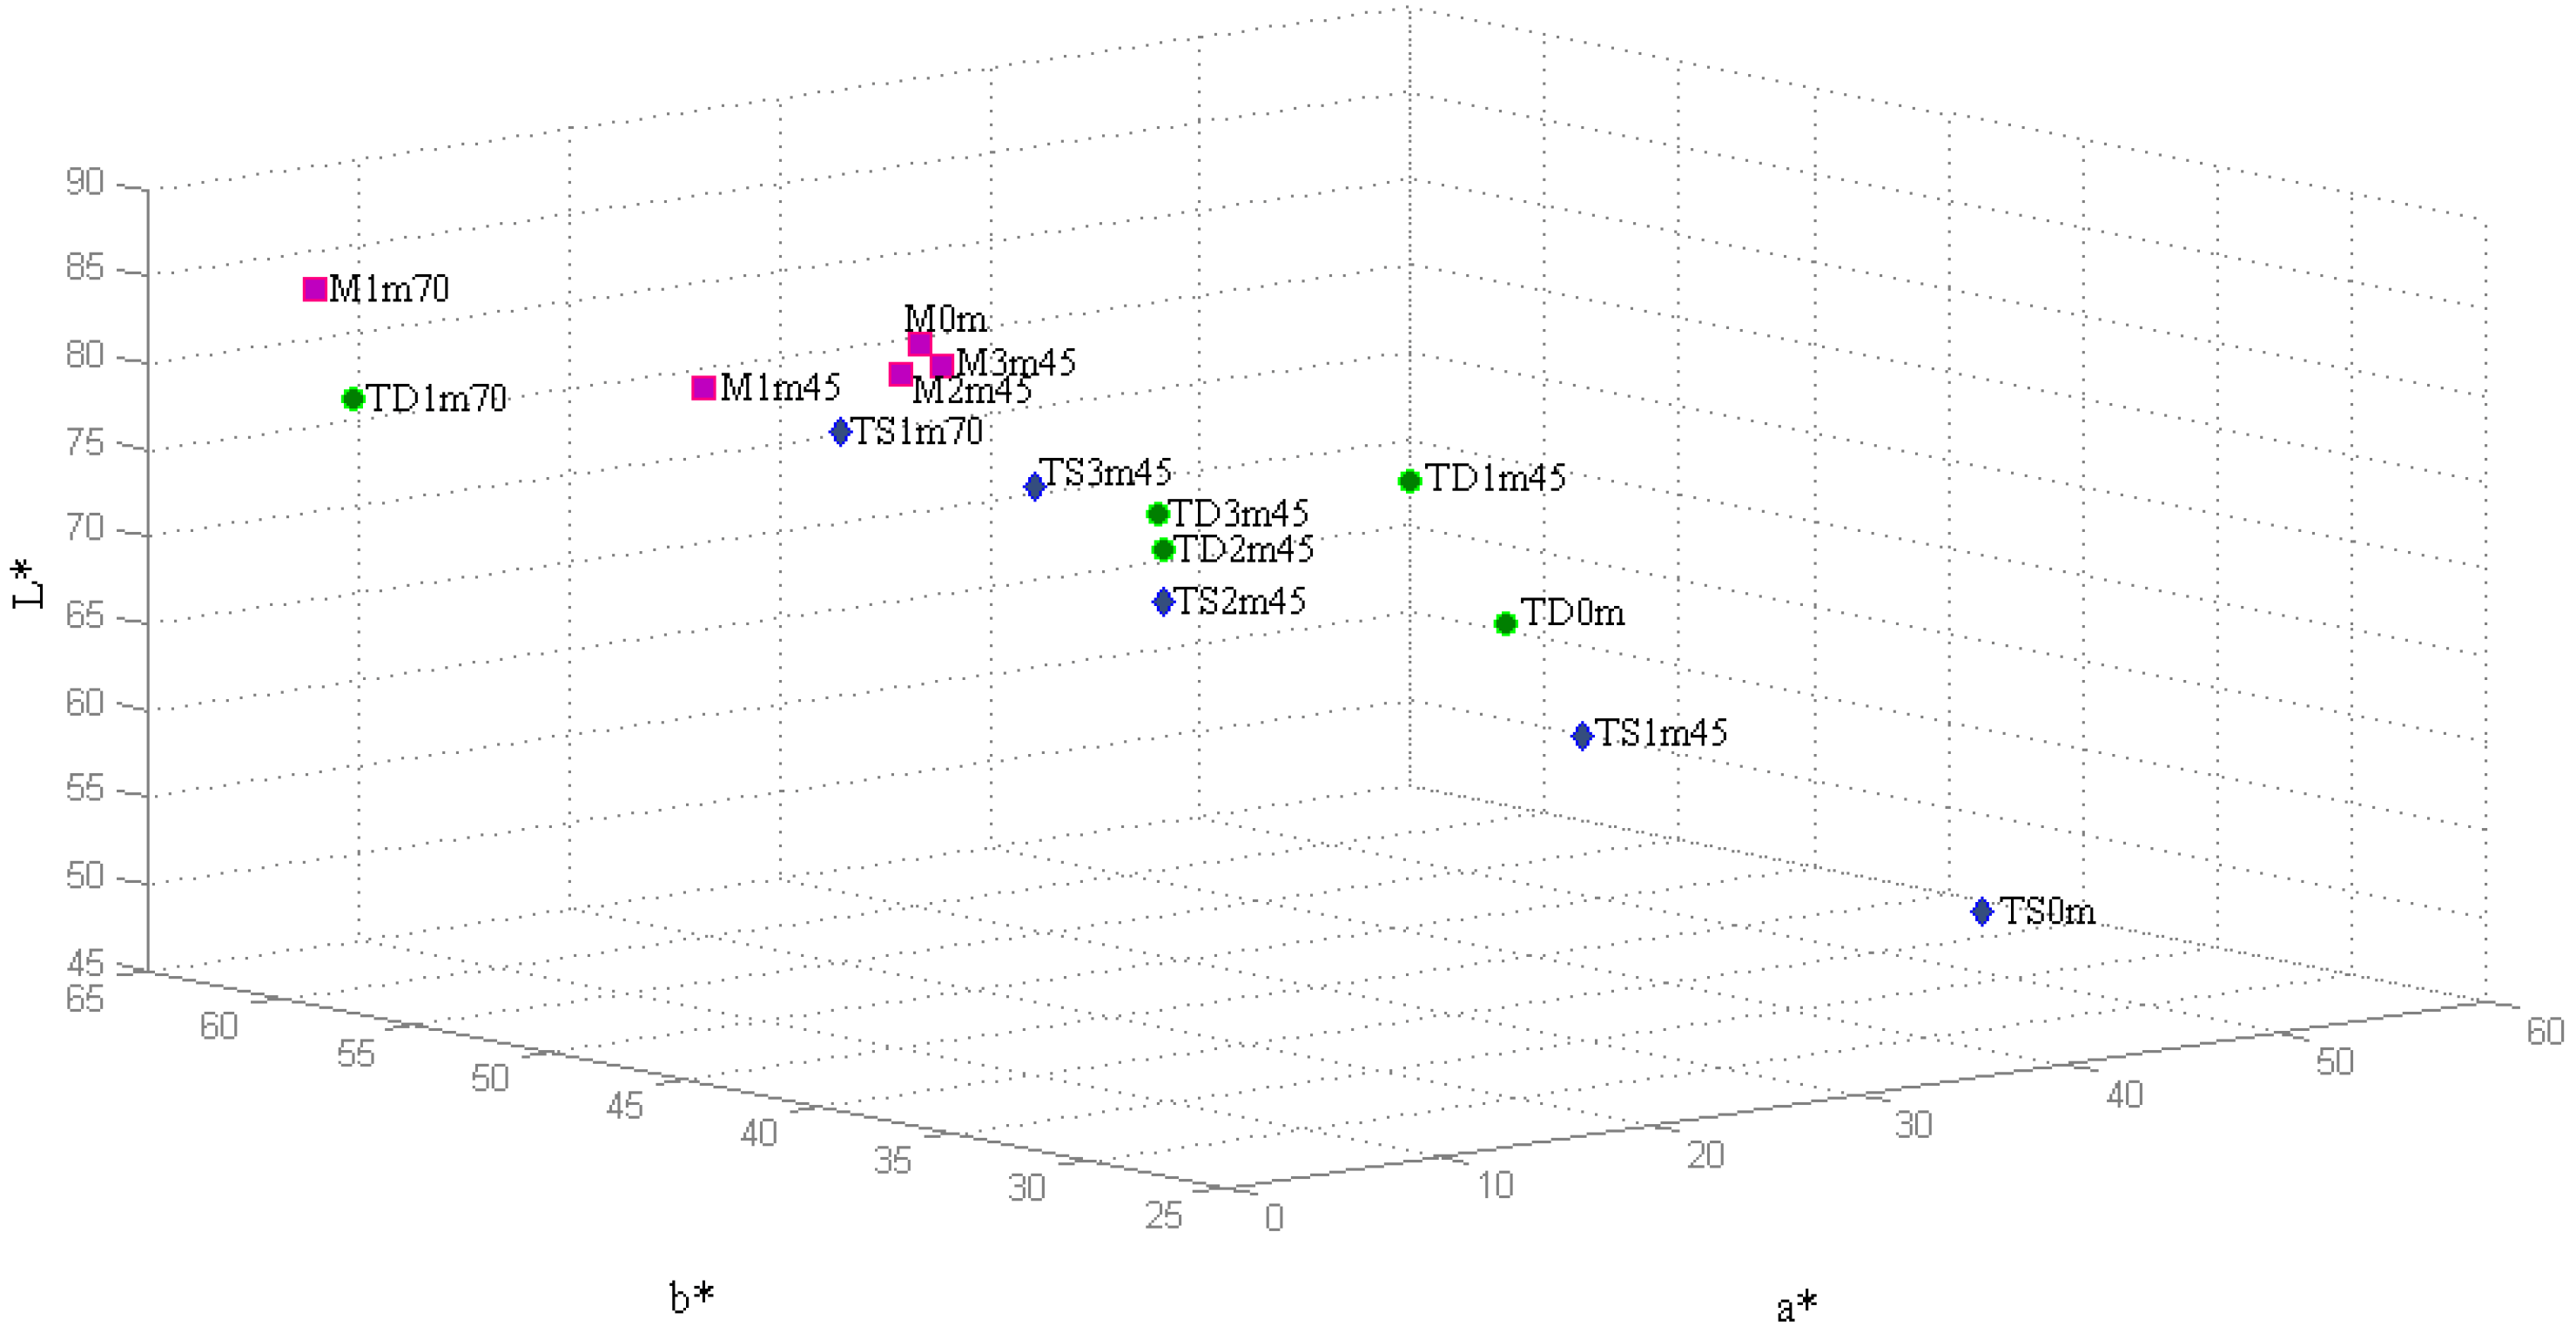
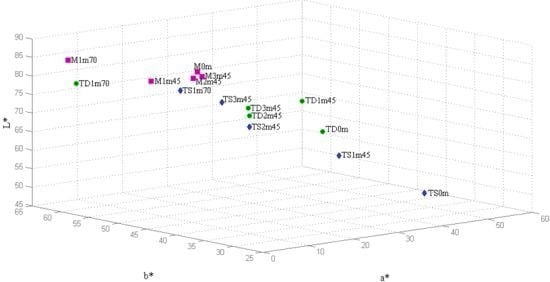
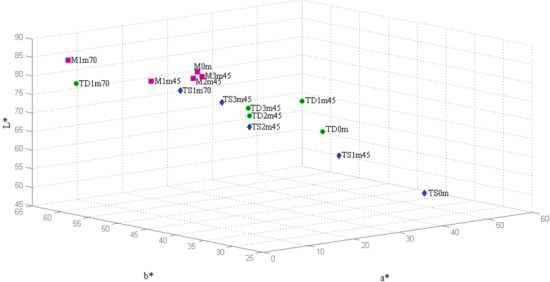
The CIELab chromatic coordinates
a*,
b* and
L* were also obtained and are represented in a 3D plot (
Figure 2). Color differences were more noticeable than with the Glories procedure, however confirmed the conclusions.
Major changes were observed again in TNM dry wine, reflecting the decrease on the a* positive coordinate (red hue) associated with an increase of the b* positive values (yellow hue), more pronounced at overheating conditions.
The variations with the heat presented by
TNM sweet wine and
Malvasia were significantly smaller, except for overheating conditions.
Figure 2 clearly shows that all wines tend to the same chromatic characteristics when the heating procedure is applied: red wines become clearer (
L* increases) due to anthocyanin polymerization, while yellow tones (
b* increases) predominate rather than red (
a* decreases). No defined trend was observed for chromaticity (
C*, ranging from 32.53 to 63.46 units), hue (
H*, ranging from 0.62 and 1.52 units) and saturation (
S*, ranging from 0.40 to 1.32 units) during the heating period (
Table 8).
Figure 2.
3D representation of the CIELab chromatic coordinates a*, b* and L* of the Madeira wines submitted to heating at 45 °C (3 months) and 70 °C (1 month). Sample identification: M, TD and TS stand for Malvasia, TNM dry and TNM sweet wines, respectively, while the following two digits correspond to the heating period and the last two represent the heating temperature.
Table 8.
CIELab chromatic parameters: chromaticity (C*), hue (H*) and saturation (S*) of the Madeira wines submitted to heating at 45 °C (3 months) and 70 °C (1 month).
Table 8.
CIELab chromatic parameters: chromaticity (C*), hue (H*) and saturation (S*) of the Madeira wines submitted to heating at 45 °C (3 months) and 70 °C (1 month).
| Samples | C * | ± SD | H * | ± SD | S * | ± SD | ΔE * |
|---|
| TNM sweet | 0 m | 47.05 | 0.00 | 0.91 | 0.00 | 0.69 | 0.00 | - |
| 1 m, 45 °C | 32.58 | 0.00 | 1.12 | 0.00 | 0.40 | 0.00 | - |
| 2 m, 45 °C | 49.85 | 0.00 | 1.11 | 0.00 | 0.70 | 0.00 | - |
| 3 m, 45 °C | 41.80 | 0.00 | 1.21 | 0.00 | 0.54 | 0.00 | 16.45 |
| 1 m, 70 °C | 63.33 | 0.00 | 1.46 | 0.00 | 0.82 | 0.00 | 34.90 |
| TNM dry | 0 m | 63.46 | 0.00 | 0.62 | 0.00 | 1.32 | 0.00 | - |
| 1 m, 45 °C | 58.18 | 0.00 | 0.82 | 0.00 | 0.99 | 0.00 | - |
| 2 m, 45 °C | 62.56 | 0.00 | 1.01 | 0.00 | 0.98 | 0.01 | - |
| 3 m, 45 °C | 55.32 | 0.00 | 1.14 | 0.00 | 0.75 | 0.00 | 40.21 |
| 1 m, 70 °C | 51.36 | 0.00 | 1.31 | 0.00 | 0.65 | 0.00 | 50.55 |
| Malvasia | 0 m | 41.11 | 0.00 | 1.43 | 0.00 | 0.47 | 0.00 | - |
| 1 m, 45 °C | 54.88 | 0.00 | 1.35 | 0.00 | 0.68 | 0.00 | - |
| 2 m, 45 °C | 43.16 | 0.00 | 1.41 | 0.00 | 0.51 | 0.00 | - |
| 3 m, 45 °C | 40.64 | 0.00 | 1.42 | 0.00 | 0.47 | 0.00 | 1.34 |
| 1 m, 70 °C | 61.46 | 0.00 | 1.52 | 0.00 | 0.72 | 0.00 | 20.96 |
Differences detectable by the human eye were estimated by the measurement of colorimetric differences (
ΔE*) for every pair of wines after the heating period, as follows:
ΔE* = [(ΔL*)2 + (Δa*)2 + (Δb*)2]1/2, assuming that
ΔE* higher than 3 units means that the color of the samples is different enough to be easily distinguished by human observers [
45]. Results (
Table 8) revealed that the color of the wines after being heated was clearly distinguishable from the initial stage (16.45 <
ΔE* < 50.55), with the exception of
Malvasia, under standard conditions.


