Phorbol Esters from Jatropha Meal Triggered Apoptosis, Activated PKC-δ, Caspase-3 Proteins and Down-Regulated the Proto-Oncogenes in MCF-7 and HeLa Cancer Cell Lines

Abstract
:1. Introduction
2. Results and Discussion
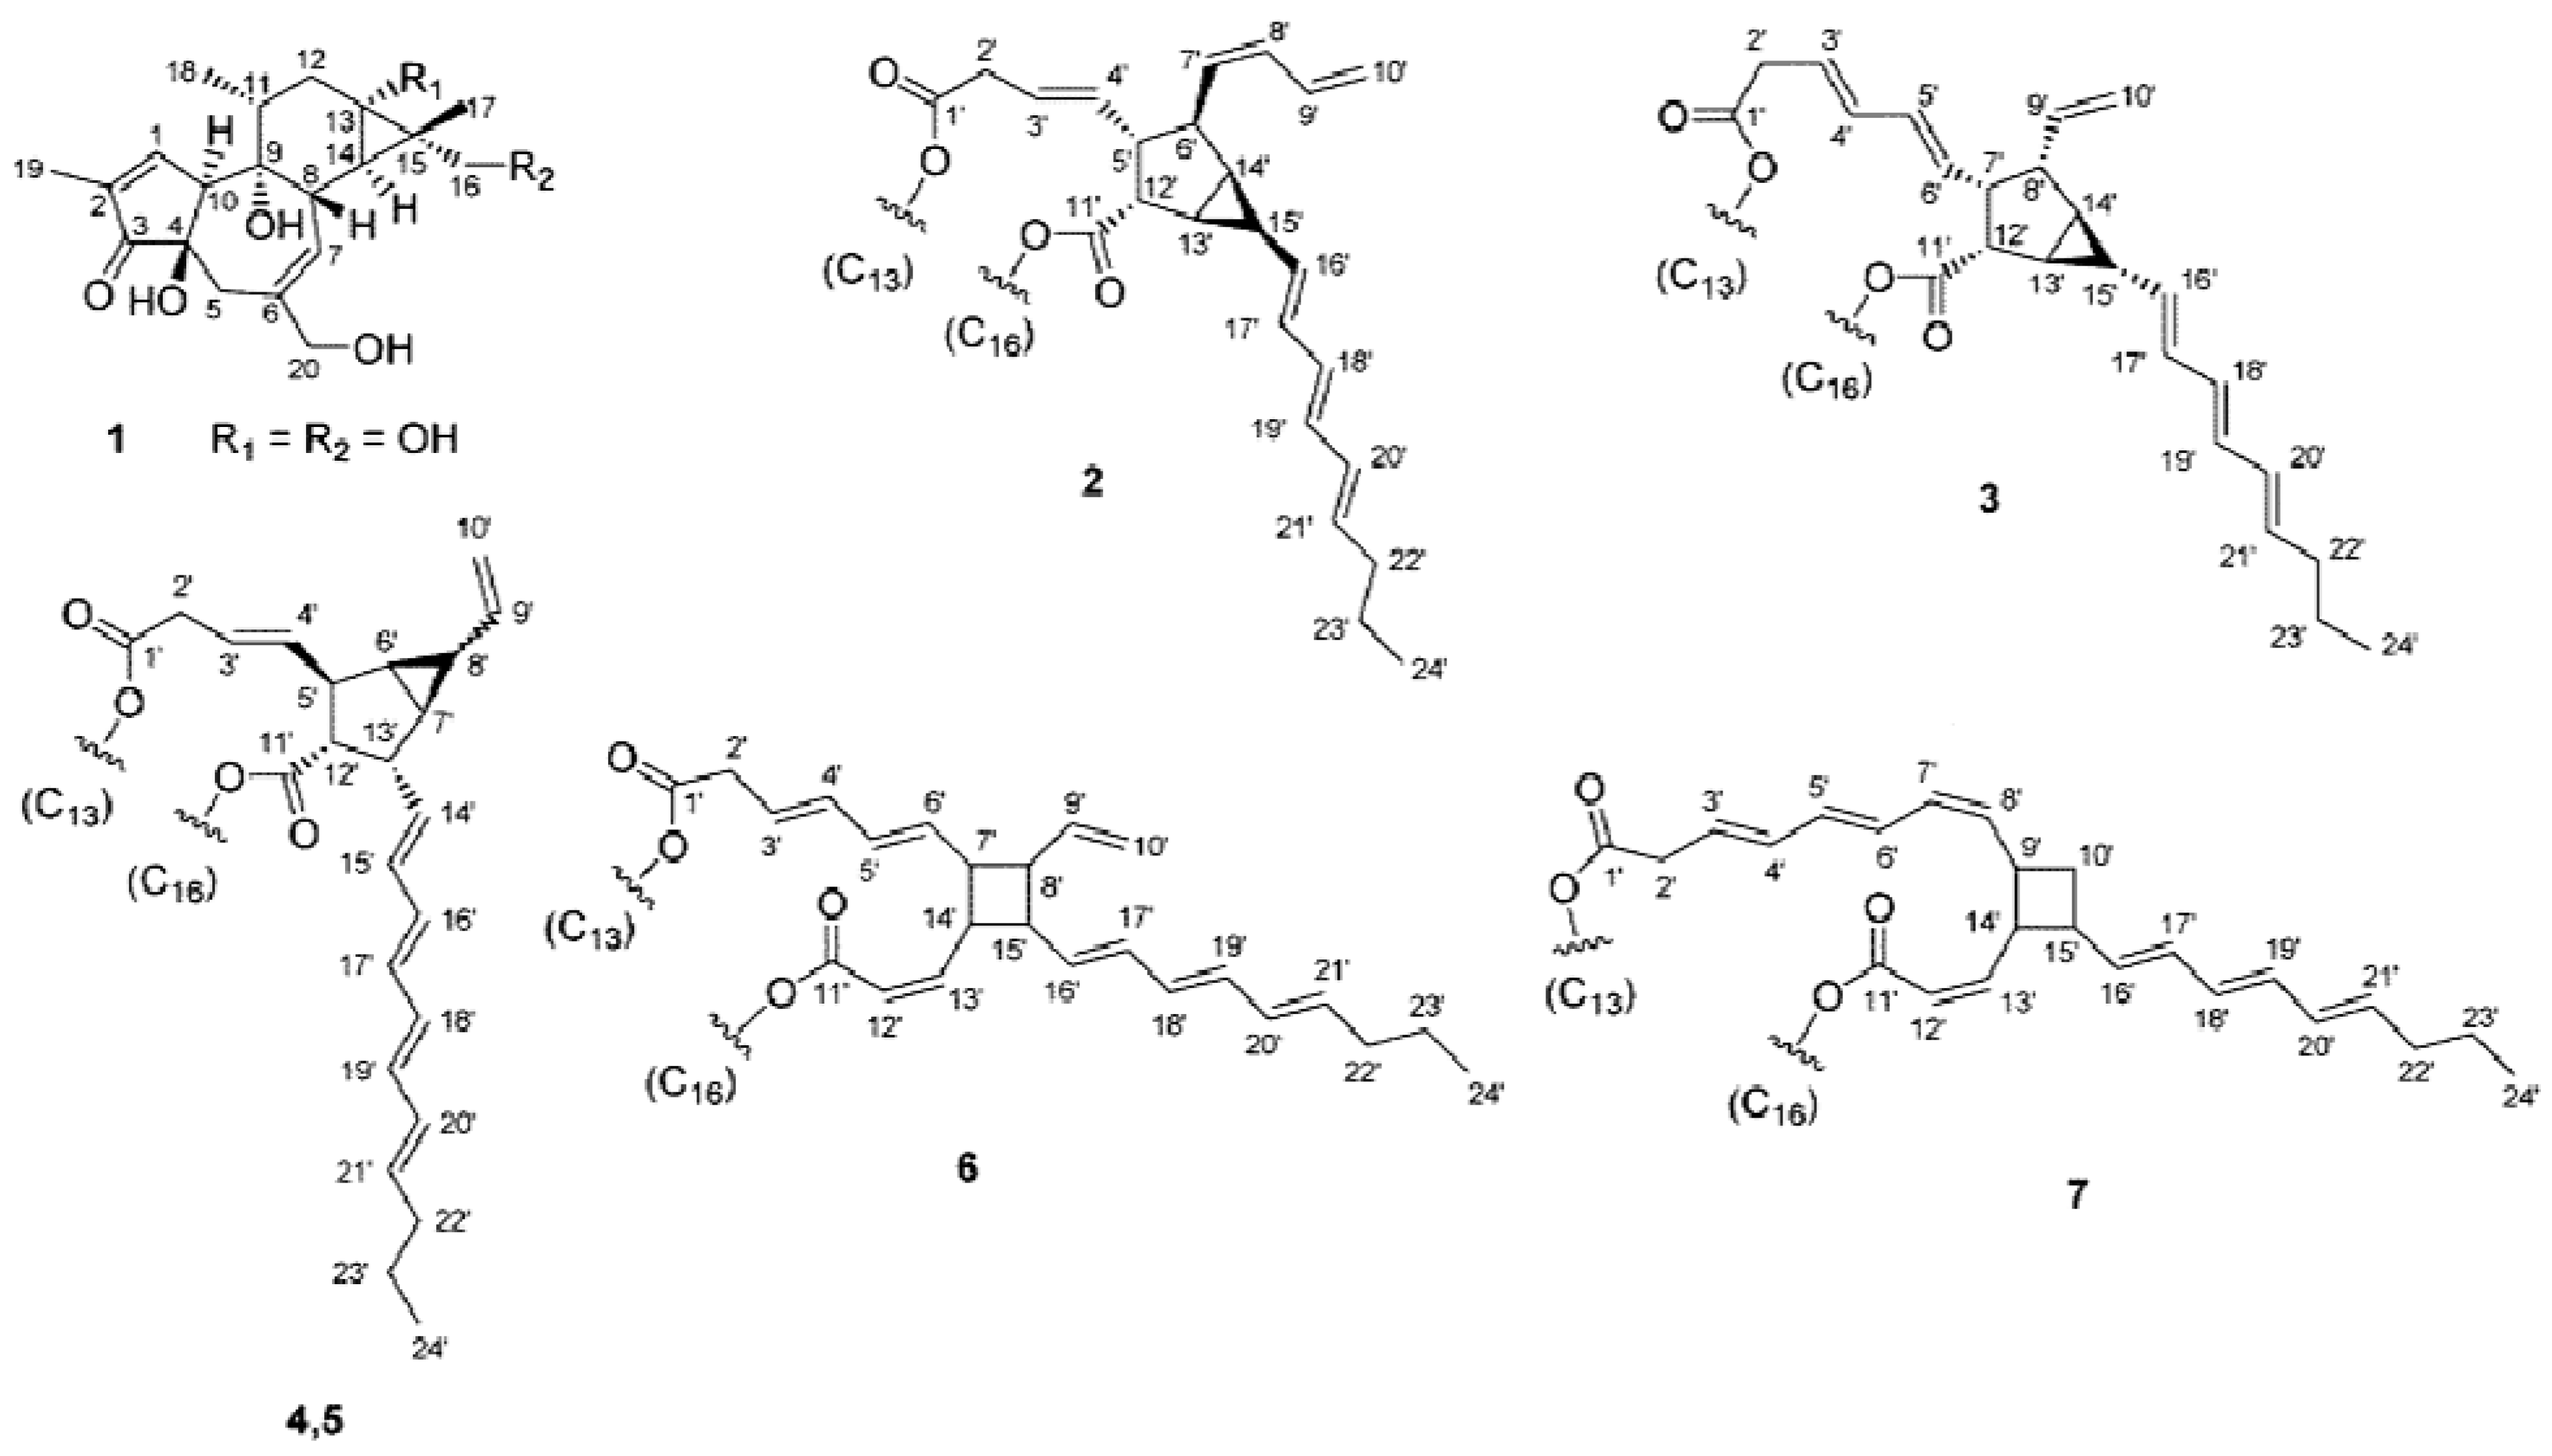
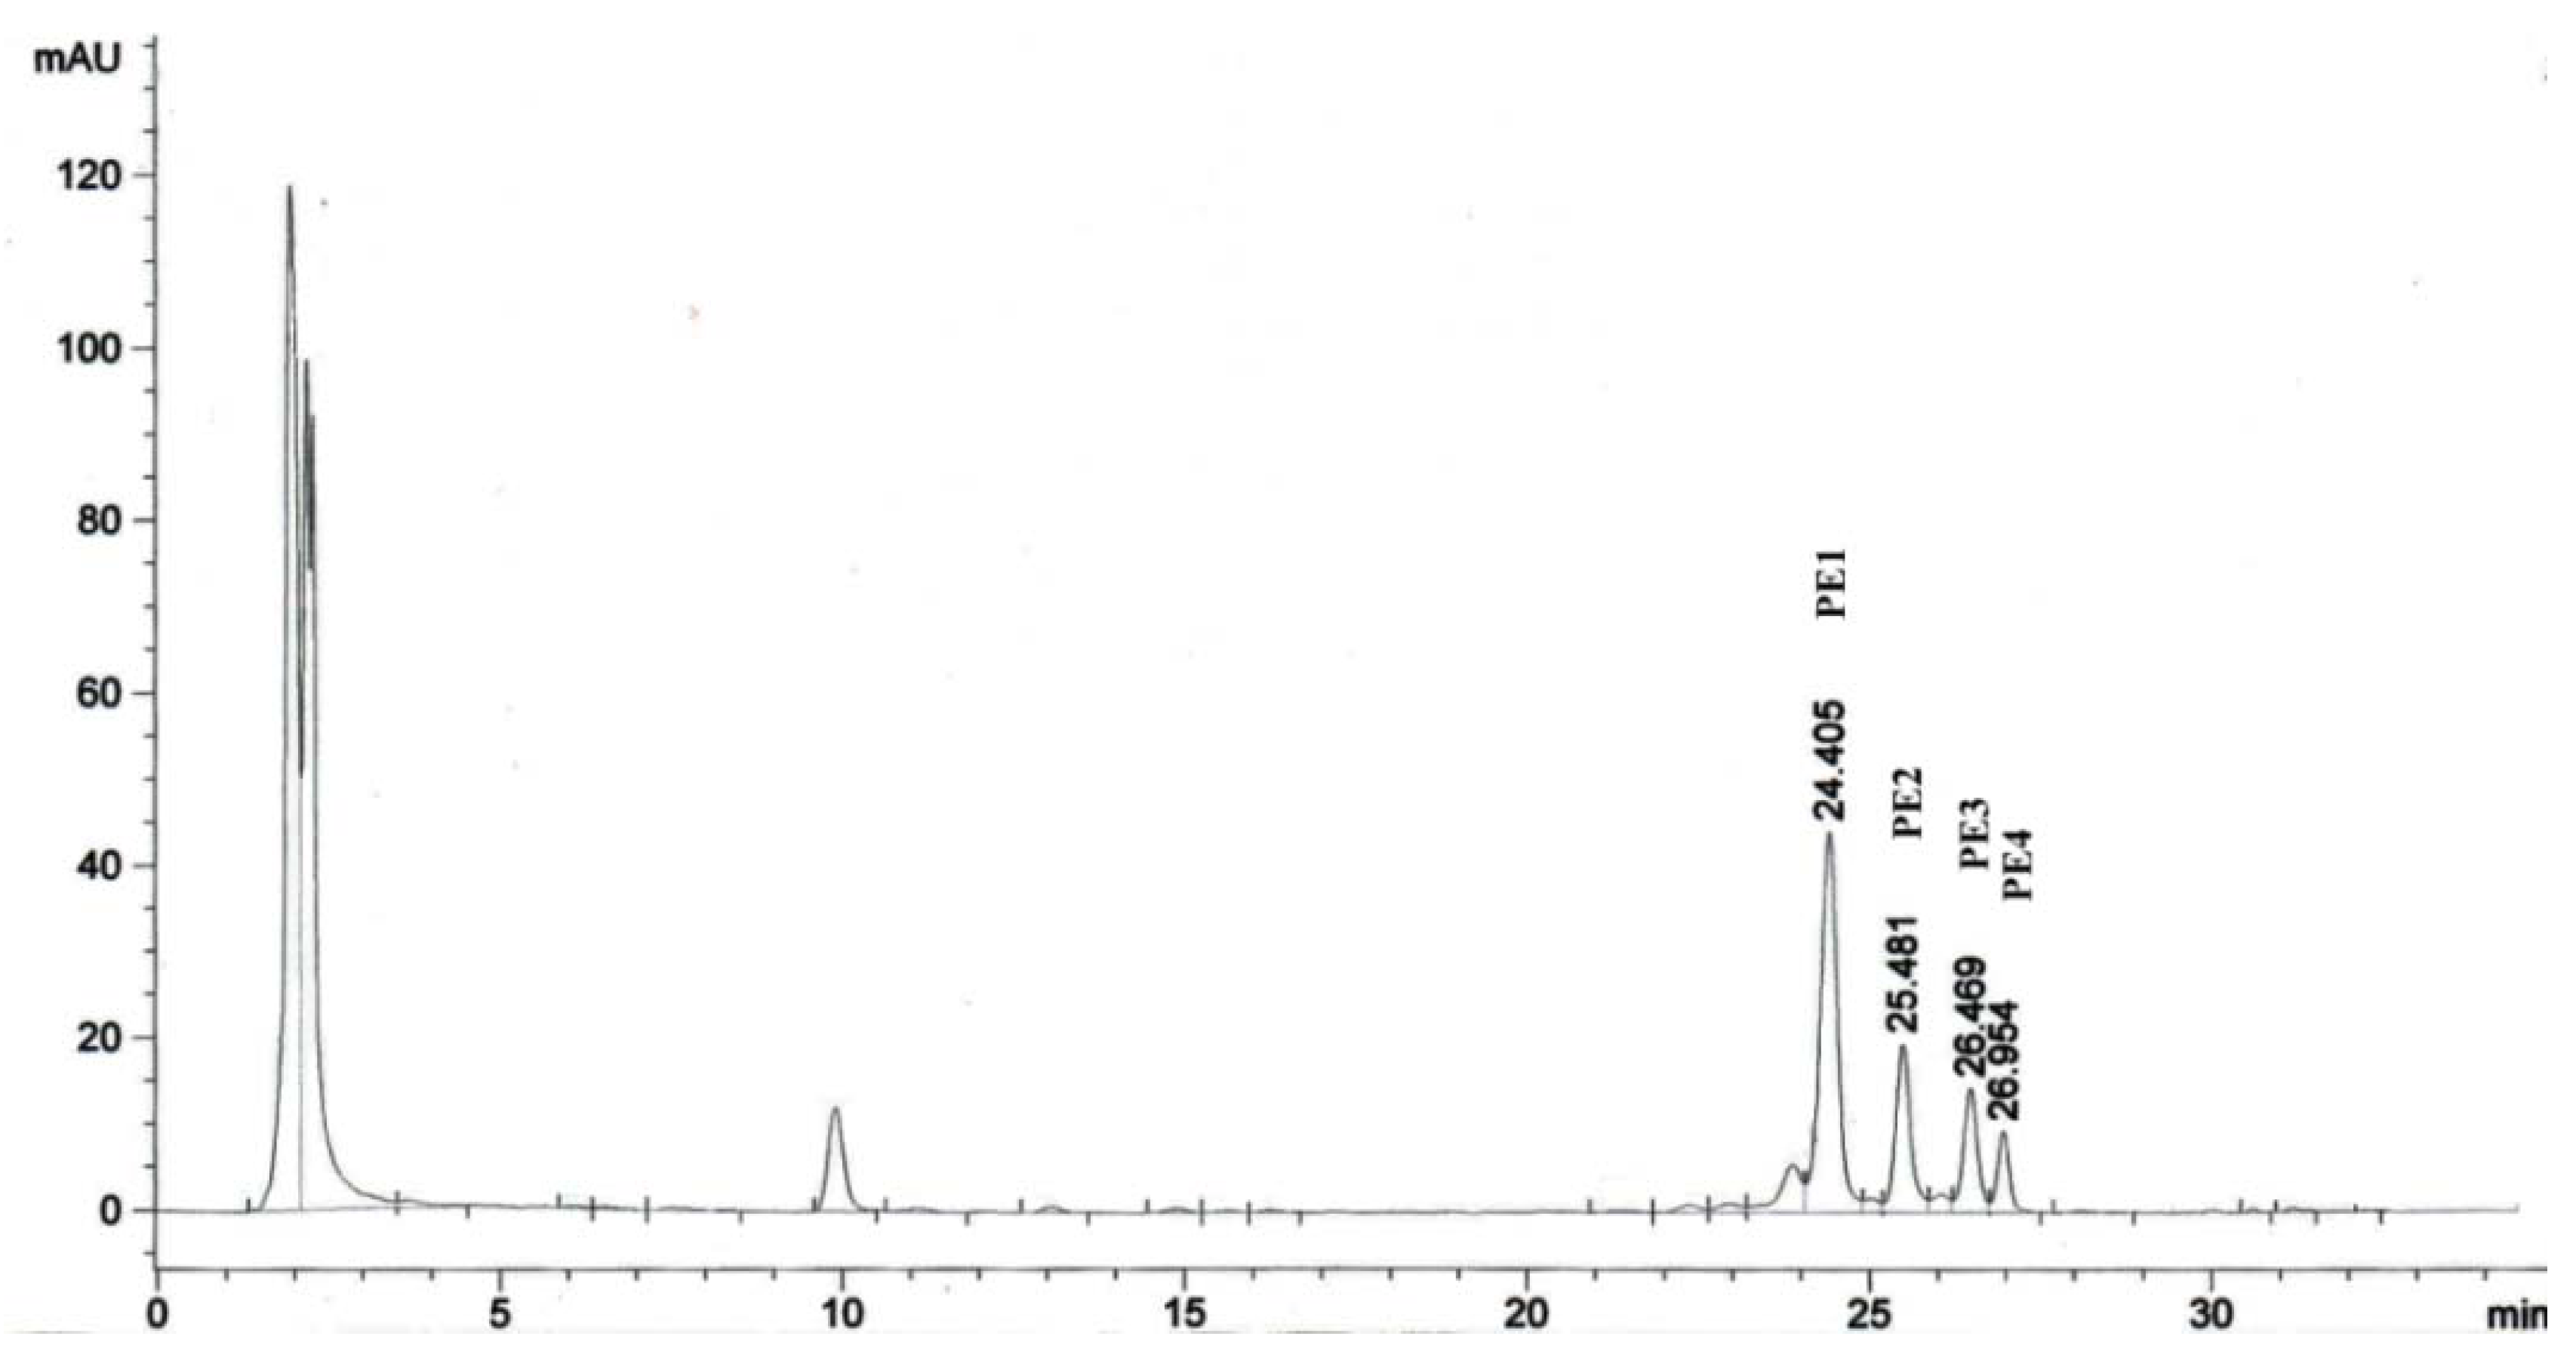
2.1. Isolation of Phorbol Esters
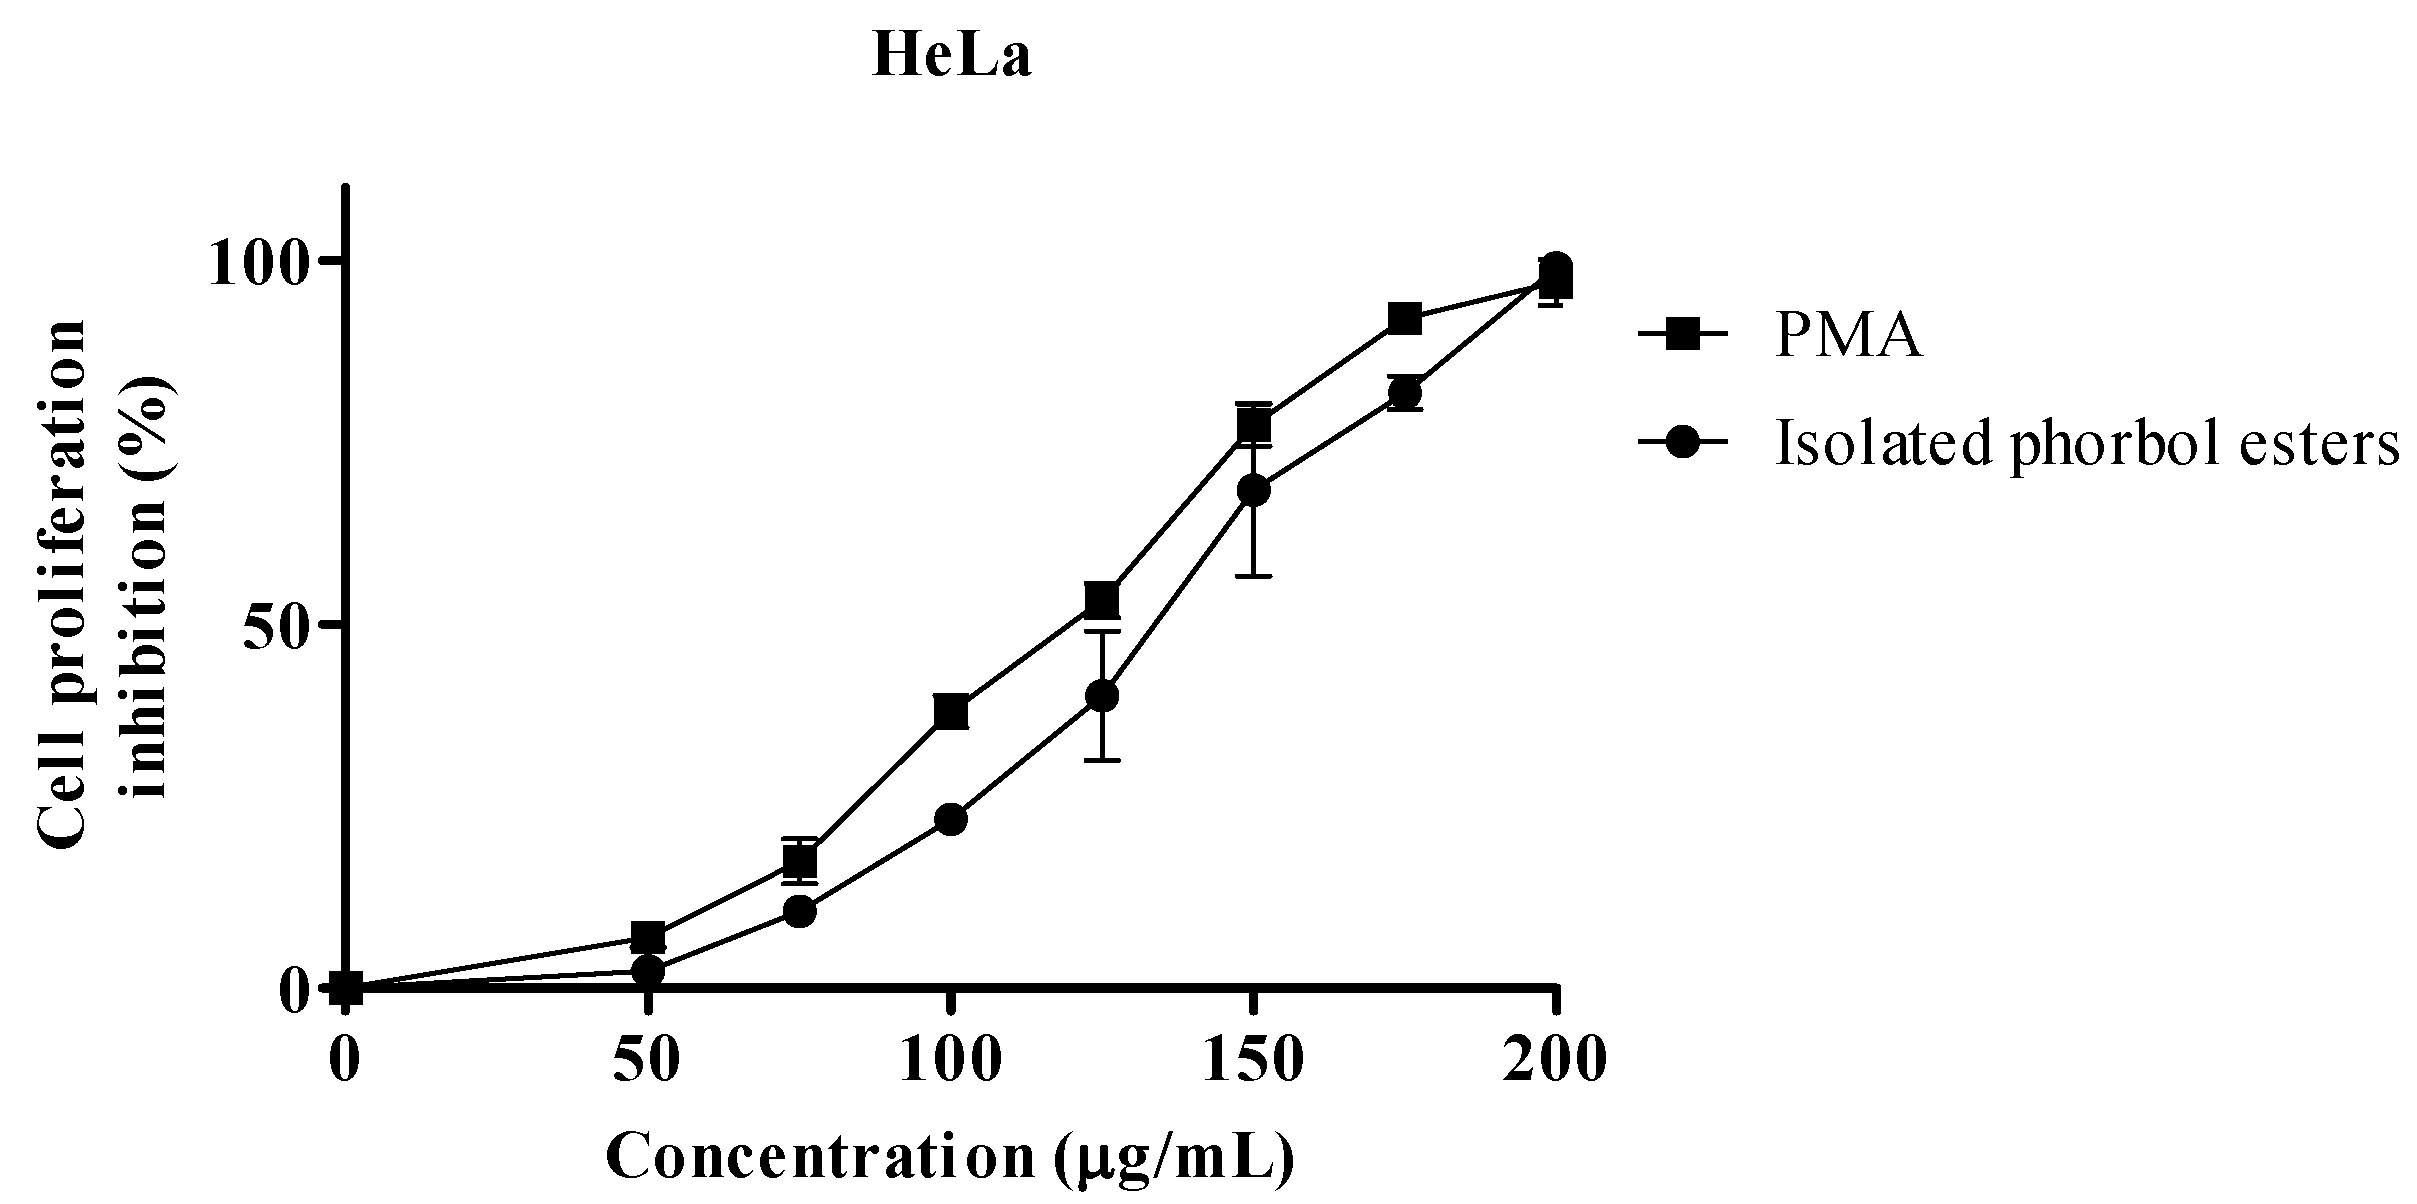
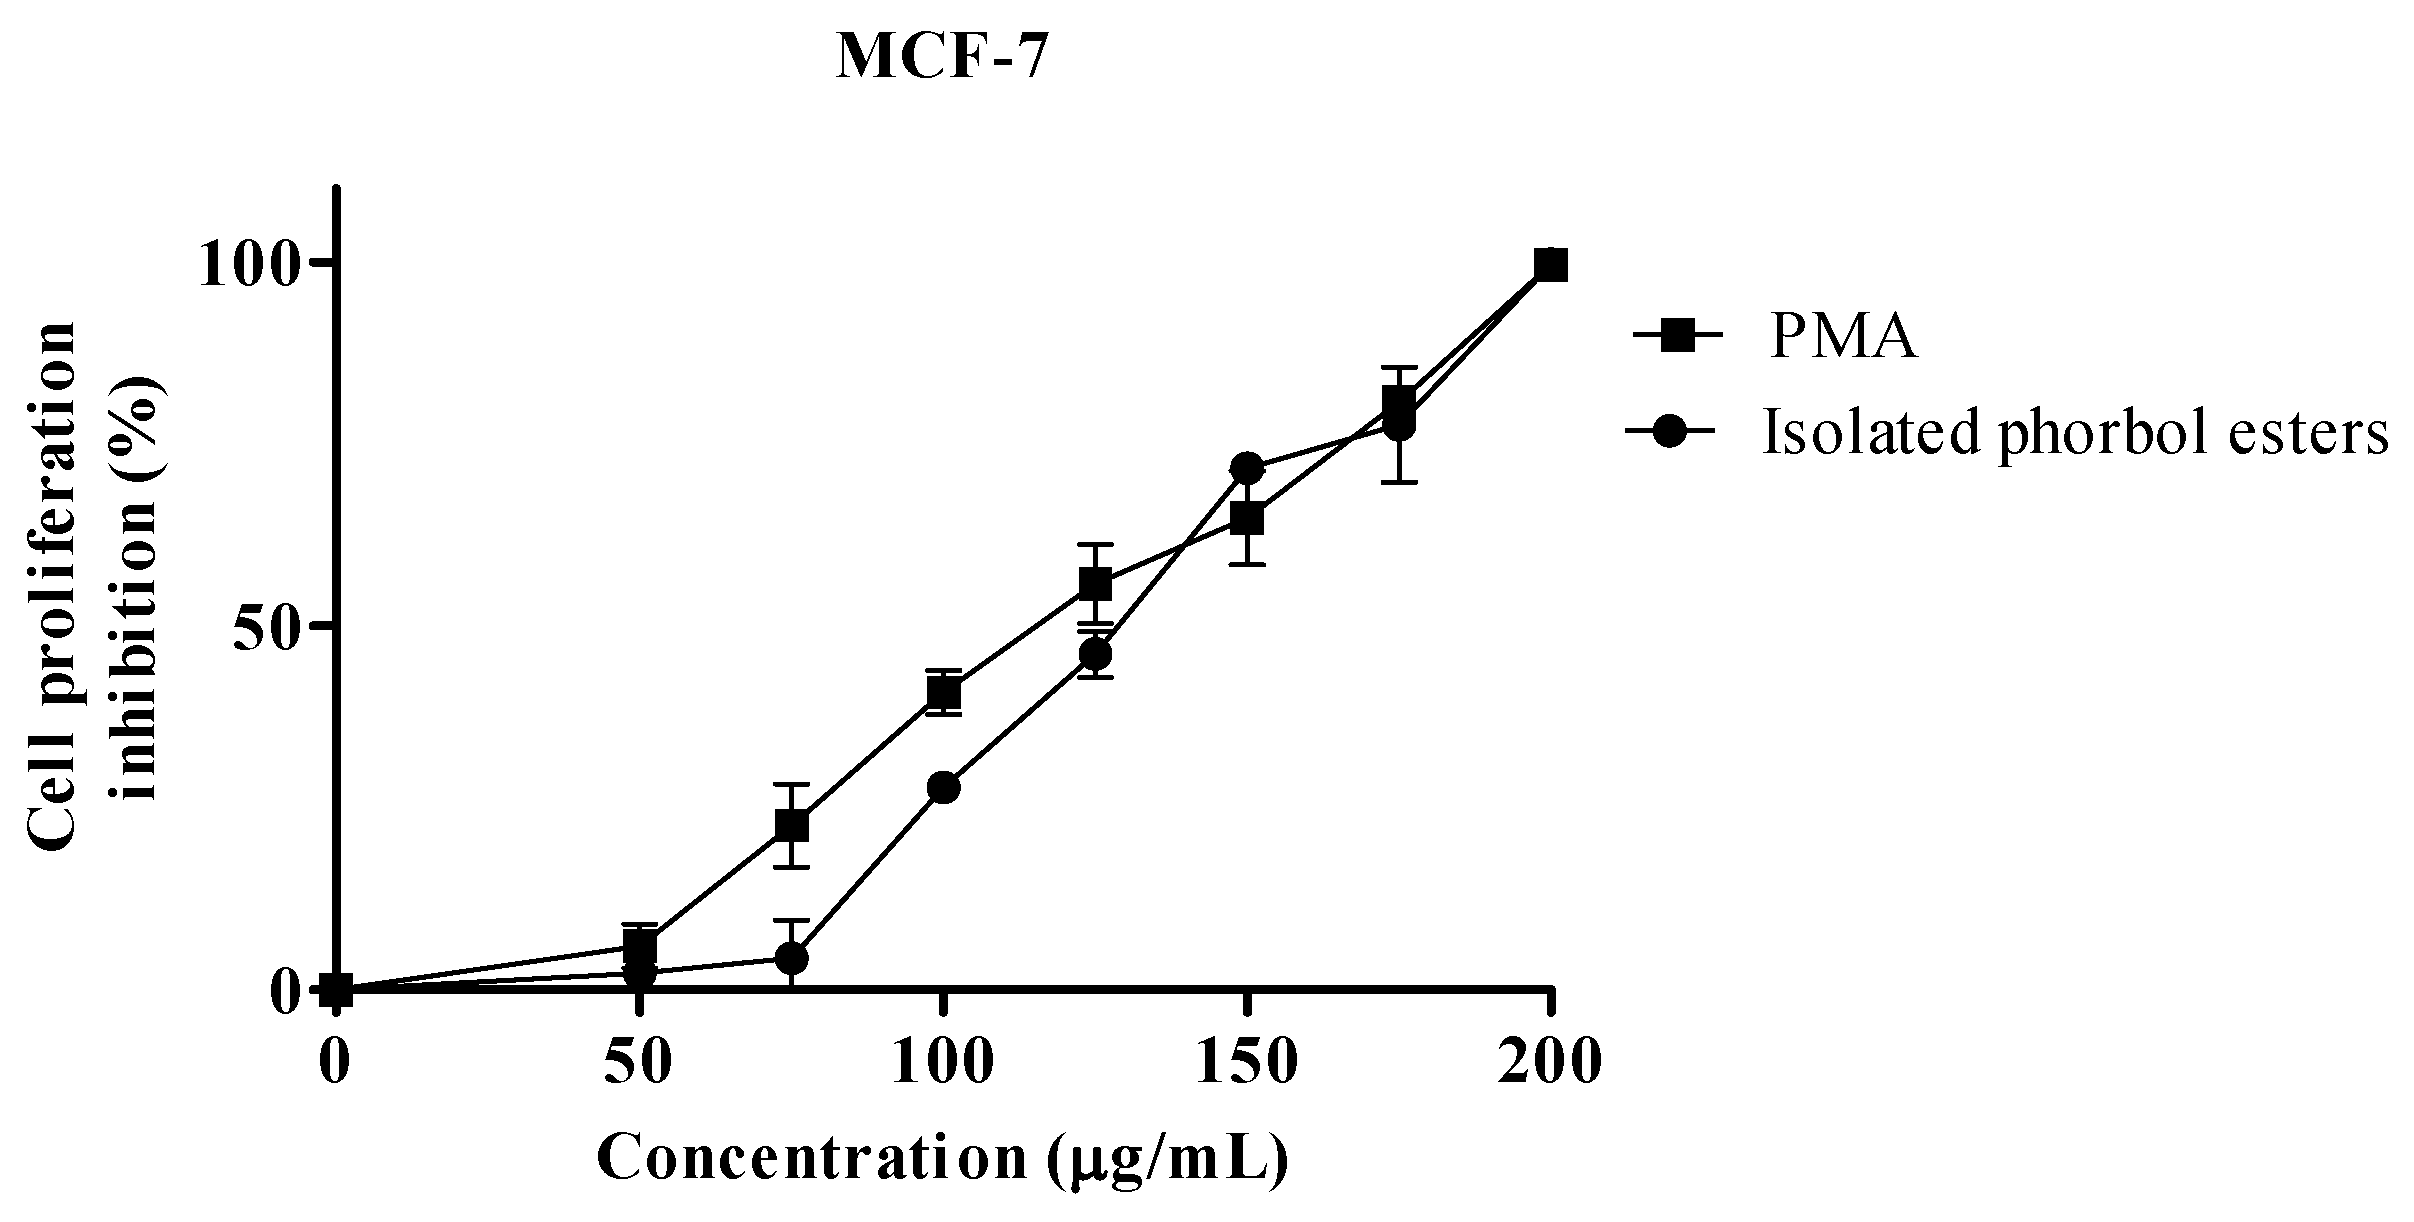
2.2. Proliferation Assay


| IC50 µg/mL | |||
|---|---|---|---|
| MCF-7 | HeLa | S.E.M | |
| PEs | 128.6 | 133.0 | 1.69 |
| PMA 1 | 114.7 | 119.6 | 2.16 |
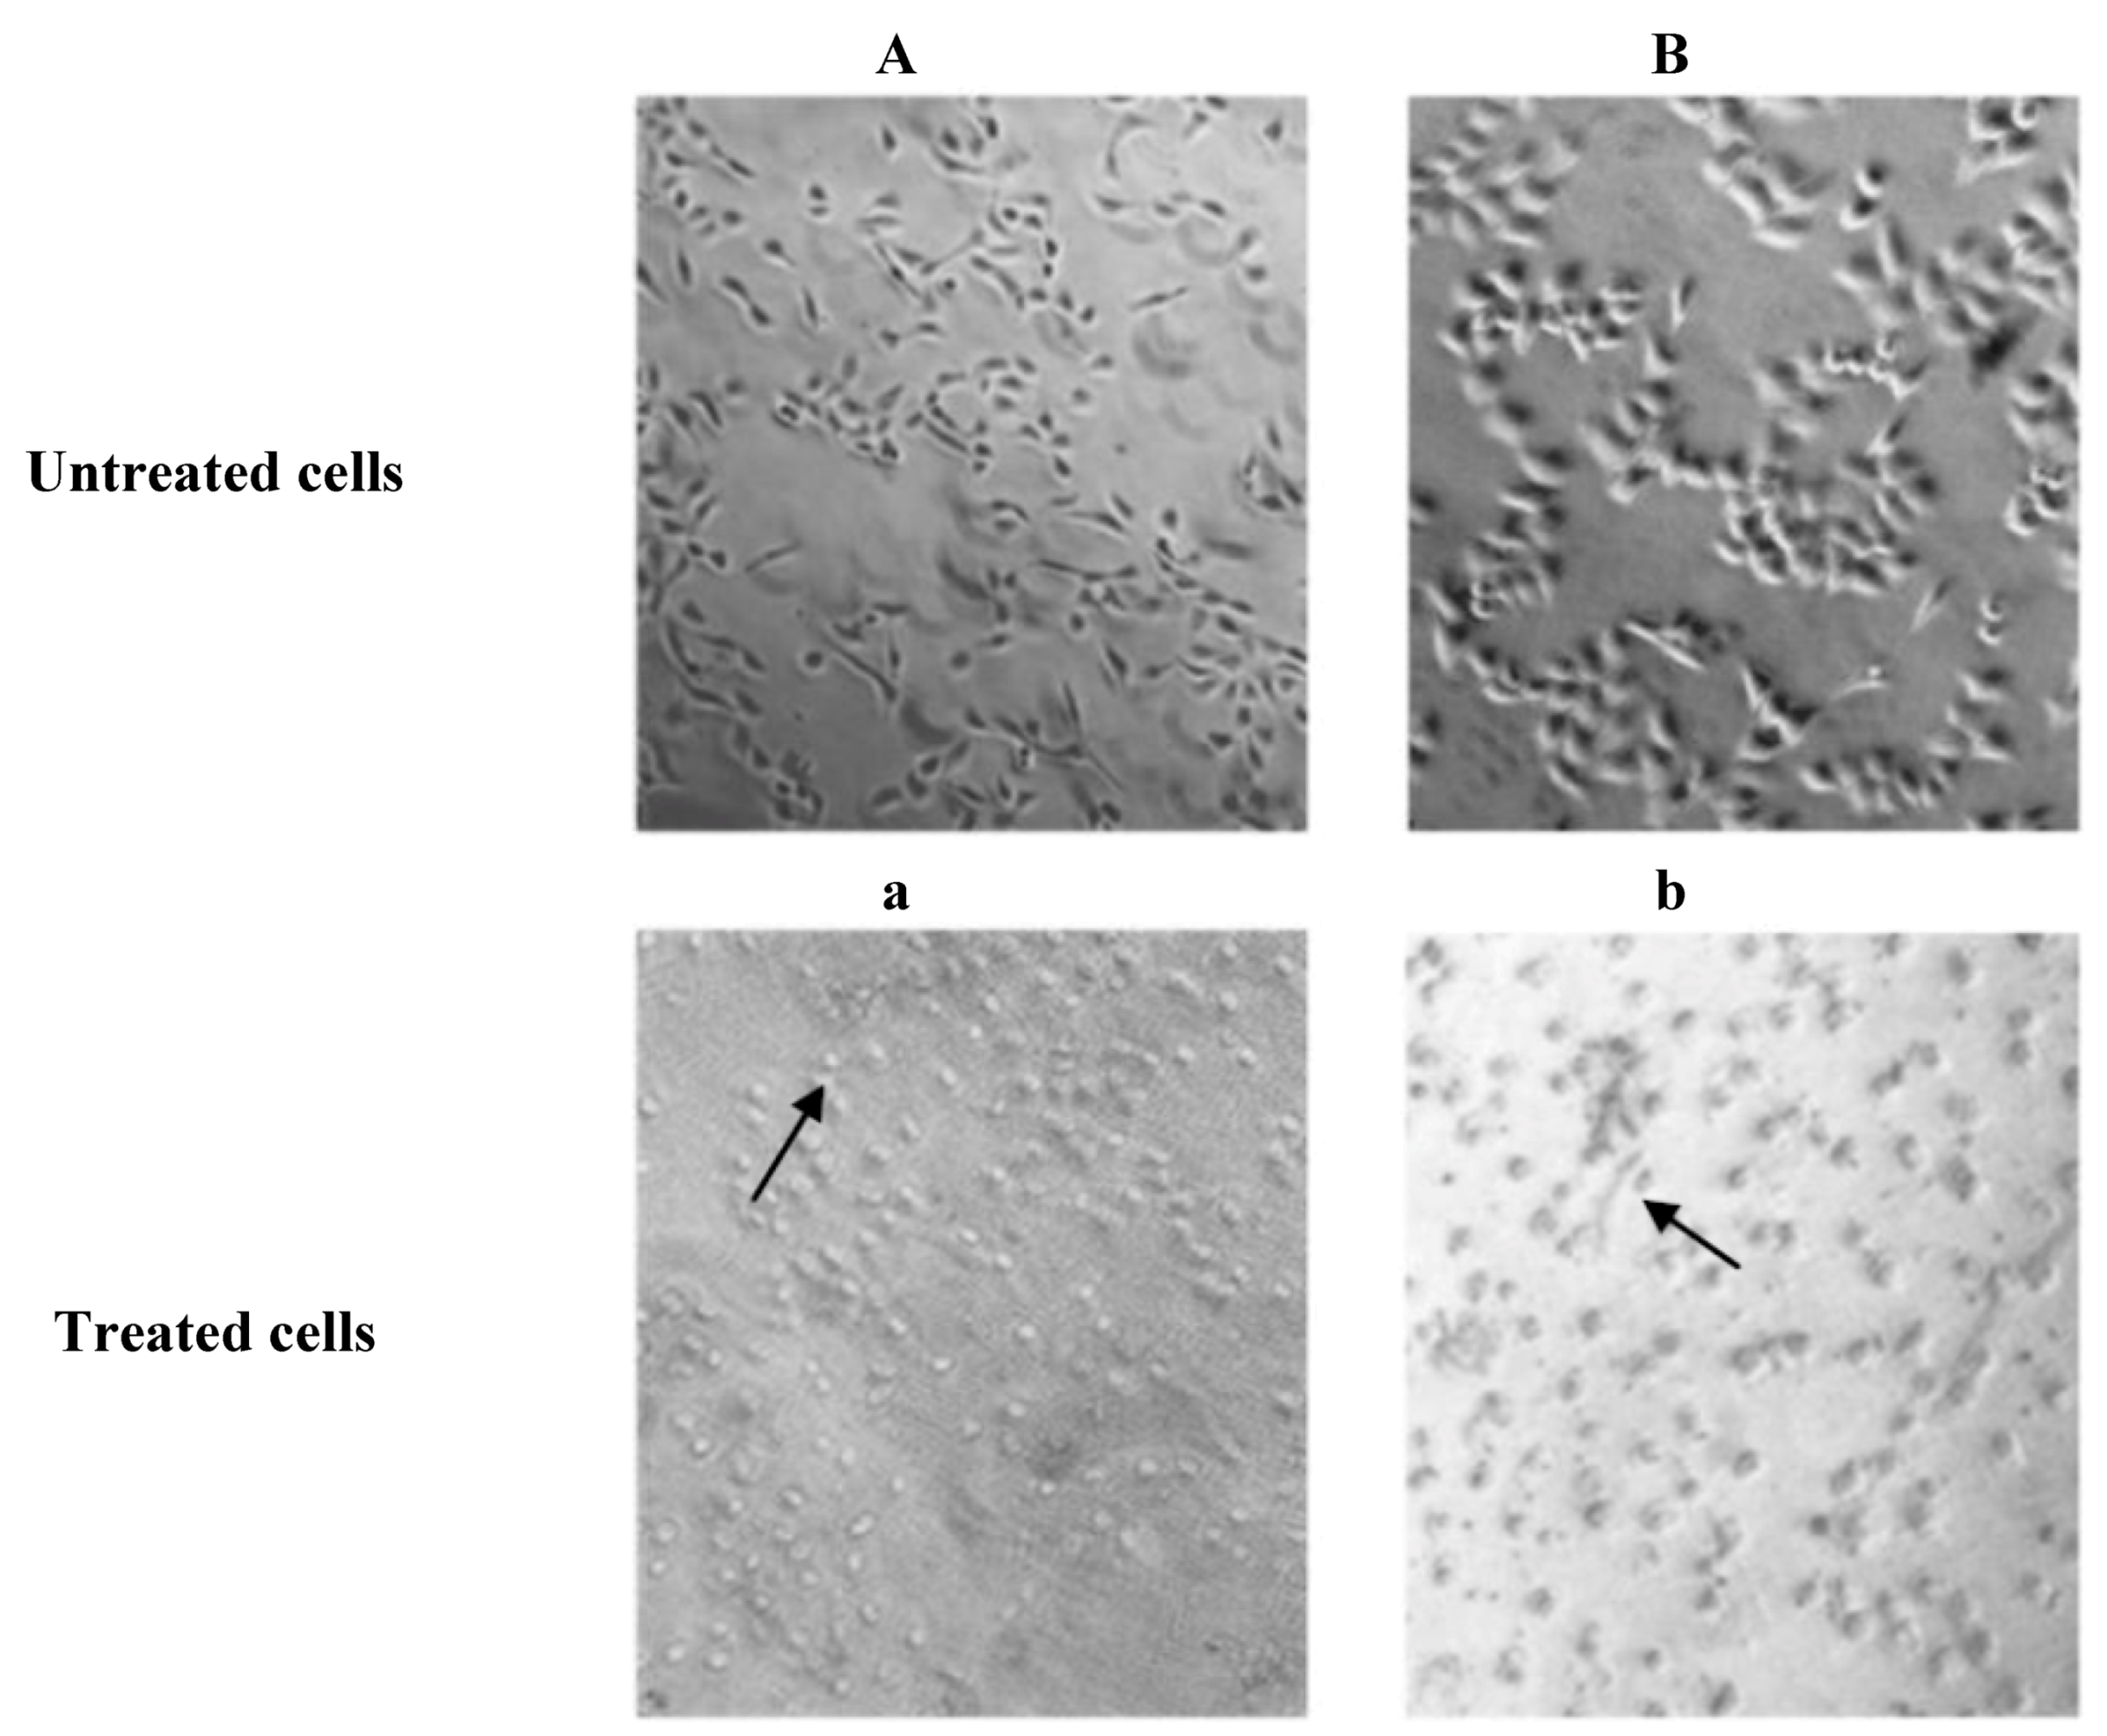
2.3. Microscopic Examination
2.4. Analysis of Apoptosis by Flow Cytometry
| MCF-7 Cells (%) | HeLa Cells (%) | S.E.M | |||||
|---|---|---|---|---|---|---|---|
| Untreated | PEs-treated | PMA-treated | Untreated | PEs-treated | PMA-treated | ||
| Viable | 98.1 a | 29.7 b | 26.4 c | 98.7 a | 31.5 b | 29.5 b | 2.78 |
| Apoptotic | 1.5 d | 30.3 b | 35.4 a | 2.3 d | 25.9 c | 28.8 bc | 2.28 |
| Dead | 2.2 d | 52.4 ab | 55.1 a | 2.6 d | 46.8 c | 48.9 bc | 3.47 |
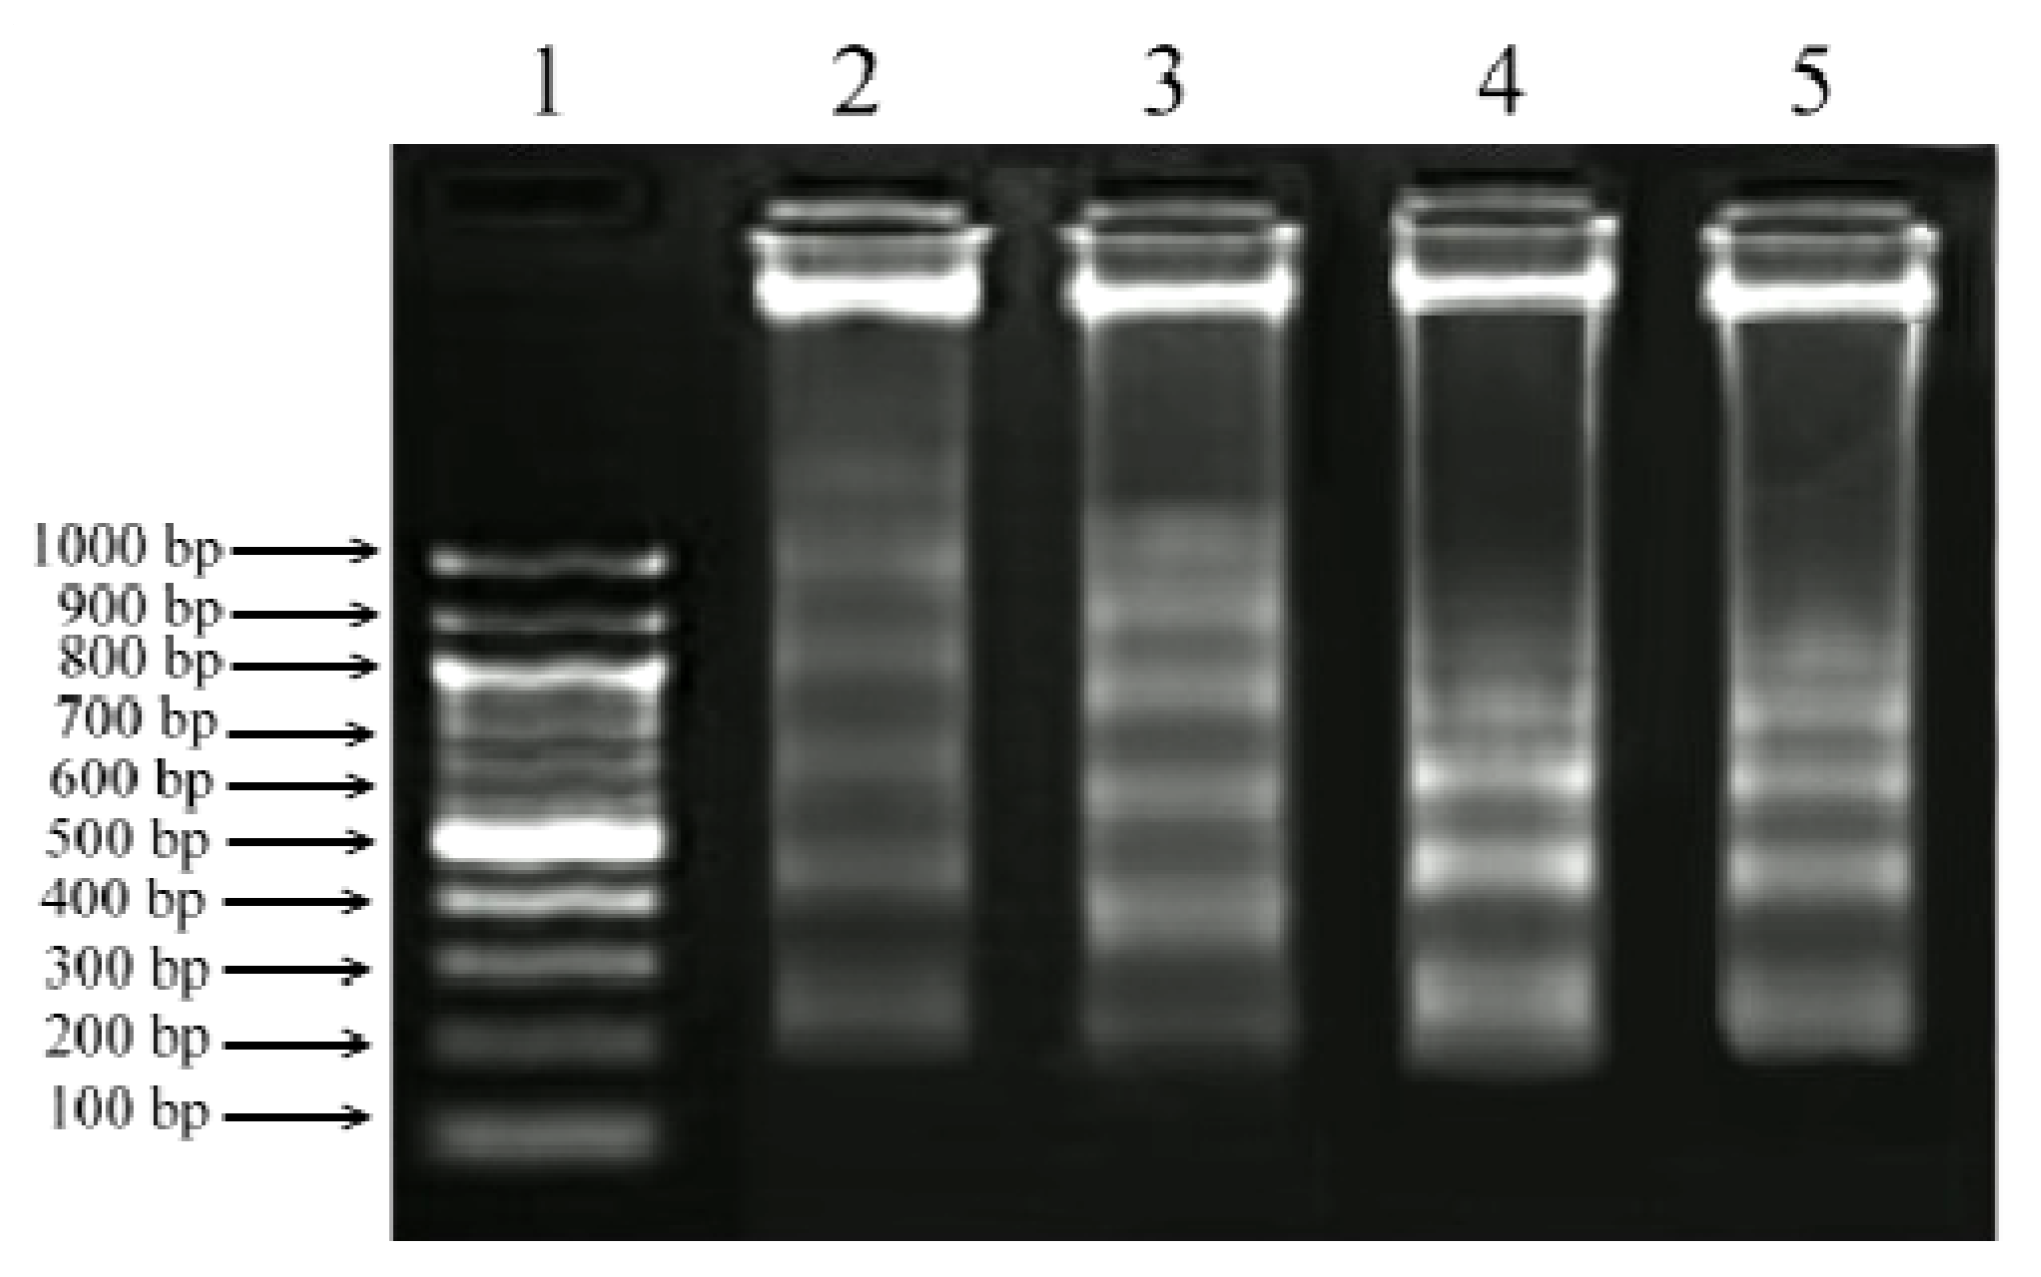
2.5. DNA Fragmentation Assay

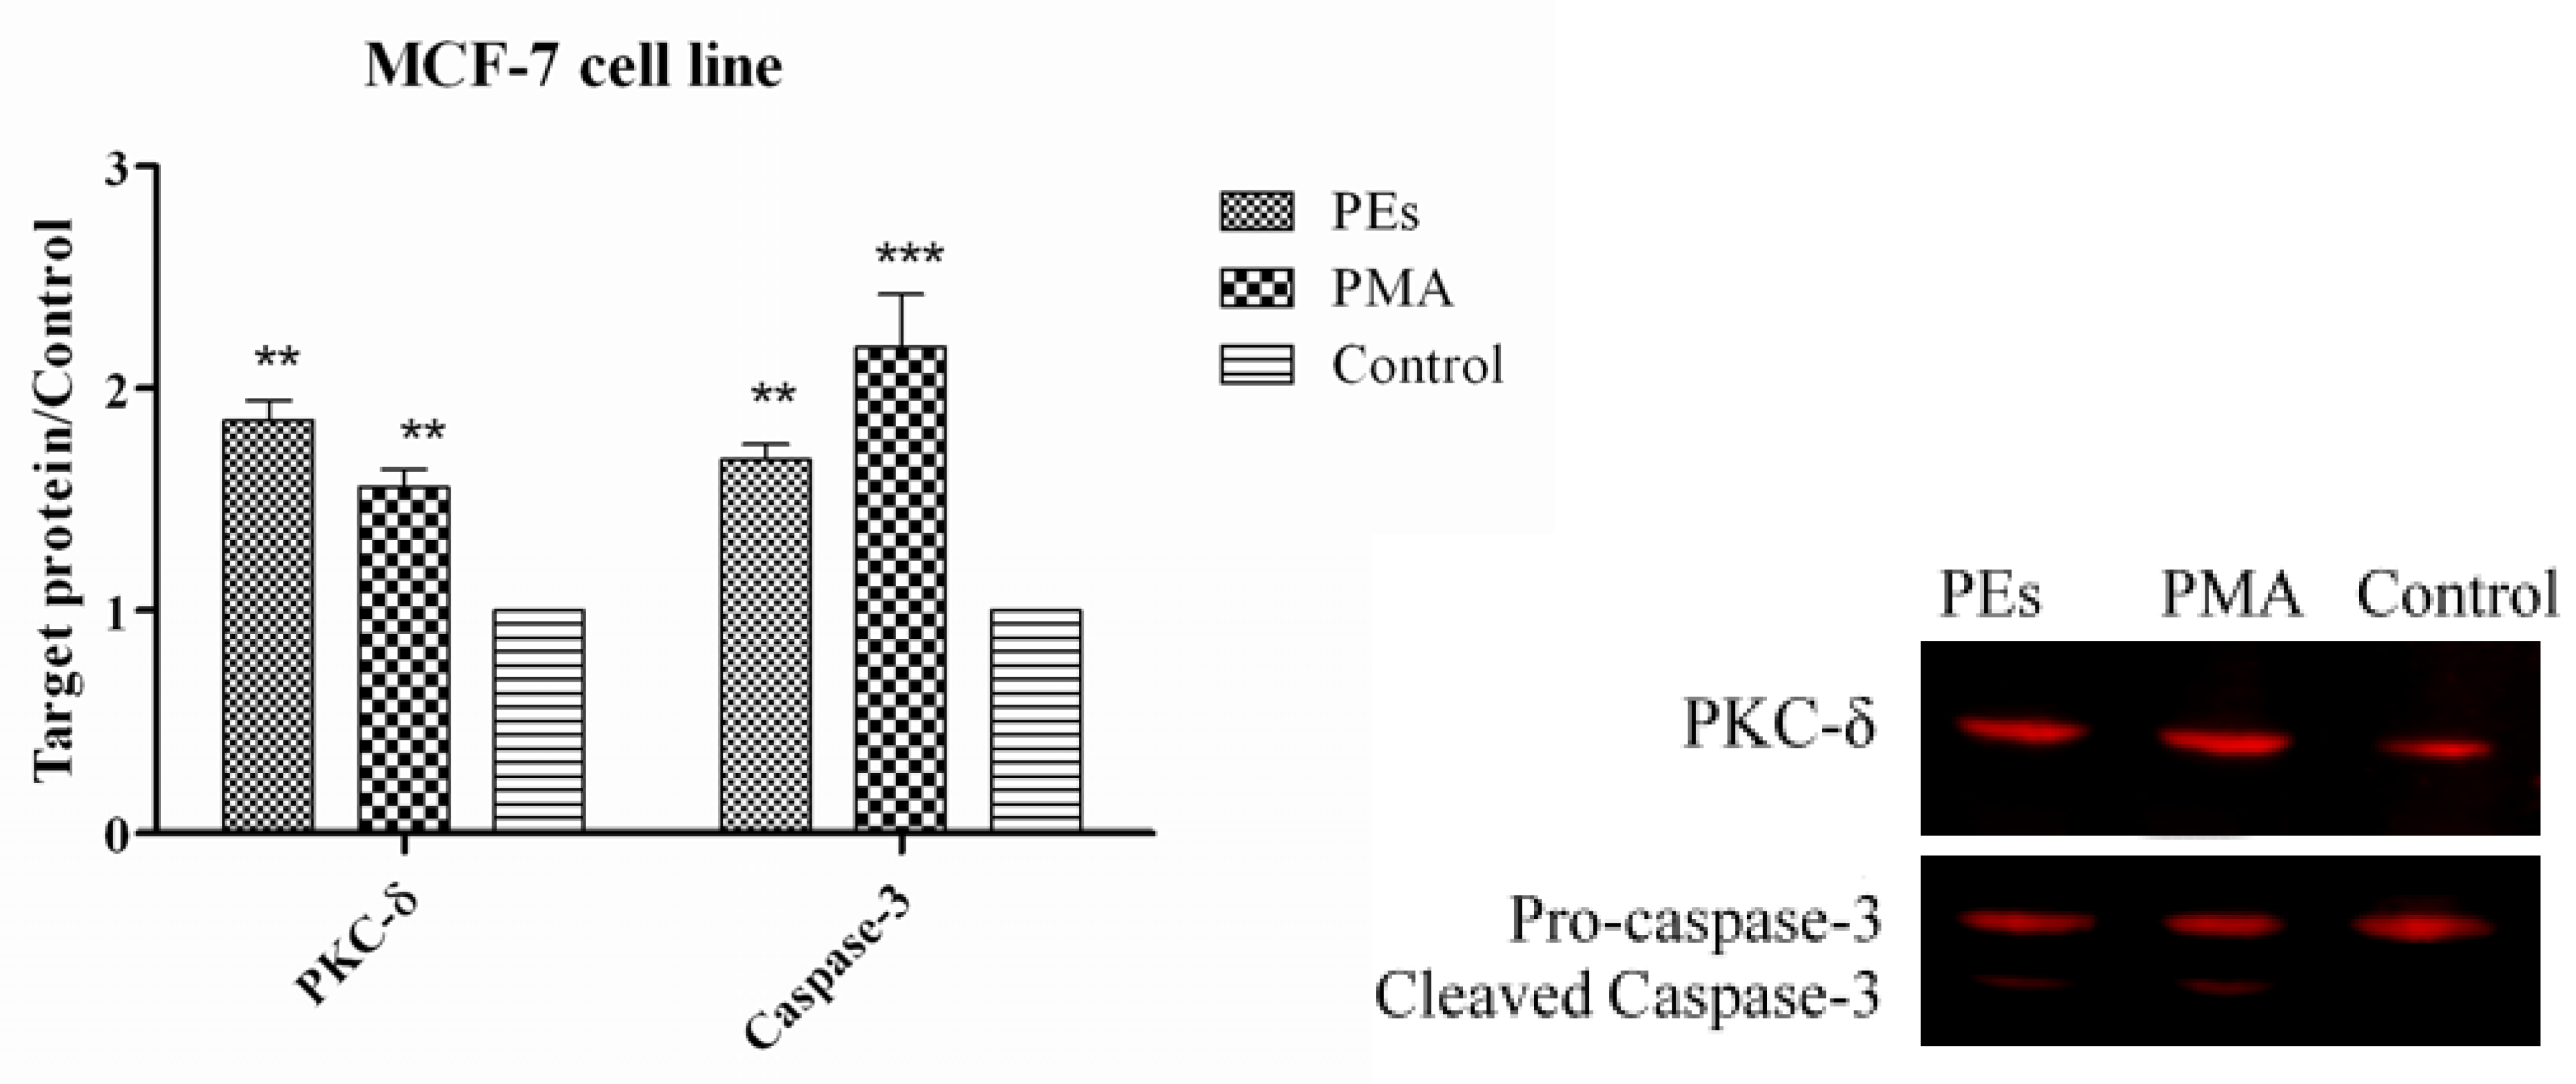
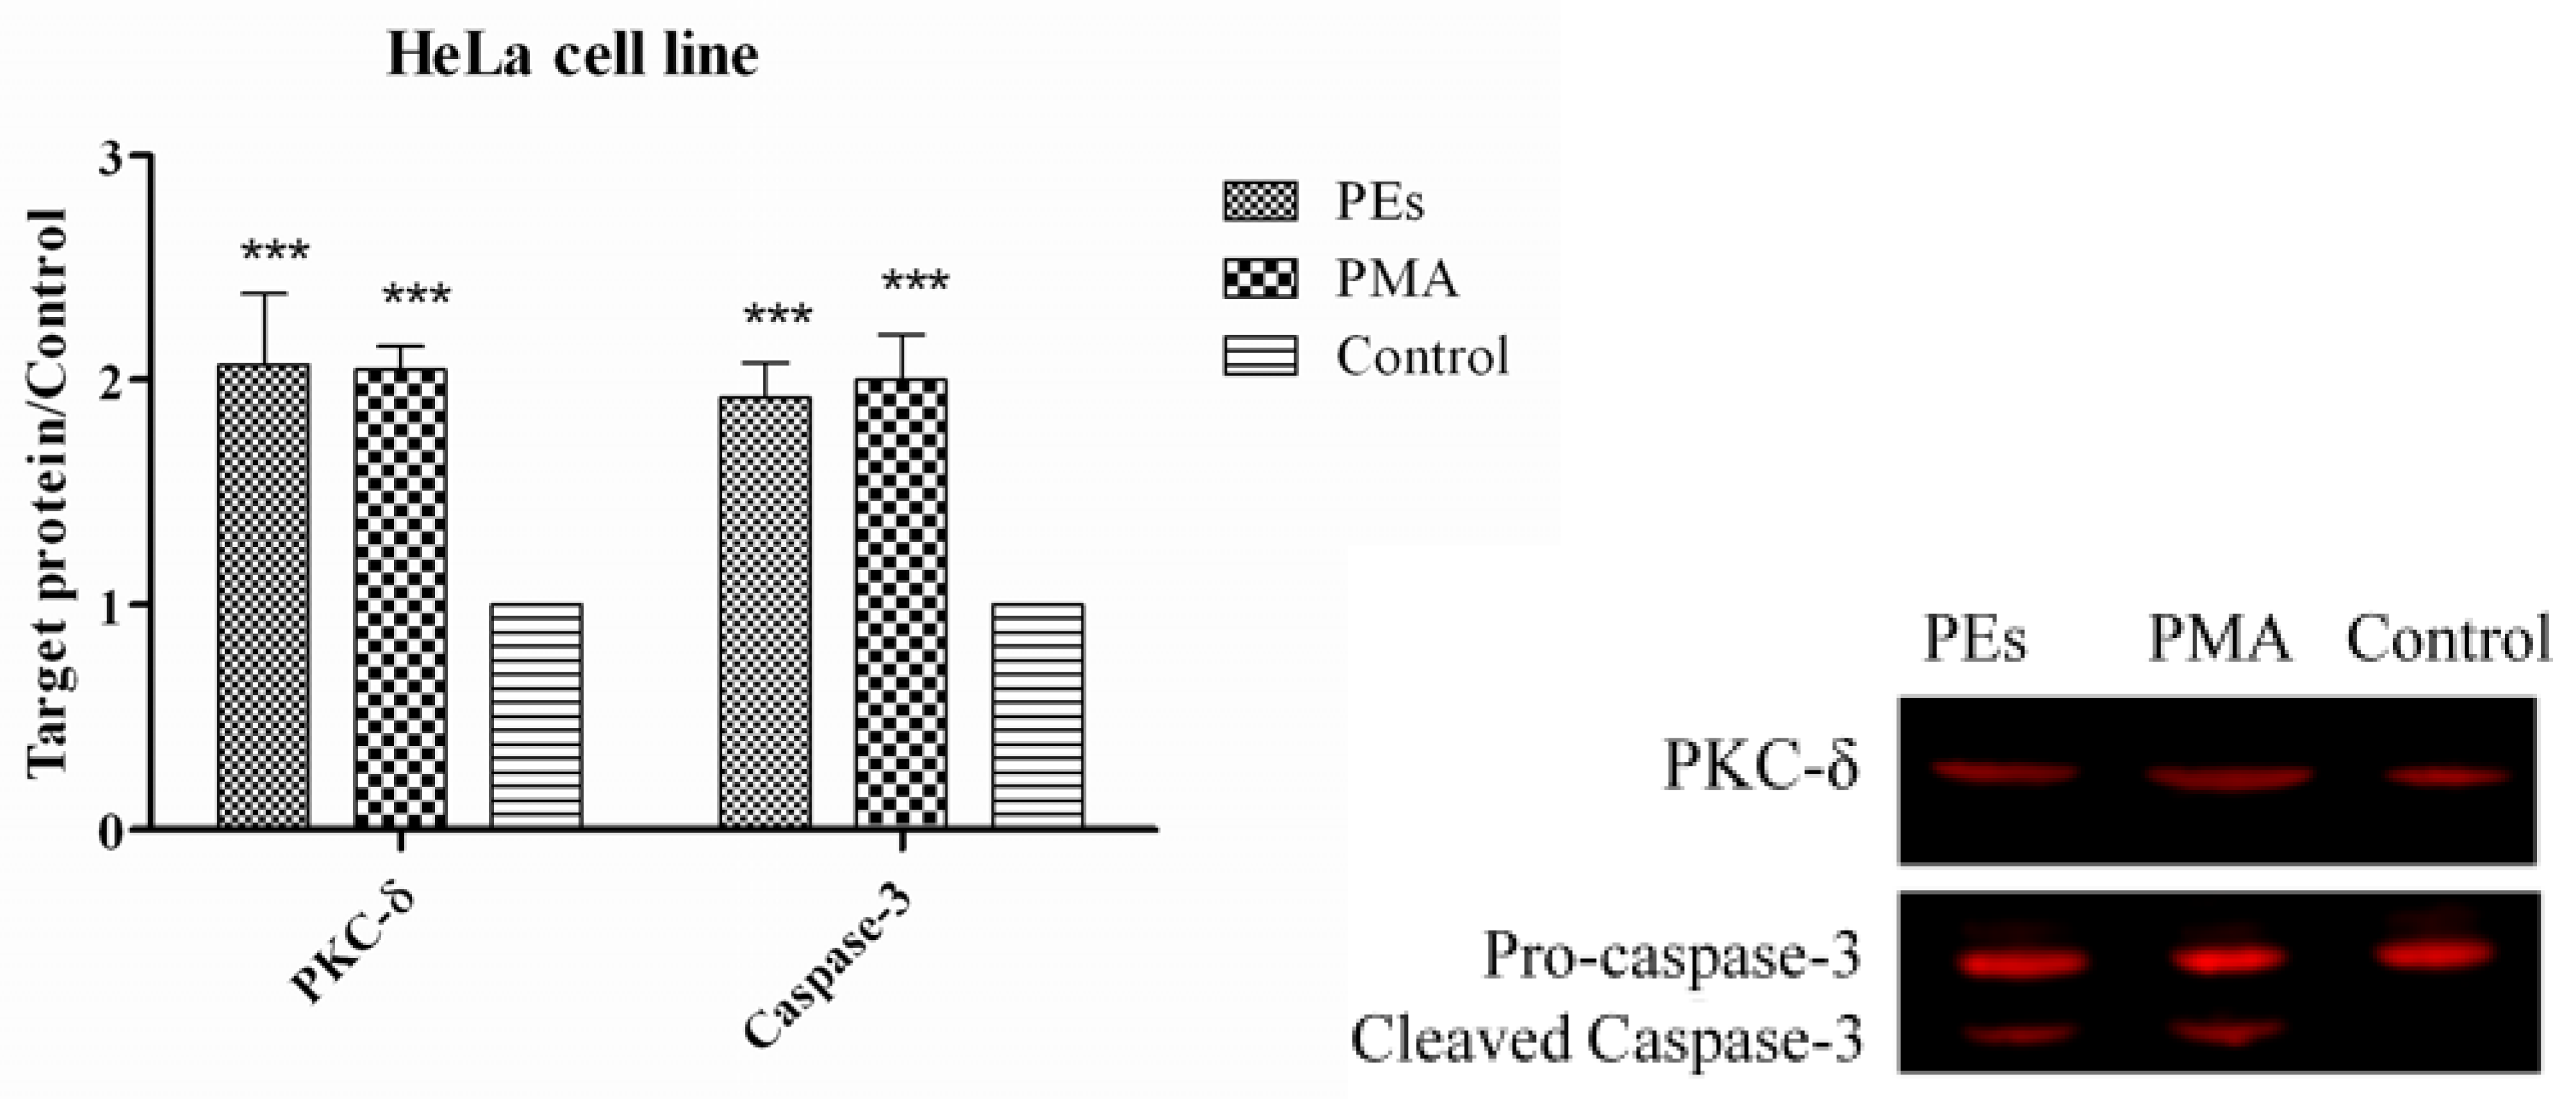
2.6. Gene Expression Analysis
| Down-regulated genes | MCF-7 Cells | HeLa Cells | ||||||
|---|---|---|---|---|---|---|---|---|
| PEs | p 1 | PMA | p | PEs | p | PMA | p | |
| c-Myc | −2.6 | 0.02 | −3.2 | 0.03 | −2.3 | 0.03 | −3.6 | 0.04 |
| c-Jun | −1.3 | 0.04 | −1.7 | 0.02 | −1.7 | 0.04 | −2.2 | 0.03 |
| c-Fos | −2.1 | 0.03 | −3.2 | 0.04 | −2.5 | 0.02 | −3.5 | 0.05 |
2.7. Western Blot Assay

3. Experimental
3.1. Plant Materials
3.2. Phorbol Esters Isolation
3.3. Cell Lines and Cell Culture
3.4. Proliferation Assay
3.5. Microscopic Examination
3.6. Analysis of Apoptosis by Flow-Cytometry
3.7. DNA Fragmentation Assay
3.8. Gene Expression Analyses
| Targeted gene | Forward | Reverse | Reference |
|---|---|---|---|
| c-Myc | tgcgtgaccagatccc | cgcacaagagttccgta | [32] |
| c-Jun | cttcaacccaggcgcgctgagca | gtctgaggctcctccttcagggcct | [33] |
| c-Fos | tgatgacctgggcttcccag | caaagggctcggtcttcagc | [33] |
| GAPDH | ccggatcgaccactacctgggcaac | gttccccacgtactggcccaggacca | [34] |
3.9. Western Blotting
3.10. Statistical Analysis
4. Conclusions
Acknowledgments
References
- Thomas, R.; Sah, N.; Sharma, P. Therapeutic biology of Jatropha curcas: A mini review. Curr. Pharm. Biotechnol. 2008, 9, 315–324. [Google Scholar] [CrossRef]
- Aiyelaagbe, O.O.; Hamid, A.A.; Fattorusso, E.; Taglialatela Scafati, O. Cytotoxic activity of crude extracts as well as of pure components from Jatropha species, plants used extensively in african traditional medicine. Evid. Based Complementary Altern. Med. 2011, 2011, 1–7. [Google Scholar]
- Oskoueian, E.; Abdullah, N.; Ahmad, S.; Saad, W.Z.; Omar, A.R.; Ho, Y.W. Bioactive compounds and biological activities of Jatropha curcas L. kernel meal extract. Int. J. Mol. Sci. 2011, 12, 5955–5970. [Google Scholar] [CrossRef]
- Oskoueian, E.; Abdullah, N.; Saad, W.Z.; Omar, A.R.; Ahmad, S.; Kuan, W.B.; Zolkifli, N.A.; Hendra, R.; Ho, Y.W. Antioxidant, anti-inflammatory and anticancer activities of methanolic extracts from Jatropha curcas L. J. Med. Plants Res. 2011, 5, 49–57. [Google Scholar]
- Namuli, A.; Abdullah, N.; Sieo, C.C.; Zuhainis, S.W.; Oskoueian, E. Phytochemical compounds and antibacterial activity of Jatropha curcas Linn. extracts. J. Med. Plants Res. 2011, 5, 3982–3990. [Google Scholar]
- Murugesan, A.; Umarani, C.; Subramanian, R.; Nedunchezhian, N. Bio-diesel as an alternative fuel for diesel engines—A review. Renew. Sust. Energ. Rev. 2009, 13, 653–662. [Google Scholar] [CrossRef]
- Devappa, R.K.; Makkar, H.P.S.; Becker, K. Nutritional, biochemical, and pharmaceutical potential of proteins and peptides from Jatropha: Review. J. Agric. Food Chem. 2010, 58, 6543–6555. [Google Scholar] [CrossRef]
- Oskoueian, E.; Abdullah, N.; Saad, W.Z.; Omar, A.R.; Puteh, M.B.; Ho, Y.W. Anti-nutritional metabolites and effect of treated Jatropha curcas kernel meal on rumen fermentation in vitro. J. Anim. Vet. Adv. 2011, 10, 214–220. [Google Scholar] [CrossRef]
- Goel, G.; Makkar, H.P.S.; Francis, G.; Becker, K. Phorbol esters: Structure, biological activity, and toxicity in animals. Int. J. Toxicol. 2007, 26, 279–288. [Google Scholar] [CrossRef]
- Haas, W.; Mittelbach, M. Novel 12-deoxy-16-hydroxyphorbol diesters isolated from the seed oil of Jatropha curcas. J. Nat. Prod. 2002, 65, 1434–1440. [Google Scholar] [CrossRef]
- Kazanietz, M.G. Targeting protein kinase C and “non-kinase” phorbol ester receptors: Emerging concepts and therapeutic implications. BBA-Proteins Proteom. 2005, 1754, 296–304. [Google Scholar] [CrossRef]
- Makkar, H.P.S.; Siddhuraju, P.; Becker, K. Methods in Molecular Biology: Plant Secondary Metabolites; Humana Press: Totowa, NJ, USA, 2007; pp. 93–100. [Google Scholar]
- Li, C.Y.; Devappa, R.K.; Liu, J.X.; Lv, J.M.; Makkar, H.P.S.; Becker, K. Toxicity of Jatropha curcas phorbol esters in mice. Food Chem. Toxicol. 2009, 48, 620–625. [Google Scholar]
- Avila, G.E.; Zheng, X.; Cui, X.X.; Ryan, A.D.; Hansson, A.; Suh, J.; Rabson, A.B.; Chang, R.L.; Shih, W.J.; Lin, Y. Inhibitory effects of 12-O-tetradecanoylphorbol-13-acetate alone or in combination with all-trans retinoic acid on the growth of cultured human pancreas cancer cells and pancreas tumor xenografts in immunodeficient mice. J. Pharmacol. Exp. Ther. 2005, 315, 170–187. [Google Scholar] [CrossRef]
- Bond, J.A.; Gescher, A.J.; Verschoyle, R.D.; Lemoine, N.R.; Errington, R.; Wiltshire, M.; Smith, P.J.; Wynford Thomas, D. Cytotoxic action of phorbol esters on human pancreatic cancer cells. Int. J. Cancer 2007, 121, 1445–1454. [Google Scholar]
- Day, M.; Zhao, X.; Wu, S.; Swanson, P.; Humphrey, P. Phorbol ester-induced apoptosis is accompanied by NGFI-A and C-fos activation in androgen-sensitive prostate cancer cells. Cell Growth Differ. 1994, 5, 735–741. [Google Scholar]
- Hatton, J.P.; Gaubert, F.; Cazenave, J.-P.; Schmitt, D. Microgravity modifies protein kinase C isoform translocation in the human monocytic cell line U937 and human peripheral blood T-cells. J. Cell. Biochem. 2002, 87, 39–50. [Google Scholar] [CrossRef]
- Udou, T.; Hachisuga, T.; Tsujioka, H.; Kawarabayashi, T. The role of c-jun protein in proliferation and apoptosis of the endometrium throughout the menstrual cycle. Gynecol. Obstet. Inves. 2004, 57, 121–126. [Google Scholar]
- Oh, J.I.; Chun, K.H.; Joo, S.H.; Oh, Y.T.; Lee, S.K. Caspase-3-dependent protein kinase C delta activity is required for the progression of Ginsenoside-Rh2-induced apoptosis in SK-HEP-1 cells. Cancer Lett. 2005, 230, 228–238. [Google Scholar] [CrossRef]
- Harborne, J.B.; Williams, C.A. Advances in flavonoid research since 1992. Phytochemistry 2000, 55, 481–504. [Google Scholar]
- Chen, J.; Giridhar, K.V.; Zhang, L.; Xu, S.; Wang, Q.J. A protein kinase C/protein kinase D pathway protects LNCaP prostate cancer cells from phorbol ester-induced apoptosis by promoting ERK1/2 and NF-κB activities. Carcinogenesis 2011, 32, 1198–1206. [Google Scholar] [CrossRef]
- Cheftel, J.C. Emerging risks related to food technology. In Advances in Food Protection; Hefnawy, M., Ed.; Springer: Dordrecht, The Netherlands, 2011; pp. 223–254. [Google Scholar]
- Lai, J.M.; Hsieh, C.L.; Chang, Z.F. Caspase activation during phorbol ester-induced apoptosis requires ROCK-dependent myosin-mediated contraction. J. Cell Sci. 2003, 116, 3491–3501. [Google Scholar] [CrossRef]
- Laouar, A.; Glesne, D.; Huberman, E. Protein kinase C-β, fibronectin, α5β1-integrin, and tumor necrosis factor-α are required for phorbol diester-induced apoptosis in human myeloid leukemia cells. Mol. Carcinogen. 2001, 32, 195–205. [Google Scholar] [CrossRef]
- Hofmann, J. Protein kinase C isozymes as potential targets for anticancer therapy. Curr. Cancer Drug Tar. 2004, 4, 125–146. [Google Scholar] [CrossRef]
- Fujii, T.; Garcia-Bermejo, M.L.; Bernabo, J.L.; Caamano, J.; Ohba, M.; Kuroki, T.; Li, L.; Yuspa, S.H.; Kazanietz, M.G. Involvement of protein kinase C (PKC) in phorbol ester-induced apoptosis in LNCaP prostate cancer cells. J. Biol. Chem. 2000, 275, 7574–7582. [Google Scholar]
- Park, I.C.; Park, M.J.; Rhee, C.H.; Lee, J.I.; Choe, T.B.; Jang, J.J.; Lee, S.H.; Hong, S.I. Protein kinase C activation by PMA rapidly induces apoptosis through caspase-3/CPP32 and serine protease(s) in a gastric cancer cell line. Int. J. Oncol. 2001, 18, 1077–1083. [Google Scholar]
- Association of Official Analytical Chemists (AOAC), Official Methods of Analysis, 17th ed; AOAC: Washington, DC, USA, 2000; pp. 89–110.
- Sharif, R.; Ghazali, A.; Rajab, N.; Haron, H.; Osman, F. Toxicological evaluation of some Malaysian locally processed raw food products. Food Chem. Toxicol. 2008, 46, 368–374. [Google Scholar] [CrossRef]
- Darzynkiewicz, Z.; Juan, G. Selective extraction of fragmented DNA from apoptotic cells for analysis by gel electrophoresis and identification of apoptotic cells by flow cytometry. In DNA Repair Protocols: Eukaryotic Systems; Henderson, D.S., Ed.; Humana Press: New York, NY, USA, 1999; Volume 113, pp. 599–606. [Google Scholar]
- Vandesompele, J.; De Preter, K.; Pattyn, F.; Poppe, B.; Van Roy, N.; De Paepe, A.; Speleman, F. Accurate normalization of real-time quantitative RT-PCR data by geometric averaging of multiple internal control genes. Genome Biol. 2002, 3, 1–11. [Google Scholar]
- Oxelmark, E.; Roth, J.M.; Brooks, P.C.; Braunstein, S.E.; Schneider, R.J.; Garabedian, M.J. The cochaperone p23 differentially regulates estrogen receptor target genes and promotes tumor cell adhesion and invasion. Mol. Cell. Biol. 2006, 26, 5205–5213. [Google Scholar] [CrossRef]
- Hu, D.G.; Mackenzie, P.I. Estrogen receptor α, fos-related antigen-2, and c-Jun coordinately regulate human UDP glucuronosyltransferase 2B15 and 2B17 expression in response to 17β-estradiol in MCF-7 cells. Mol. Pharmacol. 2009, 76, 425–439. [Google Scholar] [CrossRef]
- Rangatia, J.; Vangala, R.K.; Treiber, N.; Zhang, P.; Radomska, H.; Tenen, D.G.; Hiddemann, W.; Behre, G. Downregulation of c-Jun expression by transcription factor C/EBPα is critical for granulocytic lineage commitment. Mol. Cell. Biol. 2002, 22, 8681–8694. [Google Scholar] [CrossRef]
- SAS, SAS, Statistical Analysis Institute (Version 9.1.3); SAS Institute Inc.: Cary, NC, USA, 2003.
- Sample Availability: Samples of the compounds are available from the authors.
© 2012 by the authors; licensee MDPI, Basel, Switzerland. This article is an open-access article distributed under the terms and conditions of the Creative Commons Attribution license (http://creativecommons.org/licenses/by/3.0/).
Share and Cite
Oskoueian, E.; Abdullah, N.; Ahmad, S. Phorbol Esters from Jatropha Meal Triggered Apoptosis, Activated PKC-δ, Caspase-3 Proteins and Down-Regulated the Proto-Oncogenes in MCF-7 and HeLa Cancer Cell Lines. Molecules 2012, 17, 10816-10830. https://doi.org/10.3390/molecules170910816
Oskoueian E, Abdullah N, Ahmad S. Phorbol Esters from Jatropha Meal Triggered Apoptosis, Activated PKC-δ, Caspase-3 Proteins and Down-Regulated the Proto-Oncogenes in MCF-7 and HeLa Cancer Cell Lines. Molecules. 2012; 17(9):10816-10830. https://doi.org/10.3390/molecules170910816
Chicago/Turabian StyleOskoueian, Ehsan, Norhani Abdullah, and Syahida Ahmad. 2012. "Phorbol Esters from Jatropha Meal Triggered Apoptosis, Activated PKC-δ, Caspase-3 Proteins and Down-Regulated the Proto-Oncogenes in MCF-7 and HeLa Cancer Cell Lines" Molecules 17, no. 9: 10816-10830. https://doi.org/10.3390/molecules170910816
APA StyleOskoueian, E., Abdullah, N., & Ahmad, S. (2012). Phorbol Esters from Jatropha Meal Triggered Apoptosis, Activated PKC-δ, Caspase-3 Proteins and Down-Regulated the Proto-Oncogenes in MCF-7 and HeLa Cancer Cell Lines. Molecules, 17(9), 10816-10830. https://doi.org/10.3390/molecules170910816