The Dual Action of Epigallocatechin Gallate (EGCG), the Main Constituent of Green Tea, against the Deleterious Effects of Visible Light and Singlet Oxygen-Generating Conditions as Seen in Yeast Cells

Abstract
:1. Introduction
2. Results and Discussion
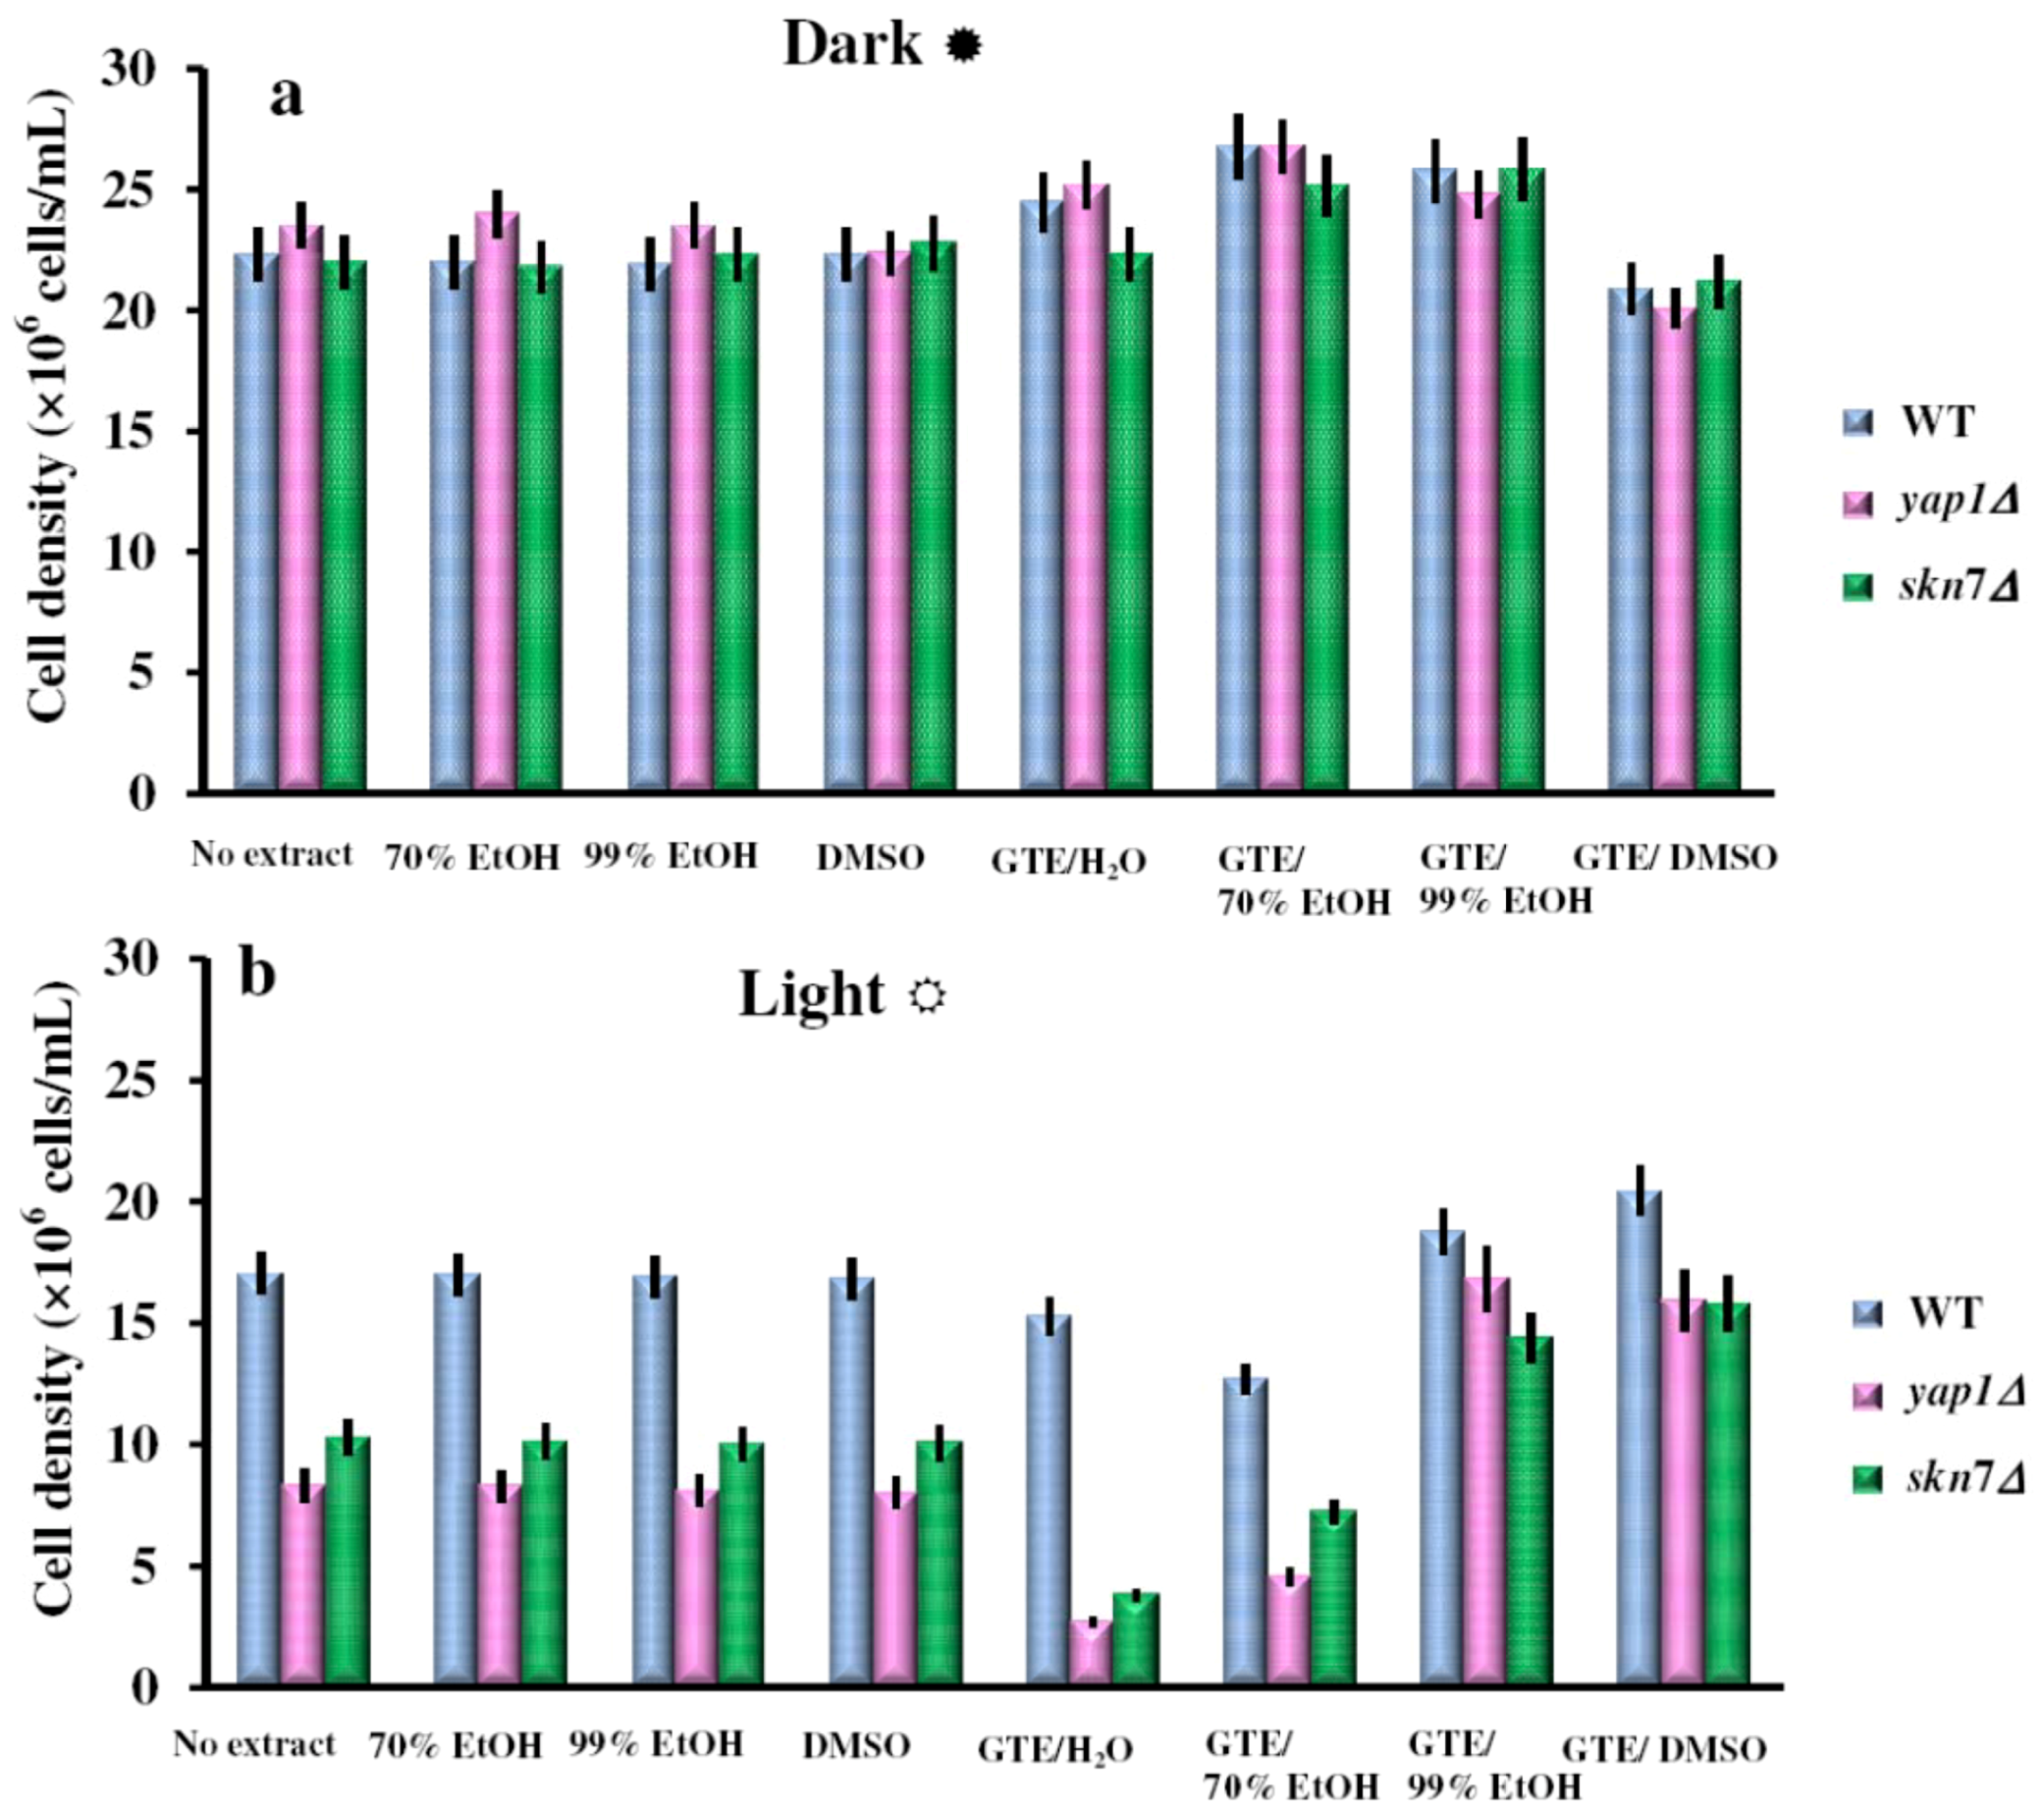
2.1. The Green Tea Extracts Exhibit Solvent-Dependent Effects on Yeast Cells Grown under Visible Light
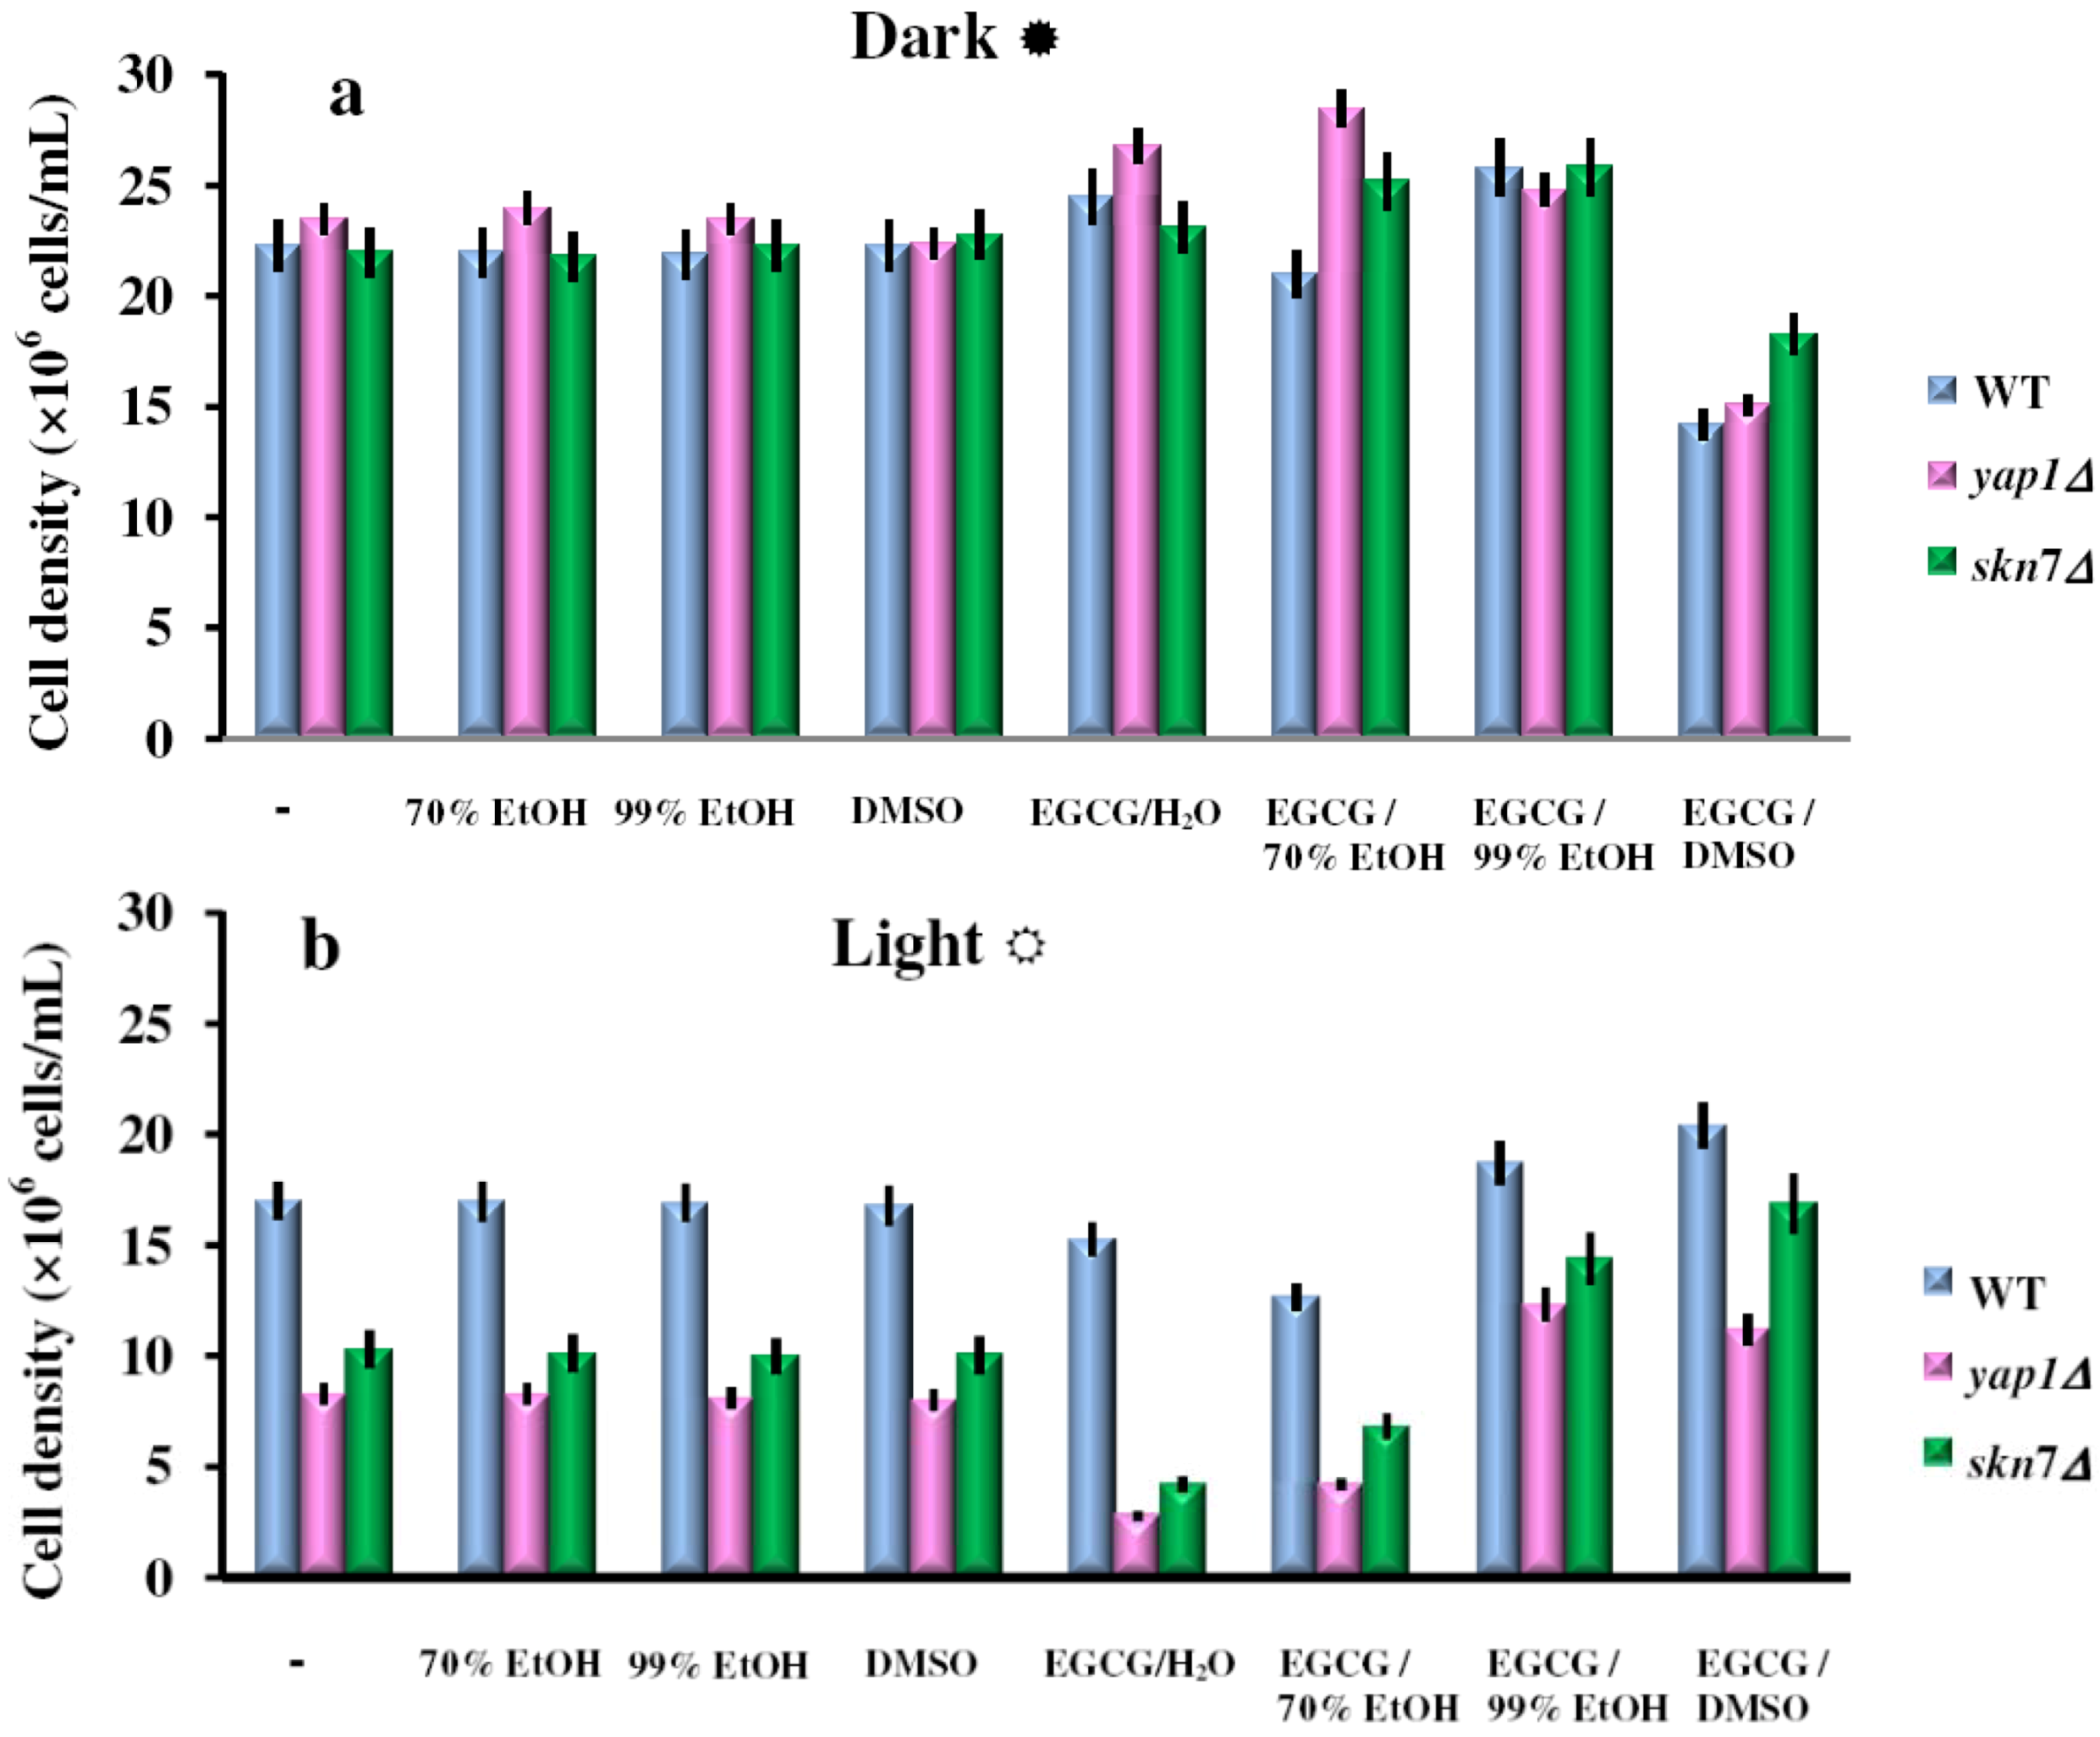
2.2. Effect of the Green Tea Major Component EGCG on the Yeast Cells Grown under Illumination


2.3. The Effect of the Green Tea Major Component EGCG on the Yeast Cells Grown under Illumination Depends on the Oxidative State of the Cell

| Strain used | Gene deleted | Effect of EGCG/H2O | Wild type function |
|---|---|---|---|
| Wild type | No | Control | |
| sod1Δ | SOD1 | − a | Cu,Zn-Superoxide dismutase |
| sod2Δ | SOD2 | + b | Mn-Superoxide dismutase |
| skn7Δ | SKN7 | − | Oxidative stress response |
| yap1Δ | YAP1 | − | Oxidative stress response |
| ahp1Δ | AHP1 | + | Thioredoxin peroxidase with alkyl hydroperoxide reductase activity controlling the levels of alkylhydoperoxides |
| ccp1Δ | CCP1 | ND c | Citocrome c peroxidase |
| cta1Δ | CTA1 | ND | Catalase A (localized in peroxisomal and mitochondrial matrices) |
| ctt1Δ | CTT1 | ND | Catalase T (localized in cytoplasm) |
| gpx1Δ | GPX1 | ND | Glutathione peroxidase |
| gpx2Δ | GPX2 | ND | Glutathione peroxidase |
| hyr1Δ | HYR1 | − | Thiol peroxidase that functions as a hydroperoxide receptor to sense intracellular hydroperoxide levels and transduce a redox signal to the Yap1p transcription factor |
| prx1Δ | PRX1 | ND | Mitochondrial peroxiredoxin with thioredoxin peroxidase activity |
| tsa1Δ | TSA1 | − | Thioredoxin peroxidase which control the levels of H2O2. Gain-of-function mutant is resistant to alkyl hydroperoxides |
| tsa2Δ | TSA2 | ND | Stress inducible cytoplasmic thioredoxin peroxidase |
 ) or under constant illumination (
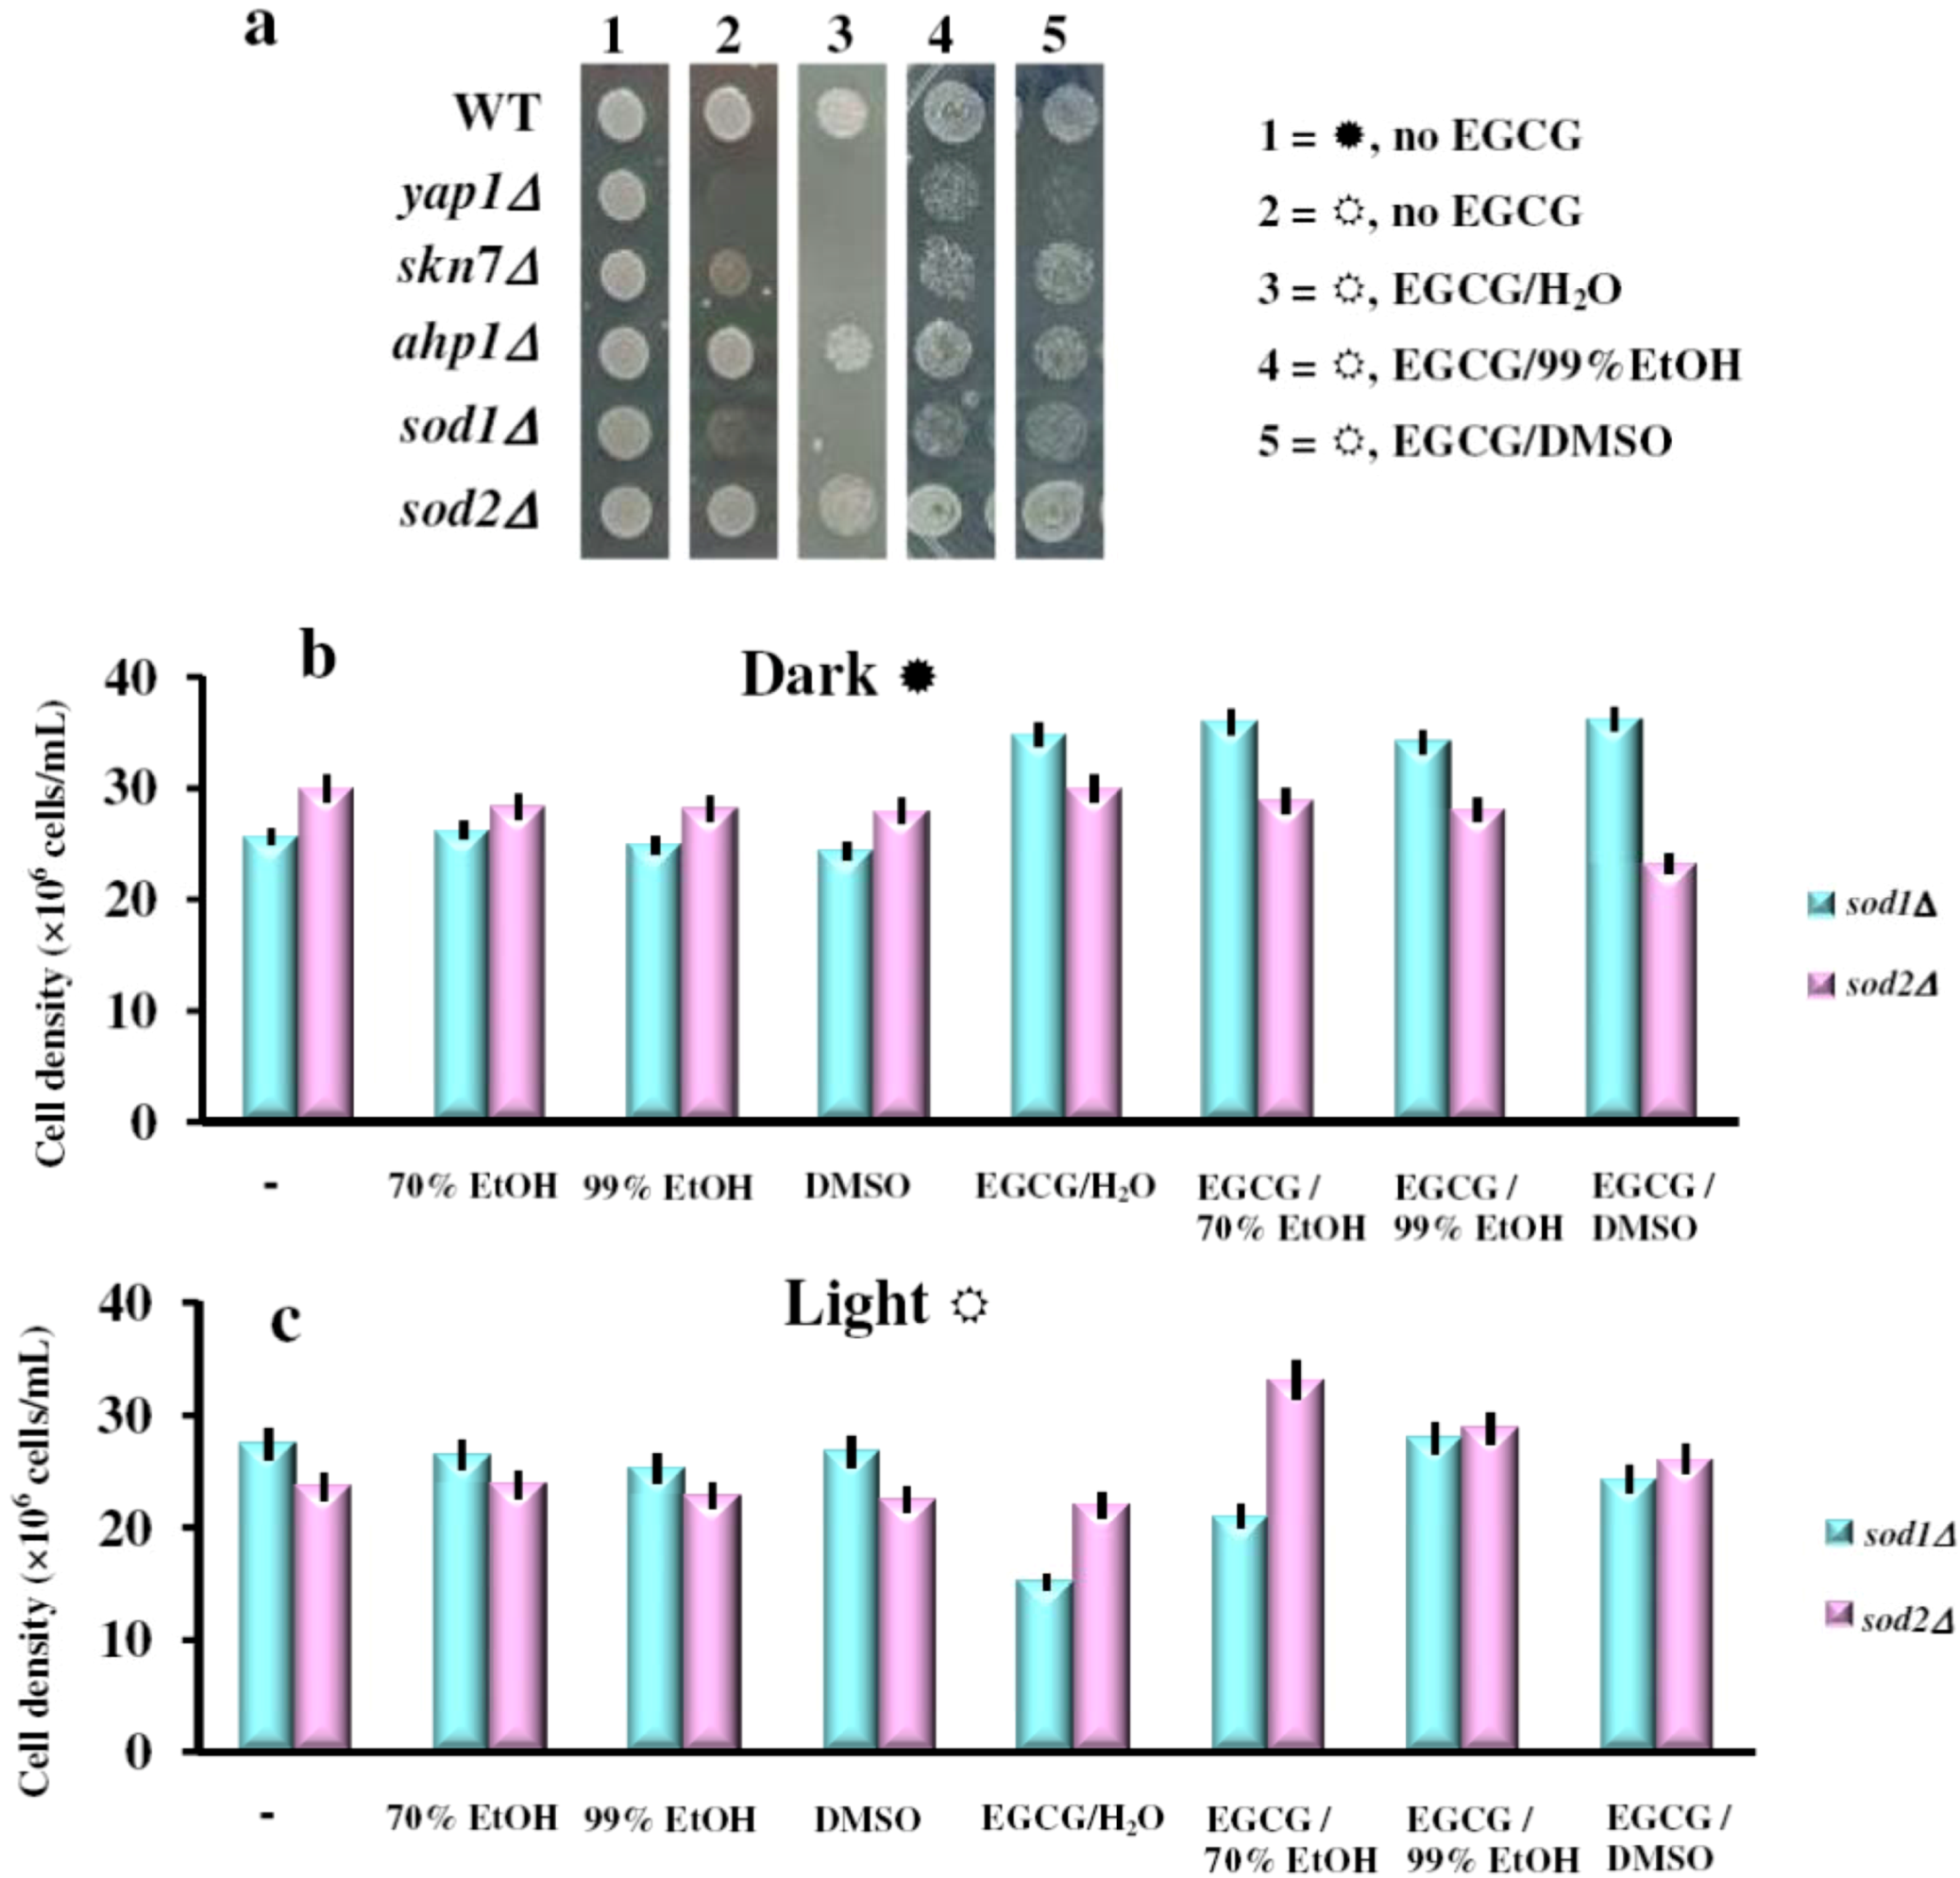
  ). The experiments were repeated on three different days and the results were similar. (b) Effect of EGCG solutions on photosensitivity of sod1Δ and sod2Δ yeast knock-out mutants. Overnight pre-cultures were inoculated in fresh YPD media at 2 × 10⁵ cells/mL, then cells were incubated with shaking (200 rpm) at 28 °C for two hours before the EGCG solutions were added (final EGCG concentration, 10 μg/mL). The cell growth was detected after 24 h incubation in the dark ( ) or under constant illumination with white light (c). For controls, the same amount of carrier solvents as in the EGCG experiments were used. Each determination was repeated three times on different days, with no significant variations (p < 0.05). Values are expressed as the mean ± standard deviation (SD) of duplicate determinations of three independent experiments (n = 6).
) or under constant illumination ( ). The experiments were repeated on three different days and the results were similar. (b) Effect of EGCG solutions on photosensitivity of sod1Δ and sod2Δ yeast knock-out mutants. Overnight pre-cultures were inoculated in fresh YPD media at 2 × 10⁵ cells/mL, then cells were incubated with shaking (200 rpm) at 28 °C for two hours before the EGCG solutions were added (final EGCG concentration, 10 μg/mL). The cell growth was detected after 24 h incubation in the dark ( ) or under constant illumination with white light (c). For controls, the same amount of carrier solvents as in the EGCG experiments were used. Each determination was repeated three times on different days, with no significant variations (p < 0.05). Values are expressed as the mean ± standard deviation (SD) of duplicate determinations of three independent experiments (n = 6).
). The experiments were repeated on three different days and the results were similar. (b) Effect of EGCG solutions on photosensitivity of sod1Δ and sod2Δ yeast knock-out mutants. Overnight pre-cultures were inoculated in fresh YPD media at 2 × 10⁵ cells/mL, then cells were incubated with shaking (200 rpm) at 28 °C for two hours before the EGCG solutions were added (final EGCG concentration, 10 μg/mL). The cell growth was detected after 24 h incubation in the dark ( ) or under constant illumination with white light (c). For controls, the same amount of carrier solvents as in the EGCG experiments were used. Each determination was repeated three times on different days, with no significant variations (p < 0.05). Values are expressed as the mean ± standard deviation (SD) of duplicate determinations of three independent experiments (n = 6).
) or under constant illumination ( ). The experiments were repeated on three different days and the results were similar. (b) Effect of EGCG solutions on photosensitivity of sod1Δ and sod2Δ yeast knock-out mutants. Overnight pre-cultures were inoculated in fresh YPD media at 2 × 10⁵ cells/mL, then cells were incubated with shaking (200 rpm) at 28 °C for two hours before the EGCG solutions were added (final EGCG concentration, 10 μg/mL). The cell growth was detected after 24 h incubation in the dark ( ) or under constant illumination with white light (c). For controls, the same amount of carrier solvents as in the EGCG experiments were used. Each determination was repeated three times on different days, with no significant variations (p < 0.05). Values are expressed as the mean ± standard deviation (SD) of duplicate determinations of three independent experiments (n = 6).
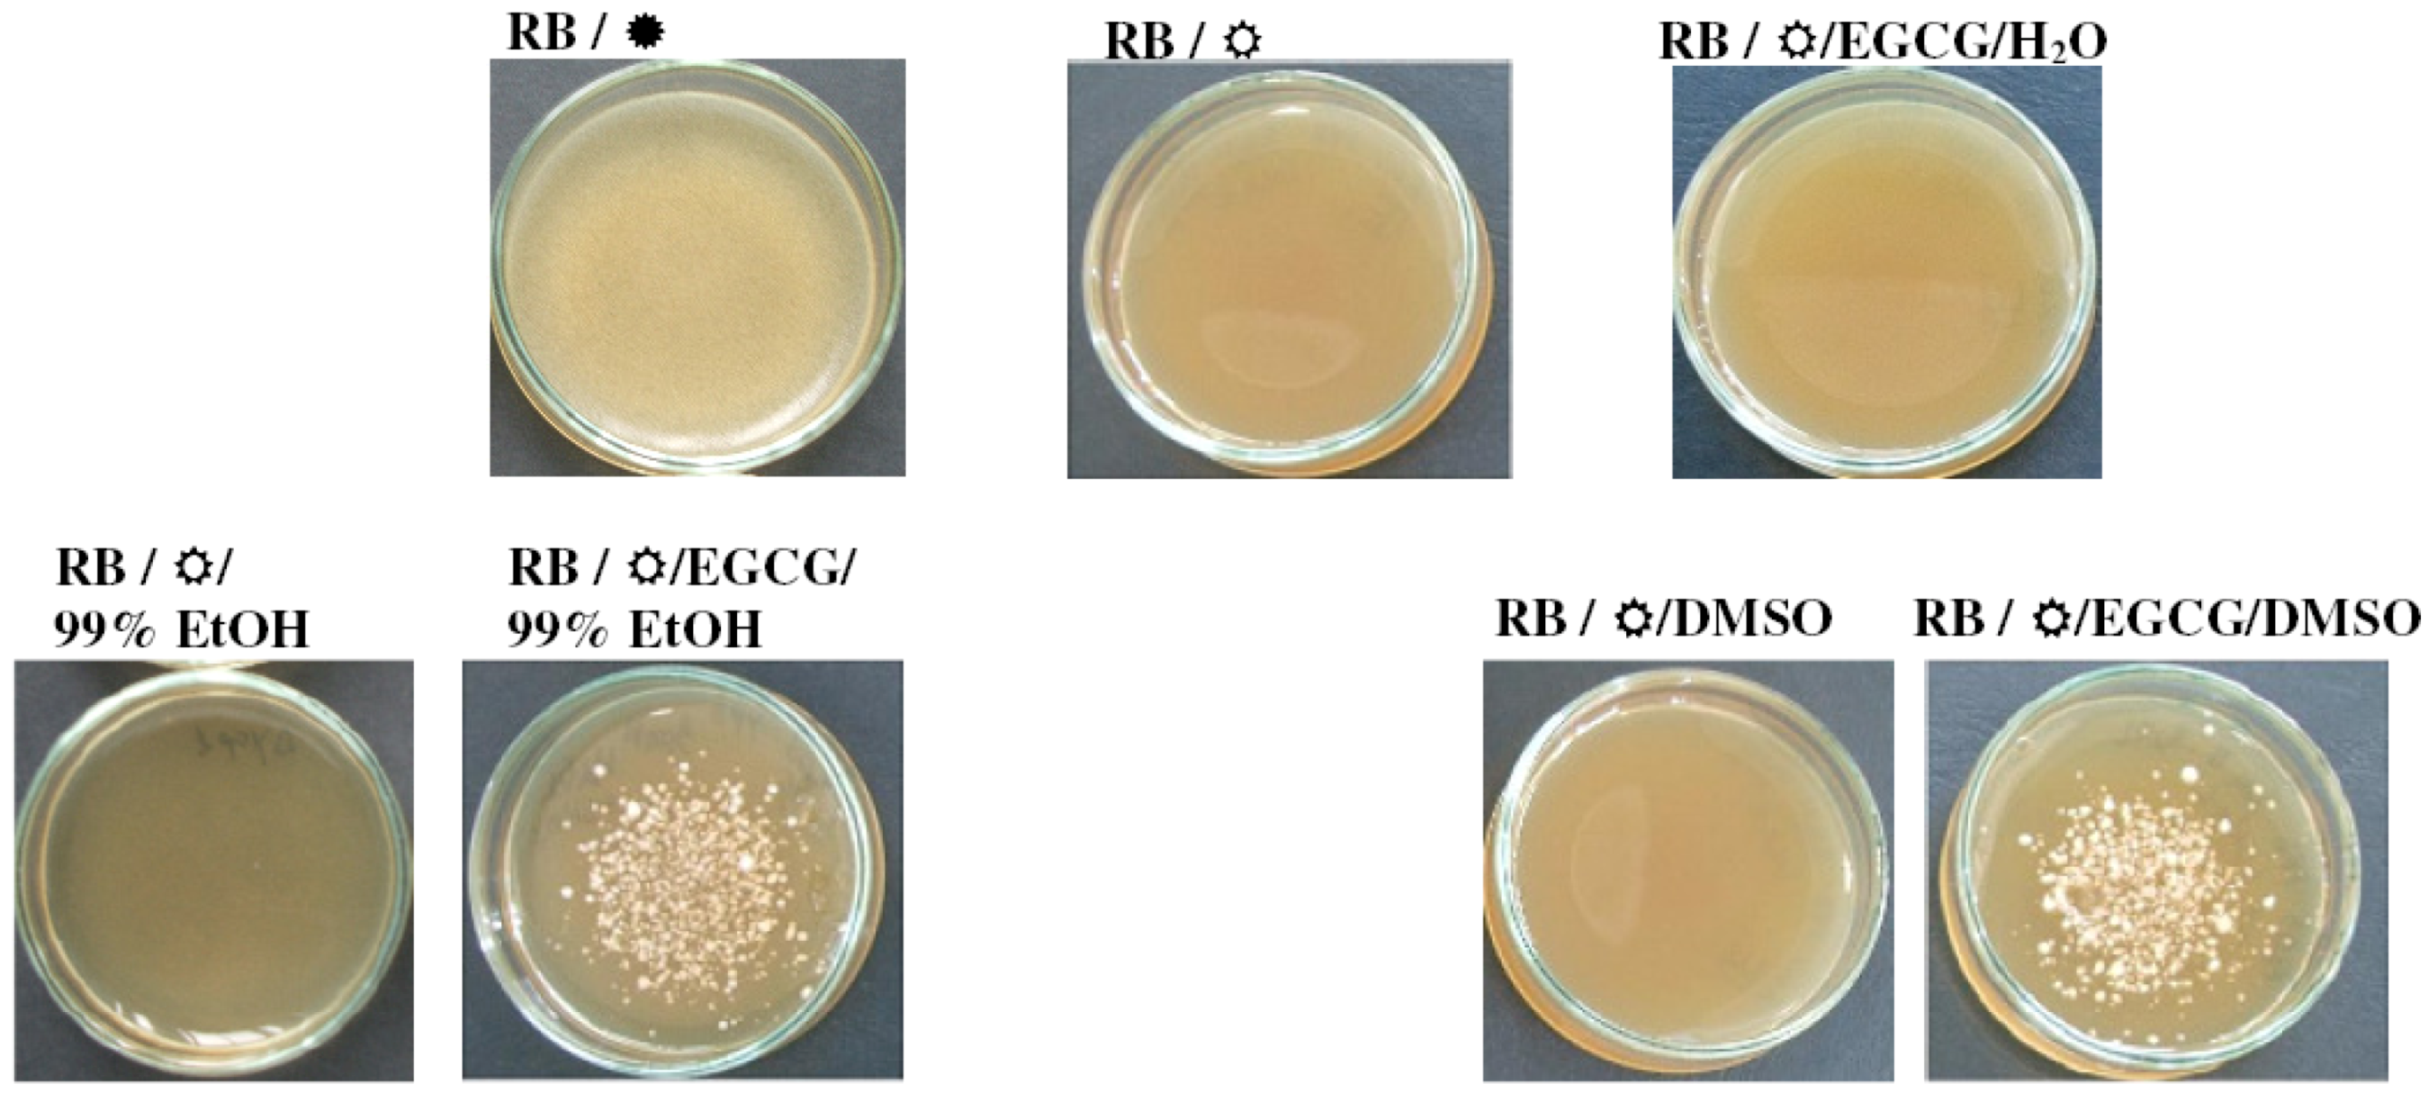
2.4. When in the Right Solvent, EGCG Can Rescue the Hypersensitive yap1Δ Cells from the Damaging Effect of 1O2
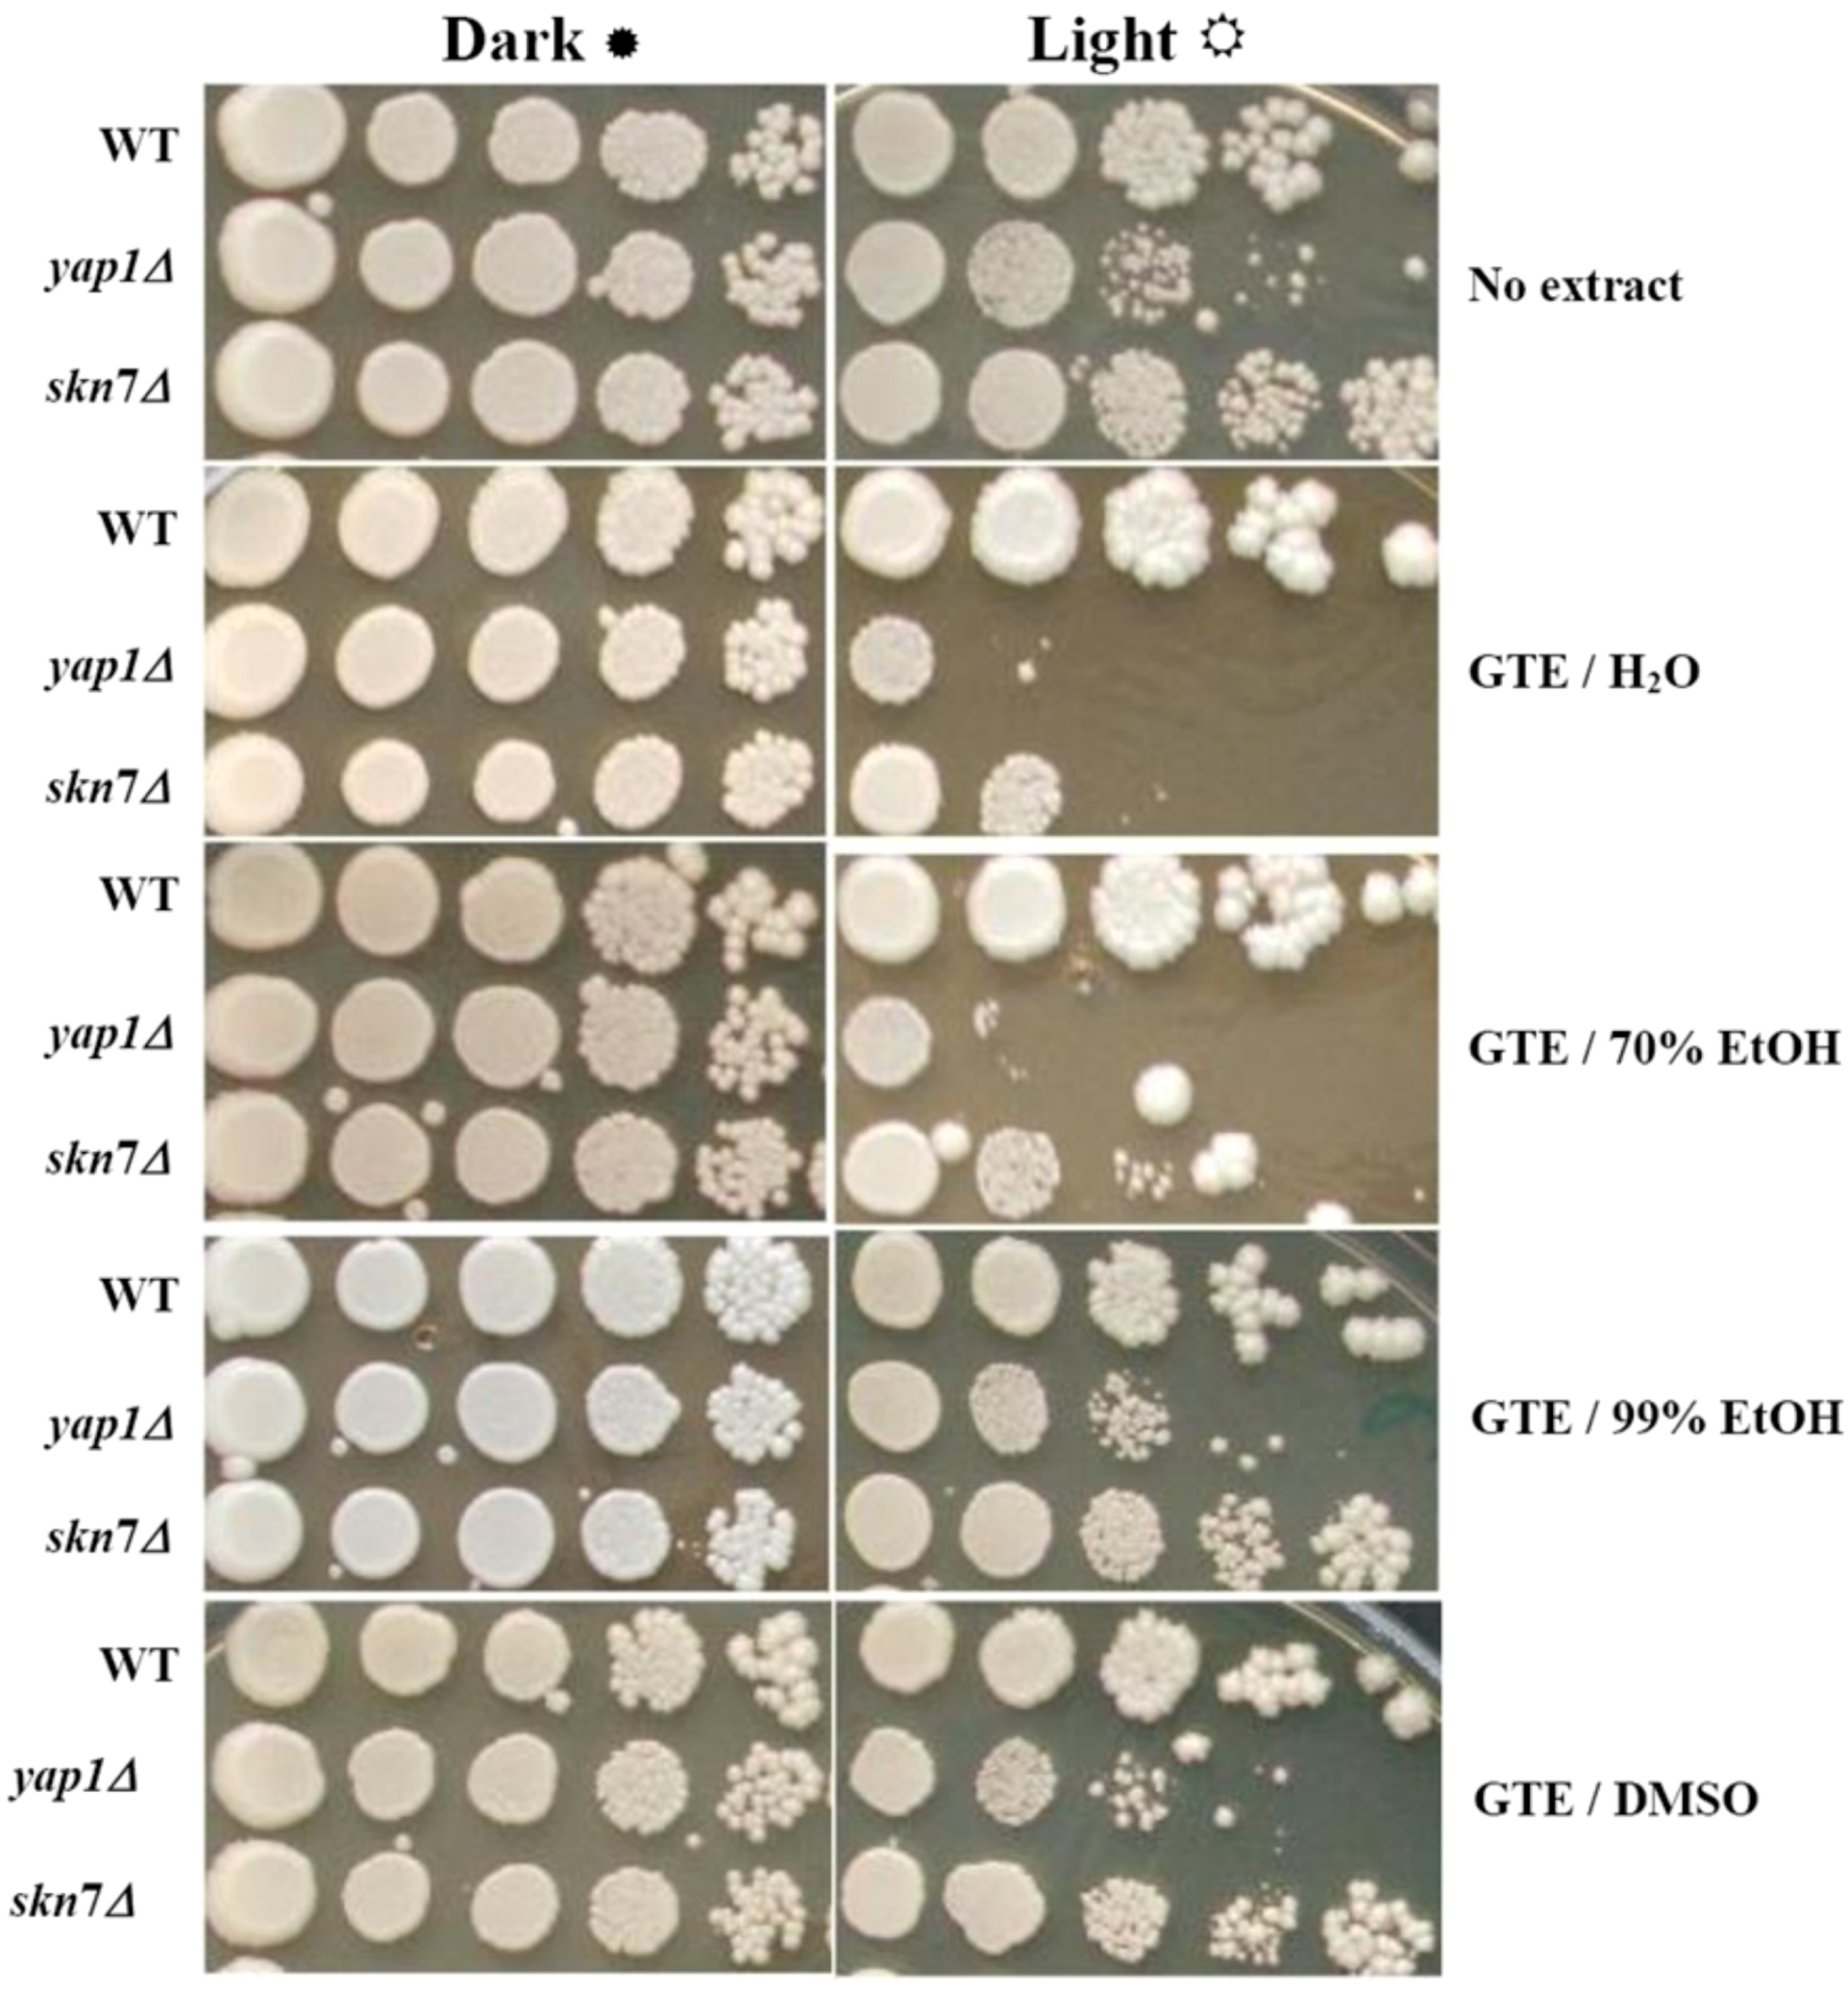
) or under constant illumination with white light ( ). For controls, the same amount of the carrier solvents as in the EGCG experiments were used. The experiments were repeated on three different days and the results were similar. One representative set of plates is shown.
) or under constant illumination with white light ( ). For controls, the same amount of the carrier solvents as in the EGCG experiments were used. The experiments were repeated on three different days and the results were similar. One representative set of plates is shown.
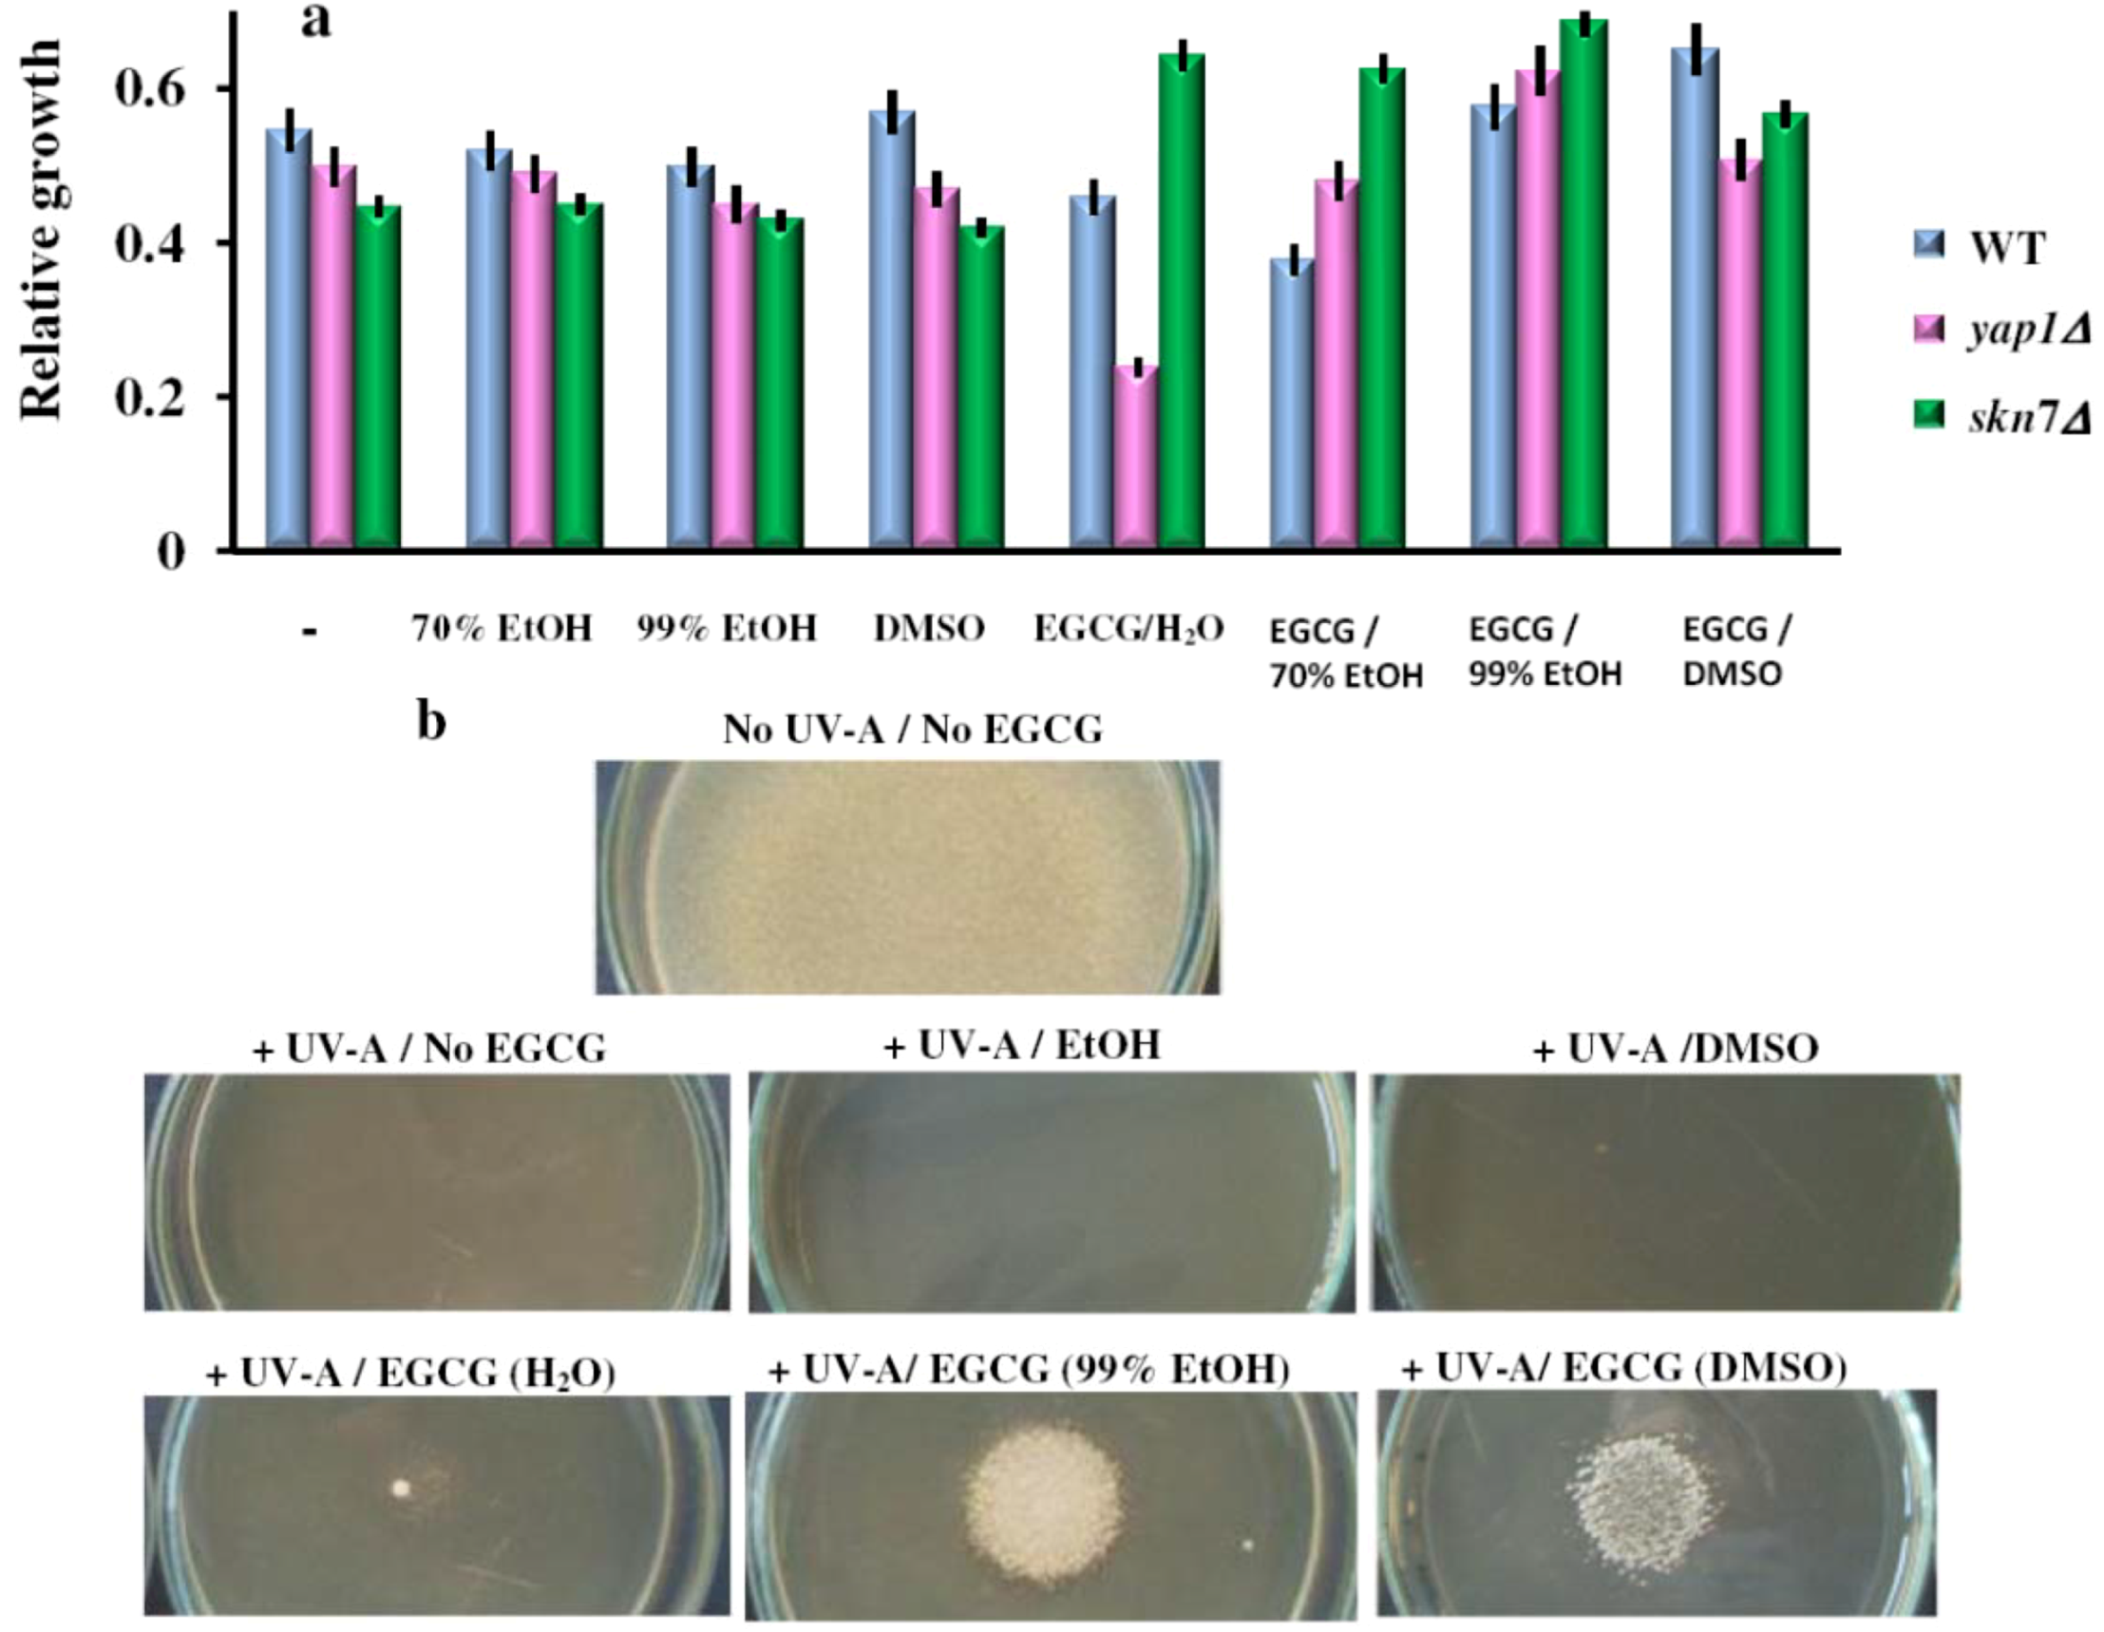
2.5. The Effect of EGCG on the Yeast Cells Exposed to Ultraviolet A
3. Experimental
3.1. Preparation of GTE
3.2. Determination of TPC
3.3. Strains and Culture Conditions
3.4. Growth Assessment
3.4.1. Growth in Liquid Media
3.4.2. Cell Growth Spot Assay
3.4.3. Halo Assay
3.5. UVA Irradiation of Cells
3.6. Reproducibility of the Results
4. Conclusions
Acknowledgments
References
- Higdon, J.V.; Frei, B. Tea catechins and polyphenols: Health effects, metabolism, and antioxidant function. Crit. Rev. Food Sci. Nutr. 2003, 43, 89–143. [Google Scholar] [CrossRef]
- Yang, C.S.; Maliakal, P.; Meng, X. Inhibition of carcinogenesis by tea. Annu. Rev. Pharmacol. Toxicol. 2002, 42, 25–54. [Google Scholar] [CrossRef]
- Siddiqui, I.A.; Afaq, F.; Adhami, V.M.; Ahmad, N.; Mukhtar, H. Antioxidants of the beverage tea in promotion of human health. Antioxid. Redox Signal. 2004, 6, 571–582. [Google Scholar]
- Grove, K.A.; Lambert, J.D. Laboratory, epidemiological, and human intervention studies show that tea (Camellia sinensis) may be useful in the prevention of obesity. J. Nutr. 2010, 140, 446–453. [Google Scholar] [CrossRef]
- Hou, Z.; Sang, S.; You, H.; Lee, M.J.; Hong, J.; Chin, K.V.; Yang, C.S. Mechanism of action of (−)-epigallocatechin-3-gallate: Auto-oxidation-dependent inactivation of epidermal growth factor receptor and direct effects on growth inhibition in human esophageal cancer KYSE 150 cells. Cancer Res. 2005, 65, 8049–8056. [Google Scholar]
- Shen, G.; Xu, C.; Hu, R.; Jain, M.R.; Nair, S.; Lin, W.; Yang, C.S.; Chan, J.Y.; Kong, A.N. Comparison of (−)-epigallocatechin-3-gallate elicited liver and small intestine gene expression profiles between C57BL/ 6J mice and C57BL/6J/Nrf2 (−/−) mice. Pharm. Res. 2005, 22, 1805–1820. [Google Scholar] [CrossRef]
- Butt, M.S.; Sultan, M.T. Green tea: Nature’s defense against malignancies. Crit. Rev. Food Sci. Nutr. 2009, 49, 463–473. [Google Scholar] [CrossRef]
- Maurya, P.K.; Rizvi, S.I. Protective role of tea catechins on erythrocytes subjected to oxidative stress during human aging. Nat. Prod. Res. 2009, 23, 1072–1079. [Google Scholar] [CrossRef]
- Nichols, J.A.; Katiyar, S.K. Skin photoprotection by natural polyphenols: Anti-inflammatory, antioxidant and DNA repair mechanisms. Arch. Dermatol. Res. 2010, 302, 71–83. [Google Scholar]
- Domingo, D.S.; Camouse, M.M.; Hsia, A.H.; Matsui, M.; Maes, D.; Ward, N.L.; Cooper, K.D.; Baron, E.D. Anti-angiogenic effects of epigallocatechin-3-gallate in human skin. Int. J. Clin. Exp. Pathol. 2010, 3, 705–709. [Google Scholar]
- Zyracka, E.; Zadrag, R.; Kozioł, S.; Krzepiłko, A.; Bartosz, G.; Biliński, T. Teast as a biosensor for antioxidants: Simple growth tests employing Saccharomyces cerevisiae mutant defective in superoxide dismutase. Acta Biochim. Pol. 2005, 52, 679–684. [Google Scholar]
- Jamieson, D.J. Oxidative stress responses of the yeast Saccharomyces cerevisiae. Yeast 1998, 14, 1511–1527. [Google Scholar] [CrossRef]
- Carmel-Harel, O.; Storz, G. Roles of the glutathione- and thioredoxin-dependent reduction systems in the Escherichia coli and Saccharomyces cerevisiae responses to oxidative stress. Annu. Rev. Microbiol. 2000, 54, 439–461. [Google Scholar] [CrossRef]
- Singh, B.N.; Shankar, S.; Srivastava, R.K. Green tea catechin, epigallocatechin-3-gallate (EGCG): Mechanisms, perspectives and clinical applications. Biochem. Pharmacol. 2011, 82, 1807–1821. [Google Scholar] [CrossRef]
- Maeta, K.; Nomura, W.; Takatsume, Y.; Izawa, S.; Inoue, Y. Green tea polyphenols function as prooxidants to activate oxidative-stress-responsive transcription factors in yeasts. Appl. Environ. Microbiol. 2007, 73, 572–580. [Google Scholar]
- Takatsume, Y.; Maeta, K.; Izawa, S.; Inoue, Y. Enrichment of yeast thioredoxin by green tea extract through activation of Yap1 transcription factor in Saccharomyces cerevisiae. J. Agric. Food Chem. 2005, 53, 332–337. [Google Scholar] [CrossRef]
- de la Torre-Ruiz, M.A.; Mozo-Villarías, A.; Pujol, N.; Petkova, M.I. How budding yeast sense and transduce the oxidative stress signal and the impact in cell growth and morphogenesis. Curr. Protein Pept. Sci. 2010, 11, 669–679. [Google Scholar]
- Brombacher, K.; Fischer, B.B.; Rüfenacht, K.; Eggen, R.I. The role of Yap1p and Skn7p-mediated oxidative stress response in the defence of Saccharomyces cerevisiae against singlet oxygen. Yeast 2006, 23, 741–750. [Google Scholar] [CrossRef]
- Hara, Y. Green Tea: Health Benefits and Applications; Marcel Dekker: New York, NY, USA, 2001. [Google Scholar]
- Halliwell, B.; Gutteridge, G.M.C. Free Radicals in Biology and Medicine, 3rd ed; Oxford University Press: Oxford, UK, 1999. [Google Scholar]
- Sommer, A.P.; Zhu, D.; Scharnweber, T. Laser modulated transmembrane convection: Implementation in cancer chemotherapy. J. Control. Release 2010, 148, 131–134. [Google Scholar] [CrossRef]
- Sommer, A.P.; Bieschke, J.; Friedrich, R.P.; Zhu, D.; Wanker, E.E.; Fecht, H.J.; Mereles, D.; Hunstein, W. 670 nm laser light and EGCG complementarily reduce amyloid-β aggregates in human neuroblastoma cells: Basis for treatment of Alzheimer’s disease? Photomed. Laser Surg. 2012, 30, 54–60. [Google Scholar]
- Sommer, A.P. A novel approach for addressing Alzheimer’s disease: The chemo-optical synergism. J. Neurosci. Res. 2012, 90, 1297–1298. [Google Scholar] [CrossRef]
- Foote, C.S. Definition of type I and type II photosensitized oxidation. Photochem. Photobiol. 1991, 54, 659–659. [Google Scholar] [CrossRef]
- Singleton, V.L.; Orthofer, R.; Lamuela-Raventos, R.M. Analysis of total phenols and other oxidation substrates and antioxidants by average of Folin-Ciocalteu reagent. Method. Enzymol. 1999, 299, 152–178. [Google Scholar]
- Brachmann, C.B.; Davies, A.; Cost, G.J.; Caputo, E.; Li, J.; Hieter, P.; Boeke, J.D. Designer deletion strains derived from Saccharomyces cerevisiae S288C: A useful set of strains and plasmids for PCR-mediated gene disruption and other applications. Yeast 1998, 14, 115–132. [Google Scholar]
- Sherman, F.; Fink, G.R.; Hicks, J.B. Methods in Yeast Genetics; Cold Spring Harbor Laboratory Press: Cold Spring Harbor, NY, USA, 1986. [Google Scholar]
- Amberg, D.C.; Burke, D.J.; Strathern, J.N. Methods in Yeast Genetics, A Cold Spring Harbor Laboratory Course Manual. Cold Spring Harbor Laboratory Press: Cold Spring Harbor, NY, USA, 2005; pp. 135–139. [Google Scholar]
- Shitamukai, A.; Mizunuma, M.; Hirata, D.; Takahashi, H.; Miyakawa, T. A positive screening for drugs that specifically inhibit Ca2+-signaling activity on the basis of the growth promoting effect on a yeast mutant with a peculiar phenotype. Biosci. Biotechnol. Biochem. 2000, 64, 1942–1946. [Google Scholar]
- Sample Availability: Samples of the green tea extracts are available from the authors upon request.
© 2012 by the authors; licensee MDPI, Basel, Switzerland. This article is an open-access article distributed under the terms and conditions of the Creative Commons Attribution license (http://creativecommons.org/licenses/by/3.0/).
Share and Cite
Mitrica, R.; Dumitru, I.; Ruta, L.L.; Ofiteru, A.M.; Farcasanu, I.C. The Dual Action of Epigallocatechin Gallate (EGCG), the Main Constituent of Green Tea, against the Deleterious Effects of Visible Light and Singlet Oxygen-Generating Conditions as Seen in Yeast Cells. Molecules 2012, 17, 10355-10369. https://doi.org/10.3390/molecules170910355
Mitrica R, Dumitru I, Ruta LL, Ofiteru AM, Farcasanu IC. The Dual Action of Epigallocatechin Gallate (EGCG), the Main Constituent of Green Tea, against the Deleterious Effects of Visible Light and Singlet Oxygen-Generating Conditions as Seen in Yeast Cells. Molecules. 2012; 17(9):10355-10369. https://doi.org/10.3390/molecules170910355
Chicago/Turabian StyleMitrica, Radu, Ioana Dumitru, Lavinia L. Ruta, Augustin M. Ofiteru, and Ileana C. Farcasanu. 2012. "The Dual Action of Epigallocatechin Gallate (EGCG), the Main Constituent of Green Tea, against the Deleterious Effects of Visible Light and Singlet Oxygen-Generating Conditions as Seen in Yeast Cells" Molecules 17, no. 9: 10355-10369. https://doi.org/10.3390/molecules170910355
APA StyleMitrica, R., Dumitru, I., Ruta, L. L., Ofiteru, A. M., & Farcasanu, I. C. (2012). The Dual Action of Epigallocatechin Gallate (EGCG), the Main Constituent of Green Tea, against the Deleterious Effects of Visible Light and Singlet Oxygen-Generating Conditions as Seen in Yeast Cells. Molecules, 17(9), 10355-10369. https://doi.org/10.3390/molecules170910355