1. Introduction
Natural products have played a promising role in the treatment and prevention of various diseases throughout the World. Many of the modern drugs available in clinical use todays are of natural product origin. Despite the profound therapeutic advantages possessed by some of the medicinal plants, some constituents of medicinal plants have been found to be potentially toxic, mutagenic, carcinogenic and teratogenic. However, the potential toxicity of herbs has not been recognized by the general public or by professional groups of traditional medicine [
1]. This raises concern about the potential toxic effects resulting from the short-term and long-term use of such plants. Therefore, evaluating the toxicological effects of any herbal extract intended to be used in humans is of utmost importance.
Euphorbia hirta L. belongs to the family Euphorbiaceae, which is commonly known as asthma weed. The herb is widely used in traditional medicine to treat a variety of diseased conditions including asthma, coughs, diarrhea and dysentery [
2]. The sedative, anxiolytic, analgesic, antipyretic and anti-inflammatory properties of
E. hirta have been reported in the literature [
3]. Furthermore, studies revealed that
E. hirta possess galactogenic, anti-anaphylactic, antimicrobial, antioxidant, anticancer, antifeedant, anti-platelet aggregation, aflatoxin inhibition, antifertility, anthelmintic, antiplasmodial, antiamoebic, antimalarial, and larvicidal activities [
4].
Recent studies have shown that long-term exposures to traditional medicinal herbs might be associated with increases in the rates of morbidity and mortality. In addition to systemic toxicity, the possible genotoxicity of herbal plants has been investigated in recent years. The aim of this study was to evaluate the genotoxicity of E. hirta extract by using in vitro mutagenicity bioassay on mitotic cells in Allium cepa root tips.
2. Results
Table 1 shows the cytological effects of
E. hirta extract on root tip cells of
A. cepa. Exposure of
E. hirta extract inhibited the mitotic index in a concentration-dependent manner when compared to the mitotic index of 0.509 in the control group. The lowest Mitotic Index (MI) value of 0.299 was recorded for 1,000 µg/mL treated with
E. hirta extract.
The mitotic index for
E. hirta extract decreased significantly (
p < 0.05) at 500 µg/mL and 1,000 µg/mL. The mitotic indexes were 0.379 and 0.299 respectively as compared to mitotic index at 125 µg/mL and 250 µg/mL which were 0.403 and 0.406 respectively. This may indicate that
E. hirta methanol crude extract exerted a genotoxic effect at 1000 µg/mL. The mitotic indexes in treated cells were lower compared to the distilled water (negative control) which was 0.509. Ethylmethane sulfonate was used as positive control. As shown in
Table 1, the mitotic index decreased at the same rate as the concentration increased from 125 µg/mL to 1,000 µg/mL. The lowest MI value for the highest concentration of ethylmethane sulfonate at 1,000 µg/mL is 0.184.
Table 1.
Cytogenetic analysis of A. cepa root tips exposed to different concentrations of E. hirta extract and ethylmethane sulfonate.
Table 1.
Cytogenetic analysis of A. cepa root tips exposed to different concentrations of E. hirta extract and ethylmethane sulfonate.
| Treatments | Chromosome aberrations | |
|---|
| Concentration (µg/mL) | No. of cells | Mitotic Index | Stickiness | Bridges | C-mitosis | Vagrant | % of Aberrant cells |
|---|
| E. hirta | | | | | | | |
| 125 | 1059 | 0.403 ± 0.042 * | 3 | 2 | 3 | 4 | 1.13 |
| 250 | 1124 | 0.406 ± 0.063 * | 4 | 5 | 2 | 4 | 1.33 |
| 500 | 1045 | 0.379 ± 0.040 * | 2 | 3 | 2 | 14 | 2.01 |
| 1000 | 1070 | 0.299 ± 0.035 * | 12 | 18 | 7 | 2 | 3.64 |
| Ethylmethane sulfonate | | | | | | | |
| 125 | 1225 | 0.410 ± 0.035 * | 4 | 2 | 5 | 5 | 1.31 |
| 250 | 868 | 0.339 ± 0.035 * | 8 | 3 | 12 | 3 | 3.00 |
| 500 | 1065 | 0.294 ± 0.049 * | 20 | 5 | 2 | 6 | 3.01 |
| 1000 | 1105 | 0.184 ± 0.021 * | 26 | 14 | 28 | 6 | 6.70 |
| Distilled water | 1183 | 0.509 ± 0.034 | 0 | 1 | 0 | 1 | 0.17 |
Chromosome aberrations were observed in all stages of mitosis.
Table 1 showed the types and frequencies of chromosome aberrations induced by treatments.
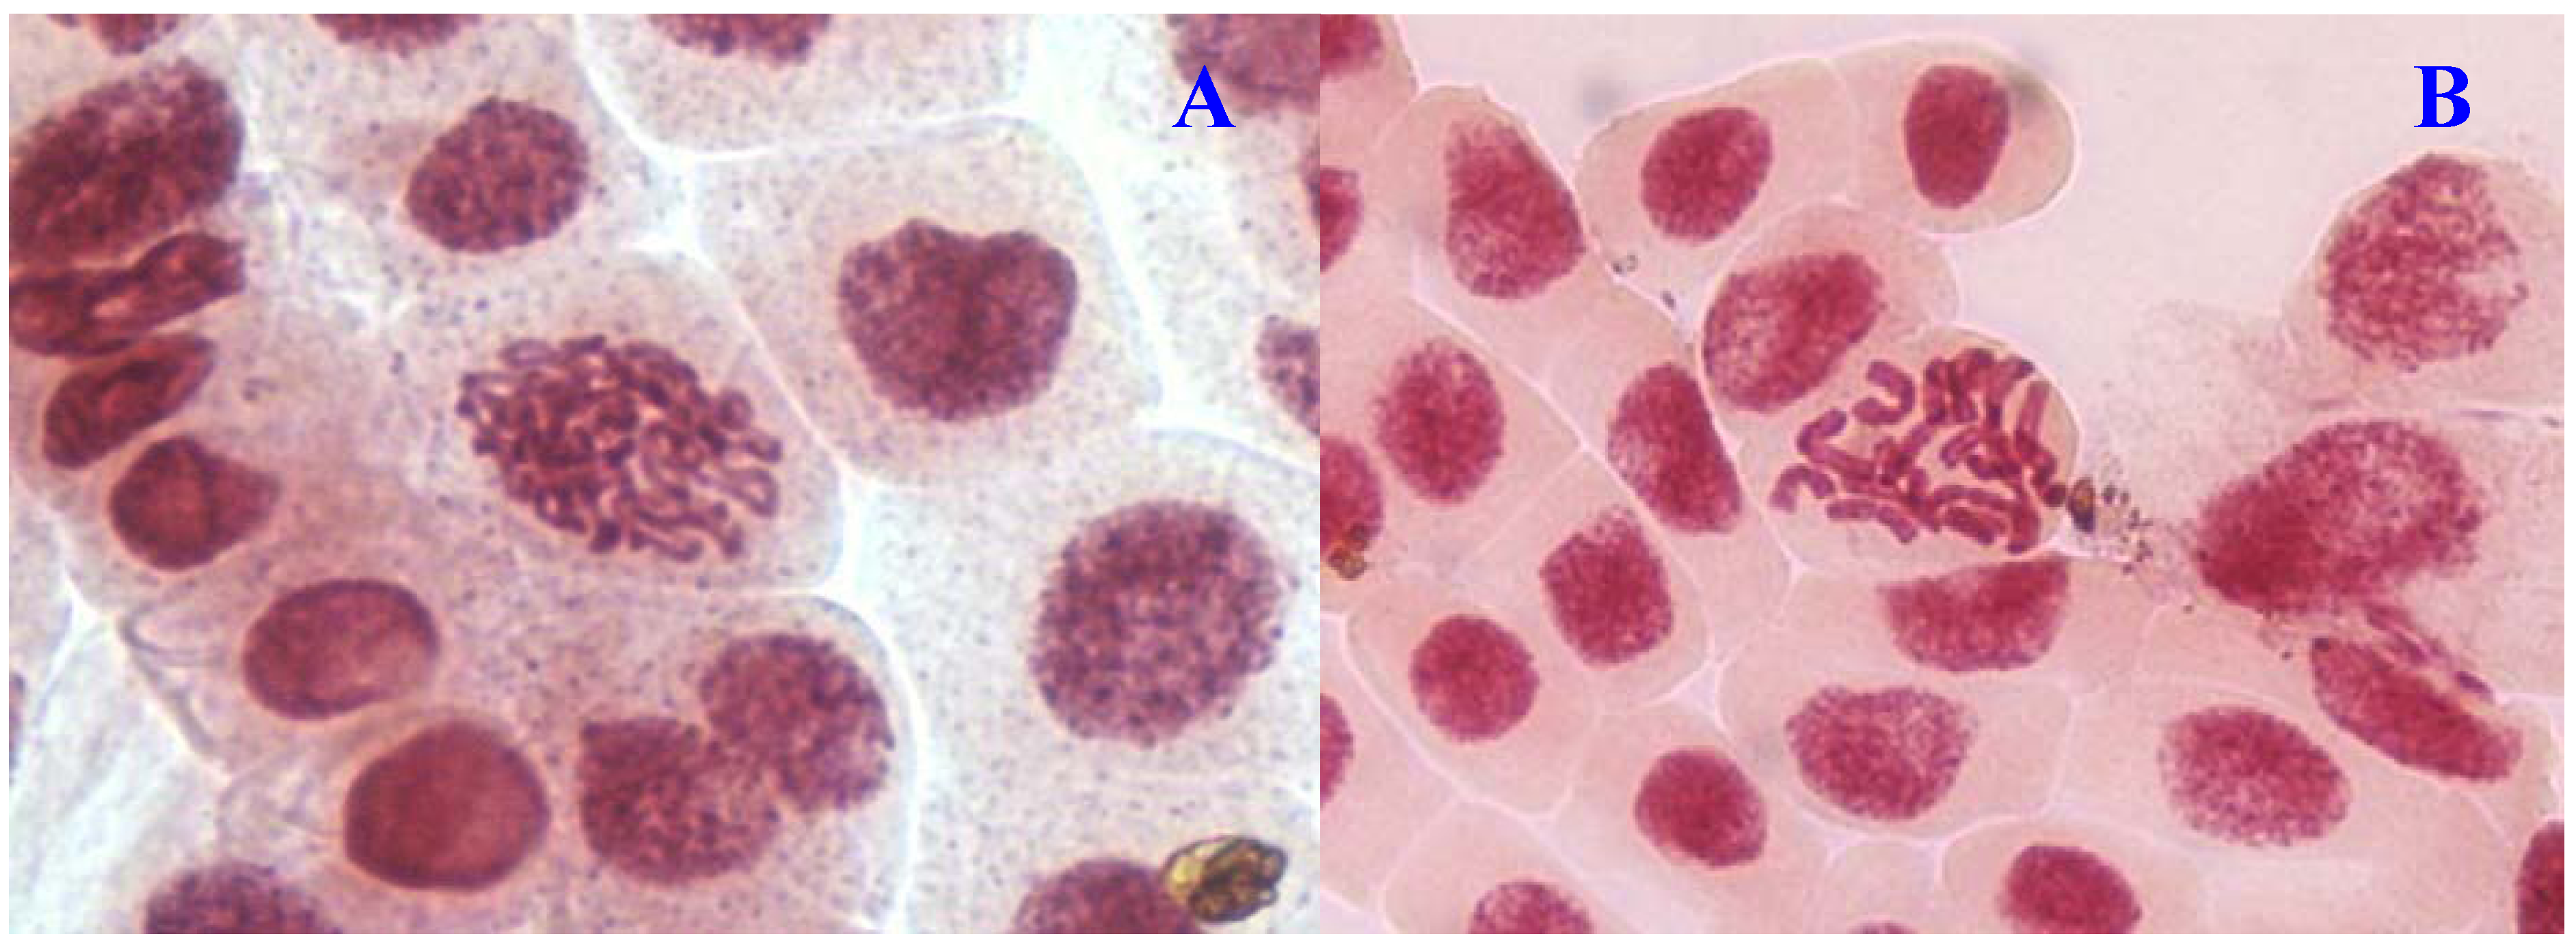
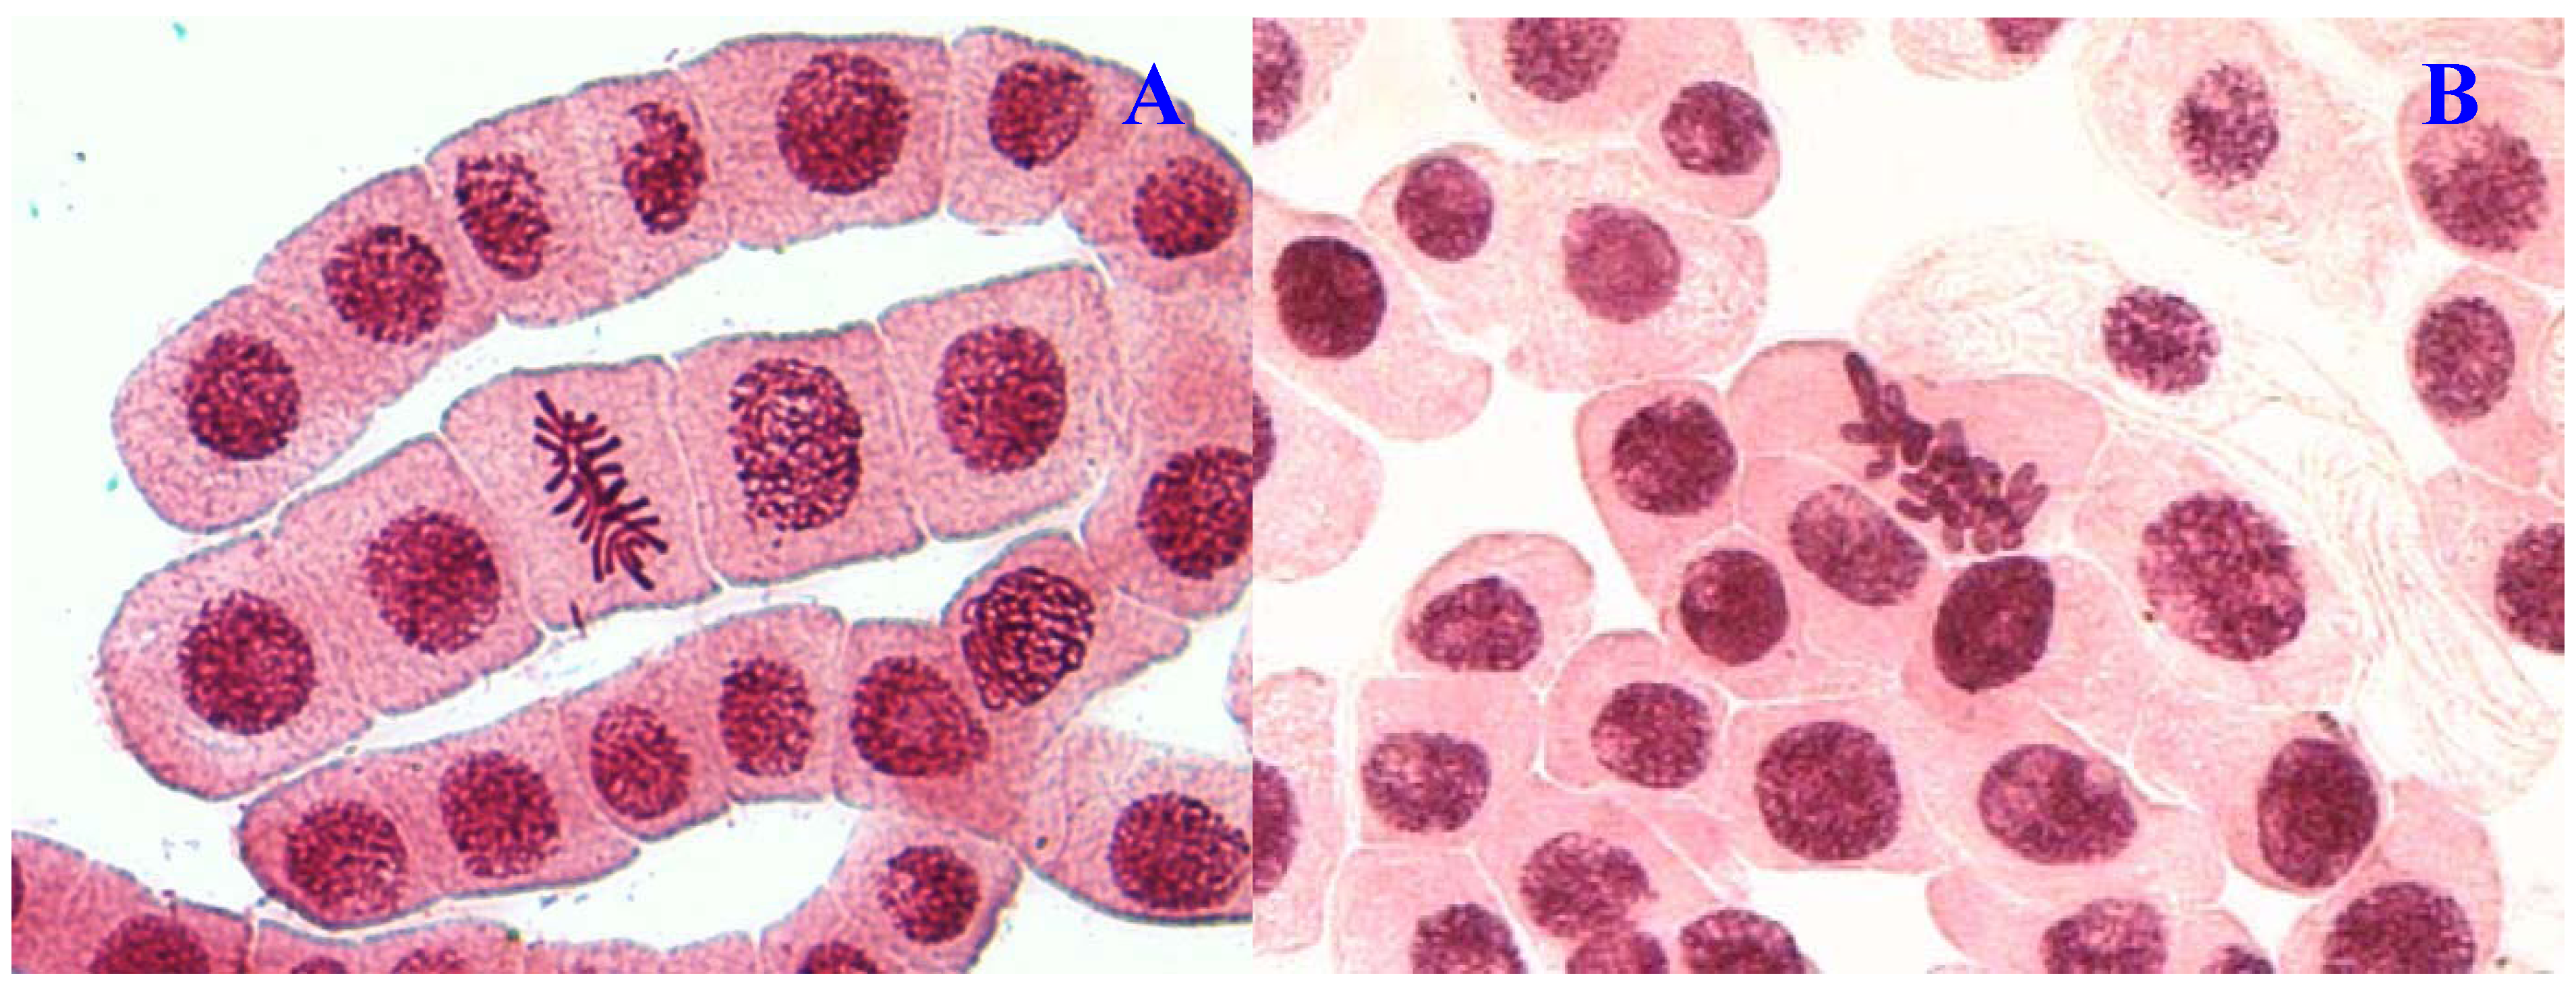
E. hirta extract showed concentration-dependent increase in the frequency of chromosome aberrations. At high concentration (1,000 µg/mL), sticky chromosomes and chromosome bridges were the most common chromosome aberrations observed (
Figure 1B and
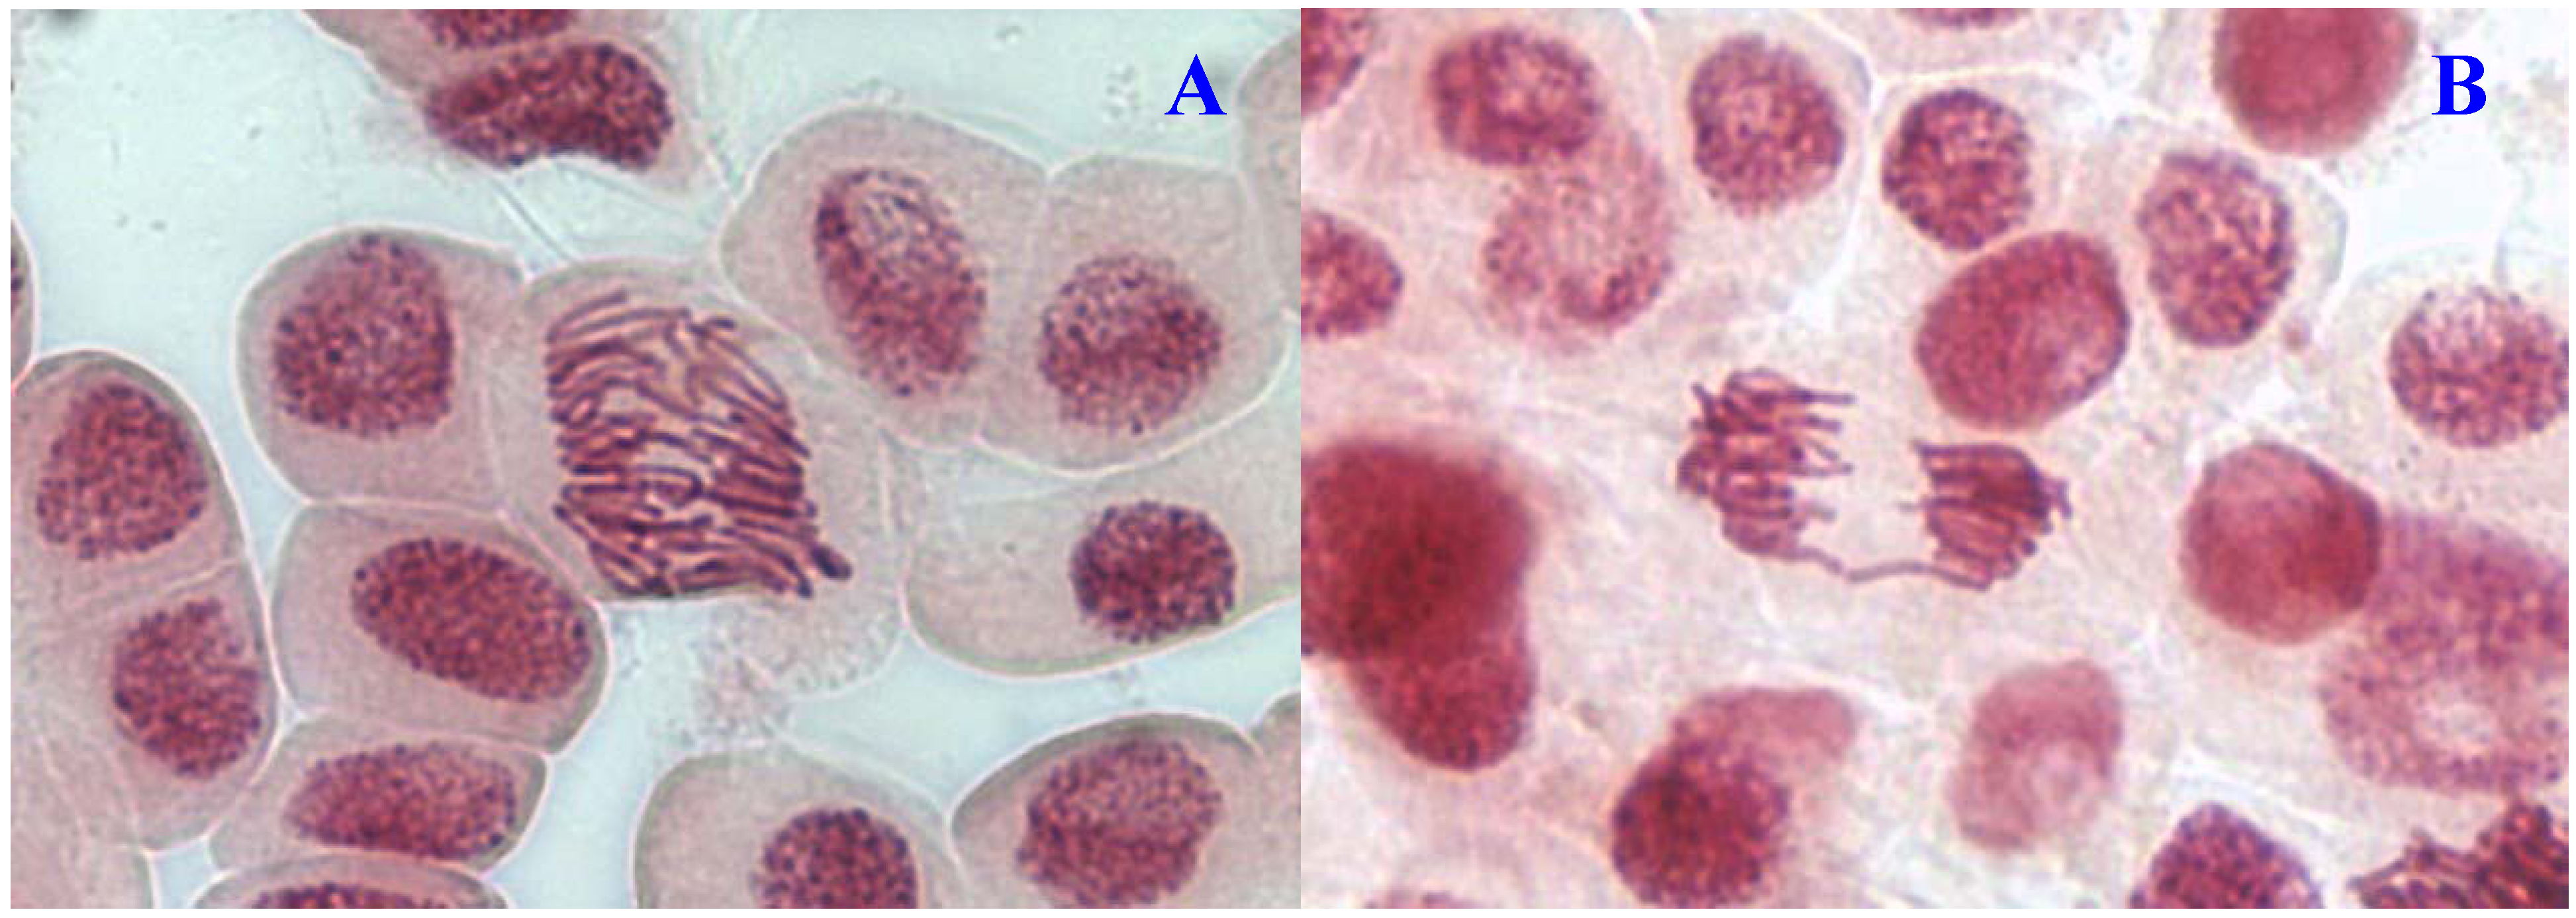
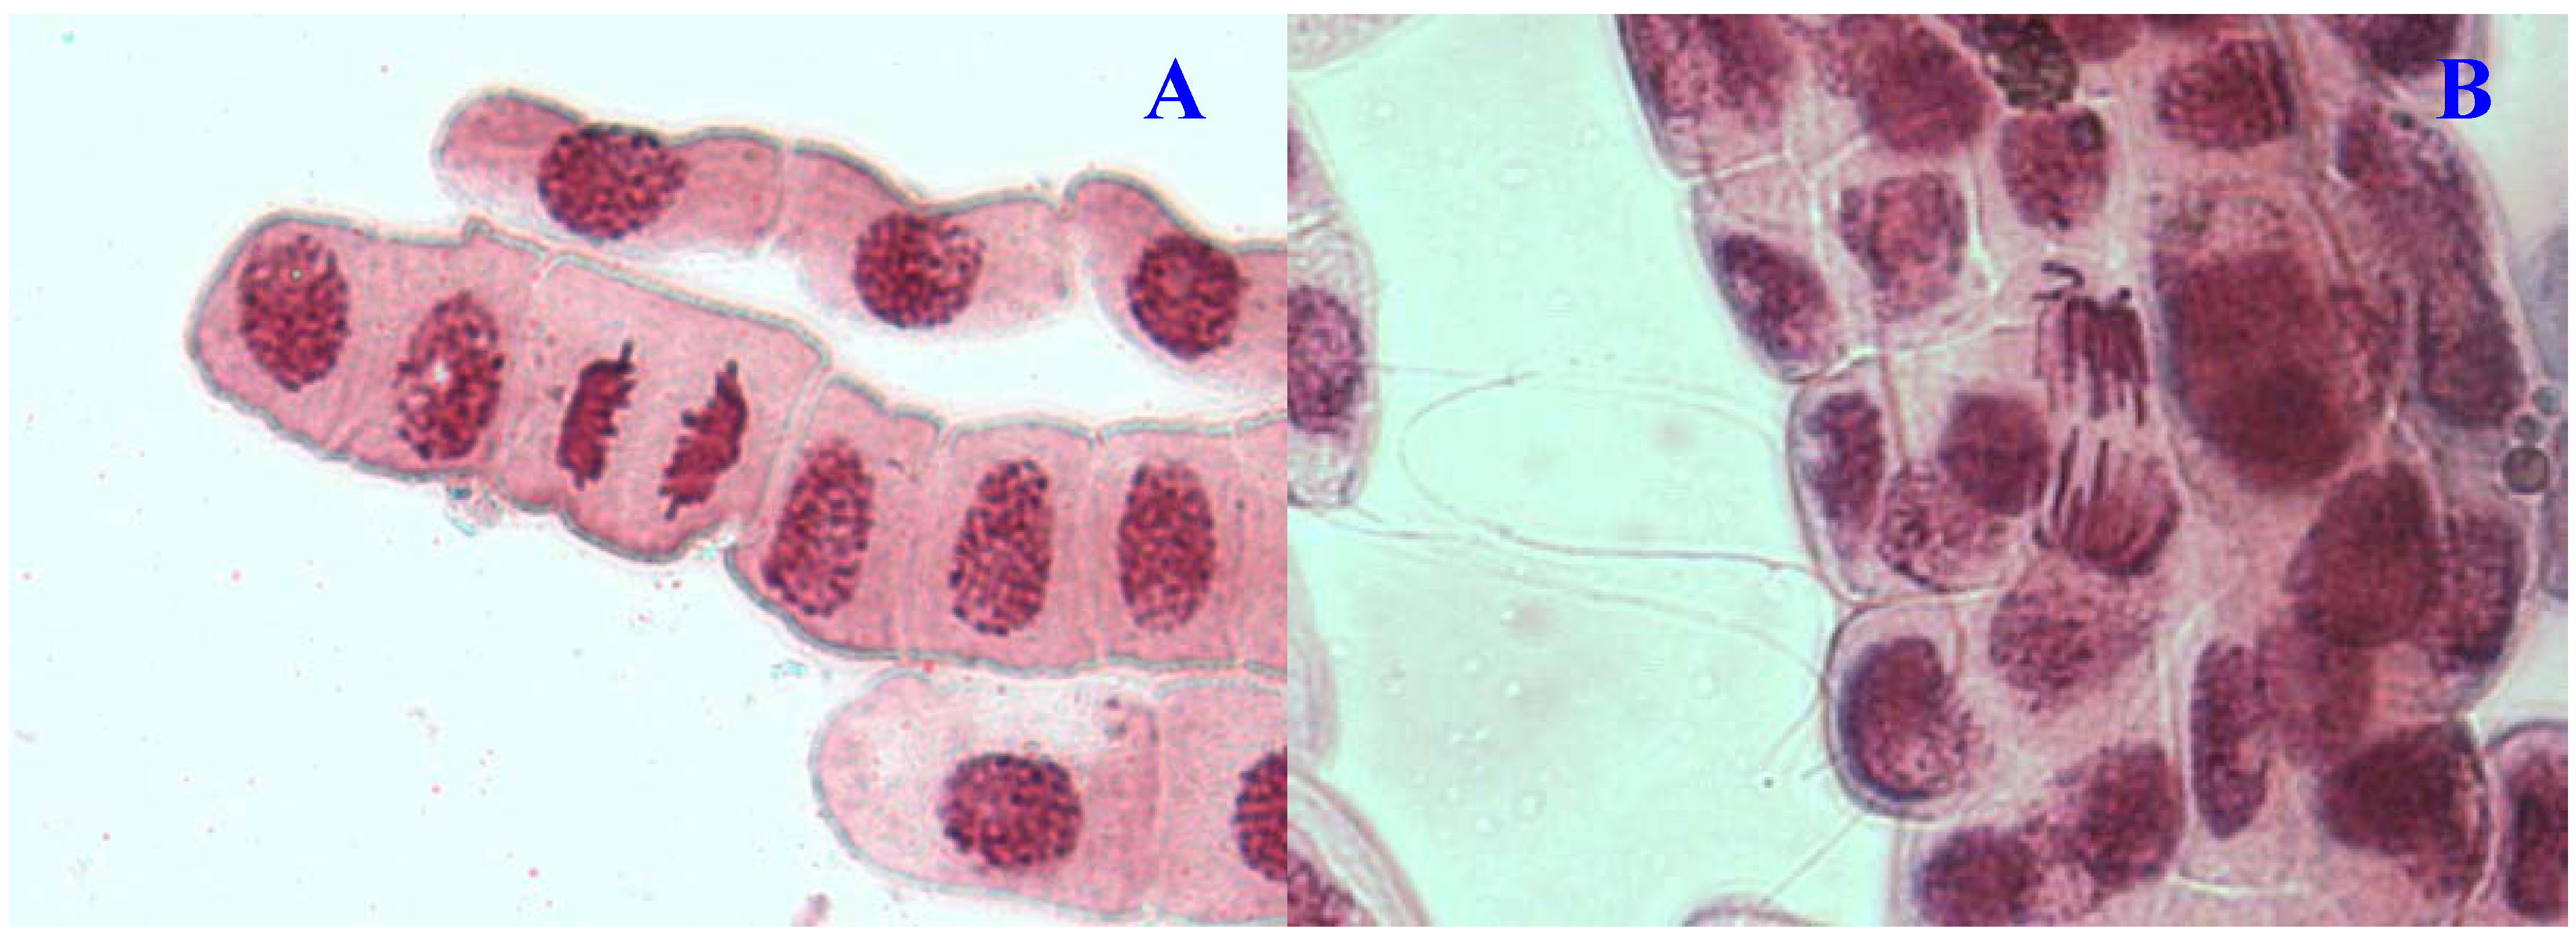
Figure 2B). Other chromosomal abnormalities observed were c-mitosis and vagrant chromosomes (
Figure 3B and
Figure 4B).
E. hirta at 1,000 µg/mL showed half as much % aberrations as compared to positive control. For methylmethanesulfonate, stickiness and c-mitosis were found to be the frequent aberrations observed. In control root tips samples, percentage of aberrations cells is low, 0.17% compared to highest concentration of ethylmethanesulfonate, which scored 6.7%. Micronucleated cells also were observed at interphase (
Figure 5B).
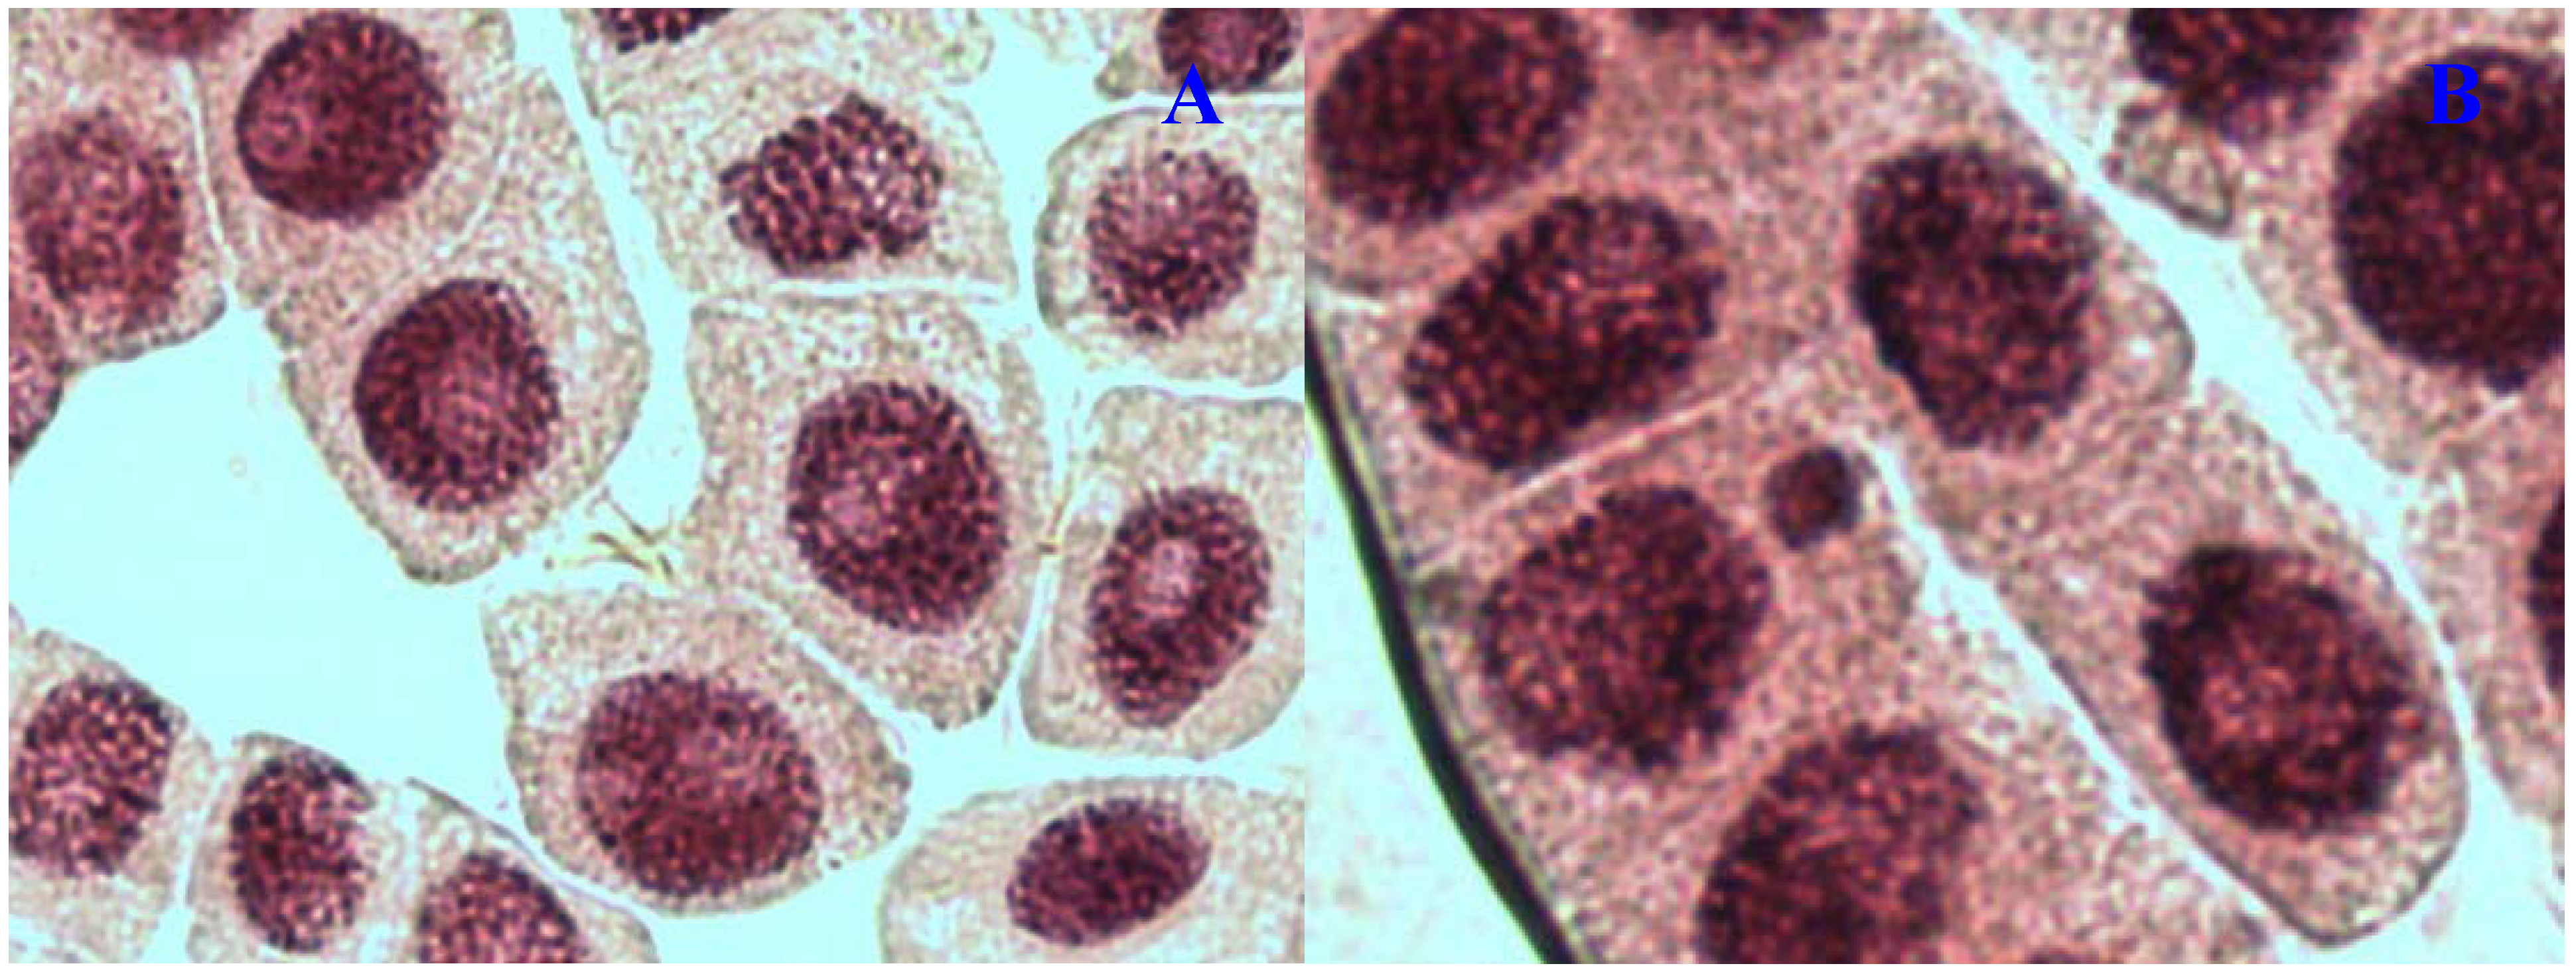
Figure 1.
Chromosome aberrations observed in A. cepa meristematic cells exposed to methanol extracts of E. hirta. (A), normal metaphase and (B), sticky chromosome. Magnification 400×.
Figure 1.
Chromosome aberrations observed in A. cepa meristematic cells exposed to methanol extracts of E. hirta. (A), normal metaphase and (B), sticky chromosome. Magnification 400×.
Figure 2.
Chromosome aberrations observed in A. cepa meristematic cells exposed to methanol extracts of E. hirta. (A), normal anaphase and (B), chromosome bridge. Magnification 400×.
Figure 2.
Chromosome aberrations observed in A. cepa meristematic cells exposed to methanol extracts of E. hirta. (A), normal anaphase and (B), chromosome bridge. Magnification 400×.
Figure 3.
Chromosome aberrations observed in A. cepa meristematic cells exposed to methanol extracts of E. hirta. (A), normal prophase and (B), C-mitosis. Magnification 400×.
Figure 3.
Chromosome aberrations observed in A. cepa meristematic cells exposed to methanol extracts of E. hirta. (A), normal prophase and (B), C-mitosis. Magnification 400×.
Figure 4.
Chromosome aberrations observed in A. cepa meristematic cells exposed to methanol extracts of E. hirta. (A), Normal telophase and (B), vagrant chromosome. Magnification 400×.
Figure 4.
Chromosome aberrations observed in A. cepa meristematic cells exposed to methanol extracts of E. hirta. (A), Normal telophase and (B), vagrant chromosome. Magnification 400×.
Figure 5.
Chromosome aberrations observed in A. cepa meristematic cells exposed to methanol extracts of E. hirta. (A), Normal interphase and (B), micronucleus in interphase. Magnification 400×.
Figure 5.
Chromosome aberrations observed in A. cepa meristematic cells exposed to methanol extracts of E. hirta. (A), Normal interphase and (B), micronucleus in interphase. Magnification 400×.
The induction of micronucleus formation was generally observed in all tested concentration of
E. hirta and significantly different when compared with the negative control (
p < 0.05). Micronucleus formation was markedly higher at 1,000 µg/mL than at the other concentrations (
Table 2).
Table 2.
Genotoxic effects of E. hirta extract on cells of Allium cepa micronucleus assay.
Table 2.
Genotoxic effects of E. hirta extract on cells of Allium cepa micronucleus assay.
| Treatments |
|---|
| Concentration (µg/mL) | No. of interphase cells examined | Micronucleus % |
|---|
| E. hirta | | |
| 125 | 1520 | 0.0197% * |
| 250 | 1543 | 0.0214% * |
| 500 | 1818 | 0.0264% * |
| 1000 | 1764 | 0.0272% * |
| Ethylmethane sulfonate | | |
| 125 | 2095 | 0.0200% * |
| 250 | 1542 | 0.0220% * |
| 500 | 2130 | 0.0282% * |
| 1000 | 1743 | 0.0304% * |
| Distilled water | 1674 | 0.0024% |
3. Discussion
Higher plants such as
A. cepa are accepted as admirable genetic models to evaluate genotoxic effects such as chromosome aberrations and disturbances in the mitotic cycle. Results of the current study reflected the utility of root tips of cells of
A. cepa for monitoring the genotoxic effects of plant extracts.
A. cepa assay enabled the assessment of different genetic endpoints, which are mitotic index and chromosome aberration. Mitotic index was characterized by the total number of dividing cells in cell cycle. Mitotic index is used as an indicator of cell proliferation biomarkers which measures the proportion of cells in the mitotic phase of the cell cycle. Hence, the decrease in the mitotic index of
A. cepa meristematic cells could be interpreted as cellular death. Several types of chromosome aberrations were considered in the four phases of cell division (prophase, metaphase, anaphase and telophase) to evaluate chromosomal abnormalities. According to Rank and Nielsen [
5], chromosome aberrations analysis not only allowed estimation of genotoxic effects, but also enabled evaluation of their clastogenic and aneugenic actions.
Low mitotic index may be reflecting a direct genotoxic effect of
E. hirta extract. Therefore the mitotic index was analysed in this study do determined the genotoxicity of
E. hirta extract treatment on
A. cepa. The cells of
A. cepa root tips after treatment with extracts of
E. hirta showed decreased in mitotic index with increasing concentration. There were significant differences (
p < 0.05) between treated groups and control group in mitotic index (
Table 1). The mitotic activity of
E. hirta methanol extract was significantly decreased at the tested concentrations at 1,000 µg/mL (
Table 1), with 41.26% decreased in mitotic index as compared to the control. Ethylmethane sulfonate was used as positive control in this study. A dose dependent decrease of mitotic index was observed in the ethylmethane sulfonate. Treatment with concentration of 1,000 µg/mL showed an absence of dividing cells as the mitotic activity dropped 63.85% as compared negative control. Ethylmethane sulfonate is a genotoxic chemical, where positive results have been consistently reported in numerous
in vitro mutagenicity and genotoxicity assays.
The mitodepressive effect suggests that
E. hirta extract had some effects on cell division of
A. cepa. This may be due to abnormal conditions of the cells induced by the treatments. The abnormalities of chromosomes could be due to the blockage of DNA synthesis or inhibition of spindle formation.
E. hirta extract may not even allow the initiation of their biosynthesis [
6]. The reduction of the mitotic index might be explained as being due to the obstruction of the onset of prophase, the arrest of one or more mitotic phases, or the slowing of the rate of cell progression through mitosis [
7].
Chromosome aberrations provided important information and may be considered an efficient test to investigate the genotoxic potential of the treatments analyzed [
8]. The chromosome aberrations observed at all concentrations of the treatment were chromosome stickiness, bridges, c-mitosis and vagrant chromosomes. These aberrations were due to the effect of the extract on the spindle formation and thus resulted in cell division disturbances. Chromosome bridges indicating the clastogenic effect caused by chromosome breaks, whereas vagrant chromosomes and c
-metaphases increase the risk for aneuploidy [
9].
Some of the physiological aberrations that were commonly observed in this study were stickiness (
Figure 2B). A remarkable correlation between the frequencies of stickiness and the bridges was observed. This supports the hypothesis that stickiness may result from improper folding of chromosome fibers which makes the chromatids connected by means of subchromatid bridges [
10,
11]. However, Mercykutty and Stephen [
12] reported that this stickiness may be interpreted as a result of depolymerisation of DNA, partial dissolution of nucleoproteins, breakage and exchanges of the basic folded fibre units of chromatids and the stripping of the protein covering of DNA in chromosomes. According to Fiskesjo [
13], sticky chromosomes indicated a highly toxic, irreversible effect, probably leading to cell death.
Another remarkable abnormality was chromosome bridges. Chromosome bridges were commonly observed during anaphase and telophase (
Figure 3B). The bridges noticed in the cells were probably formed by breakage and fusion of chromatids or subchromatids [
14]. According to Kabarity
et al. [
15], chromosome bridges may be caused by stickiness of chromosomes which made their separation and free movements complete and thus they remained connected by bridges. A low frequency of c-mitosis (
Figure 1B) and vagrant chromosomes was also observed. Their presence may be attributed to the failure of the spindle apparatus to organize and function in a normal way. Similar observations have been made by other workers where c-mitosis was regarded as indicative of a weak toxic effect which may be reversible [
13]. However, these changes may induce the formation of polyploid cells when not reversed [
16]. Vagrant chromosomes that were not organized to a specific stage of the mitotic division were also observed (
Figure 4B). This abnormality may be caused by unequal distribution of chromosomes with paired chromatids in which resulted from nondisjunction of chromatids in anaphase. Vagrant chromosomes were weak c-mitotic effect indicating risk of aneuploidy [
13].
The chromosome aberration and micronucleus assays have been shown to be highly reliable in genotoxicity testing [
17]. Besides to the types of chromosome aberrations, the formation of micronucleus in interphase cells was determined. The percentage of micronucleated cells was obviously higher than control group (
p < 0.05) at all tested concentration. The induction of micronucleus in root meristem cells of
A. cepa is the manifestation of fragments or vagrant chromosomes [
18].

