Article

Comparing the Effects of N and P Deficiency on Physiology and Growth for Fast- and Slow-Growing Provenances of Fraxinus mandshurica

1
National Key Laboratory of Tree Genetics and Breeding, Northeast Forestry University, Harbin 150040, China
2
College of Life Sciences, Northeast Forestry University, Harbin 150040, China
3
Heilongjiang Touyan Innovation Team Program, Tree Genetics and Breeding Innovation, Northeast Forestry University, Harbin 150040, China
*
Author to whom correspondence should be addressed.
Forests 2021, 12(12), 1760; https://doi.org/10.3390/f12121760
Submission received: 9 November 2021 / Revised: 6 December 2021 / Accepted: 8 December 2021 / Published: 13 December 2021

Abstract

:
With the continuous increase in atmospheric carbon dioxide emissions, nitrogen (N) and phosphorus (P) as mineral elements increasingly restrict plant growth. To explore the effect of deficiency of P and N on growth and physiology, Fraxinus mandshurica (hereafter “F. mandshurica”) Rupr. annual seedlings of Wuchang (WC) provenance with fast growth and Dailing (DL) provenance with slow growth were treated with complete nutrition or starvation of N (N-), P (P-) or both elements (NP-). Although P- and N- increased the use efficiency of P (PUE) and N (NUE), respectively, they reduced the leaf area, chlorophyll content and activities of N assimilation enzymes (NR, GS, GOGAT), which decreased the dry weight and P or N amount. The free amino acid content and activities of Phosphoenolpyruvate carboxylase (PEPC) and acid phosphatase enzymes were reduced by N-. The transcript levels of NRT2.1, NRT2.4, NRT2.5, NRT2.7, AVT1, AAP3, NIA2, PHT1-3, PHT1-4 and PHT2-1 in roots were increased, but those of NRT2.1, NRT2.4, NRT2.5, PHT1-3, PHT1-4, PHT2-1 and AAP3 in leaves were reduced by P-. WC was significantly greater than DL under P- in dry weight, C amount, N amount, leaf area, PUE, NUE, which related to greater chlorophyll content, PEPC enzyme activity, N assimilation enzyme activities, and transcript levels of N and P transporter genes in roots and foliage, indicating a greater ability of WC to absorb, transport and utilize N and P under P-. WC was also greater than DL under N- in terms of the above indicators except the transcript levels of N and P assimilation genes, but most of the indicators did not reach a significant level, indicating that WC might be more tolerant to N- than DL, which requires further verification. In summary, WC was identified as a P-efficient provenance, as the growth rate was greater for the genetic type with high than low tolerance to P-.

1. Introduction

With the continuous increase in atmospheric carbon dioxide emissions, among the three major chemical elements—carbon (C), nitrogen (N) and phosphorus (P)—required for plant growth, N and P [1,2,3] as mineral elements increasingly restrict plant growth.
N is the mineral element with the greatest demand for plant growth and development, and it is the basic component of macromolecules such as protein, nucleic acid and chlorophyll. In forests with short rotation period and rapid growth, the demand for N is large, and N deficiency is the main nutrient element that restricts plant growth [4]. There are two main forms of nitrogen absorption by plants: nitrate N and ammonium N. Nitrate N is transported from the soil to the cells by root nitrate transporters (NRTs) and ammonium is carried out using ammonium transporters (AMTs) through active transport, respectively. Different NRTs respond differently to N deficiency. In Arabidopsis, AtNRT1 and AtNRT2 are low-affinity and high-affinity transporters, respectively [5]. The absorption of nitrate ions by roots is mainly performed by NRT2.1 [6], and additionally, AtNRT2.4, which is reduced by N starvation, will also absorb some nitrate ions [7]. The transcript levels of AtNRT2.7 are smaller in roots than in shoots [8]. High transcript levels of AtNRT2.7 have been detected in Arabidopsis seeds [9,10]. The AtNRT2.5 transcript is induced by N starvation [11,12]. However, OsNRT2.4 is a dual-affinity nitrate transporter [13].
After being absorbed into the cell, a small amount of nitrate N is reduced in roots, and a large amount is transported to leaves for reduction in poplar [14]. Nitrate N is first reduced to ammonium N by nitrate reductase (NR) and nitrite reductase, and then further synthesized into amino acids through the glutamate synthase (GOGAT) and glutamine synthase (GS) cycles [15]. N deficiency reduces the activities of N assimilation enzymes such as NR and GOGAT in poplar [16]. Free amino acids are the main transport form of N in plants, which can reflect the supply and demand of N. In Arabidopsis, AtAAP3 is a plasma membrane amino acid transporter and is expressed in root phloem [17]. OsAAP3 can transport nine kinds of amino acids, and the high transcription level of OsAAP3 in rice increases the amino acid content and rice yield [18].
P is the second largest mineral element required for plant growth and development [3]. In forestland, the main sources of P are organic P and inorganic phosphorus (Pi). Current research shows that plants can only directly absorb Pi. However, due to absorbance by soil cations and low solubility in the rhizosphere, most Pi in the soil is unavailable to plants, which often causes forest trees to suffer from P deficiency [19,20]. Therefore, the selection of afforestation materials with poor P tolerance will increase the growth of forest.
The absorption and transport of Pi are regulated by different phosphate transporters (PHTs) in plants. The transcript level of HvPHT1;3 is higher in barley P-efficient strains [21]. AtPHT1;1 to AtPHT1;4 is responsible for the absorption of phosphate from the rhizosphere [22]. Different P transporters respond differently to P deficiency. The transcript level of PHO1 (PHOSPHATE 1) homologs H1 (PHO1;H1) is induced by P starvation but inhibited by sufficient P [23], while transcripts of AtPHO1;H9 are only found in pollen and flowers [24]. Excluding AtPHT1;6, the transcript level of all AtPHT1 genes increases under phosphate starvation [25]. PHT2;1 regulates the P starvation response [26].
Plants can increase the availability of soil Pi by secreting organic acids [27,28] and phosphatase such as acid phosphatases (APs) from the roots to the soil under P deficiency [16,29]. The phosphoenolpyruvate carboxylase (PEPC, EC 4.1.1.31) enzyme in the tricarboxylic acid cycle plays an important role in the synthesis of organic acids under P deficiency [30]. Knowledge about the mechanism of tolerance to deficiency of N and P in plants is mostly from studies on herbs and model plants. However, research on woody non-model plants is rarely reported.
To obtain sufficient C skeleton and energy, N and P assimilation requires consumption of carbohydrates [31,32]. Therefore, the effects of deficiency of N and P on plant growth can be measured not only by directly measuring dry weight but also by indirectly measuring the soluble sugar content. For example, in oilseed flax, N addition reduces the soluble sugar content of leaves, and P addition increases the soluble sugar content of leaves, stems and seeds [33]. The deficiency of N and P causes the leaves to accumulate more carbohydrates, and the transport of carbohydrates from the stem to the root increases [34].
F. mandshurica Rupr. is one of the three hard broad-leaved tree species in Northeast China and is regarded as one of the main tree species used in afforestation, representing 10% of planted hardwoods [35]. There have been many reports on the selection of the superior provenance of F. mandshurica based on growth rate. However, there is little information on the physiological and biochemical regulatory mechanisms related to the rapid growth of superior provenances. The C amount of 20 provenances of F. mandshurica in three provinces of northeastern China was determined, and Wuchang (WC) with the largest amount of C sequestration as well as Dailing (DL) with a low level were selected. To explore the effects of deficiency of P and N on growth and physiology of woody non-model plants, F. mandshurica annual seedlings of WC with fast growth and DL with slow growth were treated with N starvation (N-), P starvation (P-) and both N and P starvation (NP-). We hypothesized that (i) N- and P- would suppress the absorption and metabolism of N and P for both of F. mandshurica provenances and (ii) the tolerance to deficiency of N and P of fast-growing F. mandshurica provenance would be greater.

2. Materials and Methods

2.1. Plant Materials and Nutritional Treatments

This research was conducted in the greenhouse of Northeast Forestry University in Harbin, Heilongjiang, China. In the experiment, pots with 180 mm upper diameter, 130 mm lower diameter and 150 mm height were used uniformly. On 11 May 2500 seeds of Dailing (DL) and Wuchang (WC) were planted directly in pots filled with sand. To ensure the moisture in the sand, 200 mL water was poured every two days. On 28 May, there were 703 seedlings (305 for DL and 398 for WC) with two true leaves, and 480 seedlings (240 for DL and 240 for WC) with similar heights were selected and transplanted into pots with sand, with two seedlings in each nutrient pot. There were 60 seedlings at each level of nutrient treatment for each provenance. The study contained four nutrition treatment groups, namely, nitrogen starvation (N-), phosphorus starvation (P-), nitrogen and phosphorus starvation (NP-) and complete nutrition (Control). With reference to the composition of Hoagland nutrient solution and Jarkko and Toini nutrient solution, the composition of the nutrient solution in this study was as follows: 8 mM NH4NO3, 1 mM KH2PO4, 1 mM KCl, 1 mM CaCl2·6H2O, 0.6 mM MgSO4·7H2O, 0.02 mM FeCl3·6H2O, 6 μM MnCl2·4H2O, 166 μM H3BO3, 0.36 μM ZnCl2, 0.36 μM CuCl2·2H2O, 0.36 μM NaMoO4·2H2O. P- was achieved by removing KH2PO4, and then KCl was used to adjust the potassium ion balance. The other components were the same as described for complete nutrition. N- was achieved by removing NH4NO3, and the other components were the same as described for complete nutrition. NP- was achieved by removing KH2PO4 and NH4NO3, and then KCl was used to adjust the potassium ion balance. The other components were the same as described for complete nutrition. To ensure the health of the tested seedlings, from 28 May to 29 June, we poured 200 mL complete nutrient solution into each pot every 3 days. To ensure the effectiveness of nutrient deficiency on the test seedlings, from 1 July to 5 August, we poured 200 mL treatment nutrient solution into the corresponding pots every 3 days. As the test duration extended through the hottest part of July, the water in the sand culture evaporated very quickly, and the nutrient pot was supplemented with enough water at 5 p.m. every day.

2.2. Sample Harvesting and Determination of Dry Weight and Leaf Area

On 5 August, the total foliage was cut off with branch shears, and the total foliar fresh weight (FFW) was weighed. The stems were then cut at the rhizome boundary, and the total stem fresh weight (SFW) was weighed. Finally, the sand on the roots was washed off with water, the water on the roots was absorbed by filter paper and the total root fresh weight (RFW) was determined. The subsamples of roots, stems and foliage were sampled, and the fresh weight of the subsamples was determined. All the subsamples were placed in an oven at 70 °C to dry until the dry weight of the subsamples no longer changed, and the dry weight was recorded. The total dry weight of root (RDW), stem (SDW) and foliage (FDW) was calculated by multiplying RFW, SFW and FFW by the ratio of the dry weight to the fresh weight of subsamples, respectively.
Simultaneously, other subsamples of roots and leaves were collected for physiological and enzyme activity determination and RNA extraction. These subsamples were precooled with liquid nitrogen and stored in a refrigerator at −80 °C.
The leaf area was calculated by the ratio of leaf mass to area. First, 20 small disks with the same size were punched out with a puncher, and the fresh weight of 20 small discs was measured and recorded as W0. The area of the 20 small discs was determined according to the circle area calculation formula and recorded as A0. The total leaf area was calculated by multiplying FFW by the ratio of A0 to W0.

2.3. Determination of the Content and Amount of C, N and P

The total N concentration was determined using the sulfuric acid–hydrogen peroxide digestion Kjeldahl method [36]. The total P concentration was determined using the sulfuric acid–hydrogen peroxide digestion and vanadium molybdenum yellow colorimetric methods [37]. The total organic matter concentration was determined using the potassium dichromate oxidation external heating method [38].
The amounts of N, P and C were calculated by multiplying the dry weight using the concentration of N, P and C. The total amounts of N, P and C of whole seedlings were obtained by adding the amounts of the elements from the roots, stems and leaves. The concentrations of C, N and P per plant were obtained by dividing the amounts of C, N and P by the dry weight, respectively. N utilization efficiency (NUE) and P utilization efficiency (PUE) were obtained by dividing the dry weight of individual seedlings by their amounts of N and P.
The root-to-shoot ratio of dry weight (DRS), N amount (NRS) and P amount (PRS) were calculated by dividing the dry weight, N amount and P amount of roots by that of aboveground (foliar and stem), respectively.

2.4. Determination of Physiological Traits

Chlorophyll content was determined using the alcohol extraction method [39]. The soluble sugar content was determined using the anthrone colorimetric method [40]. The nitrate ion content was determined by the nitrosalicylic acid colorimetric method [41]. The soluble protein content was determined with Coomassie Brilliant Blue G-250 method [42]. The free amino acids content was determined as described by Rosen with modifications [43]: 0.5 g fresh leaves or roots were boiled in 20 mL deionized water for 20 min. To remove the solid residue, the extraction solution was filtered with filter paper. To completely extract the remaining amino acids, the boiled solids were rinsed with distilled water 3 times, and the rinse solution was also filtered into the extraction solution. Finally, the volume of the extraction solution was adjusted to 100 mL with distilled water. Then, 0.5 mL extraction solution was added to 1 mL of the measurement solution containing 10 mM sodium acetate and 1.2% (m/v) ninhydrin. After boiling in water for 12 min, 5 mL 95% ethanol was added to the cooled reaction solution. To determine the free amino acid content, the absorbance of the mixed solution was determined at 570 nm.

2.5. Determination of Enzyme Activities

The determination of enzyme activities was divided into the extraction of crude enzyme solutions and determination of enzyme activity. The difference in enzyme molecular size and physiological activity led to specific extraction and activity determination methods for each enzyme.
The same extraction of crude enzyme solution from frozen tissues following the protocol of Turnao et al. [44] and Brugière et al. [45] with slight modifications was used for determination of enzyme activity of both glutamine synthetase (GS) and NADH-GOGAT (EC 1.4.1.14) enzyme. Approximately 0.5 g tissue was ground to a fine powder with a mortar and pestle in liquid nitrogen. The powder was transferred to an ice-cold mortar containing 2 mL extraction buffer (100 mM Tris-HCl, pH 7.6, 1 mM EDTA, 1.0 mM MgCl2, 10 mM β-mercaptoethanol). The samples were incubated on ice for 15–30 min. Debris was removed from the sample by centrifugation at 13,000× g for 10 min. The supernatant was assayed for GS activity, as described by Guiz et al. [46]. The total volume of the enzyme reaction solution was 2.5 mL (100 mM Tris-HCl, pH 7.8, 50 mM sodium glutamate, 5 mM hydroxylamine hydrochloride, 50 mM magnesium sulfate and 20 mM adenosine triphosphate). Next, 0.3 mL crude enzyme solution was added to start the reaction. After 20 min, 1.5 mL ferric chloride reaction solution (0.67 M ferric chloride, 0.37 M hydrochloric acid and 20% (w/v trichloroacetic acid) was added to stop the reaction. The absorbance of the supernatant at 540 nm was measured after centrifugation (10,000× g for 5 min).
The determination liquor of NADH-GOGAT enzyme activity consisted of 5 components: 20 mM L-glutamine (A), 100 mM α-ketoglutarate (B), 10 mM KCl (C), 25 mM Tris-HCl buffer pH 7.6 (D) and 3 mM NADH (now equipped and used) (E). First, 0.05 mL B, 0.1 mL C and 1.95 mL D were added to the 4 mL centrifuge tube in 30 °C water for 5 min. To determine NADH-GOGAT activity, 0.2 mL E, 0.3 mL enzyme solution and 0.4 mL A were added to the reaction solution. The absorbance of the supernatant at 340 nm was measured and recorded, and when appropriate, it was poured back into the test tube in 30 °C water. The absorbance of the supernatant at 340 nm was measured and record at 340 nm again after 3 min, and the difference between the two absorbances was calculated.
Nitrate reductase (NR) crude enzyme solution was obtained by extracting 0.5 g fresh powder of roots or leaves in 4 mL phosphoric acid buffer (pH 8.7) containing 0.01 mM cysteine and 1 mM EDTA. After centrifugation (4000 rpm, 15 min at 4 °C), to determine the NR enzyme activity, 0.4 mL supernatant was added to 1.6 mL reaction solution (0.05 M KNO3 phosphate buffer and 1 mg/mL NADH) in 25 °C water for 30 min. To terminate the reaction, 1 mL 1% (w/v) yellow amine solution and then 1 mL 0.02% (w/v) naphthyl vinylamine solution were added to the reaction solution sequentially, and the color reaction was developed for 15 min. The absorbance of the supernatant at 540 nm was measured after centrifugation (4000 rpm, 5 min).
The acid phosphatase (AP) crude enzyme solution was obtained by extracting 1.2 g fresh root powder in 8 mL 0.2 M sodium acetate buffer (pH 5.8) on ice for 5 min. After centrifugation (12,000 rpm, 15 min), to determine the AP enzyme activity, 1 mL supernatant was added to 2 mL 0.05 M p-nitrophenol disodium phosphate reaction solution in 37 °C water for 30 min. To terminate the reaction, 2 mL 0.5 M CaCl2 and 2 mL 2 M NaOH were added to the reaction solution. The absorbance of the supernatant at 410 nm was measured after the mixed solution was centrifuged at 2500 rpm and 4000 rpm for 5 min, respectively.
Phosphoenolpyruvate carboxylase (PEPC) activity was determined with the kit (G0606W) supplied by Suzhou Grace Technology Co., Ltd. in accordance with kit instructions.

2.6. Determination of Gene Transcripts Involved in N and P Assimilation

Determination of the transcript level of the key genes (NRT2.1, NRT2.4, NRT2.5, NRT2.7, NIA2, AAP3, PHT1-3, PHT1-4, PHO1;H1, PHO1;H9, PHT2-1) in N and P assimilation first required the extraction of mRNA. In this study, the reverse transcription kit (AT341) of TransGen Biotech was used for RNA reverse transcription. According to the manufacturer’s instructions, 0.5 µg of total RNA was reverse transcribed into single-stranded cDNA, and then the genomic DNA was digested with gDNA Remover. To verify whether the cDNA synthesis was successful, PCR of the tubulin gene was performed using single-stranded cDNA as the template. Supplementary Table S1 shows the gene-specific primers used for qPCR. Quantitative real-time PCR was performed using the ABI7500 system with TransStart Tip Green qPCR Super Mix (+Dye I/+Dye II) (TransGen Biotech, AQ142). According to the manufacturer’s instructions, the reaction system was 20 μL, including 10 μL 2 × TransStart Tip Green qPCR SuperMix, 0.4 μL 10 μM forward primer and reverse primer, 1 μL cDNA and 8.2 μL nuclease-free water. The following program was used for qPCR amplification: initial denaturation at 95 °C for 30 s, followed by 40 cycles of 95 °C for 5 s and 60 °C for 30 s. The tubulin gene was used as endogenous reference gene to estimate the relative transcript levels of specific genes in three biological replications.

2.7. Statistical Analysis and Graphic Production

Analysis of variance, mean, mean error and multiple comparisons were determined using SPSS19.0. Unless otherwise specified, all significance levels in this study were at the p < 0.05 level. To estimate provenance, nitrogen, phosphorus and their interaction effects, the variance was decomposed according to the following model:
Y i j k m = μ + G i + N j + P k + G i × N j + G i × P k + N j × P k + G i × N j × P k + ε ijkm
where Yijkm represents the trait of ith provenance, the jth nitrogen level, the kth phosphorus level and the mth repeat (i = DL and WC; j = N starvation and complete nutrition; k = P starvation and complete nutrition; m = all of the positive integer within 60; μ represents the overall mean; Gi represents the ith provenance effect; Nj represents the jth nitrogen level effect; Pk represents the kth phosphorus level effect; Gi × Nj represents the interaction effect between the ith provenance and the jth nitrogen level; Gi × Pk represents the interaction effect between the ith provenance and the kth phosphorus level; Nj × Pk represents the interaction effect between the jth nitrogen level and the kth phosphorus level; Gi × Nj × Pk represents the interaction effect of the ith provenance, the jth nitrogen level and the kth phosphorus level; εijkm represents random error of the ith provenance, the jth nitrogen level, the kth phosphorus level and the mth repeat.
The transcript level of gene was calculated by analyzing the qPCR cycle threshold (CT). To obtain the delta CT value (ΔCT) of the target gene, the CT value of the internal reference gene was subtracted from the CT value of the target gene. The value calculated when the exponential function of 2 takes −ΔCT as the exponent represents the multiple of the target gene to the internal reference gene. To ensure homogeneity of variance, we took the logarithm to base 2 of the multiple of the transcript of target gene to the internal reference gene.
The column charts in this study were drawn using Origin 8.0 and the line charts were drawn using Excel.

3. Results

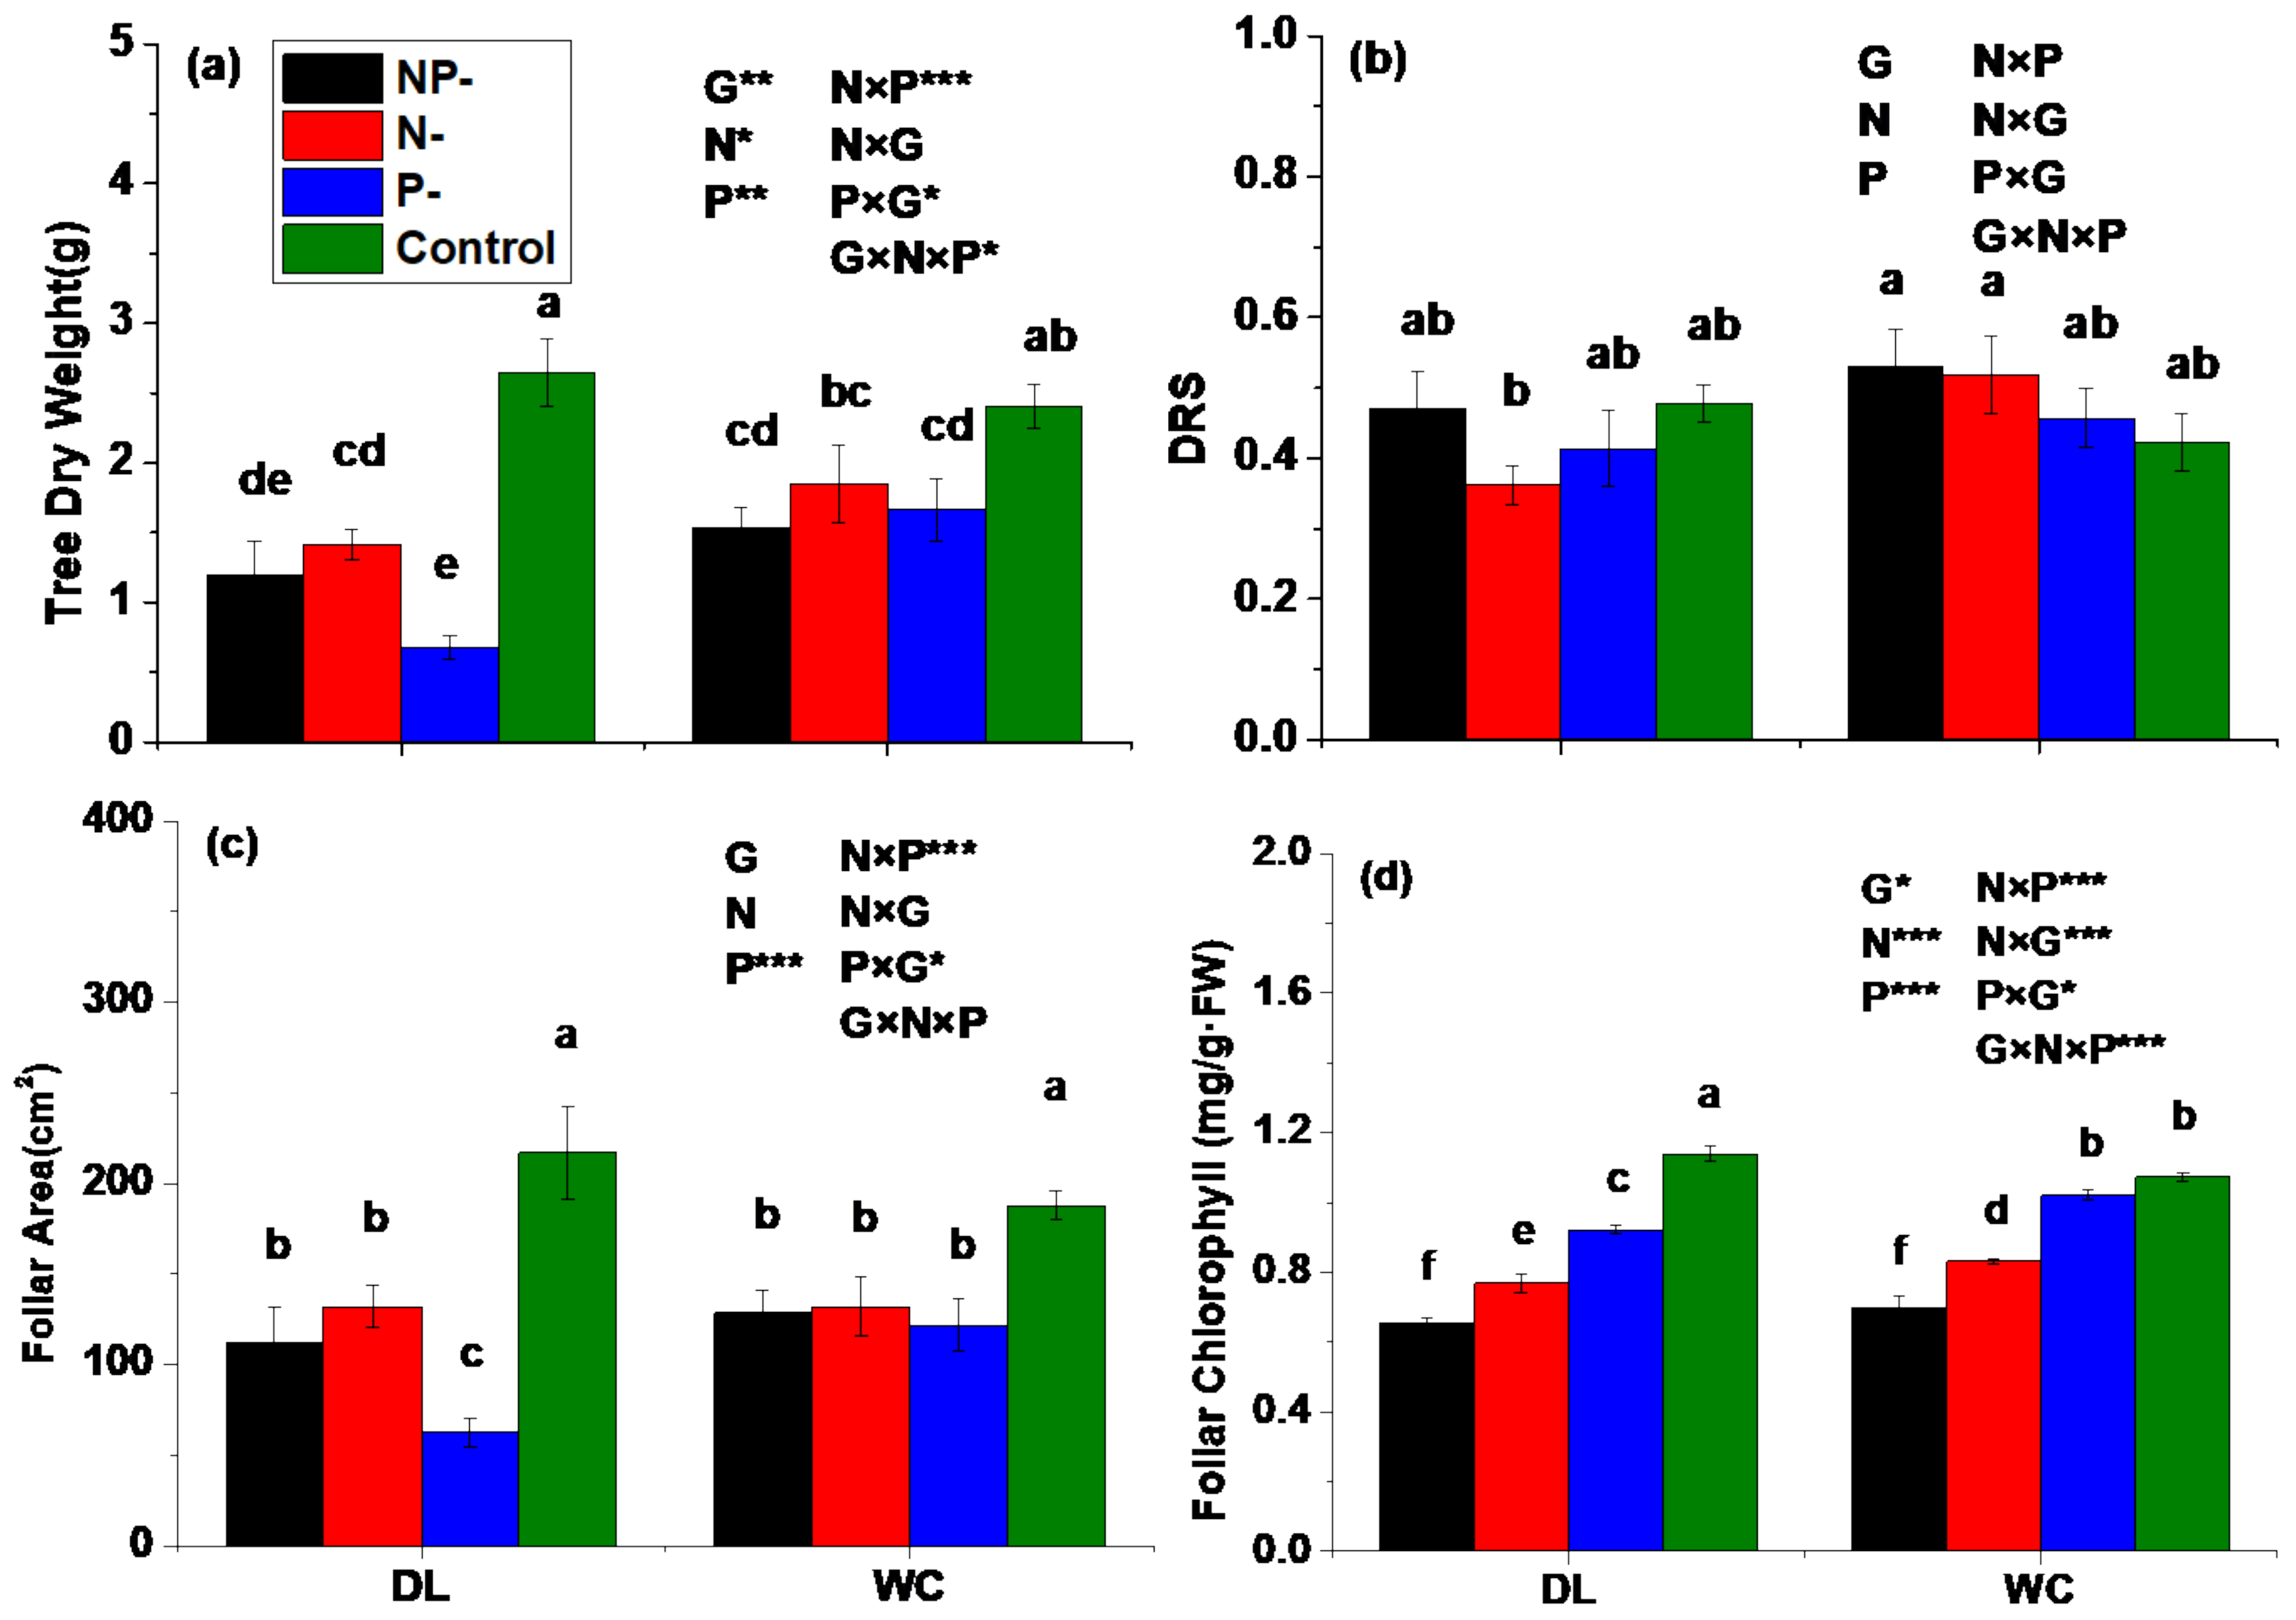
3.1. Dry Weight, DRS, Foliar Area and Chlorophyll Content

Annual seedlings of two F. mandshurica provenances, Dailing (DL) and Wuchang (WC), were tested for N starvation (N-), P starvation (P-), N and P starvation (NP-) and complete nutrition (control) (Supplementary Figure S6). The results showed that the dry weight of WC was 2.45 times that of DL under P-, although there was no significant difference in the dry weight of annual seedlings between DL and WC under complete nutrition (Figure 1a). Compared with the control, N-, P- and NP- reduced the dry weight, and the reduction in DL was greater than that of WC. For example, the dry weight of DL and WC under P- was reduced to 25.6% and 69.2% of that under complete nutrition, respectively. The leaf area of WC was 1.95 times that of DL under P- (Figure 1c), although there was no significant difference in leaf area between DL and WC under complete nutrition. Compared with the control, N-, P- and NP- significantly reduced the leaf area. The leaf area of DL and WC under P- was reduced to 28.8% and 64.9% compared with that under complete nutrition. For chlorophyll content, DL was significantly greater than that of WC under complete nutrition (Figure 1d). Compared with the control, N-, P- and NP- reduced the chlorophyll content. The chlorophyll contents of DL and WC under N- and P- were reduced to 67.4%, 77.5% and 80.9%, 95% of that under complete nutrition, respectively. Moreover, WC was significantly greater than DL in terms of the dry-weight root-to-shoot ratio (DRS) under N- (Figure 1b). Compared with complete nutrition, P-, N- and NP- reduced DRS of DL and increased DRS of WC.

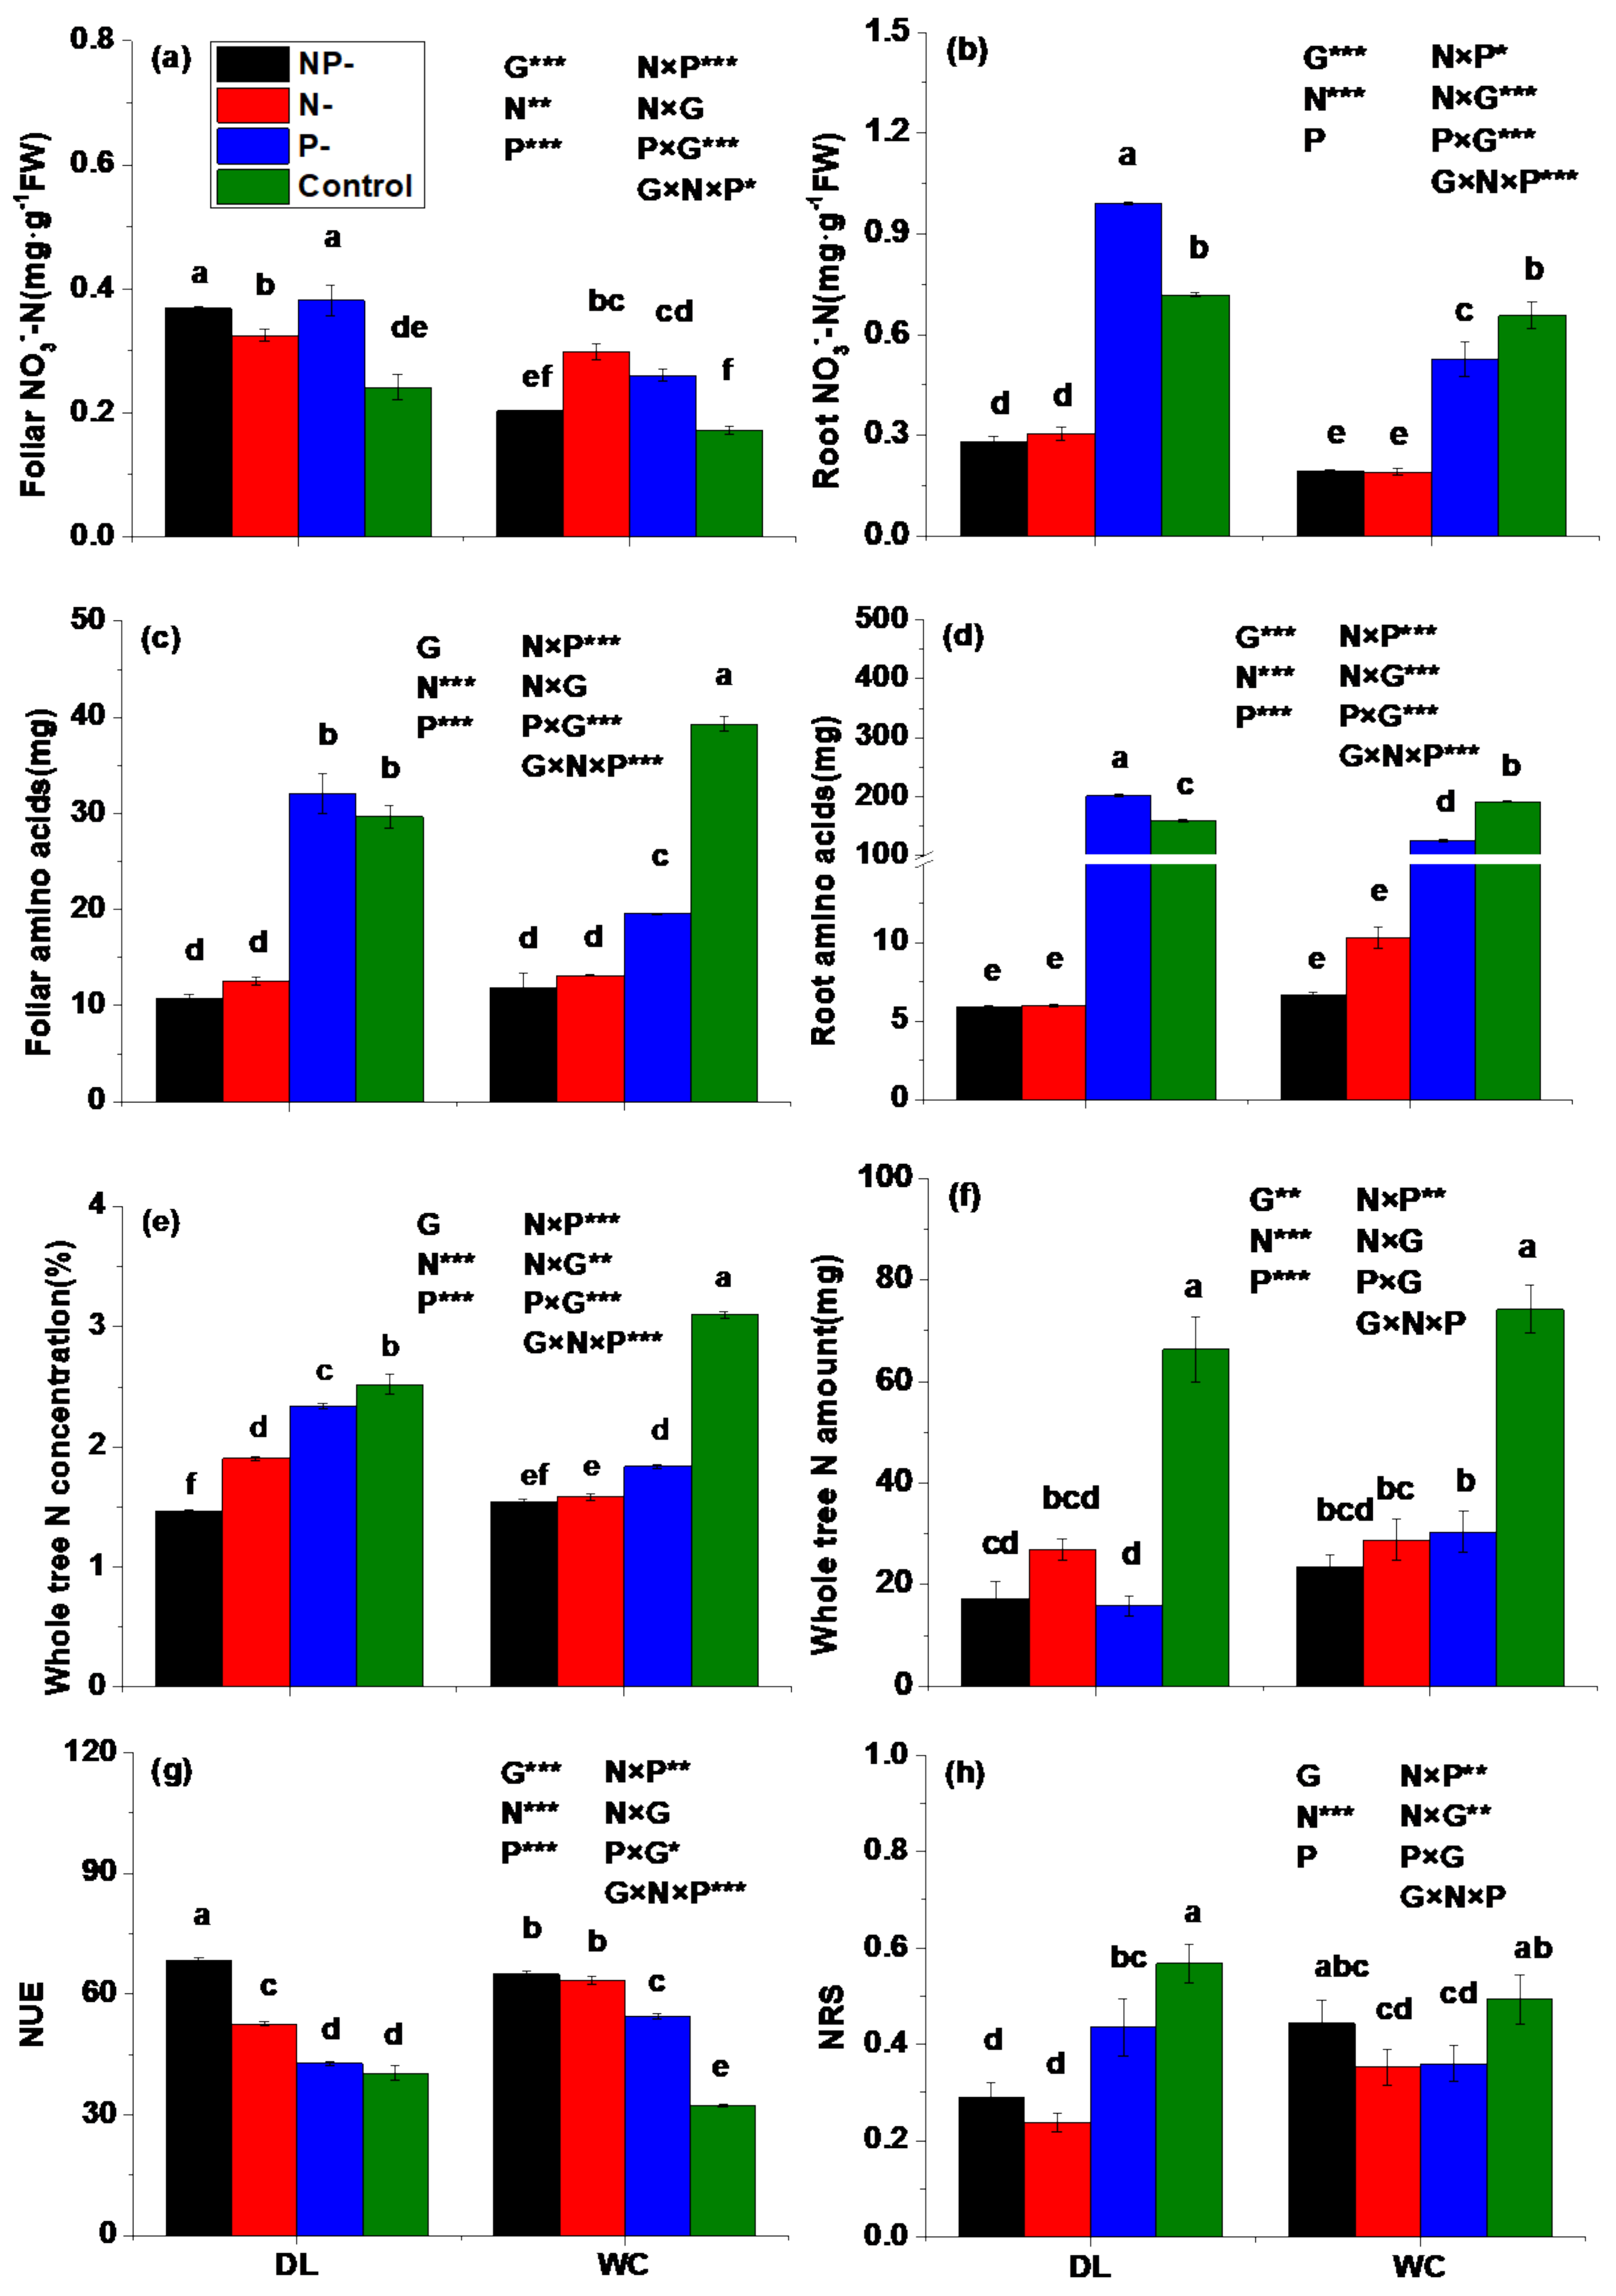
3.2. Nitrogen Status

N- and NP- significantly reduced the free amino acid content and nitrate ion content in root (Figure 2b,d), indicating that the N deficiency in sand culture was transformed into N deficiency in seedlings. However, in leaf, N- and NP- increased the nitrate ion content (Figure 2a) but decreased the free amino acid content (Figure 2c), indicating that the conversion of nitrate ions to amino acids was inhibited, consistent with the decrease in activity of N assimilation enzymes (Figure 3). Moreover, the NUE of WC was significantly greater than that of DL under N- (Figure 2g). For example, the N amount per seedling of WC was slightly greater than that of DL (Figure 2f), although the nitrate ion content in root and N concentration per seedling (Figure 2e) of DL under N- were significantly greater than that of WC. N- and NP- significantly increased the NUE of DL and WC. The increase in NUE of WC under P- was greater than that of DL. For example, the NUE of DL and WC under P- was 1.06 times and 1.69 times that of complete nutrition.
The effects of P- on nitrate ion content and free amino acid content in DL and WC roots were different (Figure 2b,d). P- significantly increased the nitrate ion and amino acid contents of DL, but significantly reduced those of WC. The nitrate ion content and amino acid content in leaf and root and N concentration per plant of DL under P- were significantly greater than those of WC. However, due to the greater dry weight, the N amount of WC was significantly greater than that of DL, indicating that the NUE of WC was greater than that of DL under P-.
There was no significant difference in the N-amount root-to-shoot ratio (NRS) between DL and WC provenances under complete nutrition (Figure 2h). WC was significantly larger than DL in NRS and 1.53 times DL under NP-. Compared with the control, N-, P- and NP- reduced NRS, and the reduction in NRS of DL was greater than that of WC. NRS of DL, WC under N- and NP- was 41.8%, 71.5% and 51.2%, respectively, and 90.1% for the control.

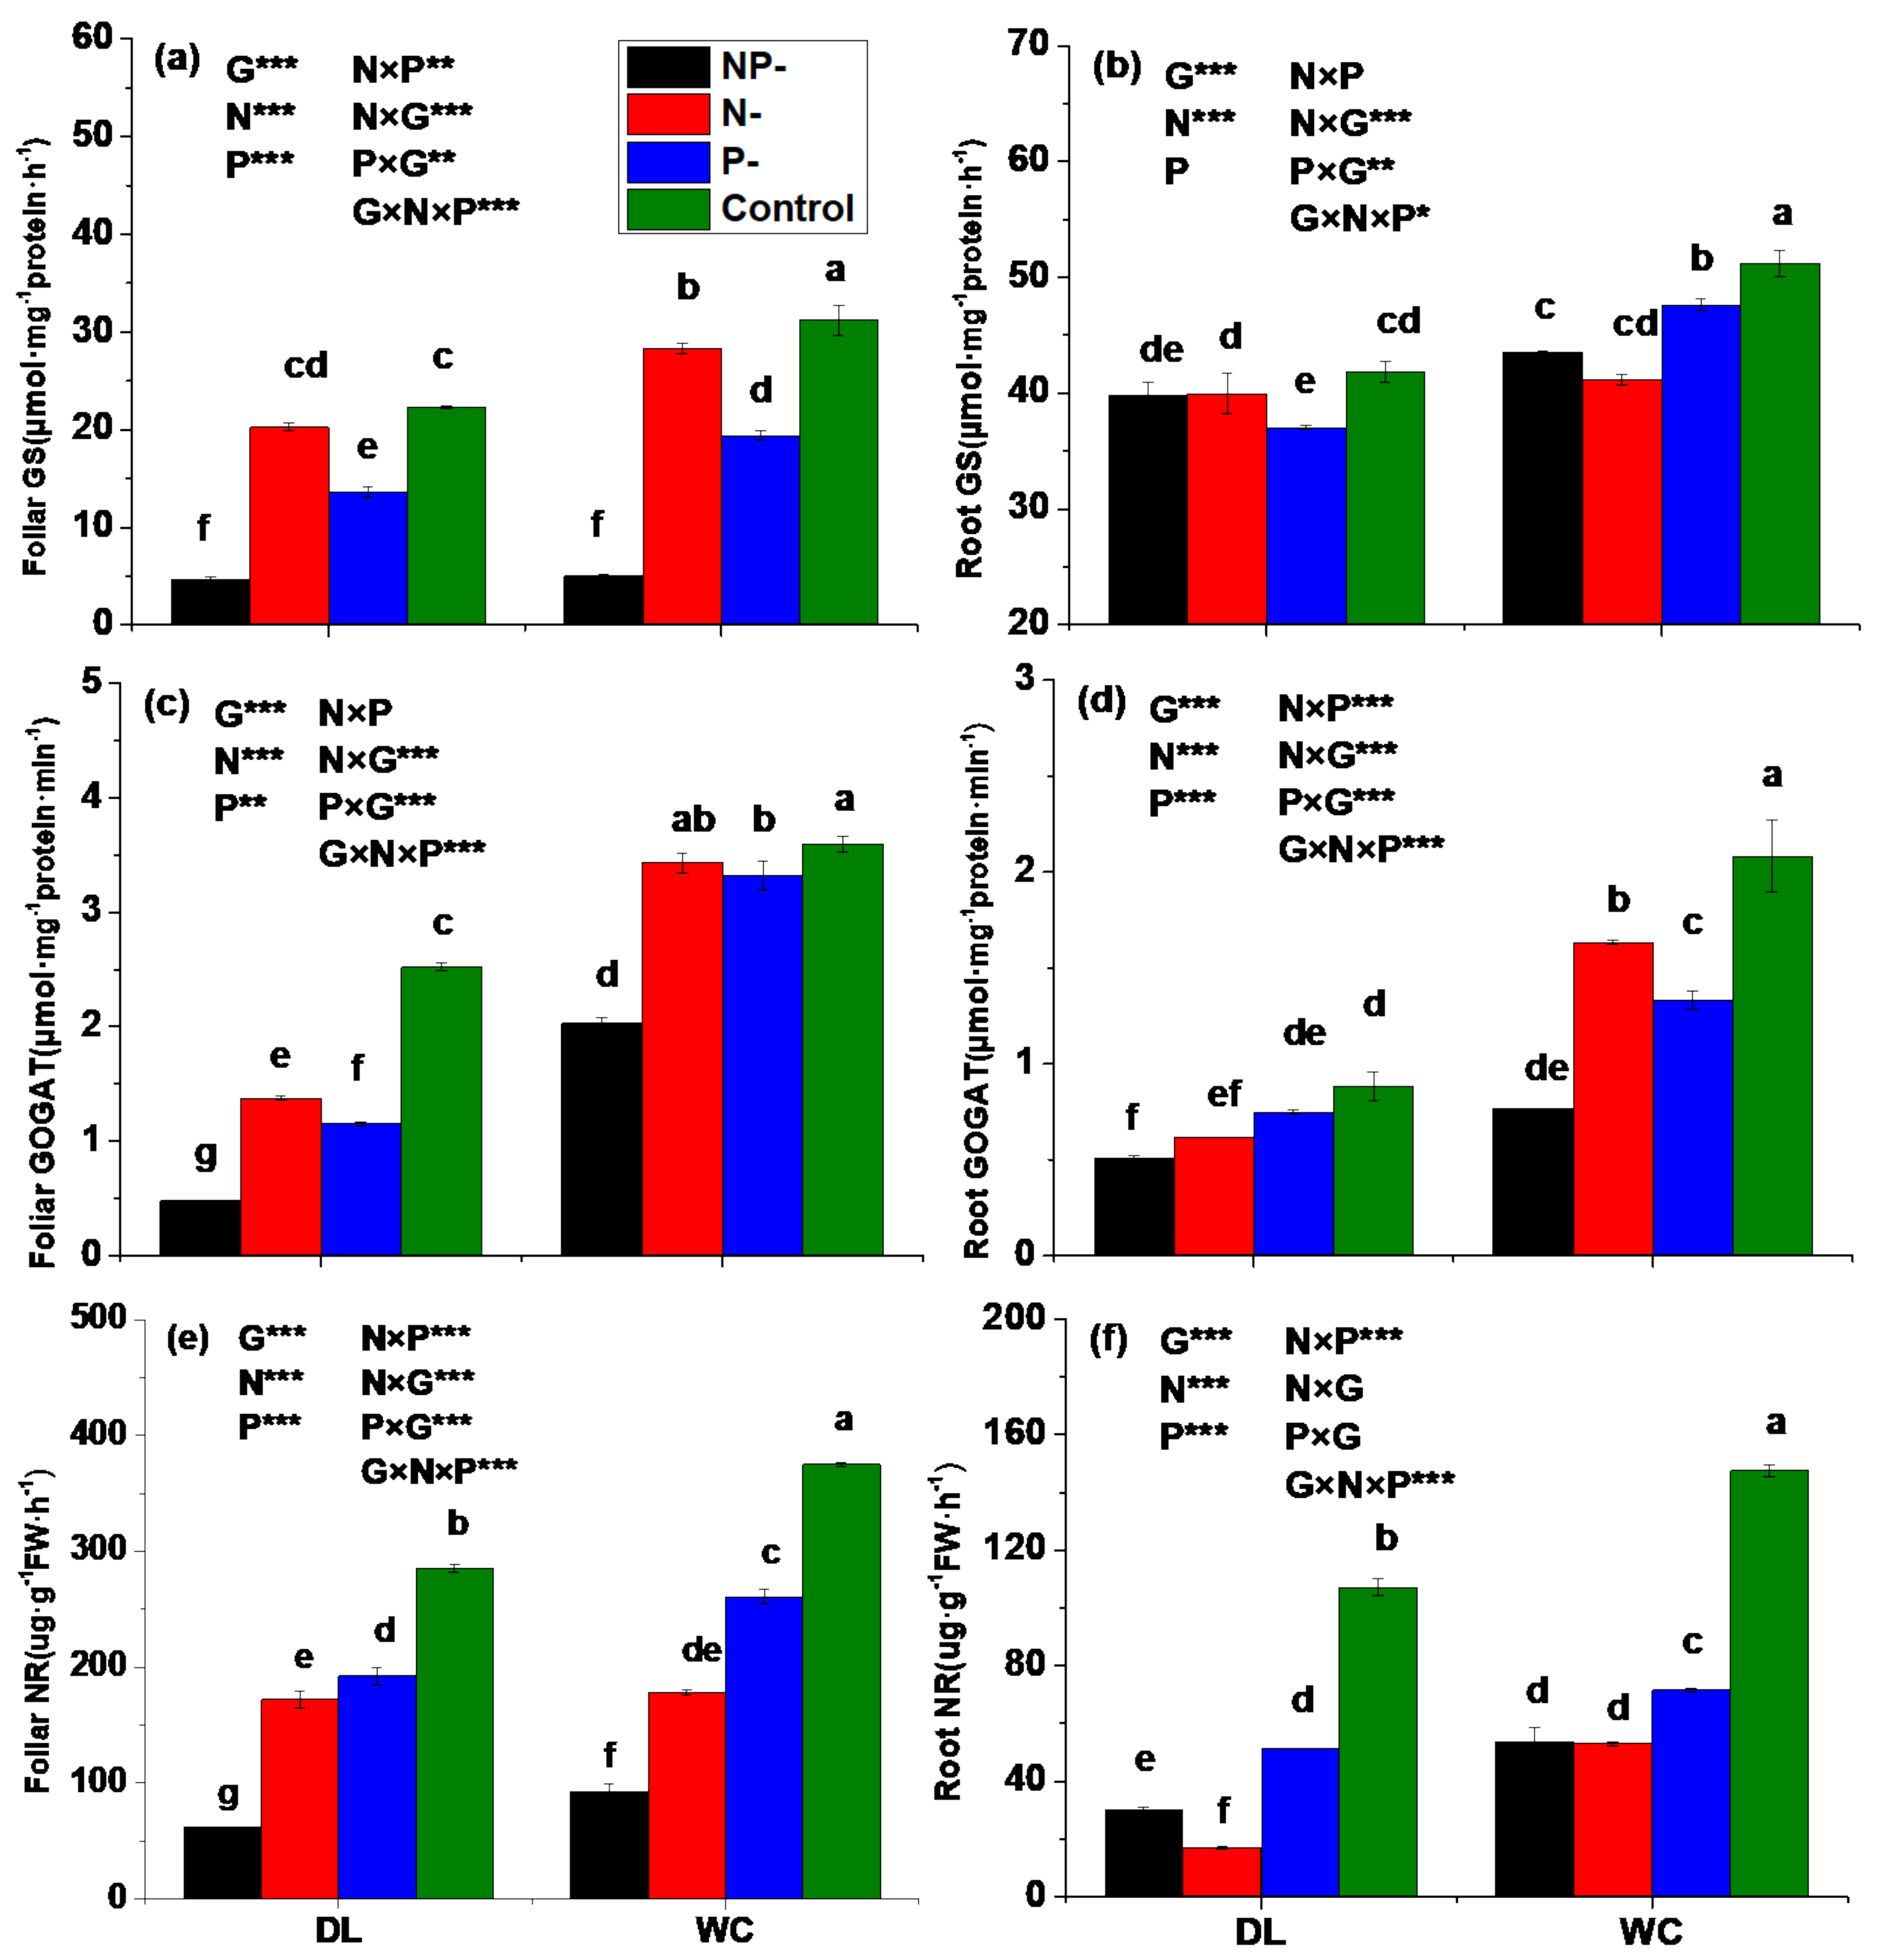
3.3. Activities of Enzymes Involved in N Assimilation

Overall, the activities of N assimilation enzymes (NR, GS, GOGAT) in leaves and roots of seedlings of WC were significantly greater than those of DL under N-, P-, NP- and complete nutrition (Figure 3), indicating that the N assimilation capacity of WC was greater than that of DL. Compared with the control, N-, P- and NP- reduced the activity of N assimilation enzymes (NR, GS, GOGAT) in leaves and roots. However, P- decreased the GOGAT enzyme activity in leaves of DL more than WC. For example, the GOGAT enzyme activity of DL and WC under P- was reduced to 45.7% and 92.4% of the control, respectively (Figure 3c).

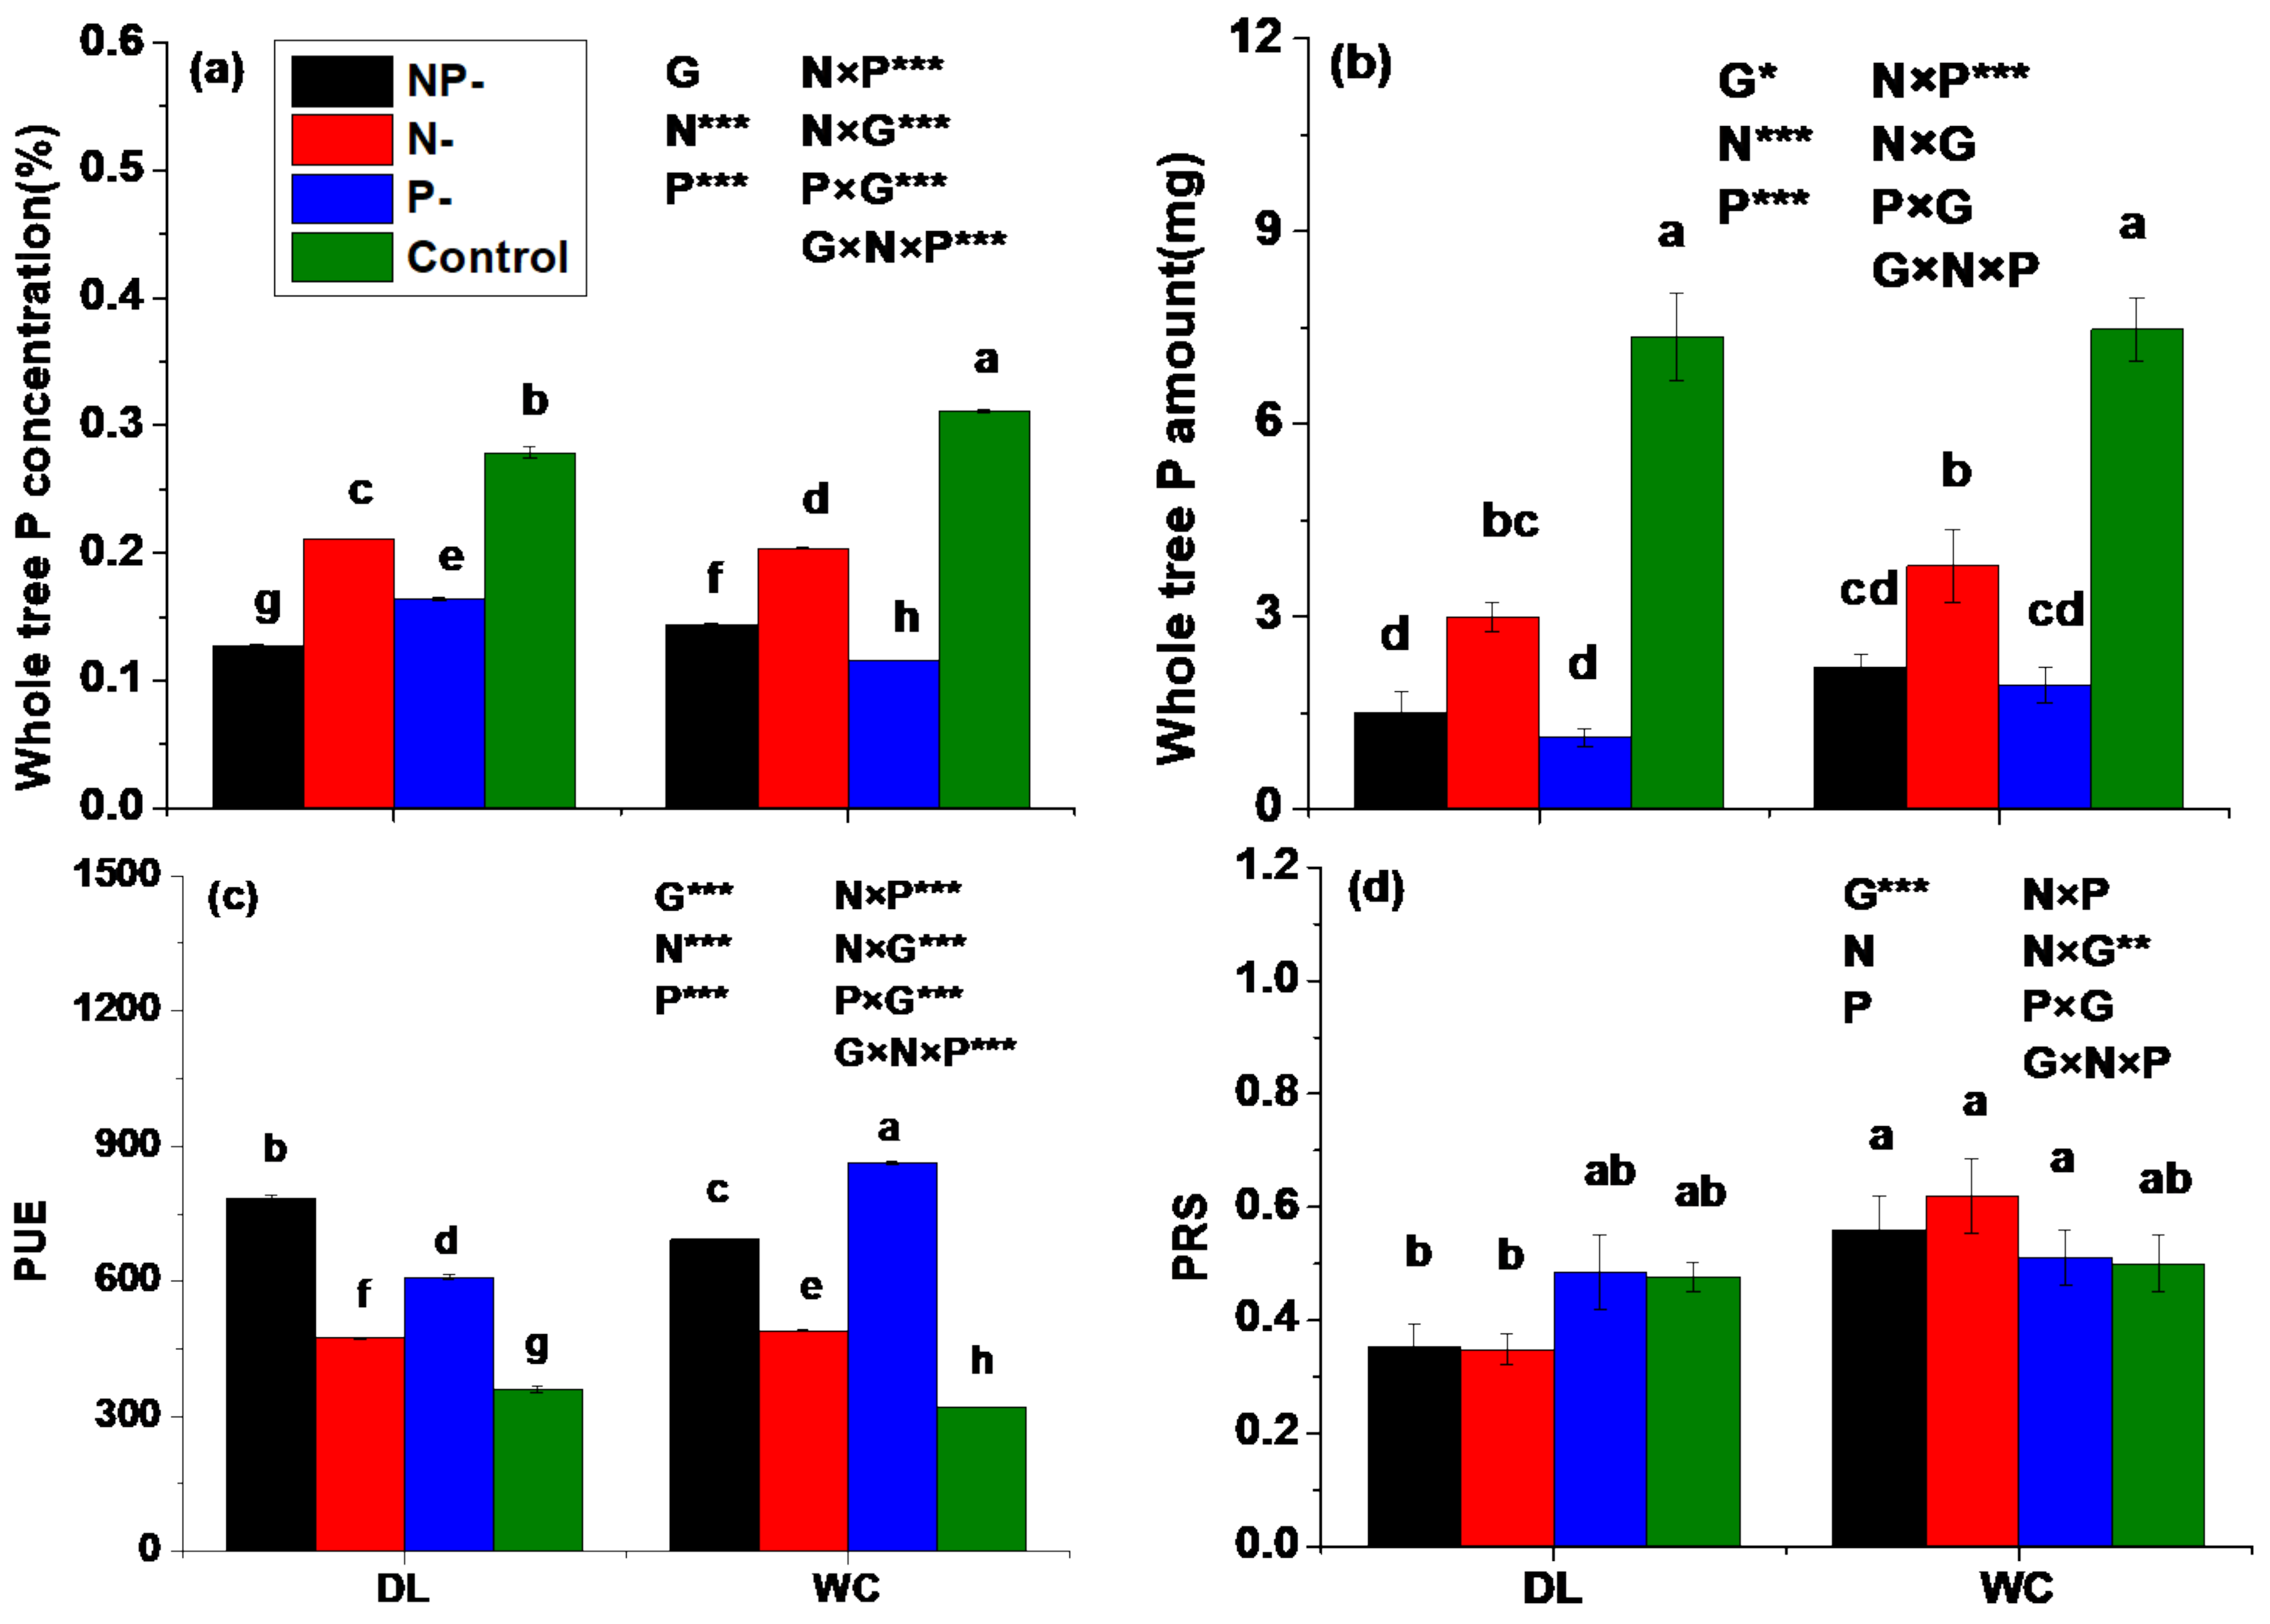
3.4. Phosphorus Status

Significant differences in P use efficiency (PUE) were observed between provenances N and P (Figure 4c). For PUE, WC was significantly greater than DL under N- and P-, which was consistent with the significantly greater P concentration of DL than WC under N- and P-, respectively (Figure 4a). However, there was no significant difference in the amount of P in annual seedlings between DL and WC under N- and P- (Figure 4b), which was attributed to the greater dry weight of WC than DL. Compared with complete nutrition, N-, P- and NP- significantly increased PUE, and the increase in WC was greater than that of DL. However, it significantly reduced the P concentration, and the reduction in WC was greater than that of DL and significantly reduced the P amount, and the reduction in DL was greater than that of WC. For example, PUE of DL and WC under P- was 1.69 and 2.69 times that of complete nutrition; P of DL and WC under P- was reduced to 15.1% and 25.8% of that under complete nutrition; and the P concentration was reduced to 58.9% and 37.2%, respectively. For the P-amount root-to-shoot ratio (PRS), there was no significant difference between DL and WC under complete nutrition (Figure 4d). PRS of WC was significantly greater than DL, which was 1.78 and 1.58 times that of DL under N- and NP-. Compared with the control, N- and NP- increased the PRS of WC by 24% and 12% and reduced PRS of DL by 25.8% and 26.9%, respectively.

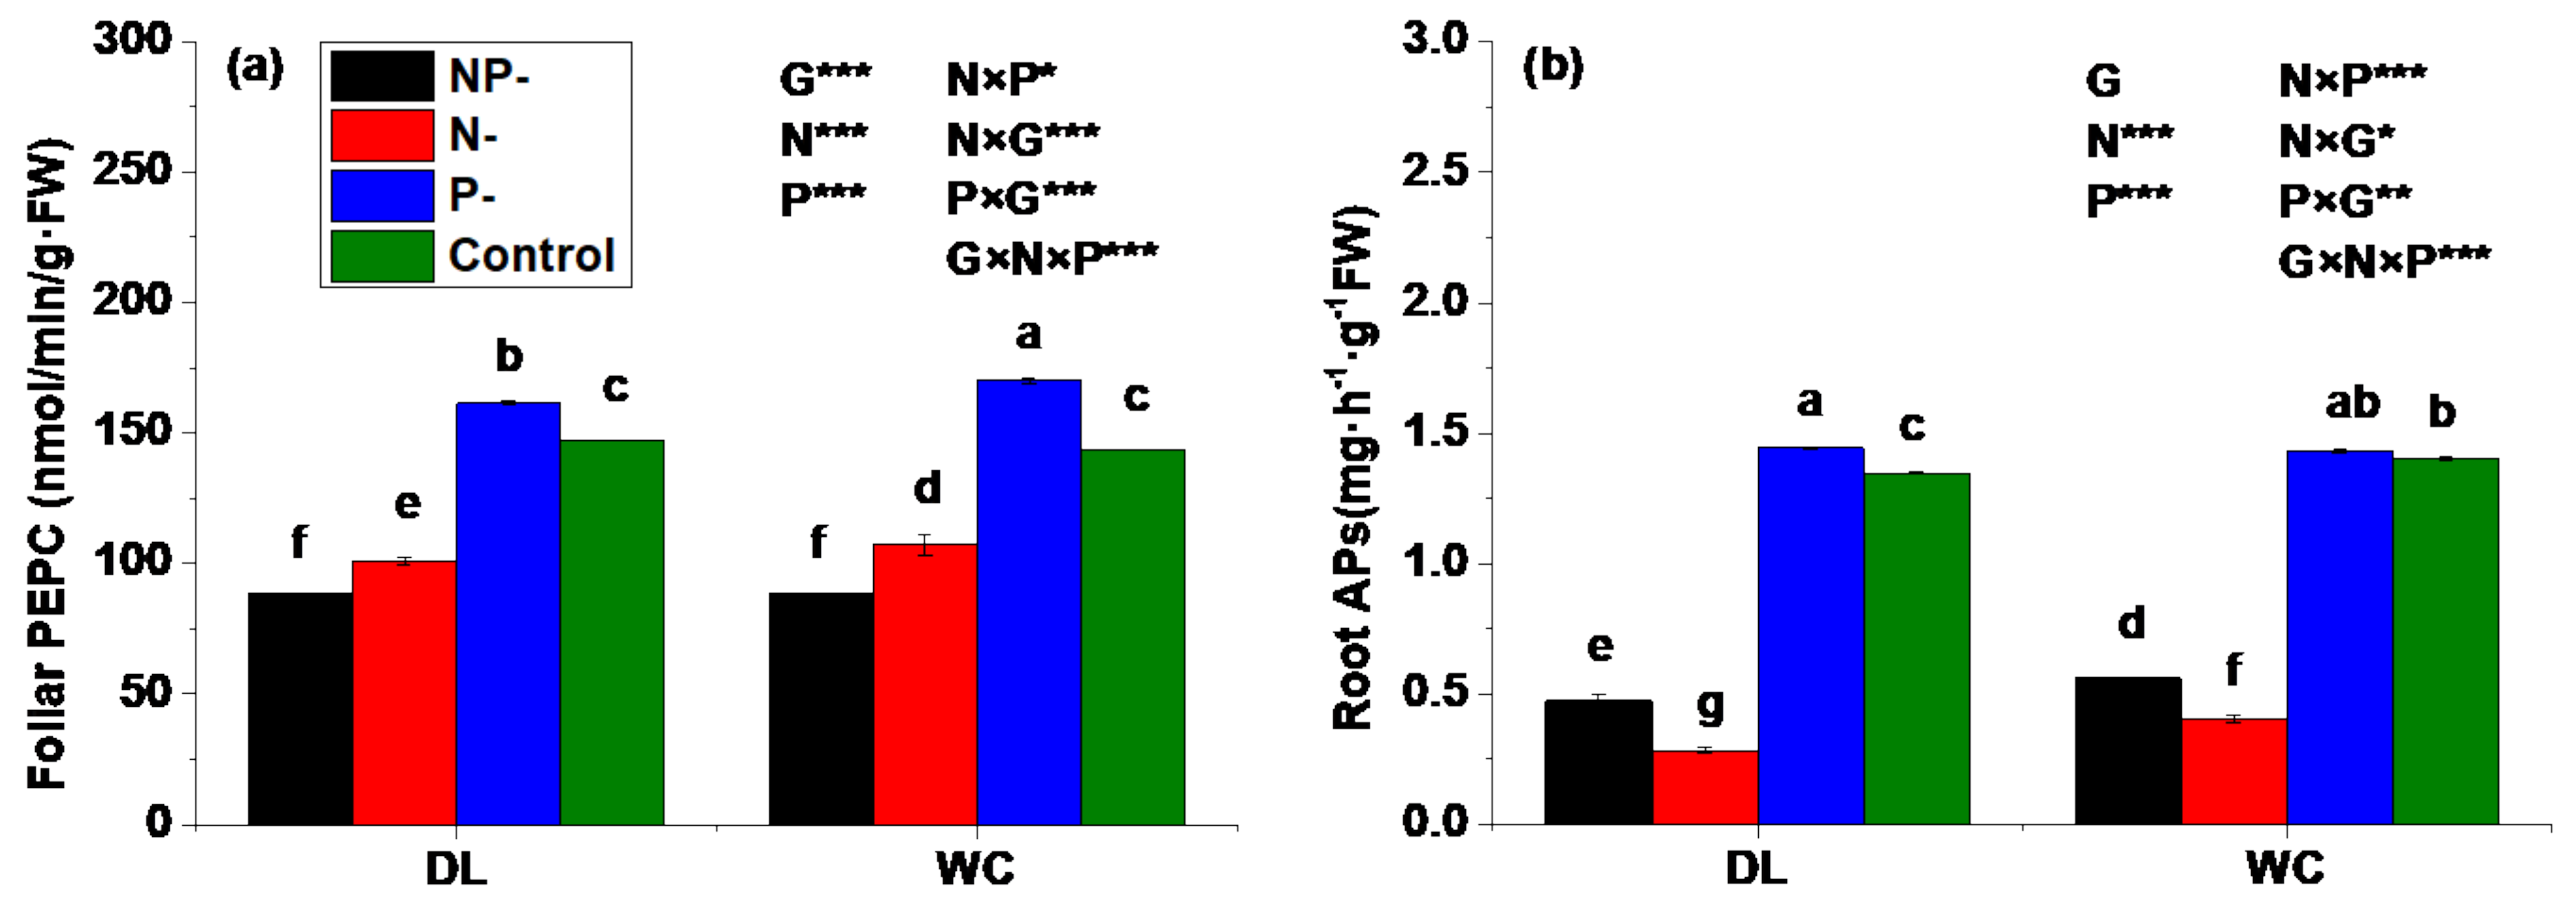
3.5. Activities of Enzymes Involved in P Assimilation
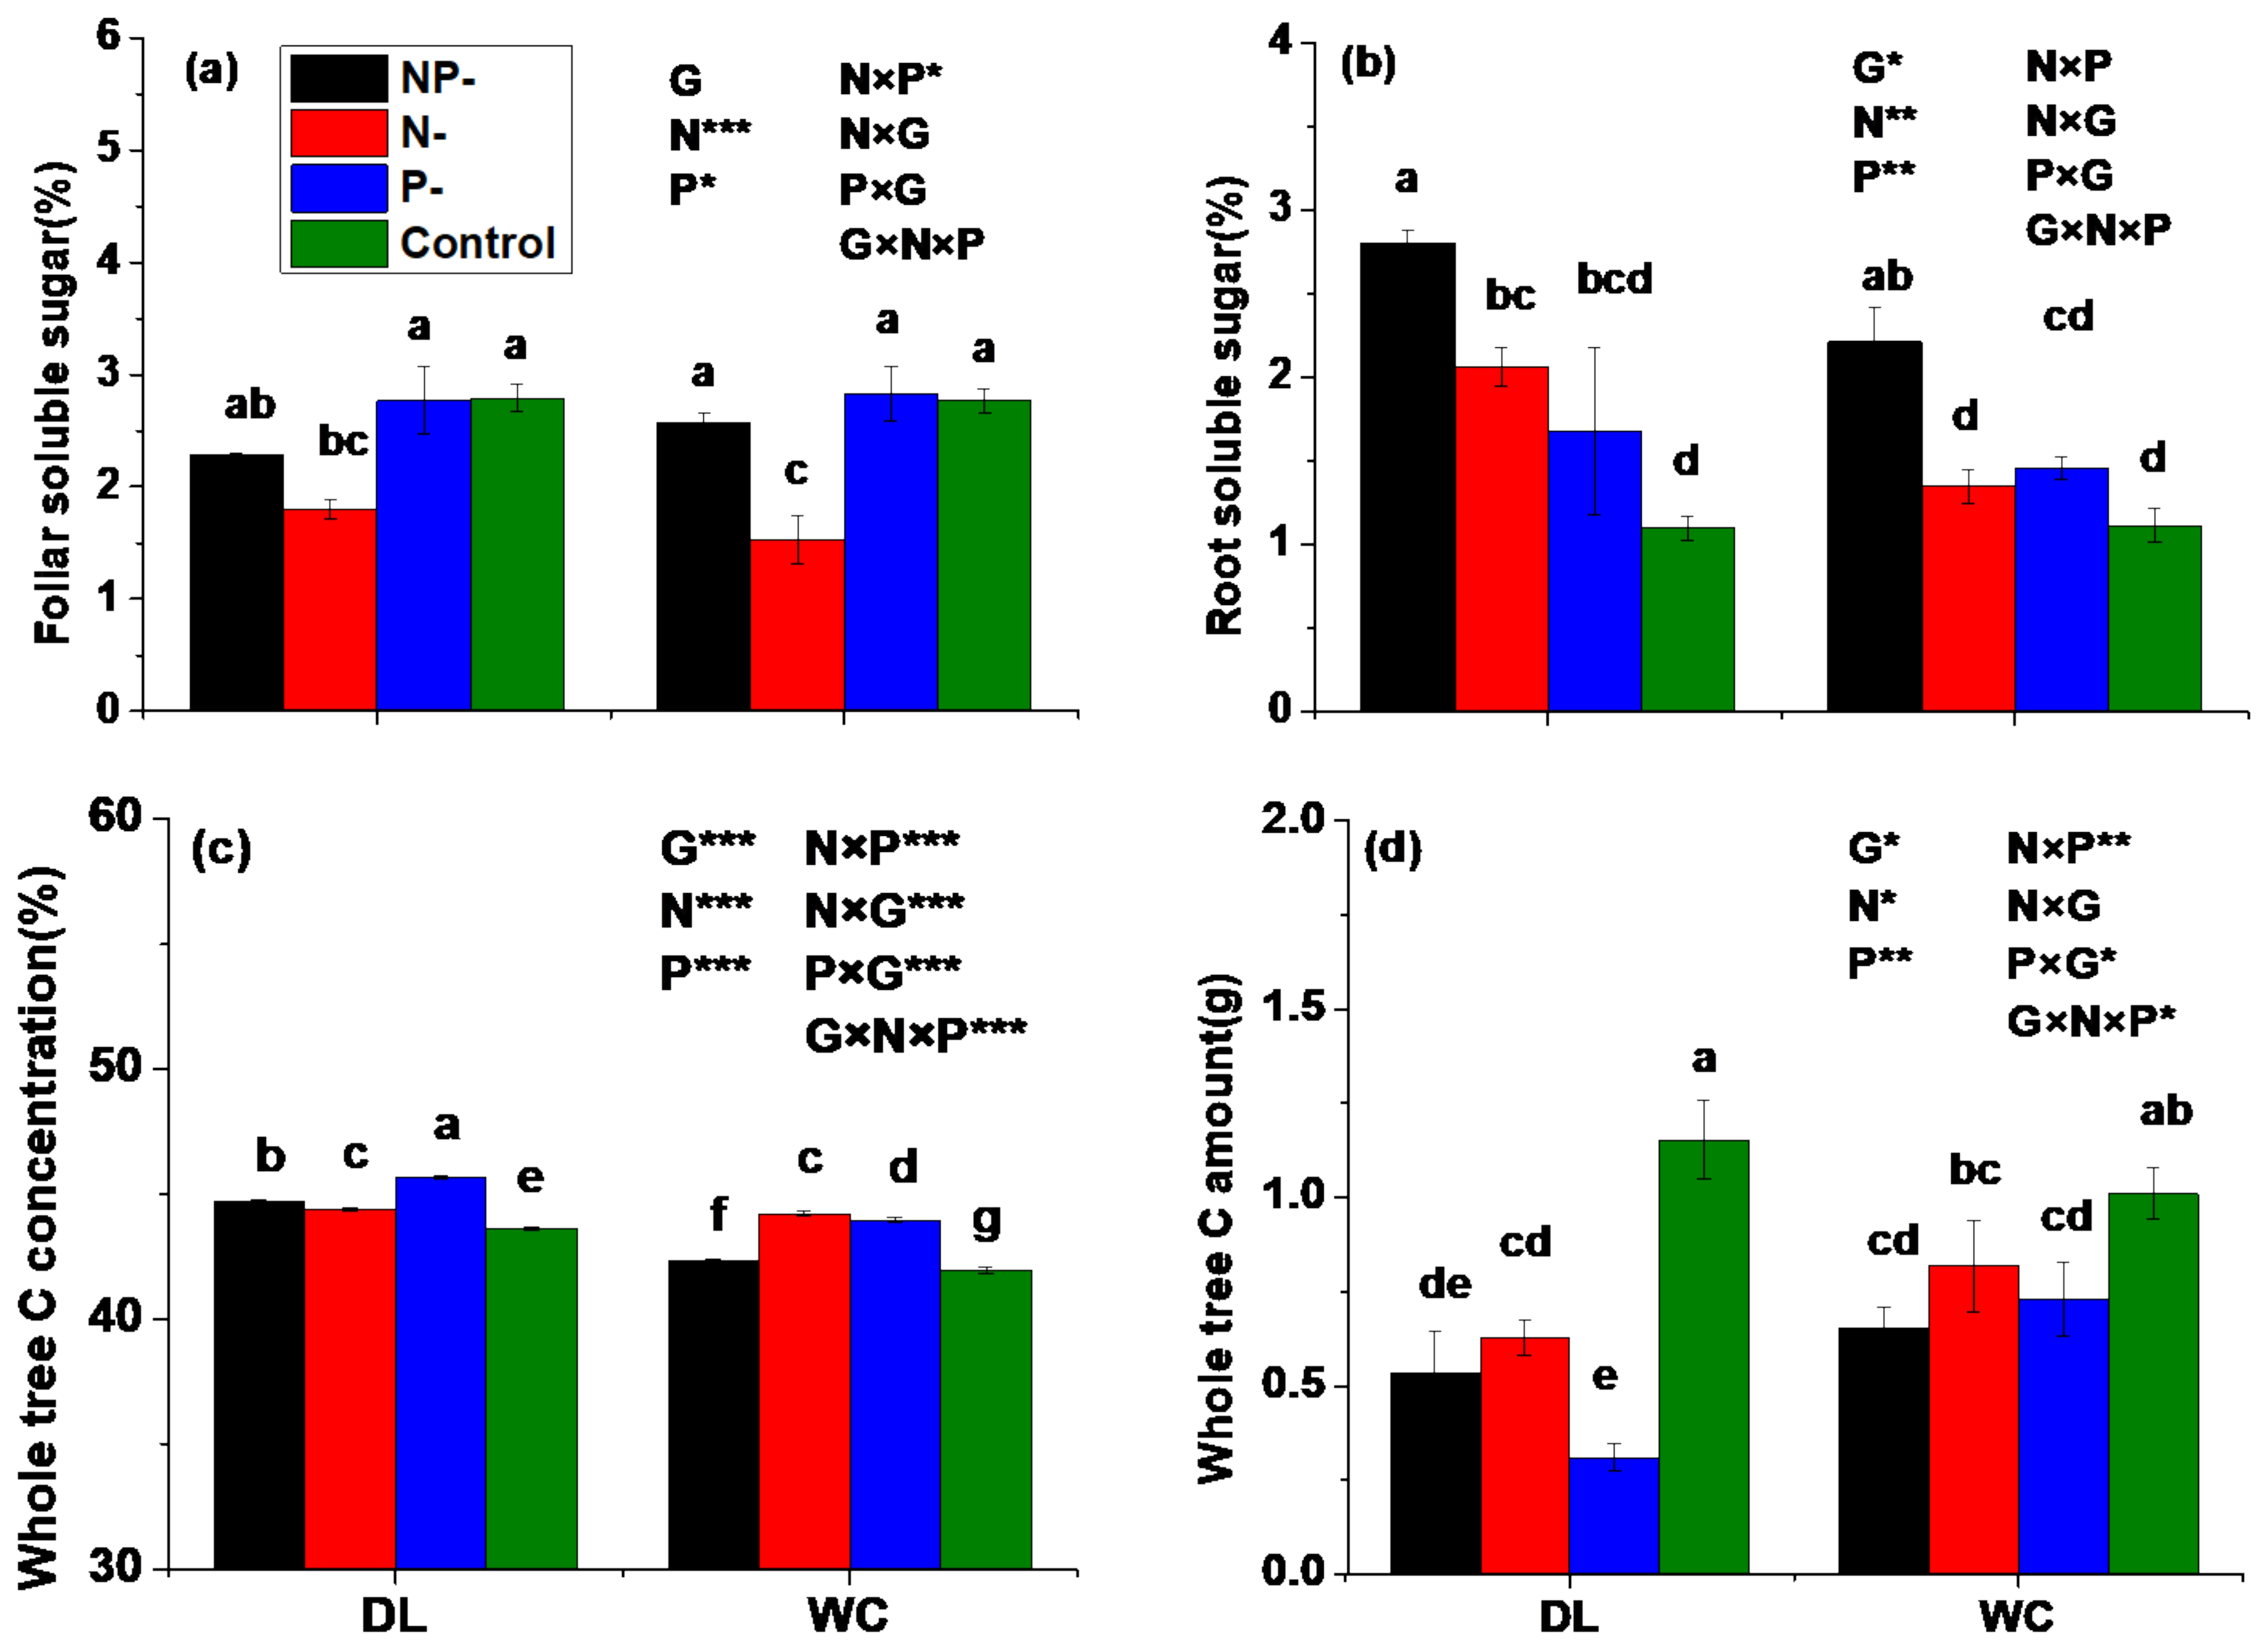
PEPC enzyme activity of WC was significantly greater than that of DL under P- and N-, but there was no significant difference between DL and WC under complete nutrition (Figure 5a). Compared with the control, P- significantly increased the PEPC activity. N- significantly reduced the PEPC enzyme activity. PEPC enzyme activity of DL and WC under N- (NP-) was 68.6% (60.1%) and 74.7% (61.5%) of the control, respectively. For the root AP enzyme activity, WC was significantly greater than that of DL under complete nutrition (Figure 5b). Compared with the control, P- increased the AP enzyme activity of DL and WC, and N- significantly reduced the AP enzyme activity. The AP enzyme activity of DL and WC under N- (NP-) was reduced to 21.1% (35.1%) and 29% (40.1%) of the control.

3.6. Carbon Status

The C amount was greater in of WC than DL under P- and NP- (Figure 6d), although the C concentration of WC was significantly reduced in WC than DL (Figure 6c), which was mainly due to the greater dry weight of WC compared with DL. N-, P- and NP- reduced the amount of C but increased the soluble sugar content in roots (Figure 6b), indicating that nutrition starvation inhibited C assimilation. Moreover, the inhibition of C assimilation of DL by nutrient starvation was greater than that of WC. The increase in soluble sugar content of DL was greater than that of WC. For example, the soluble sugar content in the roots of DL, WC under N- and P- was 1.88 times, 1.21 times and 1.53 times, respectively, and 1.31 times that of the control. The decrease in the C amount was greater in the DL than WC. For example, the C amount in the roots of DL, WC under N- and P- was 46.8%, 95.8% and 23.5%, respectively, compared with 49% for the control. Leaves are the organs that absorb and sequestrate C. N- significantly reduced the soluble sugar content in the leaves. However, the soluble sugar content in leaves of DL was insignificantly different from that of WC under complete nutrition, N-, P- and NP-.

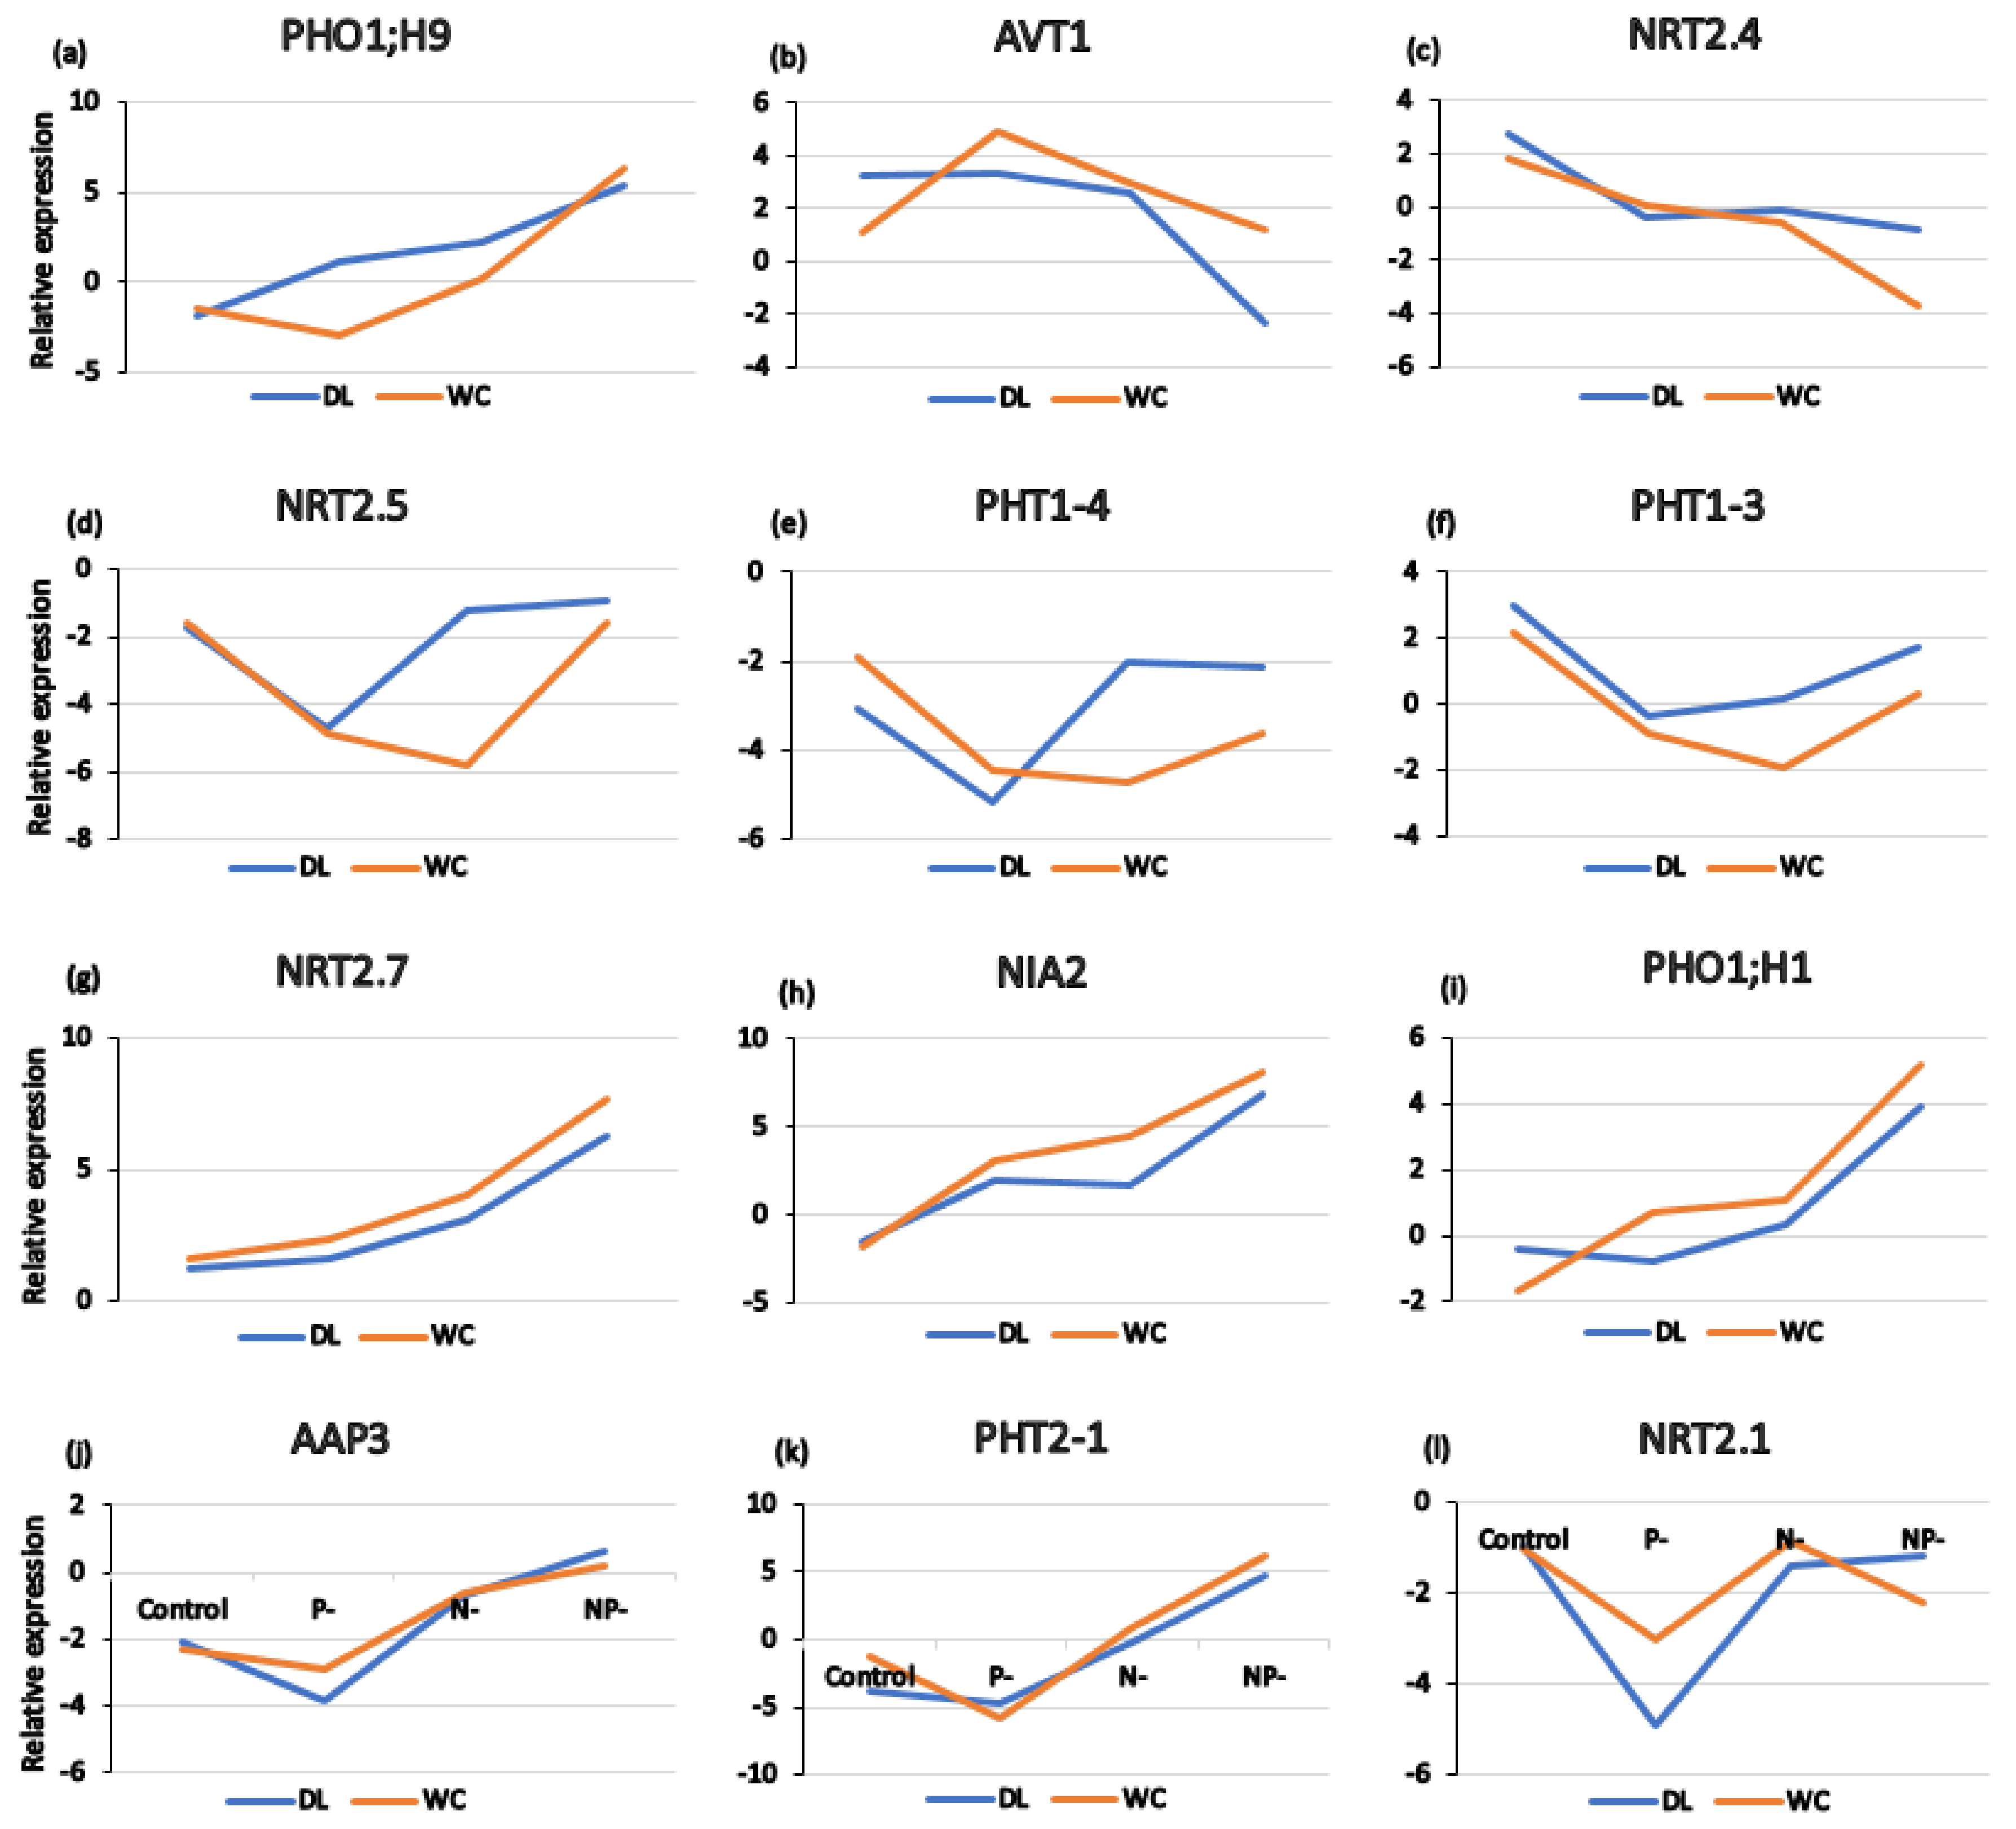
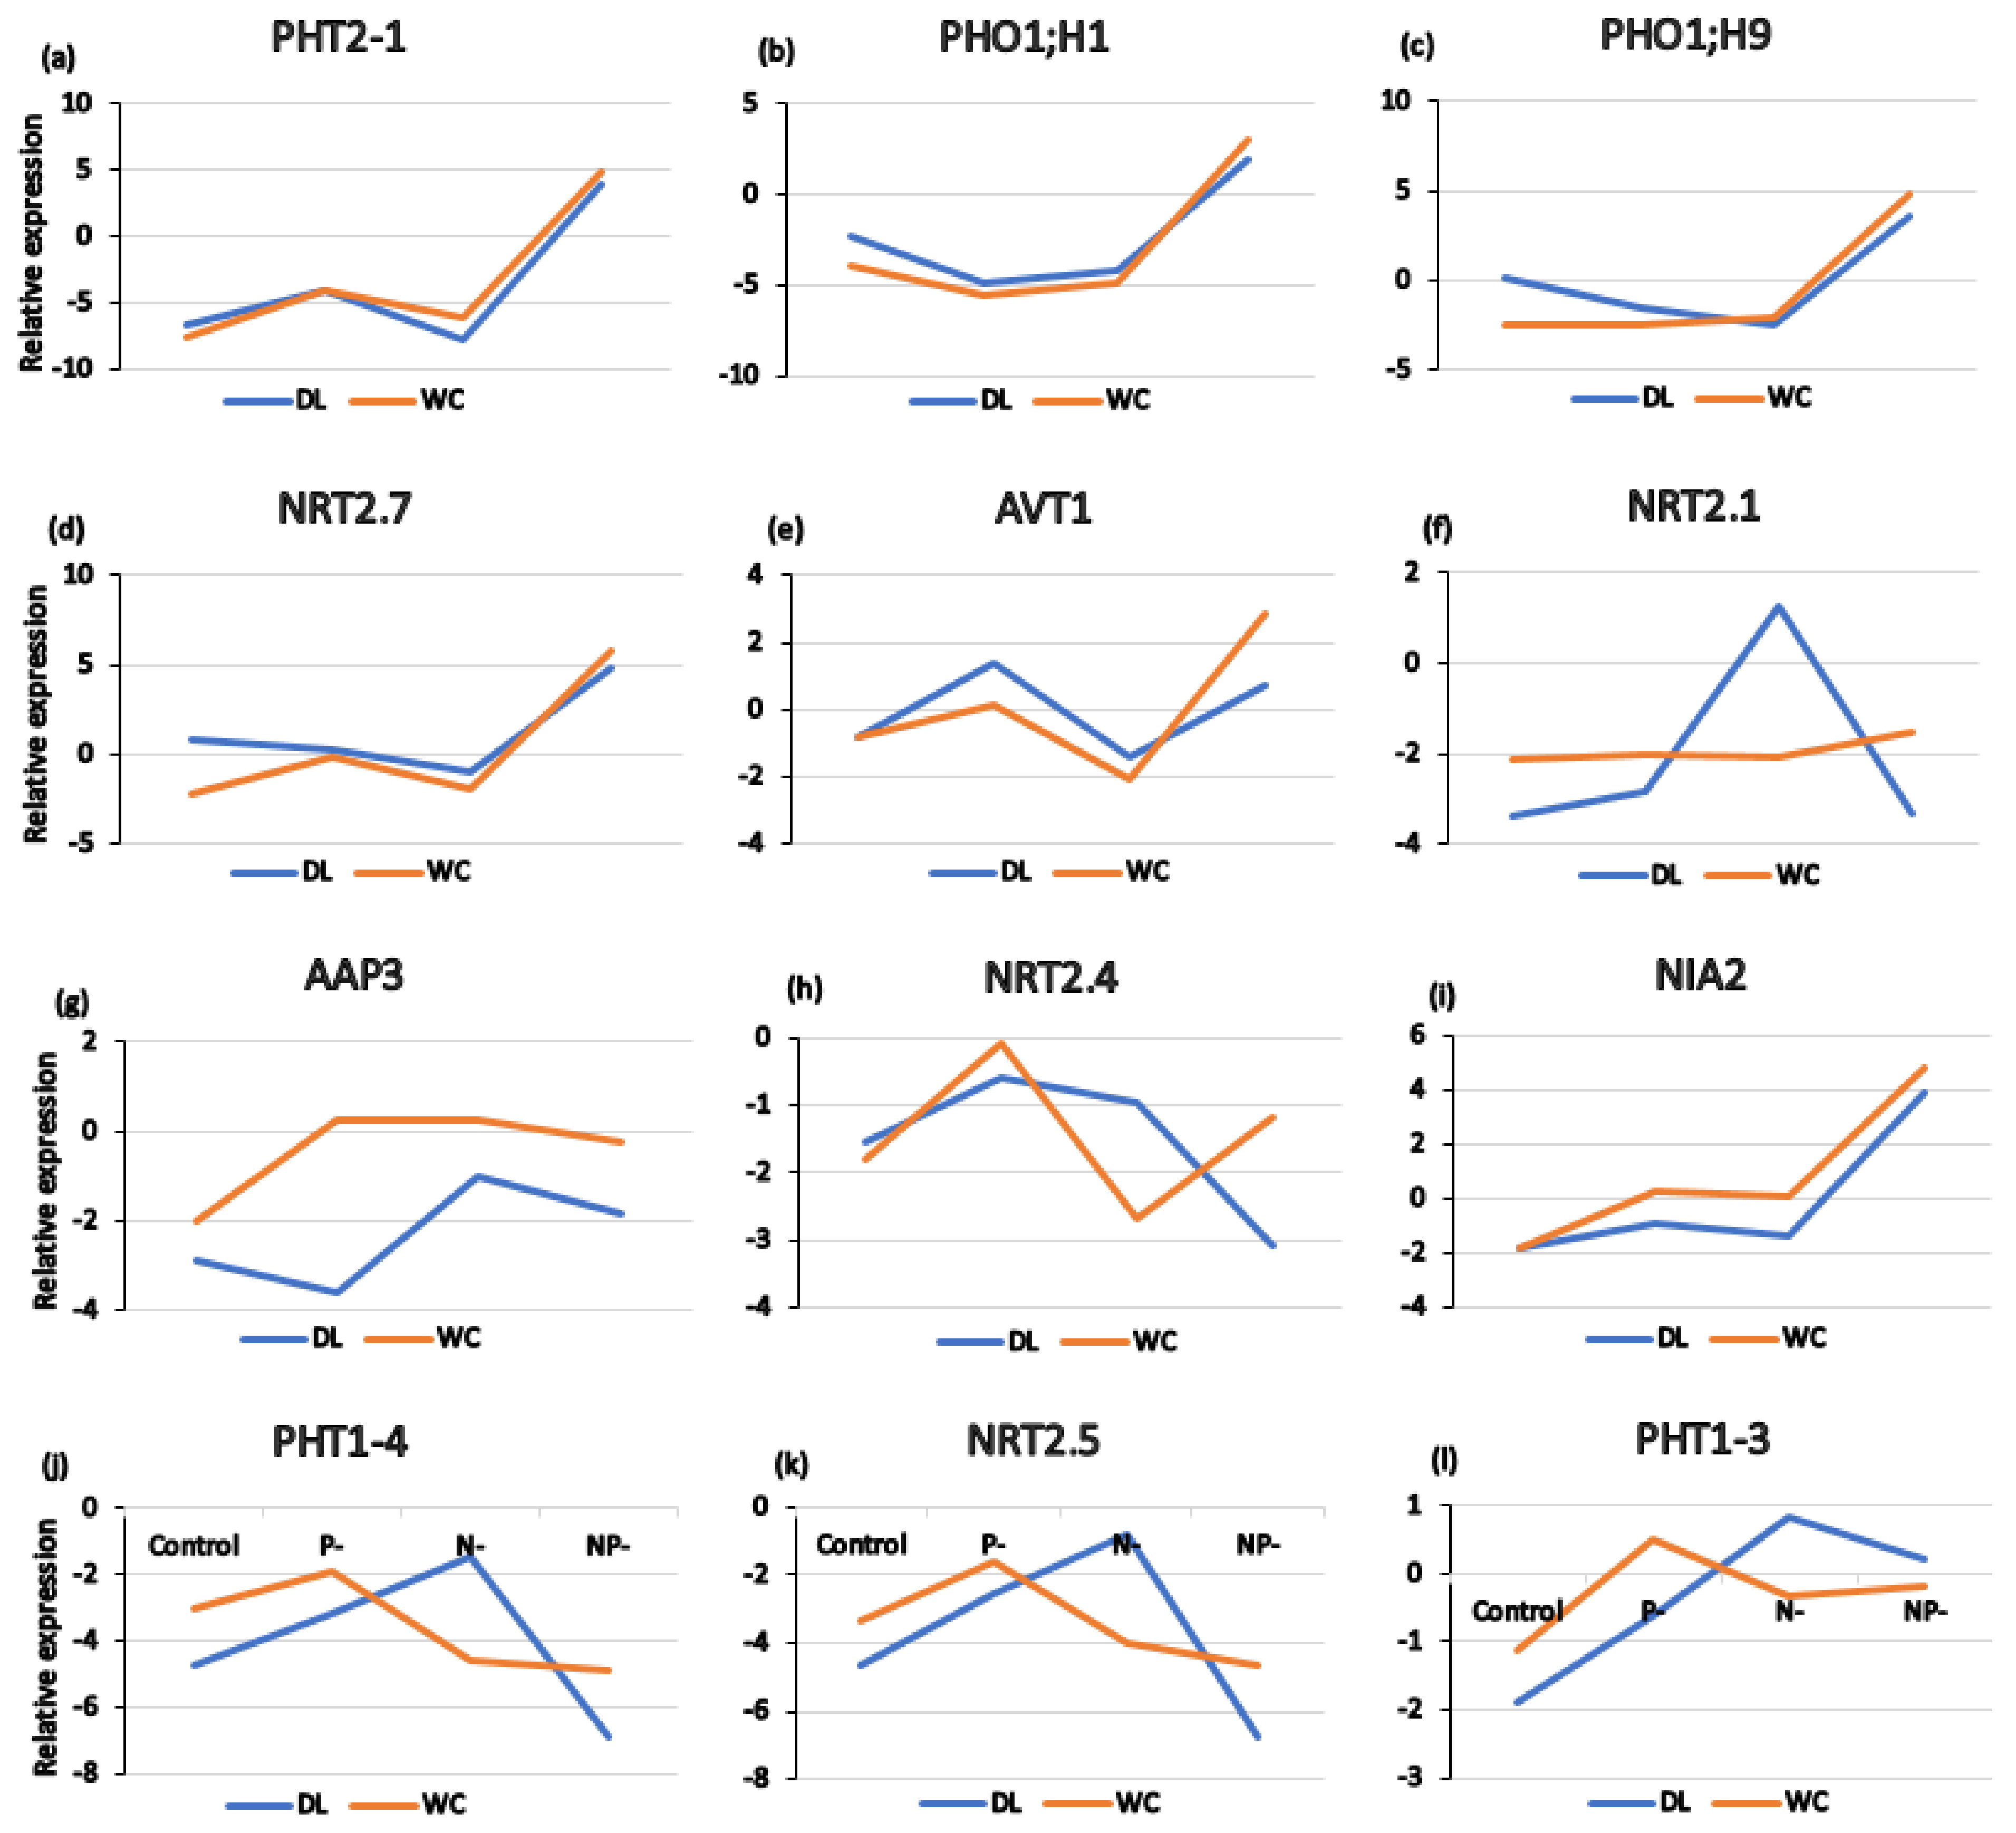
3.7. Changes in Transcript Levels of Key Genes Involved in P/N Assimilation

Nitrate transporters (NRTs) and phosphate transporters (PHTs and PHOs) play a key role in the absorption and transport of N and P. The transcript levels of five phosphate transporters including PHT1-3, PHT1-4, PHT2-1, PHO1;H1 and PHO1;H9, four NRTs including NRT2.1, NRT2.4, NRT2.5, NRT2.7, two amino acid transporters including AVT1, AAP3 and one nitrate reductase [NADH] 2 (NIA2) were determined in leaves and roots (Figure 7 and Figure 8).
The transcript levels of NRT2.1, NRT2.5, PHT1-3, PHT1-4 and AAP3 were greater in roots of WC than DL under complete nutrition (Figure 8f,g,j–l), indicating a greater absorption capacity of N and P in roots of WC than DL. P starvation indicates a relative increase in N, which increases the transcript levels of N assimilation genes in roots (NRT2.1, NRT2.4, NRT2.5, NRT2.7, AVT1, AAP3 and NIA2) (Figure 8d–k). P- also increases the transcript levels of PHT1-3, PHT1-4 and PHT2-1 (Figure 8a,j,l). However, the mRNA levels of PHO1;H1 and PHO1;H9 decreased under P- (Figure 8b,c).
Response patterns of transporters of N and P to deficiency of N and P in roots differed between DL and WC. Compared with DL, the transcript levels of PHT1-3, PHT1-4 and NRT2.5 were greater in roots of WC under P- but reduced under N-, indicating that WC and DL were relatively strong in response to P- and N-, respectively. Compared with DL, the transcript levels of AAP3, NRT2.1, NRT2.4, NIA2 and AAP3 were greater in roots of WC under P-, indicating that WC was relatively strong in response to P- in roots, but the mRNA levels of NRT2.1 and NRT2.4 were lower than in WC, indicating that DL was relatively strong in response to N- in roots.
Most of NRT and PHT genes of DL and WC had a similar transcript level in leaves under complete nutrition (Figure 7). Compared with complete nutrition in leaves, N- increased the transcript levels of AAP3, PHT2-1, PHO1; H1, PHO1; H9, NRT2.7 and NIA2 (Figure 7a,g–k) and decreased that of NRT2.4 (Figure 7c), while P- increased the transcript levels of NRT2.7 and NIA2 (Figure 7g,h) and reduced those of NRT2.1, NRT2.4, NRT2.5, PHT1-3, PHT1-4, PHT2-1 and AAP3 (Figure 7c–f,j–l), indicating that transporter genes were induced by N- and inhibited by P- in leaves, respectively.
Compared with DL, excluding PHO1;H9 and PHT1-3, the transcript levels of PHT1-4, NRT2.1, NRT2.7, NIA2, AAP3, AVT1 and PHO1;H1 were greater in leaves of WC under P-, indicating that WC was relatively strong in response to P- in leaves. However, compared with DL, the mRNA levels of NRT2.5, PHT1-3, PHT1-4 and PHO1;H9 were reduced in WC, but NRT2.1, NRT2.7, NIA2 and PHO1;H1 were elevated under N-, indicating that WC and DL responded differently to N- in leaves.

4. Discussion

N and P are the first and second largest mineral elements required for plant growth [47]. Deficiency of N or P is often the limiting factor for plant growth [48]. In this research, the effects of N and P deficiency on the growth and physiology of F. mandshurica was studied. Simultaneously, the relationship between growth rate and tolerance to deficiency of N and P was analyzed.

4.1. Effects of N- and P- on the Growth, Physiology and Transcript Levels of N and P Assimilation Genes of F. mandshurica

In this study, the free amino acid and nitrate ion contents in root were significantly reduced by N- and NP-, indicating that N deficiency in sand culture had been transformed into N deficiency in seedlings. The N concentration and N amount of the whole tree was significantly reduced. The leaves of seedlings of F. mandshurica turned smaller and yellow under N- (Supplementary Figures S4 and S5), which resulted from the decrease in chlorophyll content and caused the reduction in dry weight and leaf area of the whole tree. In maize, the chlorophyll content was significantly decreased by low-N stress [36]. However, in leaves, N- and NP- increased the nitrate ion content but decreased the free amino acid content, indicating that the conversion of nitrate ions to amino acids was inhibited, which was consistent with the decrease in activity of N assimilation enzymes (NR, GS and GOGAT). In poplar, N acquisition and assimilation was reduced by limiting the N supply [49]. Studies have shown that an increase in the activity of N-metabolizing enzymes is induced by short-term N deficiency but inhibited by long-term N deficiency [50].
To enhance the adaptation to N deficiency, externally, plants increase the absorption of N by increasing the distribution of underground biomass; internally, plants increase NUE by transporting N from senescent to vigorous growth parts [51,52]. Many members of the nitrate transporter family have been identified as N deficiency responsive genes, such as AtNRT2.1 [6], CmNRT2.1 [53], AtNRT2.4 [7], OsNRT2.4 [13] and NRT2.5 [12], which play an important role in the absorption and transport of N. In this study, three genes (AAP3, NRT2.7, NIA2) in leaves and three genes (NRT2.1, AAP3, NIA2) in roots showed induced transcript levels by N- in the two provenances.
Seedlings of F. mandshurica were more affected by P- than N-. The sizes of the leaves became smaller under P- (Supplementary Figure S4), and the chlorophyll content was reduced by P-, which resulted in a significant decrease in dry weight. The decrease in plant growth rate and resistance caused by P deficiency was attributed to the decrease in content of P-containing compounds [54]. The P concentration and P amount of DL and WC under P- were reduced to 58.9% and 37.2% and to 15.1% and 25.8% compared with the values under complete nutrition.
P is often adsorbed by the cations of iron, aluminum and calcium salts in the soil, and thus, its direct use by plants is difficult [55]. Plants can increase the availability of P by secreting organic acids and phosphatase to decompose organic P into inorganic P and increase the solubility of inorganic P, respectively [56]. P starvation increases the activities of AP [29] and PEPC enzymes in Chinese fir [57]. In the present study, the activities of PEPC and AP enzymes were significantly increased by P-.
To enhance the adaptation to P deficiency, externally, plants increase the absorption of P by increasing the distribution of underground biomass, and internally, plants increase PUE by transporting P from senescent to vigorous growth parts [51,52]. P starvation increases the PUE in Chinese fir [57]. PUE of DL and WC under P- is 1.69 and 2.69 times that of complete nutrition. Phosphate transporters play an important role in the absorption and transport of P. The transcript levels of PHT1.4 and PHO1 genes in Chinese fir are increased by P starvation. In Arabidopsis, P deficiency increases the expression of PHO1;H1 [24,58] and PHT2;1 [26]. AtPht1;1 and AtPht1;4 play significant roles in Pi acquisition at both low- and high-Pi environments [22]. In the present study, P- increased the transcript levels of PHT1-3, PHT1-4 and PHT2-1 in roots and leaves. However, the mRNA levels of PHO1;H1 and PHO1;H9 decreased under P- in roots.
The coupled relationships between P and N are tightly linked under nutrient-limited conditions [59]. Plant growth depends not only on the absolute amount of N and P supply but also on the balance of N and P [60]. For example, certain forests are subjected to P deficiency driven by N deposition in Southwest Sweden [61]. N deposition could result in greater P deficiency in legume plantations compared with non-legume plantations [62]. In the present study, the transcript levels of N and P assimilation genes were not only regulated by the absolute amount of N and P supply but also the relative amount. P starvation indicates a relative increase in N, which increases the transcript levels of N assimilation genes in roots (NRT2.1, NRT2.4, NRT2.5, NRT2.7, AVT1, AAP3 and NIA2) and leaves (NRT2.7 and NIA2) but decreases the other genes in leaves (NRT2.1, NRT2.4, NRT2.5 and AAP3).
C sequestration is the essence of plant growth. N induces new net primary production and C sequestration in global forests [63]. Therefore, the effect of deficiency of N and P on growth can be studied by measuring C sequestration. Deficiencies of N and P result in the accumulation of carbohydrate in leaves [64,65]. The content of leaf-soluble sugar is decreased by N but increased by P addition in oilseed flax, respectively [33]. In this study, N-, P- and NP- reduced the C amount but increased the soluble sugar content in roots, indicating that nutrition starvation increased the translocation of C to roots.

4.2. Relationship between the Growth Rate and Tolerance to N- and P- for F. mandshurica

In larch, a rapidly growing genotype is less tolerant to unbalanced nutritional conditions than a slow-growing genotype [66]. However, our research results showed that the tolerance of WC to nutrient deficiency was greater than DL, which resulted in a greater growth rate of WC than DL. The C amount was greater in WC with fast growth than DL with slow growth under P- and NP-, although the C concentration was significantly more reduced in WC than DL, which was mainly due to the greater dry weight of WC compared with DL. P- and NP- reduced the DRS of DL and increased the DRS of WC, indicating that a larger proportion of biomass was translocated below-ground by WC to obtain sufficient phosphorus. The availability of P for WC was greater than that of DL, as PEPC enzyme activity of WC was significantly greater than that of DL under P-. The high P- tolerance of WC was also related to the greater transcript levels of N and P transporters [16]. The transcript levels of PHT1-3 and PHT1-4 in roots and PHT1-4, NRT2.1, NRT2.7, NIA2, AAP3, AVT1 and PHO1;H1 were greater in leaves of WC than DL under P-, which strengthened WC compared with DL in N and P absorption and transport capacity.
Not only phosphorus but also nitrogen metabolism was affected by P deficiency. In poplar, the NUE, activities of NR and GOGAT enzymes and responsiveness of the key genes encoding N transporters is greater in the fast-growing genotype than the slow-growing genotype under P starvation [16]. Nitrate ion and amino acid contents in leaf and root and N concentration are significantly greater in DL on a per-plant basis under P- than WC. However, due to the greater dry weight, the N amount was significantly greater in WC than DL, which was consistent with the greater NUE and assimilation enzymes (NR, GS, GOGAT) in leaves and roots of WC seedlings than DL under P-. Moreover, the transcript levels of N transport and assimilation genes (NRT2.1, NRT2.4, NRT2.5, NIA2 and AAP3) were greater in roots of WC than DL under P-.
Compared with the control, WC performed better than DL under P-. Compared with complete nutrition, P- decreased the dry weight, C amount, P amount, leaf area, chlorophyll content and GOGAT enzyme activity, but the reduction in WC traits was smaller than DL. P- significantly increased the soluble sugar content, PUE and NUE, but the increase in WC was greater than in DL.
Compared with DL, the tolerance to N- was greater in WC, which was attributed to its greater NUE. The C amount was elevated in WC compared with DL under N-, although this difference was not significant, mainly due to the greater dry weight of WC compared with DL. Chlorophyll was the main factor in photosynthesis, and its content determined the growth rate. Compared with DL, the chlorophyll content was greater in WC. NUE was mainly related to the activities of N metabolizing enzymes and N transporters. The activities of N assimilation enzymes (NR, GS, GOGAT) were significantly greater in WC than DL under N-. However, the transcript levels of the N transporters could not fully support the greater tolerance of WC than DL to N-. Compared with DL, the transcript levels of NRT2.1, NRT2.7 and NIA2 were greater in leaves of WC, but NRT2.1, NRT2.4 and NRT2.5 levels were reduced in roots of WC under N-. Therefore, whether tolerance to nitrogen deficiency was greater in WC than DL requires further confirmation considering the transcript levels of N transporters. Moreover, the reduction in chlorophyll content and C amount caused by N- was greater in WC than in DL.

5. Conclusions

In summary, the growth rates of WC with fast growth and DL with slow growth under complete nutrition conditions was insignificantly different; under N and P deficiency, especially P deficiency, the dry weight, C amount, N amount and P amount were greater in WC than DL, which was related to the greater leaf area, chlorophyll content, DRS, NRS, PRS, NUE, PUE, N assimilation enzyme activity (NR, GS GOGAT), P absorption enzyme activity (PEPC and APs) and transcript levels of N and P transporter genes in WC compared with DL. Therefore, the growth rate of genetic types with high tolerance to N- and P- was greater than that with low tolerance.

Supplementary Materials

The following are available online at https://www.mdpi.com/article/10.3390/f12121760/s1, Figure S1: Soluble protein content in foliar (a) and roots (b) for Dailing (DL) and Wuchang (WC) provenances of F. mandshurica under complete nutrients and starvation of N, P or both elements. Bars indicate means ± SE (n = 13). Different letters on the bars indicate significant differences. P-values obtained from the ANOVAs for Provenances (G), nitrogen (N), Phosphorus (P) and their interactions (N × P, N × G, P × G, N × P × G). * p < 0.05; ** p < 0.01; *** p < 0.001; no * means insignificant, Figure S2: The concentration of carbon, nitrogen and phosphorus for root, shoot, foliar and whole tree of seedlings for Dailing (DL) and Wuchang (WC) provenances of F. mandshurica under complete nutrients and starvation of N, P or both elements. Bars indicate means ± SE (n = 13). Different letters on the bars indicate significant differences, Figure S3: Dry weight and amount of carbon, nitrogen and phosphorus for root, shoot, foliar and whole tree of seedlings for Dailing (DL) and Wuchang (WC) provenances of F. mandshurica under complete nutrients and starvation of N, P or both elements. Bars indicate means ± SE (n = 13). Different letters on the bars indicate significant differences. P-values obtained from the ANOVAs for Provenances (G), nitrogen (N), Phosphorus (P) and their interactions (N × P, N × G, P × G, N × P × G). * p < 0.05; ** p < 0.01; *** p < 0.001; no * means insignificant, Figure S4: Variation in leaf size and color of seedlings for Dailing (DL) and Wuchang (WC) provenances of F. mandshurica under complete nutrients and starvation of N or P, Figure S5: Variation in height of seedlings for Dailing (DL) and Wuchang (WC) provenances of F. mandshurica under complete nutrients and starvation of N or P, Figure S6: Seedlings for Dailing(DL) and Wuchang(WC) provenances of F. mandshurica under complete nutrients and starvation of N, P or both elements, Table S1: Primers used for qRT-PCR.

Author Contributions

X.Z. (Xingtang Zhao) selected samples, measured data, analyzed data and wrote the paper; Y.Z. conducted the overall design and approved the paper; F.Z. carried out the design and collected seeds; X.Z. (Xu Zhang), Z.L., Y.L., T.S., J.C., T.C. and J.L. participated in data determination. All authors have read and agreed to the published version of the manuscript.

Funding

This research was jointly supported the Fundamental Research Funds for the Central Universities of China (No. 2572017AA15) and Heilongjiang Province Applied Technology Research and Development Program Key Project (GA19B201).

Conflicts of Interest

The authors declare no conflict of interest.

References

  1. Fleischer, K.; Rammig, A.; De Kauwe, M.G.; Walker, A.P.; Domingues, T.F.; Fuchslueger, L.; Garcia, S.; Goll, D.S.; Grandis, A.; Jiang, M.; et al. Amazon forest response to CO2 fertilization dependent on plant phosphorus acquisition. Nat. Geosci. 2019, 12, 736–741. [Google Scholar] [CrossRef]
  2. He, M.; Dijkstra, F.A. Phosphorus addition enhances loss of nitrogen in a phosphorus-poor soil. Soil Biol. Biochem. 2015, 82, 99–106. [Google Scholar] [CrossRef]
  3. Schachtman, D.P.; Reid, R.J.; Ayling, S.M. Phosphorus uptake by plants: From soil to cell. Plant Physiol. 1998, 116, 447–453. [Google Scholar] [CrossRef] [PubMed] [Green Version]
  4. Li, H.; Li, M.; Luo, J.; Cao, X.; Qu, L.; Gai, Y.; Jiang, X.; Liu, T.; Bai, H.; Janz, D.; et al. N fertilization has different effects on the growth, carbon and nitrogen physiology, and wood properties of slow- and fast-growing Populus species. J. Exp. Bot. 2012, 63, 6173–6185. [Google Scholar] [CrossRef]
  5. Okamoto, M.; Vidmar, J.J.; Glass, A.D.M. Regulation of NRT1 and NRT2 gene families of Arabidopsis thaliana responses to nitrate provision. Plant Cell Physiol. 2003, 44, 304–317. [Google Scholar] [CrossRef]
  6. Li, W.; Wang, Y.; Okamoto, M.; Crawford, N.M.; Siddiqi, M.Y.; Glass, A.D. Dissection of the AtNRT2.1:AtNRT2.2 inducible high-affinity nitrate transporter gene cluster. Plant Physiol. 2007, 143, 425–433. [Google Scholar] [CrossRef] [Green Version]
  7. Kiba, T.; Feria-Bourrellier, A.B.; Lafouge, F.; Lezhneva, L.; Boutet-Mercey, S.; Orsel, M.; Brehaut, V.; Miller, A.; Daniel-Vedele, F.; Sakakibara, H.; et al. The Arabidopsis nitrate transporter NRT2.4 plays a double role in roots and shoots of nitrogen-starved plants. Plant Cell 2012, 24, 245–258. [Google Scholar] [CrossRef] [Green Version]
  8. Wang, R.; Okamoto, M.; Xing, X.; Crawford, N.M. Microarray analysis of the nitrate response in Arabidopsis roots and shoots reveals over 1000 rapidly responding genes and new linkages to glucose, trehalose-6-phosphate, iron, and sulfate metabolism. Plant Physiol. 2003, 132, 556–567. [Google Scholar] [CrossRef] [Green Version]
  9. David, L.C.; Dechorgnat, J.; Berquin, P.; Routaboul, J.M.; Debeaujon, I.; Daniel-Vedele, F.; Ferrario-Méry, S. Proanthocyanidin oxidation of Arabidopsis seeds is altered in mutant of the high-affinity nitrate transporter NRT2.7. J. Exp. Bot. 2014, 65, 885–893. [Google Scholar] [CrossRef] [Green Version]
  10. Chopin, F.; Orsel, M.; Dorbe, M.F.; Chardon, F.; Truong, H.N.; Miller, A.J.; Krapp, A.; Daniel-Vedele, F. The Arabidopsis ATNRT2.7 nitrate transporter controls nitrate content in seeds. Plant Cell 2007, 19, 1590–1602. [Google Scholar] [CrossRef] [Green Version]
  11. Kotur, Z.; Glass, A.D. A 150 kDa plasma membrane complex of AtNRT2.5 and AtNAR2.1 is the major contributor to constitutive high-affinity nitrate influx in Arabidopsis thaliana. Plant Cell Environ. 2015, 38, 1490–1502. [Google Scholar] [CrossRef]
  12. Lezhneva, L.; Kiba, T.; Feria-Bourrellier, A.B.; Lafouge, F.; Boutet-Mercey, S.; Zoufan, P.; Sakakibara, H.; Daniel-Vedele, F.; Krapp, A. The Arabidopsis nitrate transporter NRT2.5 plays a role in nitrate acquisition and remobilization in nitrogen-starved plants. Plant J. Cell Mol. Biol. 2014, 80, 230–241. [Google Scholar] [CrossRef]
  13. Wei, J.; Zheng, Y.; Feng, H.; Qu, H.; Fan, X.; Yamaji, N.; Ma, J.F.; Xu, G. OsNRT2.4 encodes a dual-affinity nitrate transporter and functions in nitrate-regulated root growth and nitrate distribution in rice. J. Exp. Bot. 2018, 69, 1095–1107. [Google Scholar] [CrossRef]
  14. Fine, K.E.; Smith, M.W.; Cole, J.C. Partitioning of nitrogen, phosphorus, and potassium in redbud trees. Sci. Hortic. 2013, 152, 1–8. [Google Scholar] [CrossRef]
  15. Fam, R.R.S.; Hiong, K.C.; Choo, C.Y.L.; Wong, W.P.; Chew, S.F.; Ip, Y.K. Molecular characterization of a novel algal glutamine synthetase (GS) and an algal glutamate synthase (GOGAT) from the colorful outer mantle of the giant clam, Tridacna squamosa, and the putative GS-GOGAT cycle in its symbiotic zooxanthellae. Gene 2018, 656, 40–52. [Google Scholar] [CrossRef]
  16. Gan, H.; Jiao, Y.; Jia, J.; Wang, X.; Li, H.; Shi, W.; Peng, C.; Polle, A.; Luo, Z.B. Phosphorus and nitrogen physiology of two contrasting poplar genotypes when exposed to phosphorus and/or nitrogen starvation. Tree Physiol. 2016, 36, 22–38. [Google Scholar] [CrossRef] [Green Version]
  17. Okumoto, S.; Koch, W.; Tegeder, M.; Fischer, W.N.; Biehl, A.; Leister, D.; Stierhof, Y.D.; Frommer, W.B. Root phloem-specific expression of the plasma membrane amino acid proton co-transporter AAP3. J. Exp. Bot. 2004, 55, 2155–2168. [Google Scholar] [CrossRef] [Green Version]
  18. Lu, K.; Wu, B.; Wang, J.; Zhu, W.; Nie, H.; Qian, J.; Huang, W.; Fang, Z. Blocking amino acid transporter OsAAP3 improves grain yield by promoting outgrowth buds and increasing tiller number in rice. Plant Biotechnol. J. 2018, 16, 1710–1722. [Google Scholar] [CrossRef] [Green Version]
  19. Fäth, J.; Kohlpaintner, M.; Blum, U.; Göttlein, A.; Mellert, K.H. Assessing phosphorus nutrition of the main European tree species by simple soil extraction methods. For. Ecol. Manag. 2019, 432, 895–901. [Google Scholar] [CrossRef]
  20. Brown, K.R.; Courtin, P.J. Can phosphorus additions increase long-term growth and survival of red alder (Alnus rubra Bong.) on periodically dry sites? For. Ecol. Manag. 2018, 430, 545–557. [Google Scholar] [CrossRef]
  21. Huang, C.Y.; Shirley, N.; Genc, Y.; Shi, B.; Langridge, P. Phosphate utilization efficiency correlates with expression of low-affinity phosphate transporters and noncoding RNA, IPS1, in barley. Plant Physiol. 2011, 156, 1217–1229. [Google Scholar] [CrossRef] [Green Version]
  22. Shin, H.; Shin, H.S.; Dewbre, G.R.; Harrison, M.J. Phosphate transport in Arabidopsis: Pht1;1 and Pht1;4 play a major role in phosphate acquisition from both low- and high-phosphate environments. Plant J. Cell Mol. Biol. 2004, 39, 629–642. [Google Scholar] [CrossRef]
  23. Kamalanathan, M.; Pierangelini, M.; Shearman, L.A.; Gleadow, R.; Beardall, J. Impacts of nitrogen and phosphorus starvation on the physiology of Chlamydomonas reinhardtii. J. Appl. Phycol. 2015, 28, 1509–1520. [Google Scholar] [CrossRef]
  24. Wang, Y.; Ribot, C.; Rezzonico, E.; Poirier, Y. Structure and expression profile of the Arabidopsis PHO1 gene family indicates a broad role in inorganic phosphate homeostasis. Plant Physiol. 2004, 135, 400–411. [Google Scholar] [CrossRef] [Green Version]
  25. Karthikeyan, A.S.; Varadarajan, D.K.; Mukatira, U.T.; D’Urzo, M.P.; Damsz, B.; Raghothama, K.G. Regulated expression of Arabidopsis phosphate transporters. Plant Physiol. 2002, 130, 221–233. [Google Scholar] [CrossRef] [Green Version]
  26. Versaw, W.K.; Harrison, M.J. A chloroplast phosphate transporter, PHT2;1, influences allocation of phosphate within the plant and phosphate-starvation responses. Plant Cell 2002, 14, 1751–1766. [Google Scholar] [CrossRef] [Green Version]
  27. Tang, H.; Chen, X.; Gao, Y.; Hong, L.; Chen, Y. Alteration in root morphological and physiological traits of two maize cultivars in response to phosphorus deficiency. Rhizosphere 2020, 14, 100201. [Google Scholar] [CrossRef]
  28. Fang, X.-M.; Zhang, X.-L.; Chen, F.-S.; Zong, Y.-Y.; Bu, W.-S.; Wan, S.-Z.; Luo, Y.; Wang, H. Phosphorus addition alters the response of soil organic carbon decomposition to nitrogen deposition in a subtropical forest. Soil Biol. Biochem. 2019, 133, 119–128. [Google Scholar] [CrossRef]
  29. Duff, S.M.G.; Sarath, G.; Plaxton, W.C. The role of acid phosphatases in plant phosphorus metabolism. Physiol. Plant. 1994, 90, 791–800. [Google Scholar] [CrossRef]
  30. Penaloza, E.; Munoz, G.; Salvo-Garrido, H.; Silva, H.; Corcuera, L.J. Phosphate deficiency regulates phosphoenolpyruvate carboxylase expression in proteoid root clusters of white lupin. J. Exp. Bot. 2005, 56, 145–153. [Google Scholar] [CrossRef] [Green Version]
  31. Xia, G.; Cheng, L. Foliar Urea Application in the Fall Affects Both Nitrogen and Carbon Storage in Young ‘Concord’ Grapevines Grown under a Wide Range of Nitrogen Supply. J. Am. Soc. Hortic. Sci. 2004, 129, 653–659. [Google Scholar] [CrossRef] [Green Version]
  32. Cheng, L.; Fuchigami, L.H. Growth of young apple trees in relation to reserve nitrogen and carbohydrates. Tree Physiol. 2002, 22, 1297–1303. [Google Scholar] [CrossRef] [PubMed] [Green Version]
  33. Yan, B.; Wu, B.; Gao, Y.; Wu, J.; Niu, J.; Xie, Y.; Cui, Z.; Zhang, Z. Effects of nitrogen and phosphorus on the regulation of nonstructural carbohydrate accumulation, translocation and the yield formation of oilseed flax. Field Crop. Res. 2018, 219, 229–241. [Google Scholar] [CrossRef]
  34. Sanchez-Calderon, L.; Lopez-Bucio, J.; Chacon-Lopez, A.; Gutierrez-Ortega, A.; Hernandez-Abreu, E.; Herrera-Estrella, L. Characterization of low phosphorus insensitive mutants reveals a crosstalk between low phosphorus-induced determinate root development and the activation of genes involved in the adaptation of Arabidopsis to phosphorus deficiency. Plant Physiol. 2006, 140, 879–889. [Google Scholar] [CrossRef] [Green Version]
  35. Jia, S.; Wang, Z.; Li, X.; Sun, Y.; Zhang, X.; Liang, A. N fertilization affects on soil respiration, microbial biomass and root respiration in Larix gmelinii and Fraxinus mandshurica plantations in China. Plant Soil 2010, 333, 325–336. [Google Scholar] [CrossRef]
  36. Xin, J.S.; Zheng, L.; Huang, Y.R.; Pan, Y.D.; Lu, G.J. NYT 2419-2013 Determination of Total Nitrogen in Plant, Automatic Kjeldahl Apparatus Method; Ministry of Agriculture of the People’s Republic of China: Beijing, China, 2014.
  37. Bao, S.D. (Ed.) Soil Agrochemical Analysis: Determination of Phosphorus in Plants; China Agriculture Press: Beijing, China, 1999; pp. 268–270. [Google Scholar]
  38. Yang, J.H. (Ed.) Soil Agrochemical Analysis and Environmental Monitoring; China Land Press: Beijing, China, 2008. [Google Scholar]
  39. Wu, Y.-W.; Li, Q.; Jin, R.; Chen, W.; Liu, X.-L.; Kong, F.-L.; Ke, Y.-P.; Shi, H.-C.; Yuan, J.-C. Effect of low-nitrogen stress on photosynthesis and chlorophyll fluorescence characteristics of maize cultivars with different low-nitrogen tolerances. J. Integr. Agric. 2019, 18, 1246–1256. [Google Scholar] [CrossRef]
  40. Hao, Y.-Q.; Lu, G.-Q.; Wang, L.-H.; Wang, C.-L.; Guo, H.-M.; Li, Y.-F.; Cheng, H.-M. Overexpression of AmDUF1517 enhanced tolerance to salinity, drought, and cold stress in transgenic cotton. J. Integr. Agric. 2018, 17, 2204–2214. [Google Scholar] [CrossRef]
  41. Cataldo, D.A.; Maroon, M.; Schrader, L.E.; Youngs, V.L. Rapid colorimetric determination of nitrate in plant tissue by nitration of salicylic acid. Commun. Soil Sci. Plant Anal. 2008, 6, 71–80. [Google Scholar] [CrossRef]
  42. Bradrord, M.M. A rapid and sensitive method for the quantitation of microgram quantities of protein utilizing the principle of protein-dye binding. Anal. Biochem. 1976, 72, 248–254. [Google Scholar] [CrossRef]
  43. Rosen, H. A Modified Ninhydrin Calorimetric Analysis for Amino Acids. Arch. Biochem. Biophys. 1957, 67, 10–15. [Google Scholar] [CrossRef]
  44. Turnao, F.J.; Muhitch, M.J. Differential accumulation of ferredoxin- and NADH-dependent glutamate synthase activities, peptides, and transcripts in developing soybean seedlings in response to light, nitrogen, and nodulation. Physiol. Plant. 1999, 107, 407–418. [Google Scholar] [CrossRef]
  45. Brugière, N.; Dubois, F.; Limami, A.M.; Lelandais, M.; Roux, Y.; Sangwan, R.S.; Hirel, B. Glutamine Synthetase in the Phloem Plays a Major Role in Controlling Proline Production. Plant Cell 1999, 11, 1995–2011. [Google Scholar] [CrossRef] [Green Version]
  46. Guiz, C.; Hirel, B.; Shedlofsky, G.; Gadal, P. Occurrence and influence of light on the relative proportions of two glutamine sythetases in rice leaves. Plant Sci. Lett. 1979, 15, 271–277. [Google Scholar] [CrossRef]
  47. Wang, J.; Hui, D.; Lu, H.; Wang, F.; Liu, N.; Sun, Z.; Ren, H. Main and interactive effects of increased precipitation and nitrogen addition on growth, morphology, and nutrition of Cinnamomum burmanni seedlings in a tropical forest. Glob. Ecol. Conserv. 2019, 20, e00734. [Google Scholar] [CrossRef]
  48. Zhao, Q.; Zeng, D.-H. Nitrogen addition effects on tree growth and soil properties mediated by soil phosphorus availability and tree species identity. For. Ecol. Manag. 2019, 449, 117478. [Google Scholar] [CrossRef]
  49. Luo, J.; Li, H.; Liu, T.; Polle, A.; Peng, C.; Luo, Z.B. Nitrogen metabolism of two contrasting poplar species during acclimation to limiting nitrogen availability. J. Exp. Bot. 2013, 64, 4207–4224. [Google Scholar] [CrossRef] [Green Version]
  50. Song, H.; Lei, Y.; Zhang, S. Differences in resistance to nitrogen and phosphorus deficiencies explain male-biased populations of poplar in nutrient-deficient habitats. J. Proteom. 2018, 178, 123–127. [Google Scholar] [CrossRef]
  51. Netzer, F.; Pozzi, L.; Dubbert, D.; Herschbach, C. Improved photosynthesis and growth of poplar during nitrogen fertilization is accompanied by phosphorus depletion that indicates phosphorus remobilization from older stem tissues. Environ. Exp. Bot. 2019, 162, 421–432. [Google Scholar] [CrossRef]
  52. Zheng, L.-L.; Zhao, Q.; Sun, Q.-Y.; Liu, L.; Zeng, D.-H. Nitrogen addition elevated autumn phosphorus retranslocation of living needles but not resorption in a nutrient-poor Pinus sylvestris var. Mongolica plantation. For. Ecol. Manag. 2020, 468, 118174. [Google Scholar] [CrossRef]
  53. Gu, C.; Song, A.; Zhang, X.; Wang, H.; Li, T.; Chen, Y.; Jiang, J.; Chen, F.; Chen, S. Cloning of chrysanthemum high-affinity nitrate transporter family (CmNRT2) and characterization of CmNRT2.1. Sci. Rep. 2016, 6, 23462. [Google Scholar] [CrossRef] [Green Version]
  54. Talkner, U.; Meiwes, K.J.; Potočić, N.; Seletković, I.; Cools, N.; De Vos, B.; Rautio, P. Phosphorus nutrition of beech (Fagus sylvatica L.) is decreasing in Europe. Ann. For. Sci. 2015, 72, 919–928. [Google Scholar] [CrossRef]
  55. Clarkson, D.T.; Hanson, J.B. The Mineral Nutrition of Higher Plants. Ann. Rev. Plant Physol. 1980, 31, 239–298. [Google Scholar] [CrossRef]
  56. Gerke, J. The acquisition of phosphate by higher plants: Effect of carboxylate release by the roots. A critical review. J. Plant Nutr. Soil Sci. 2015, 178, 351–364. [Google Scholar] [CrossRef]
  57. Chen, Y.; Nguyen, T.H.N.; Qin, J.; Jiao, Y.; Li, Z.; Ding, S.; Lu, Y.; Liu, Q.; Luo, Z.-B. Phosphorus assimilation of Chinese fir from two provenances during acclimation to changing phosphorus availability. Environ. Exp. Bot. 2018, 153, 21–34. [Google Scholar] [CrossRef]
  58. Stefanovic, A.; Ribot, C.; Rouached, H.; Wang, Y.; Chong, J.; Belbahri, L.; Delessert, S.; Poirier, Y. Members of the PHO1 gene family show limited functional redundancy in phosphate transfer to the shoot, and are regulated by phosphate deficiency via distinct pathways. Plant J. Cell Mol. Biol. 2007, 50, 982–994. [Google Scholar] [CrossRef]
  59. You, C.; Wu, F.; Yang, W.; Xu, Z.; Tan, B.; Zhang, L.; Yue, K.; Ni, X.; Li, H.; Chang, C.; et al. Does foliar nutrient resorption regulate the coupled relationship between nitrogen and phosphorus in plant leaves in response to nitrogen deposition? Sci. Total Environ. 2018, 645, 733–742. [Google Scholar] [CrossRef]
  60. Li, J.; Guo, Q.; Zhang, J.; Korpelainen, H.; Li, C. Effects of nitrogen and phosphorus supply on growth and physiological traits of two Larix species. Environ. Exp. Bot. 2016, 130, 206–215. [Google Scholar] [CrossRef]
  61. Almeida, J.P.; Rosenstock, N.P.; Forsmark, B.; Bergh, J.; Wallander, H. Ectomycorrhizal community composition and function in a spruce forest transitioning between nitrogen and phosphorus limitation. Fungal Ecol. 2019, 40, 20–31. [Google Scholar] [CrossRef]
  62. Chen, H.; Chen, M.; Li, D.; Mao, Q.; Zhang, W.; Mo, J. Responses of soil phosphorus availability to nitrogen addition in a legume and a non-legume plantation. Geoderma 2018, 322, 12–18. [Google Scholar] [CrossRef]
  63. Du, E.; de Vries, W. Nitrogen-induced new net primary production and carbon sequestration in global forests. Environ. Pollut. 2018, 242 Pt B, 1476–1487. [Google Scholar] [CrossRef]
  64. Linkohr, B.I.; Williamson, L.C.; Fitter, A.H.; Leyser, H.M. Nitrate and phosphate availability and distribution have different effects on root system architecture of Arabidopsis. Plant J. Cell Mol. Biol. 2002, 29, 751–760. [Google Scholar] [CrossRef] [PubMed] [Green Version]
  65. Vance, C.P.; Stone, C.U.; Allan, D.L. Phosphorus acquisition and use critical adaptations by plants for securing a nonrenewable resource. New Phytol. 2003, 157, 423–447. [Google Scholar] [CrossRef] [PubMed] [Green Version]
  66. Li, J.; Wu, G.; Guo, Q.; Korpelainen, H.; Li, C. Fast-growing Larix kaempferi suffers under nutrient imbalance caused by phosphorus fertilization in larch plantation soil. For. Ecol. Manag. 2018, 417, 49–62. [Google Scholar] [CrossRef] [Green Version]
Figure 1. Dry weight (a) and leaf area (c) in whole trees, chlorophyll content (d) in leaves and ratio of root to shoot in dry weight (DRS (b)) for Dailing (DL) and Wuchang (WC) provenances of F. mandshurica under complete nutrients (control) and starvation of N (N-), P (P-) or both elements (NP-). Bars indicate means ± SE (n = 13). Different letters on the bars indicate significant differences. p-values obtained from the ANOVAs for provenances (G), nitrogen (N), phosphorus (P) and their interactions (N × P, N × G, P × G, N × P × G). * p < 0.05; ** p < 0.01; *** p < 0.001; no * means insignificant.
Forests 12 01760 g001
Figure 2. NO3 content and total free amino acids content in leaves (a,c) and roots (b,d), nitrogen concentration (e) and N amount (f) in whole trees, NUE (g) and ratio of root to shoot in N amount (NRS (h)) for Dailing (DL) and Wuchang (WC) provenances of F. mandshurica under complete nutrients (control) and starvation of N (N-), P (P-) or both elements (NP-). Bars indicate means ± SE (n = 13). Different letters on the bars indicate significant differences. p-values obtained from the ANOVAs for provenances (G), nitrogen (N), phosphorus (P) and their interactions (N × P, N × G, P × G, N × P × G). * p < 0.05; ** p < 0.01; *** p < 0.001; no * means insignificant.
Forests 12 01760 g002
Figure 3. Activities of GS, GOGAT and NR in leaves (a,c,e) and roots (b,d,f) for Dailing (DL) and Wuchang (WC) provenances of F. mandshurica under complete nutrients (control) and starvation of N (N-), P (P-) or both elements (NP-). Bars indicate means ± SE (n = 13). Different letters on the bars indicate significant differences. p-values obtained from the ANOVAs for provenances (G), nitrogen (N), phosphorus (P) and their interactions (N × P, N × G, P × G, N × P × G). * p < 0.05; ** p < 0.01; *** p < 0.001; no * means insignificant.
Forests 12 01760 g003
Figure 4. Phosphorus concentration (a) and P amount (b) in whole trees, PUE (c) and ratio of root to shoot in P amount (PRS (d)) for Dailing (DL) and Wuchang (WC) provenances of F. mandshurica under complete nutrients (control) and starvation of N (N-), P (P-) or both elements (NP-). Bars indicate means ± SE (n = 13). Different letters on the bars indicate significant differences. p-values obtained from the ANOVAs for provenances (G), nitrogen (N), phosphorus (P) and their interactions (N × P, N × G, P × G, N × P × G). * p < 0.05; ** p < 0.01; *** p < 0.001; no * means insignificant.
Forests 12 01760 g004
Figure 5. Activities of PEPC (a) in leaves and activities of APs (b) in roots for Dailing (DL) and Wuchang (WC) provenances of F. mandshurica under complete nutrients (control) and starvation of N (N-), P (P-) or both elements (NP-). Bars indicate means ± SE (n = 13). Different letters on the bars indicate significant differences. p-values obtained from the ANOVAs for provenances (G), nitrogen (N), phosphorus (P) and their interactions (N × P, N × G, P × G, N × P × G). * p < 0.05; ** p < 0.01; *** p < 0.001; no * means insignificant.
Forests 12 01760 g005
Figure 6. Soluble sugar content in leaves (a) and roots (b), carbon concentration (c) and C amount (d) in whole trees for Dailing (DL) and Wuchang (WC) provenances of F. mandshurica under complete nutrients (control) and starvation of N (N-), P (P-) or both elements (NP-). Bars indicate means ± SE (n = 13). Different letters on the bars indicate significant differences. p-values obtained from the ANOVAs for provenances (G), nitrogen (N), phosphorus (P) and their interactions (N × P, N × G, P × G, N × P × G). * p < 0.05; ** p < 0.01; *** p < 0.001; no * means insignificant.
Forests 12 01760 g006
Figure 7. The transcriptional fold changes in genes involved in the uptake and assimilation of P and N in leaves for Dailing (DL) and Wuchang (WC) provenances of F. mandshurica under complete nutrients (control) and starvation of N (N-), P (P-) or both elements (NP-). (a) PHO1;H9, phosphate transporter PHO1 homolog 9; (b) AVT1, vacuolar amino acid transporter 1; (c) NRT2.4, high affinity nitrate transporter 2.4; (d) NRT2.5, high affinity nitrate transporter 2.5; (e) PHT1-4, inorganic phosphate transporter 1-4; (f) PHT1-3, inorganic phosphate transporter 1-3; (g) NRT2.7, high affinity nitrate transporter 2.7; (h) NIA2, nitrate reductase [NADH] 2; (i) PHO1;H1, phosphate transporter PHO1 homolog 1; (j) AAP3, amino acid transporter; (k) PHT2-1, inorganic phosphate transporter 2-1; (l), NRT2.1, high affinity nitrate transporter 2.1.
Forests 12 01760 g007
Figure 8. The transcriptional fold changes in genes involved in the uptake and assimilation of P and N in roots for Dailing (DL) and Wuchang (WC) provenances of F. mandshurica under complete nutrients (control) and starvation of N (N-), P (P-) or both elements (NP-). (a) PHT2-1, inorganic phosphate transporter 2-1; (b) PHO1;H1, phosphate transporter PHO1 homolog 1; (c) PHO1;H9, phosphate transporter PHO1 homolog 9; (d) NRT2.7, high affinity nitrate transporter 2.7; (e) AVT1, vacuolar amino acid transporter 1; (f) NRT2.1, high affinity nitrate transporter 2.1; (g) AAP3, amino acid transporter; (h) NRT2.4, high affinity nitrate transporter 2.4; (i) NIA2, nitrate reductase [NADH] 2; (j) PHT1-4, inorganic phosphate transporter 1-4; (k) NRT2.5, high affinity nitrate transporter 2.5; (l) PHT1-3, inorganic phosphate transporter 1-3.
Forests 12 01760 g008
Publisher’s Note: MDPI stays neutral with regard to jurisdictional claims in published maps and institutional affiliations.

