1. Introduction
Black Locust (
Robinia pseudoacacia L.)—once introduced to central Europe on the strength of its remarkable flowering—has established itself as a common tree species. Since the time of its introduction, the prolific Robinia has demonstrated its remarkable ability to spread [
1,
2], though it often remains neglected by silviculture. Current estimates suggest that Black Locust covers 34,000 hectares of German forest cultivation area, with over two thirds of this area situated in the north-east German lowlands [
3]. Black Locust is considered a fast-growing tree species and stands out due to its superior wood characteristics which make it suitable for wide-ranging and high-quality usage. Furthermore, in times of climate change, Robinia is gaining in importance by virtue of its outstanding tolerance to drought and heat [
4] as well as its good adaptability to climate change. Hence, Black Locust is predestined to contribute to the sustainable productivity of forests, even during critical weather situations such as drought and frost. In addition, Robinia plays an important role in the rehabilitation/reclamation of nutrient-poor lignite mining and abandoned land on account of its ability to fix atmospheric nitrogen. Black Locust stands currently cover 4.9% (i.e., 102 hectares) of the total reclamation area managed by the lignite mining company LEAG.
The declared aim of breeding Black Locust genotypes is to provide vital plus trees prior to material utilisation. However, to date, Robinia breeding initiatives have predominantly focused on external characteristics such as the stem form and improving the biomass growth performance. Nonetheless, criteria such as plants’ physiological performance and tolerance to abiotic stressors are becoming increasingly decisive for the successful establishment of forest stands as well as for short rotation coppices in agriculture. Despite this, surprisingly little is known about the physiological performance of the Black Locust clones and the Black Locust provenances available on the market, and the research on cultivating Robinia genotypes which meet both criteria—high biomass growth as well as promising stress tolerance—is still in its infancy [
5]. There is evidence showing significant genetic variation with regard to drought tolerance [
6,
7,
8,
9].
Within the framework of the FastWOOD subprojects 6 and 7, we investigated biomass growth as well as individual physiological performance of different Black Locust origins (i.e., clones and provenances). Our goal was to determine specific reaction patterns of promising origins to abiotic stressors. We used so-called biomarkers as major indicators to identify and classify Robinia clones and provenances with regard to their climate adaptability [
8,
10]. We relied on an experimental blend consisting of plot experiments [
10] as well as field trials [
8] to test selected Black Locust origins. In this context, we applied physiological marker techniques to reveal the individual adaptive capacity of the Robinia clones and provenances to drought, nutrient deficiencies and late frost.
Given that Robinia clones and provenances differ in their physiological performance and stress tolerance, insights into a genotype’s suitability for cultivation in short coppice rotations and on forest land are valuable. The earlier a measurement procedure can deliver reliable results predicting the physiological performance, the faster research into relevant tree breeding can progress. Hence, our hypothesis is that there is a relationship between biophysical parameters and biomass growth which can be used to deliver physiological performance predictions of different Robinia origins at an early stage.
2. Materials and Methods
2.1. Experimental Site
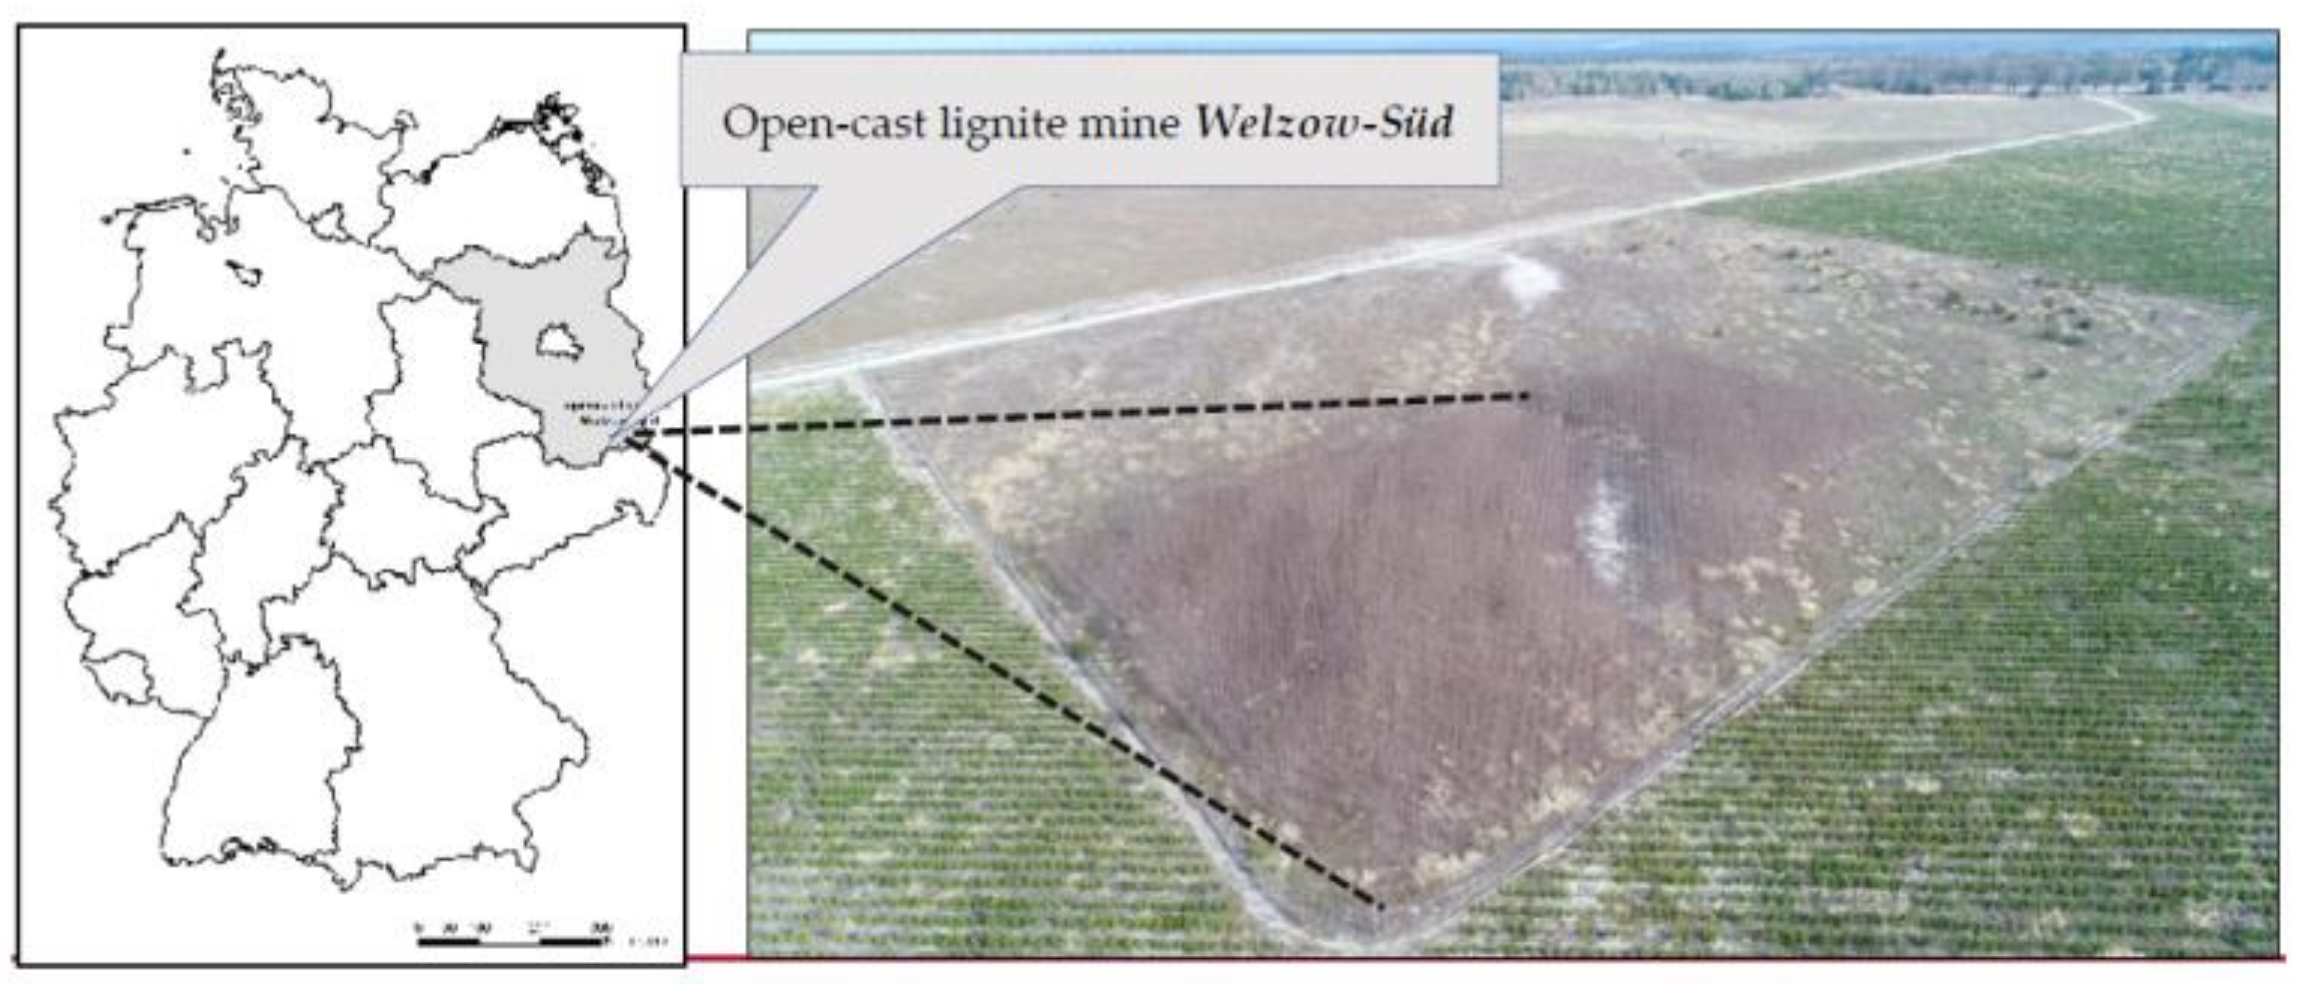
Our test plot (51°36′49″ N, 14°14′05″ E) is situated in the northern part of
Welzow-Süd open-cast lignite mining site, in the south of the Federal State of Brandenburg (Germany),
Figure 1. Our experimental plot covers 0.4 hectares in total. We also run a weather station approximately 5 km east of our experimental plot which records standard meteorological data (i.e., precipitation, temperature, etc.).
2.2. Soil Conditions
The test area, situated in the northern part of the lignite mining pit
Welzow-Süd, has been undergoing rehabilitation since 2012. Investigations on local dump soil substrate by Hanschke [
11] revealed the prevalence of two different dumped materials:
- (1)
Loamy Sand with few gravels;
- (2)
Loamy Sand with few gravels and finely divided lignite material.
Note that the evaluation of the post-mining soil substrate by Hanschke [
11] was carried out prior to lime application on our test site. Both dump substrates units are characterised by low pH value, low nutrition level and low water holding capacity [
11],
Table 1.
2.3. Test Design
The trial was designed to investigate 12 selected clones of Black Locust along with 3 provenances (
Table 2). The original plus trees of the clones (ortets) were selected on the basis of their outstanding stem form and growth performance in 1990 [
12]. The trial was established with one-year-old plants from tissue culture (clones) and provenances in spring 2014. All plants were cut after planting 5–7 cm above ground. Potential competitive shoots were removed during the first growing season. A complete randomised subplot design was used with 12 replications and 9 trees per plot. The spacing was 1.5 m by 1.5 m.
However, in order to reduce costs and delay we only examine 7 clones and the 3 provenances in this study (grey shaded in
Table 2). Five of the investigated clones have their origins in the Federal State of Brandenburg (
Rob,
Rog,
Romy,
Row and
Roy, respectively) and two in the Federal State of Hesse (
Fra3,
Lan).
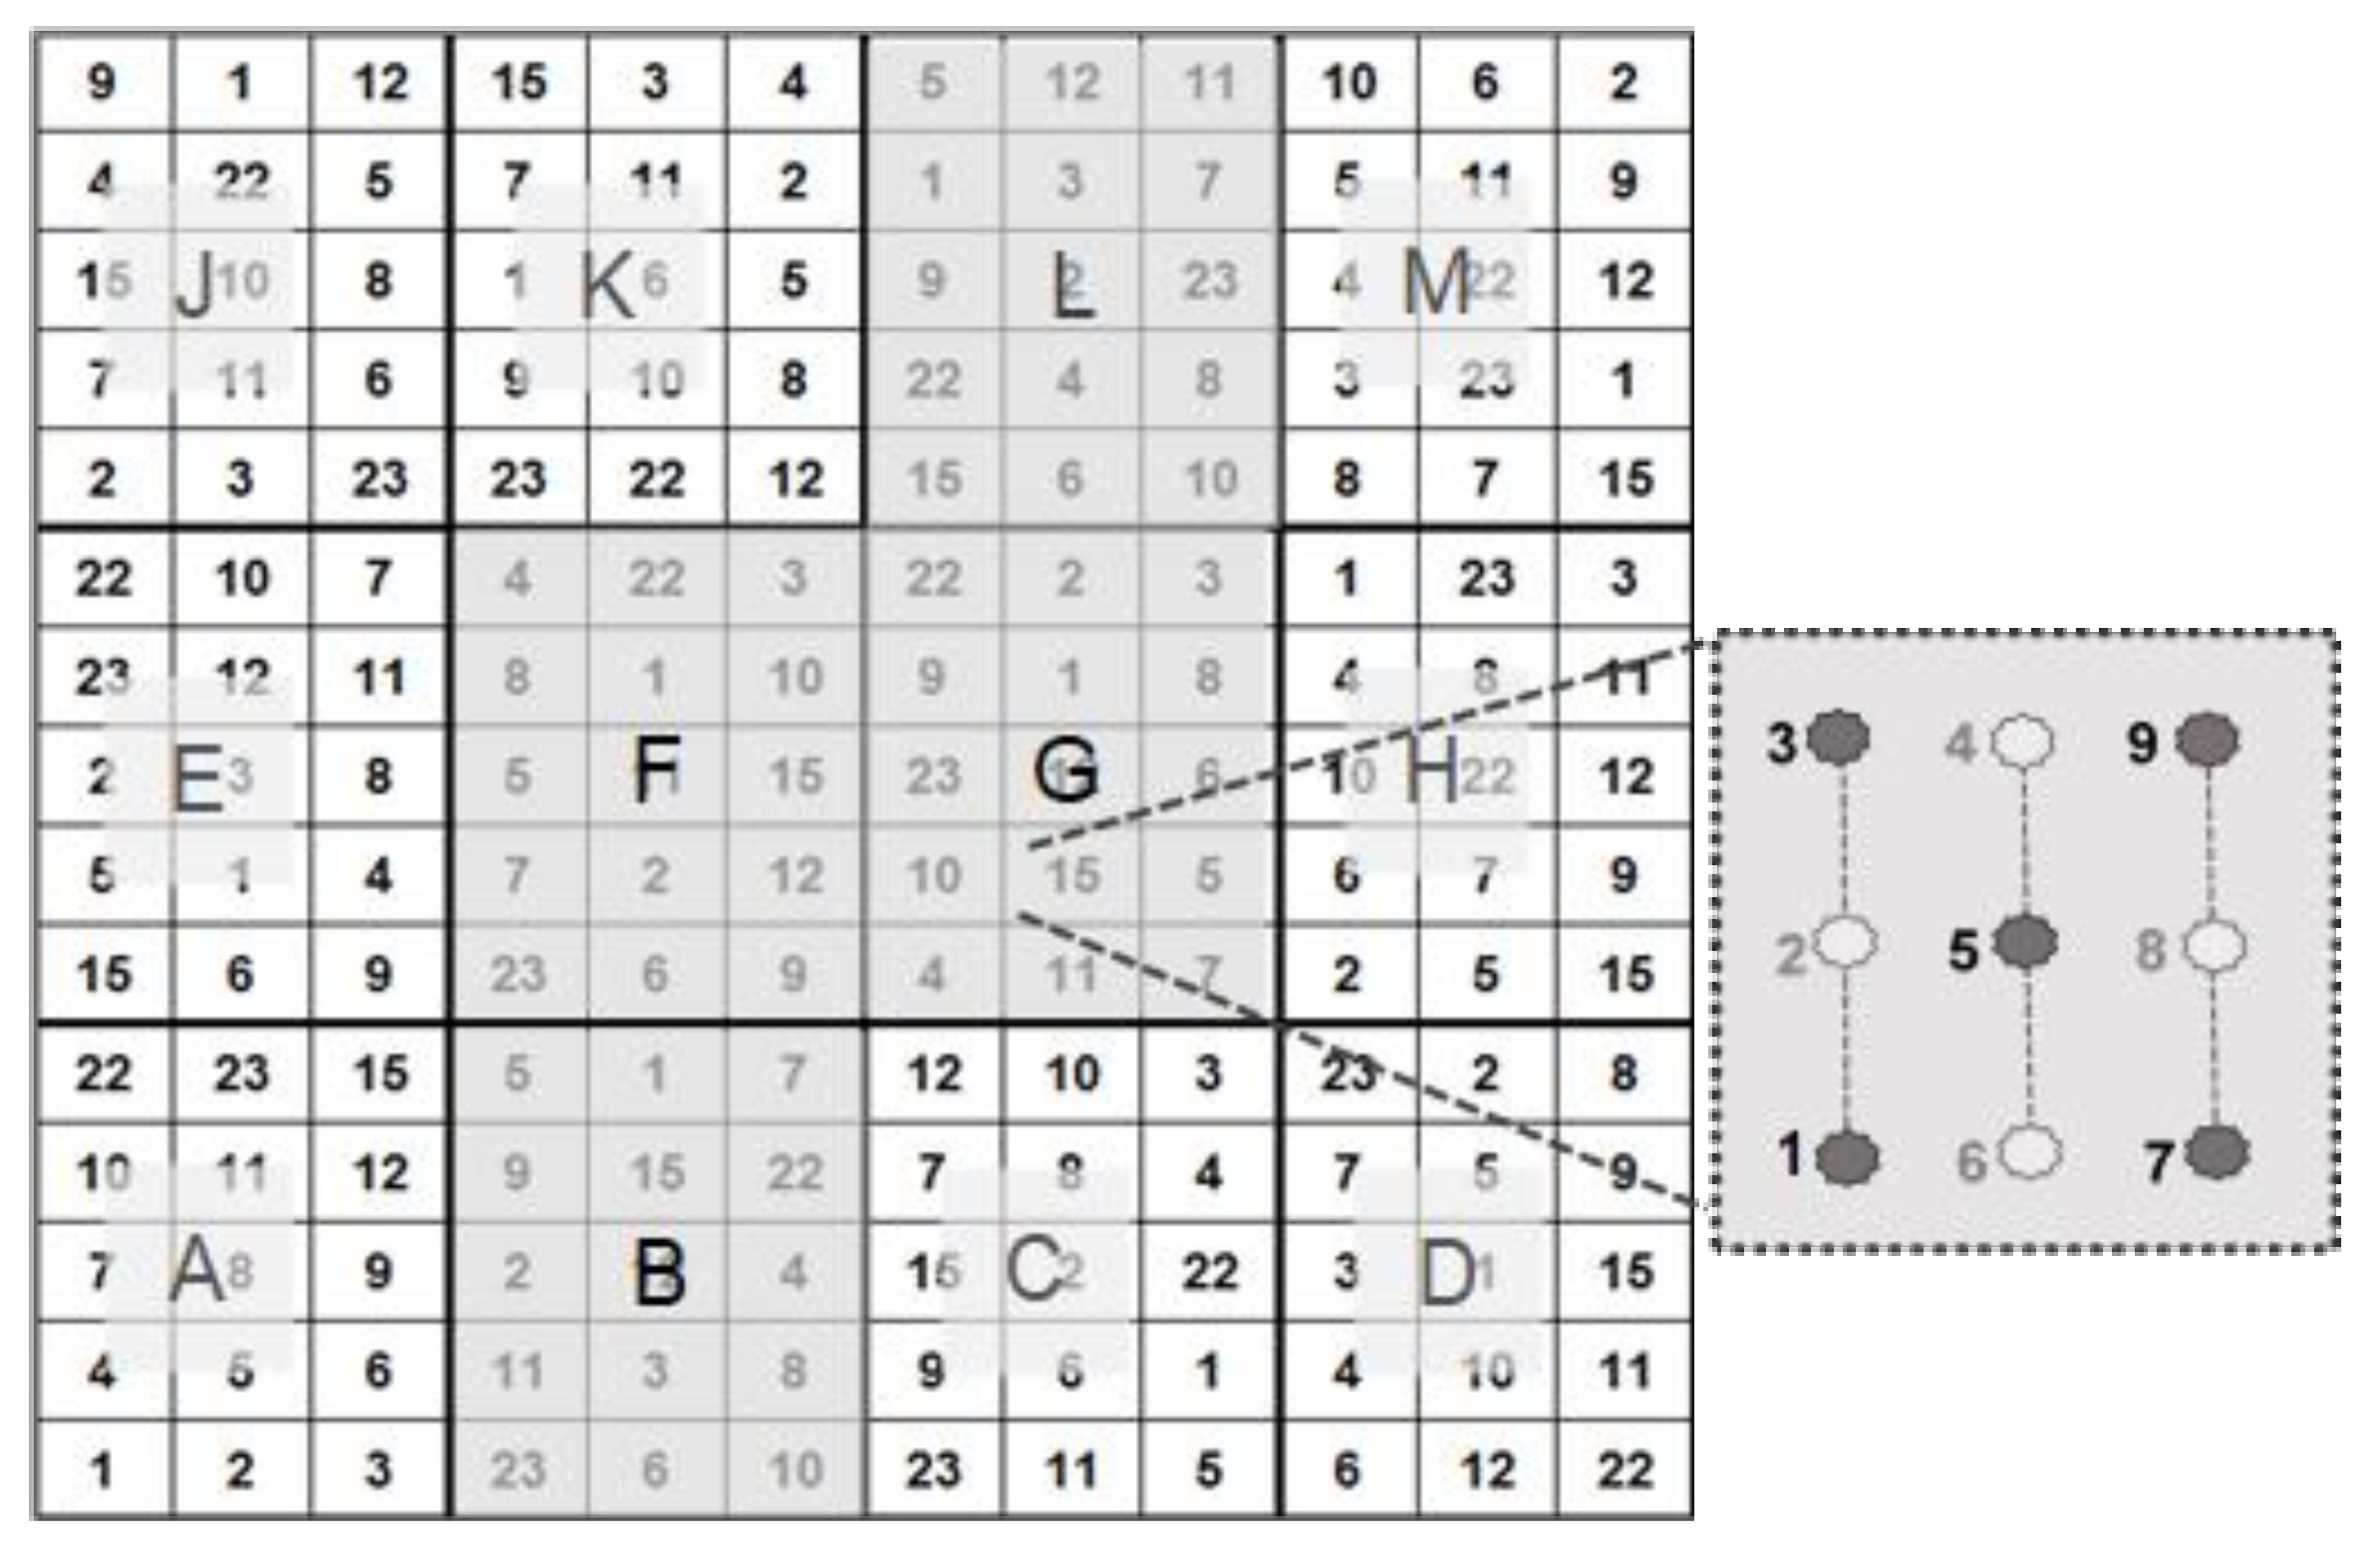
According to the principle described in [
8], we picked five out of nine test plants per patch for biophysical measurement (
Figure 2).
2.4. Chlorophyll a Fluorescence Measurements and JIP-Test
A portable Plant Efficiency Analyser (Pocket PEA, Hansatech, King’s Lynn, UK) was used to non-invasively measure chlorophyll fluorescence on the leaves’ surface of Black Locust test plants in order to assess their physiological status (i.e., vitality). Lange et al. [
13] successfully employed this methodology to determine plant physiological effects of different soil ameliorants applied to young sessile oaks (
Quercus petraea (Matt.) Liebl.) growing on a uranium tailings dump in
Schlema (Ore Mountains, Germany). Before taking the actual measurement, leaves of the test plants were dark-adapted for at least one hour before the chlorophyll a fluorescence measurements were performed. The fast phase fluorescence transients were quantified by means of the JIP-test [
14,
15] and using the Biolyzer software [
15]. The JIP-test, developed and tested under both laboratory and practical conditions, is well accepted amongst experts to detect, describe and quantify the dynamic capacities of the photosynthetic sample. It has been widely and successfully used for the investigation of photosystem II behaviour in various photosynthetic organisms under different stress conditions and enables the study of synergistic and antagonistic effects of different co-stressors [
10,
13,
16,
17,
18].
In order to quantify and compare the individual physiological performance of the Robinia test trees both under normal and stress conditions we chose to use the Performance Index (PI
ABS) as the JIP-test parameter. PI
ABS is a multiparametric expression which incorporates the independent parameters contributing to photosynthesis, namely absorption (RC/ABS), the quantum efficiency of trapping (φPo/(1 − φPo)) and efficiency of conversion of trapped excitation energy to electron transport (ψo/(1 − ψo)), see Strasser et al. [
19]. The Performance index (PI
ABS) is presented below on absorption basis, Equation (1) [
19]:
where γRC is the fraction of reaction center chlorophylls relative to the total chlorophyll: γRC = Chl
RC/Chl
total. Since Chl
tot = Chl
antenna + Chl
RC, we get: γRC/(1 − γRC ) = Chl
RC/Chl
antenna = RC/ABS.
2.5. Dualex® Scientific+TM for Determining Chlorophyll and Flavonols in Leaves
According to the manufacturer’s specification, the Dualex
® Scientific+
TM system was developed on the basis of research conducted by the CNRS (Centre national de la recherche scientifique, Paris, France) and Force-A (University of Paris-Sud, Orsay, France). Using a photometric measurement principle, the Dualex
® is able to perform a non-destructive and rapid measurement of the chlorophyll content in leaves as well as flavonol and anthocyanin contents in the epidermis with sufficient accuracy and in real time [
20]. There is some evidence that polyphenols, especially antioxidative flavonols such as anthocyanin, are reliable indicators for plants’ vitality. Under abiotic stress and/or as a result of nutrition deficiency, biosynthesis of chlorophyll decreases whereas the production of secondary plant substances such as flavonols increases [
21]. The Nitrogen Balance Index (NBI), calculated from the ratio of chlorophyll content and flavonol concentration, indicates the nitrogen supply status of the tested plant [
22,
23]. Ultimately, an efficient and field-suited optical sensor is available to screen large datasets of leaf samples in a relatively short period of time.
2.6. Biophysical Measurements
Throughout the growing seasons in 2015 and 2016, we carried out in vivo chlorophyll a fluorescence and Dualex
® measurements (usually five measurements per tree) on five out of nine test plants from seven different Robinia clones and three provenances located in the subplots B, F, G and L (
Figure 2). Altogether, physiological test results were collected for 200 Black Locust trees over seven measuring dates.
2.7. Plants’ Leaf Analysis
After sampling at the beginning of August 2015 and 2016, the leaf tissue was analysed to determine the (N, P, K, Ca, Mg and S) content. Leaves were dried at 80 °C for 48 h and then finely ground using a vibrating sample mill. The total nitrogen content was derived by combustion according to the Dumas principle using an element analyser. The other major elements (K, Ca, Mg, P, S) were measured with an inductively coupled plasma atomic emission spectrometer (ICP-AES). Prior to ICP-AES measurement, dried leaf powder was digested in a microwave pressure digestion system with HNO
3. Determination methods are listed in
Table 3.
2.8. Biomass Growth Measurements
Towards the end of the particular growing season, we recorded plant height and diameter at breast height (i.e., 1.3 m above ground level) for 200 test specimens. Subsequently, we calculated the mean annual height and diameter growth of the clones and provenances. In addition, we estimated the individual biomass growth rate (aboveground annual woody biomass) using an allometric equation [
24,
25,
26]. The biometric investigations focusing on 265 Black Locust test trees in the joint project FastWOOD resulted in the allometric equation (Equation (2)) which is tailored toward young Robinia forests on reclamation sites [
27,
28].
2.9. Quality Assessment
Parallel to growth measurements, the stem form and crown formation were also evaluated. The number of trees with multiple stems, forks and/or ramicorns was assessed as well as trees with stem and bark injuries, and branch and crown fractures.
3. Results and Discussions
3.1. Weather Conditions from 2014–2019
Weather recordings from the time period 2014–2019 presented in
Table 4 help to characterise the growth conditions for our Robinia test plants.
As shown in
Table 4, the total precipitation was considerably lower in 2018 and 2019 than in the years from 2014 to 2017, especially during the vegetation period (Apr–Oct). Indeed, the average precipitation during the vegetation period in 2018 and 2019 was, respectively, 219 mm (−53.5%) and 200 mm (−49.0%) lower than the 2014–2017 average. Compared to the average air temperature in the years 2014–2017, the mean air temperature also increased by 2° K (growth year 2018) and by 1° K (2019). Therefore, in 2018, the young Black Locust trees were faced with the most extreme conditions since their planting in March 2014.
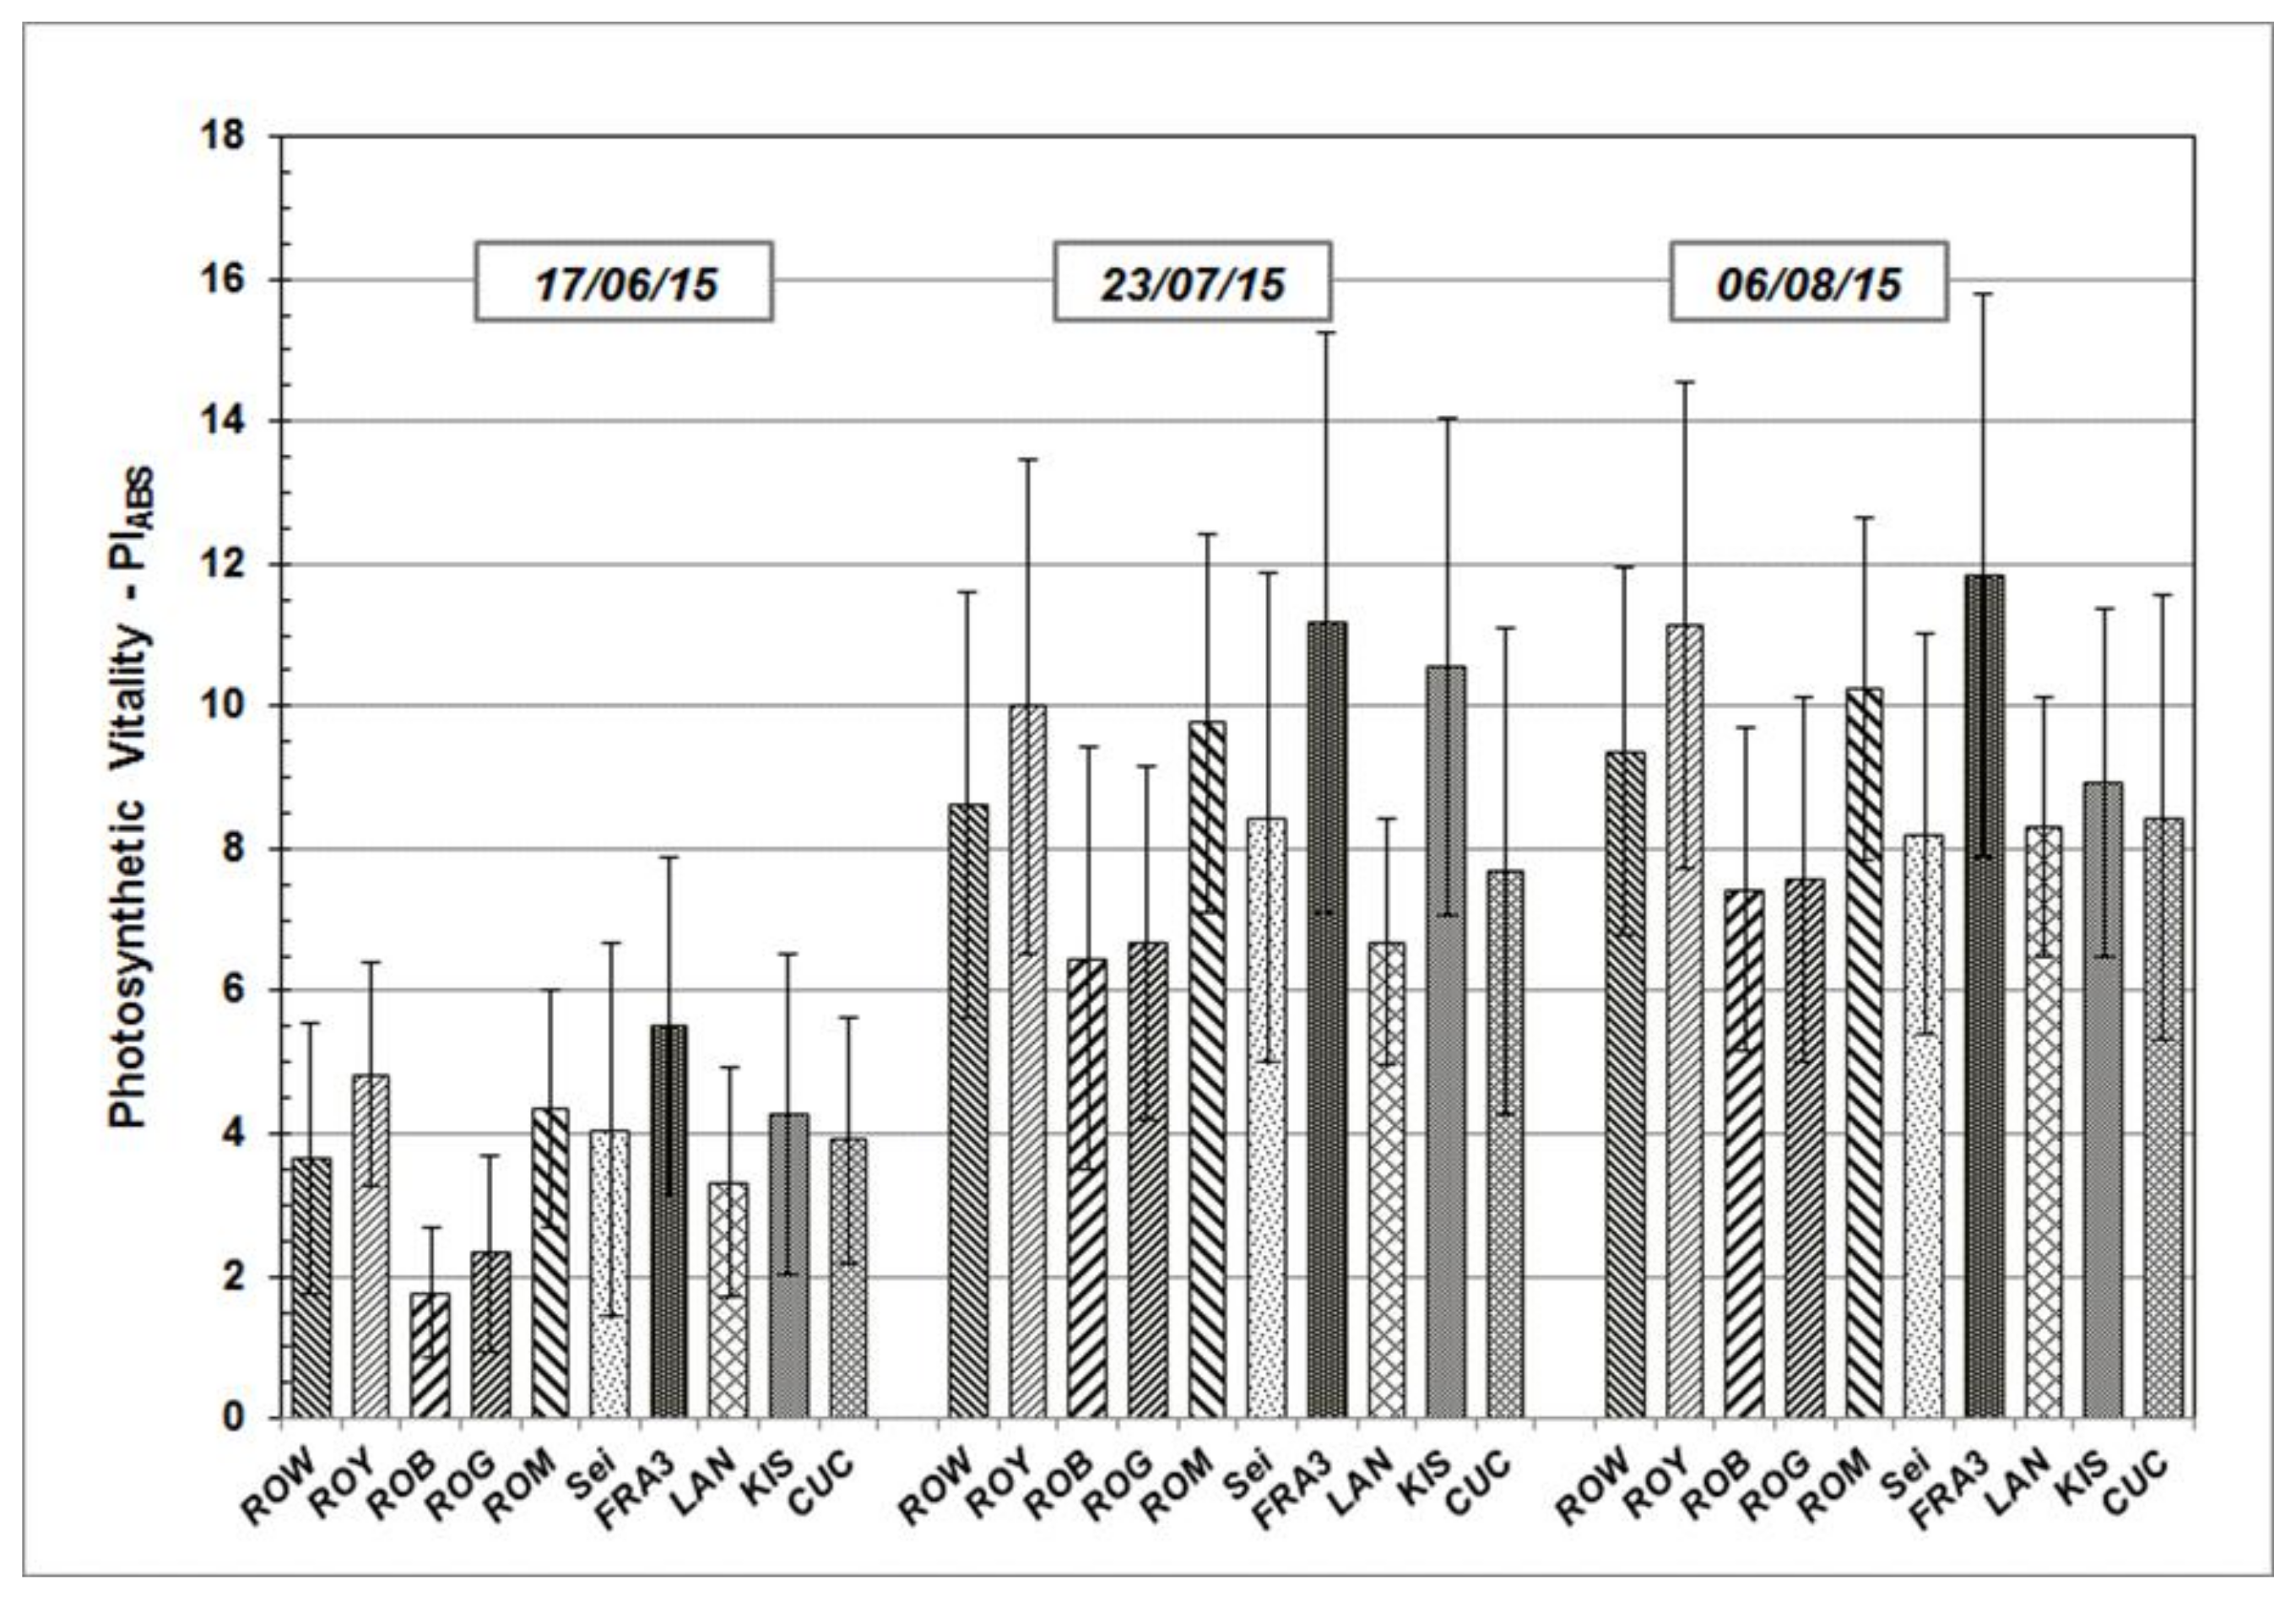
3.2. Chlorophyll a Fluorescence and Photosynthetic Vitality
Results determined from the measurements taken during growth season 2015 and 2016 are presented in the following section. PI
ABS, a significant JIP-test parameter which enables the quantification of plants’ vitality status at a specific time point, will be addressed in greater detail. PI
ABS average values vary across the Black Locust test units, but follow similar sequences and patterns over time (
Figure 3 and
Figure 4). After starting on a relative low level in June of both of the test years, average PI
ABS values of all the test trees were found to have increased on subsequent occasions.
As shown, individual PIABS mean values of each particular Robinia clone and provenance remain more or less the same in their relationship to each other, independent of measuring date and time. The highest average PIABS values were observed in the test clones Fra3 and Roy. Test trees of Rog and Rob clones show the lowest PIABS mean values, indicating a weak photosynthetic vitality and low physiological performance.
3.3. Chlorophyll and Phenol Content
In addition to the chlorophyll a fluorescence described above, we also performed Dualex
® measurements on exactly the same Robinia leaves. The results of these measurements enable us to check for correlations between parameters originating from different measuring methods.
Table 5 contains average values of chlorophyll, flavonol and anthocyanin as well as the above-mentioned NBI collected over 7 measuring dates in 2015 and 2016.
When comparing the data collected in 2015 and in 2016, it becomes apparent that both the mean chlorophyll content as well as average flavonol and anthocyanin concentrations were higher in 2015, although the average NBI was found to be lower in 2015. The increase in the plant’s own secondary substances in the leaves during growing season 2015 and the decrease in NBI can likely be attributed to the weather conditions (relatively dry and warm August 2015,
Table 4).
3.4. Plant Nutrition
As mentioned above, the NBI indicates the nitrogen supply status of the test plant. The nutrient supply of test trees belonging to Robinia clones and provenances
Row,
Roy,
Fra3,
Lan,
Kis and
Cuc is therefore discussed in the next section (
Table 6).
The data presented in
Table 6 indicate that with a few exceptions, the uptake of nitrogen, phosphor, potassium and sulphur in Robinia leaves was slightly higher during the growing season in 2016 than in 2015. In contrast, calcium and magnesium contents were found to have decreased from 2015 to 2016, regardless of plant origin. Test trees of
Kis and
Roy displayed the highest N and P concentrations (valid for 2015), whereas
Fra3 and
Row exhibited the highest Ca and Mg contents in general.
Bearing in mind that the growing season in 2015 was warmer and drier than in 2016 (
Table 4), it is highly likely that drought, monitored in late summer 2015, limited nitrogen fixation and resulted in lower N and P content in the Robinia leaf tissue.
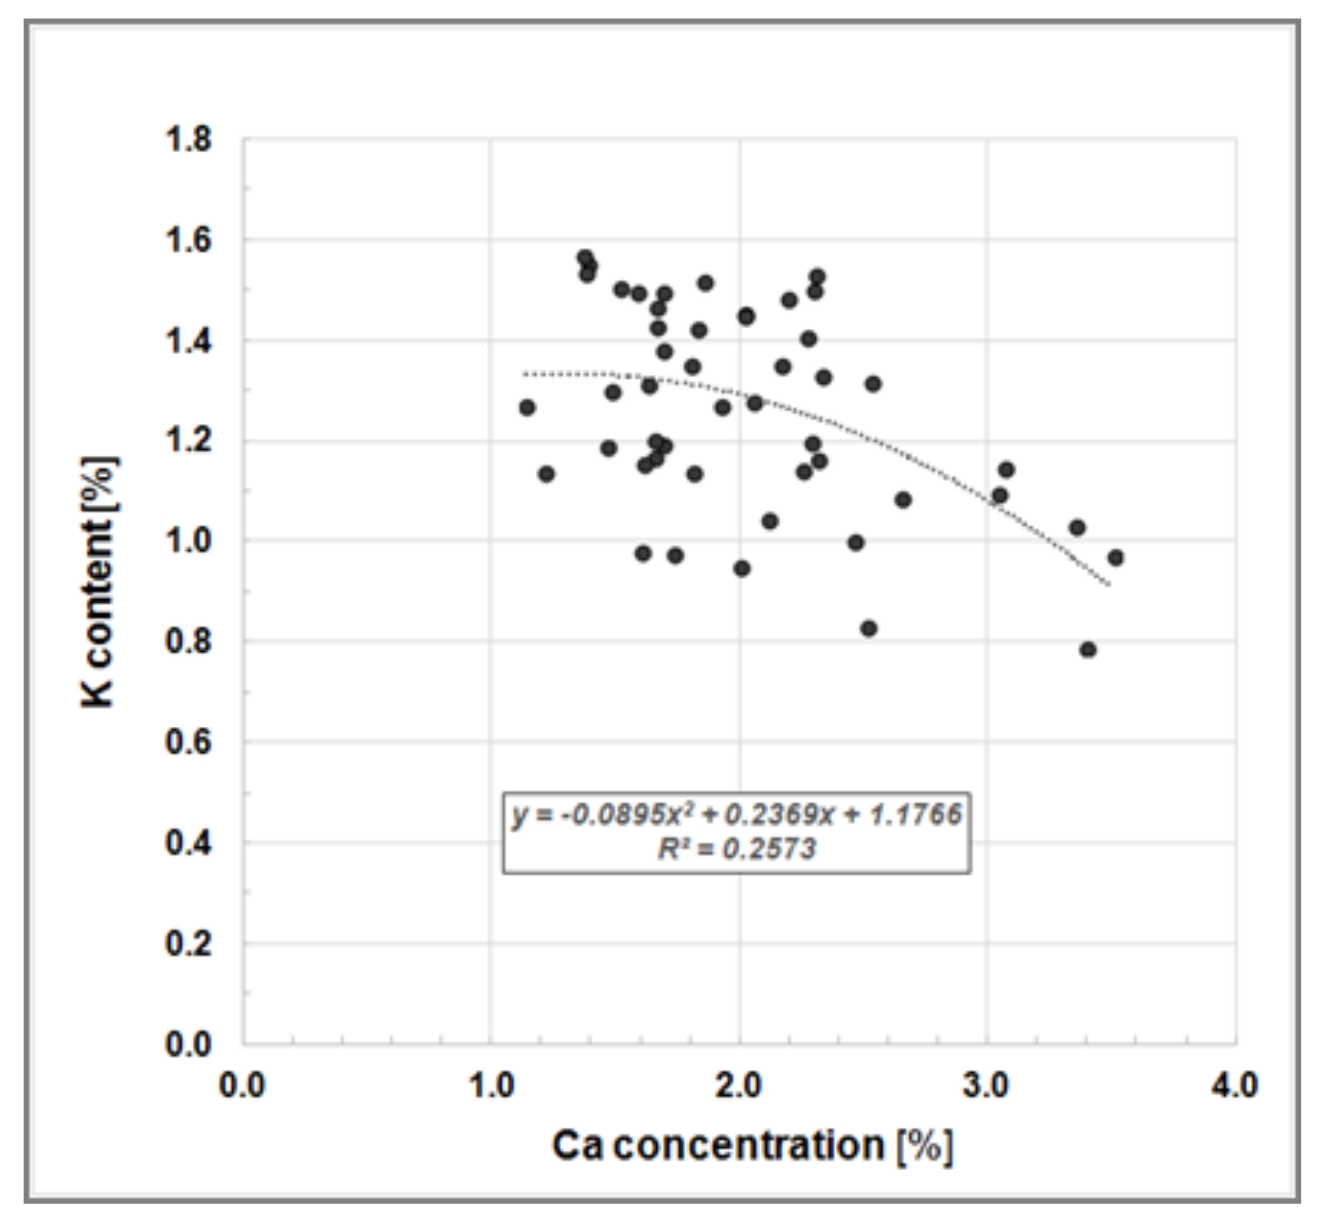
Our measured leaf nutrient concentrations correspond closely with previously published data, e.g., [
29,
30]. Heinsdorf [
30] investigated nutrient uptake and nutrient supply of a seven-year-old Black Locust stand growing on a former open cast lignite mining site in East Germany and reported the follow leaf analysis data (mean values): N
tot 3.64%, N
soluable 0.92%, P 0.18%, K 1.19% and Mg 0.16%. Our findings also showed a K-to-Ca-antagonism, as reported by Heinsdorf [
30], where high K concentrations in Robinia leaves correspond to low Ca concentrations (
Figure 5).
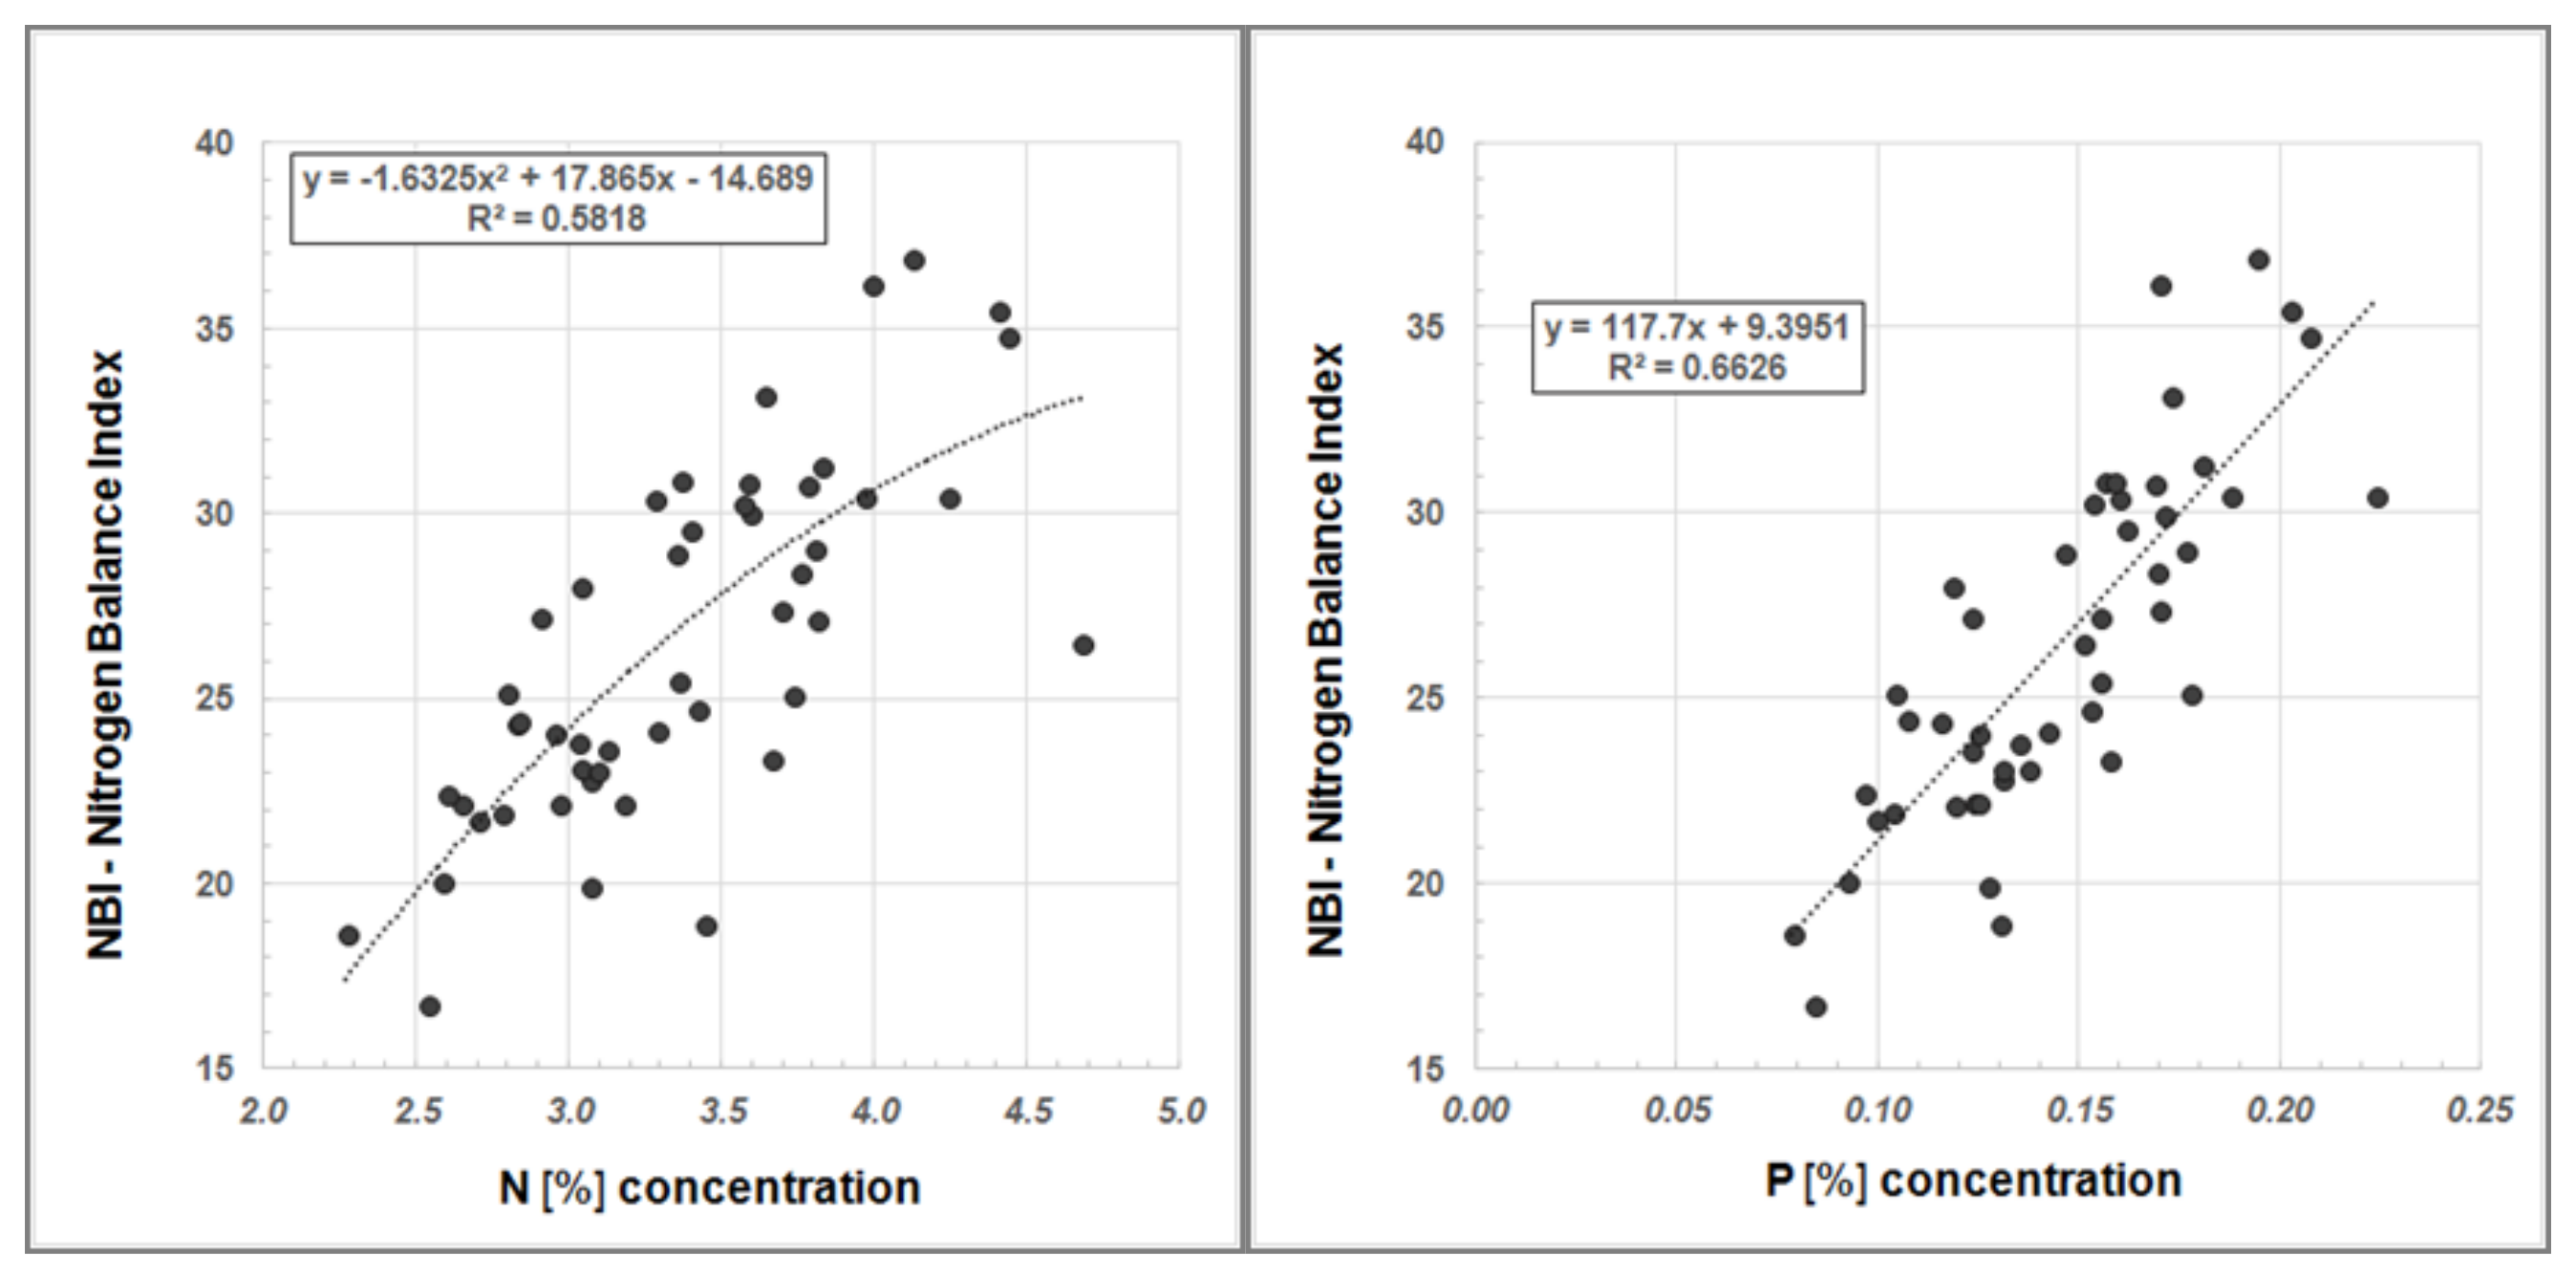
Furthermore, we examined our data for a systematic relationship between Dualex
®-derived NBI values and N
tot content as well as NBI and the P concentration, respectively (
Figure 6).
The regression analyses show a good correlation between the NBI, determined using the Dualex
®, and N
tot content in Robinia leaves as well as NBI and P concentration, respectively (
Figure 6). Hence, Dualex
® measurements offer a more cost-effective and time-efficient method for determining the nutrient status of plants.
3.5. Biomass Growth
As already mentioned in the previous section, PI
ABS mean values vary depending on the origin of the plant sampled. Generally, it can be stated that higher PI
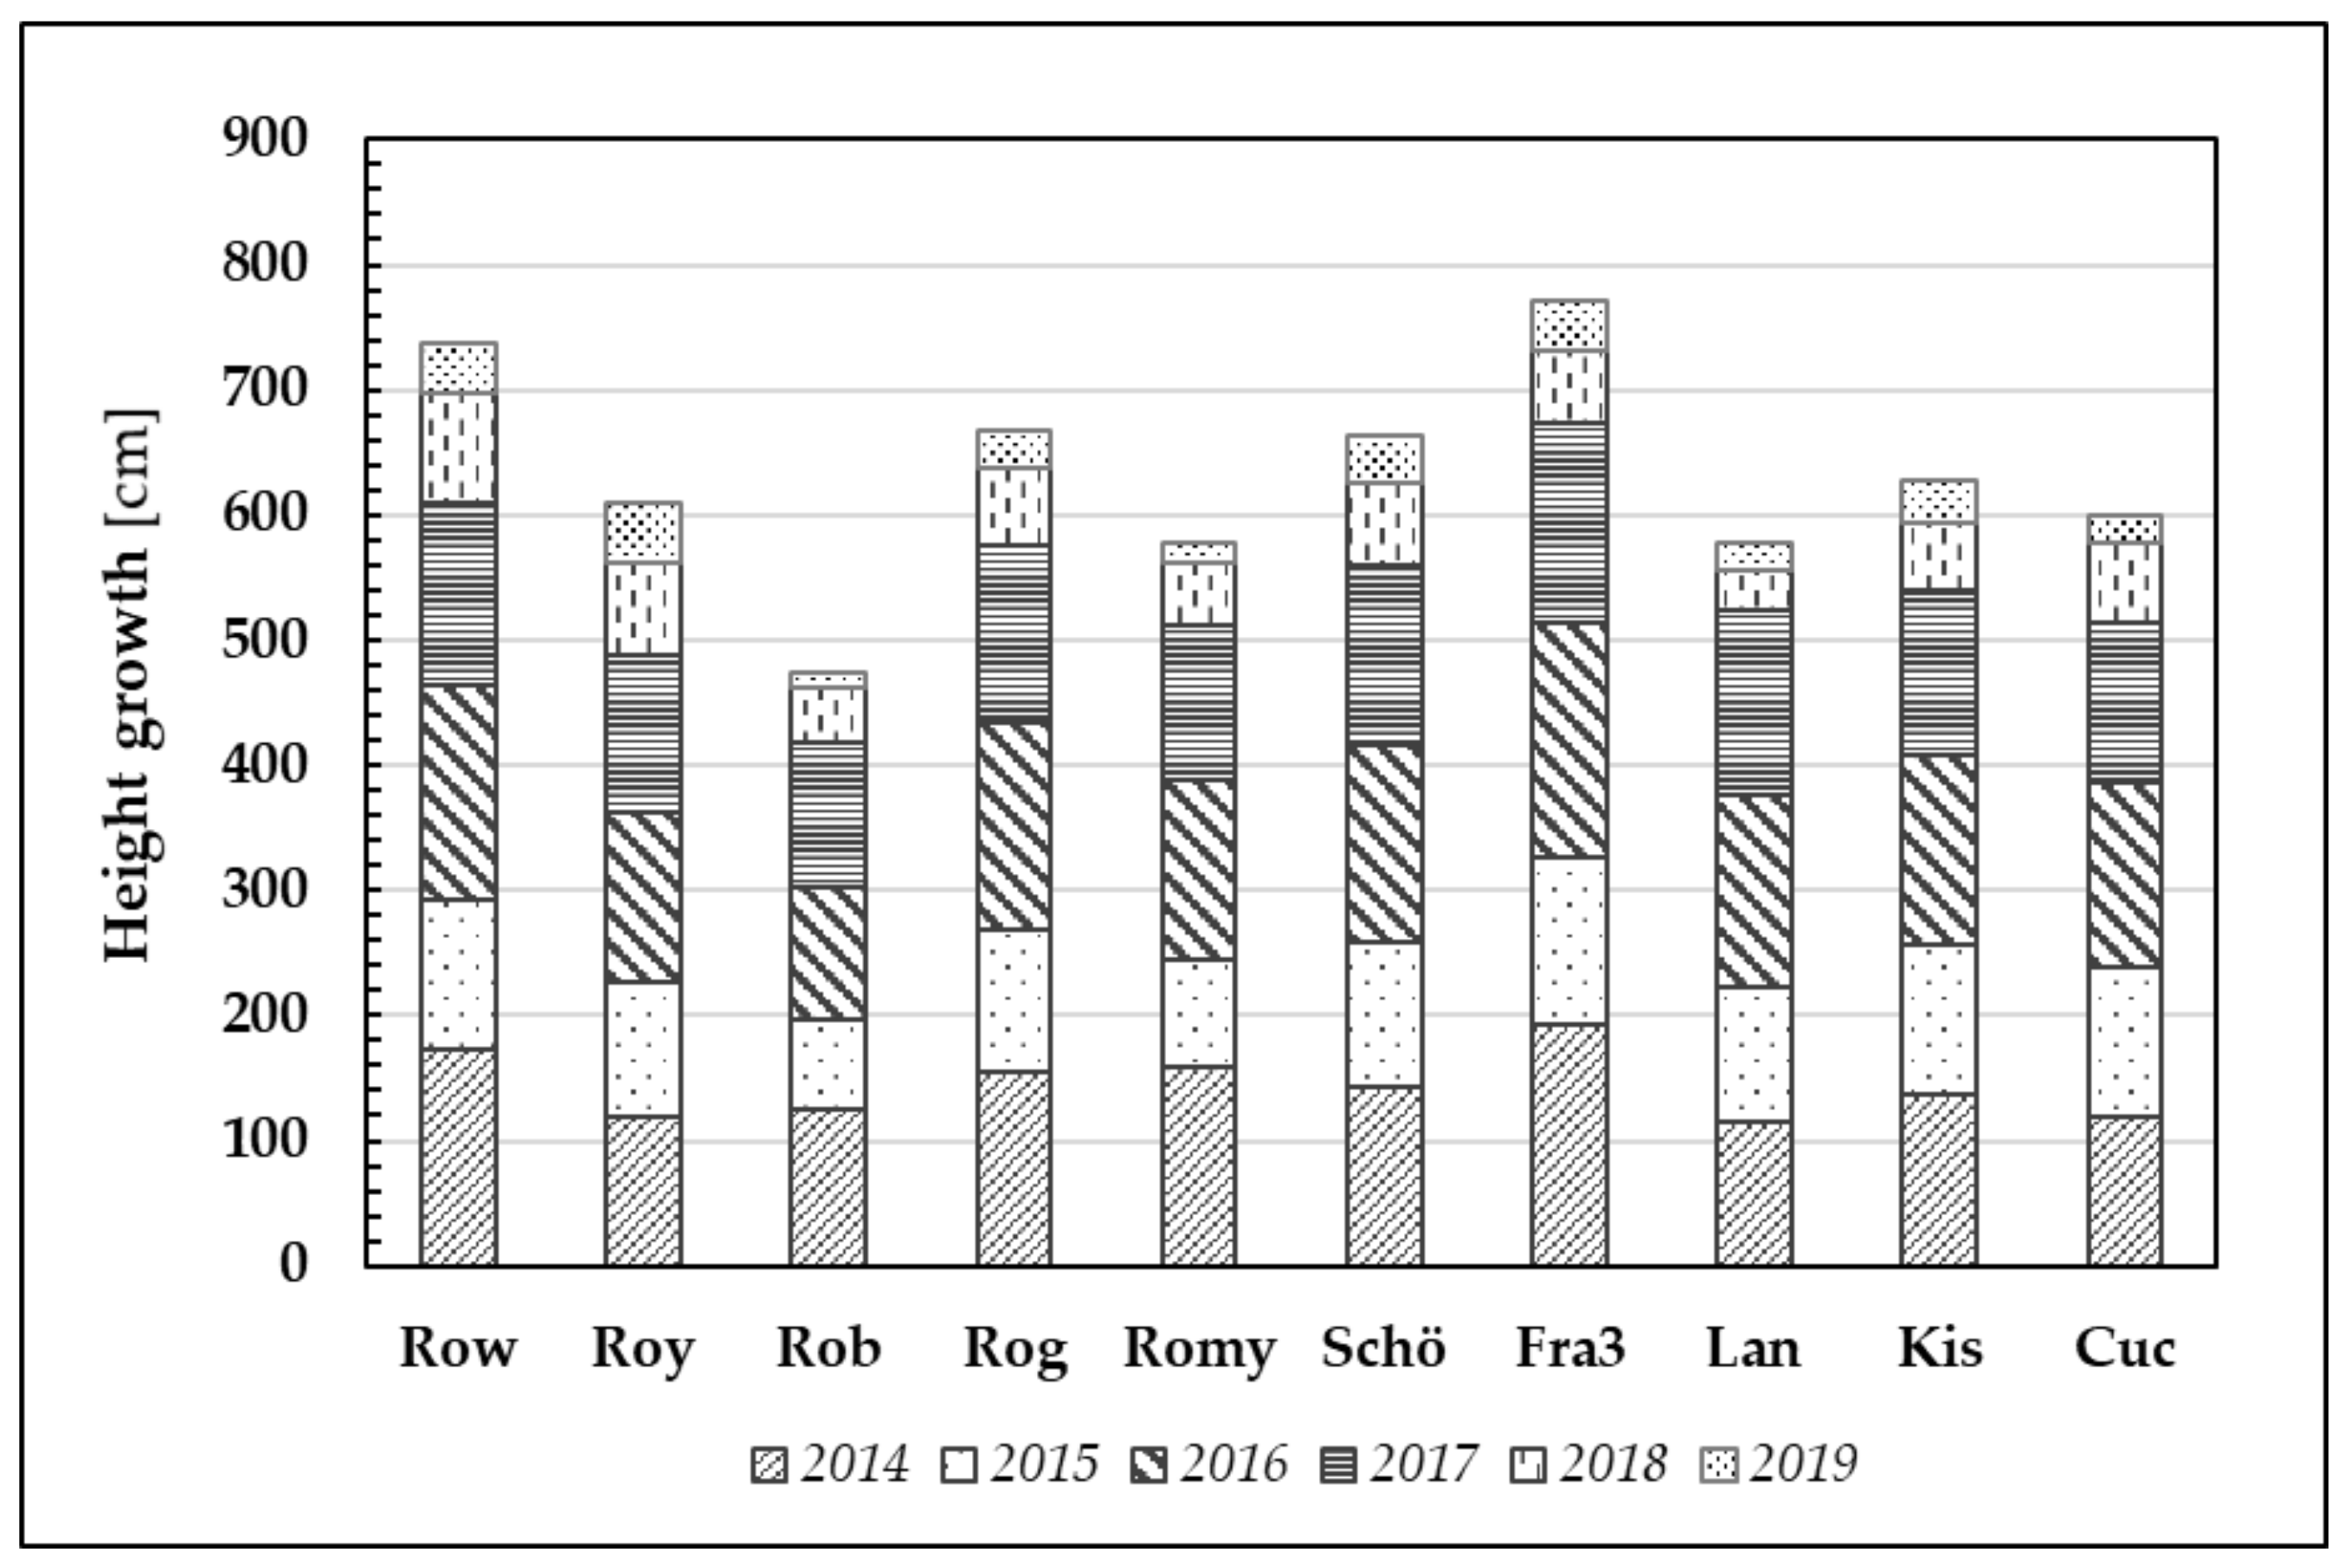
ABS values, indicating greater efficiency in primary photosynthetic processes, are likely to result in greater plant growth. Clear and significant differences can be observed between the clones and provenances with regard to the mean annual height growth (
Figure 7).
Clones Fra3 and Row demonstrated the best height growth (mean values) after six years of growth (Ø 772 cm and Ø 738 cm, respectively). In contrast, the clone Rob has the lowest performance (Ø 474 cm).
After the first growing season, Robinia test trees gained a height increment of 144 cm (averaged over all trees). Despite the relatively dry year that followed (2015), the trees nonetheless produced 110 cm growth on average. To date, even the 2018 and 2019 growing seasons, namely the driest and hottest vegetation periods, resulted in a minimum average height increment of 59 cm (2018) and 30 cm (2019).
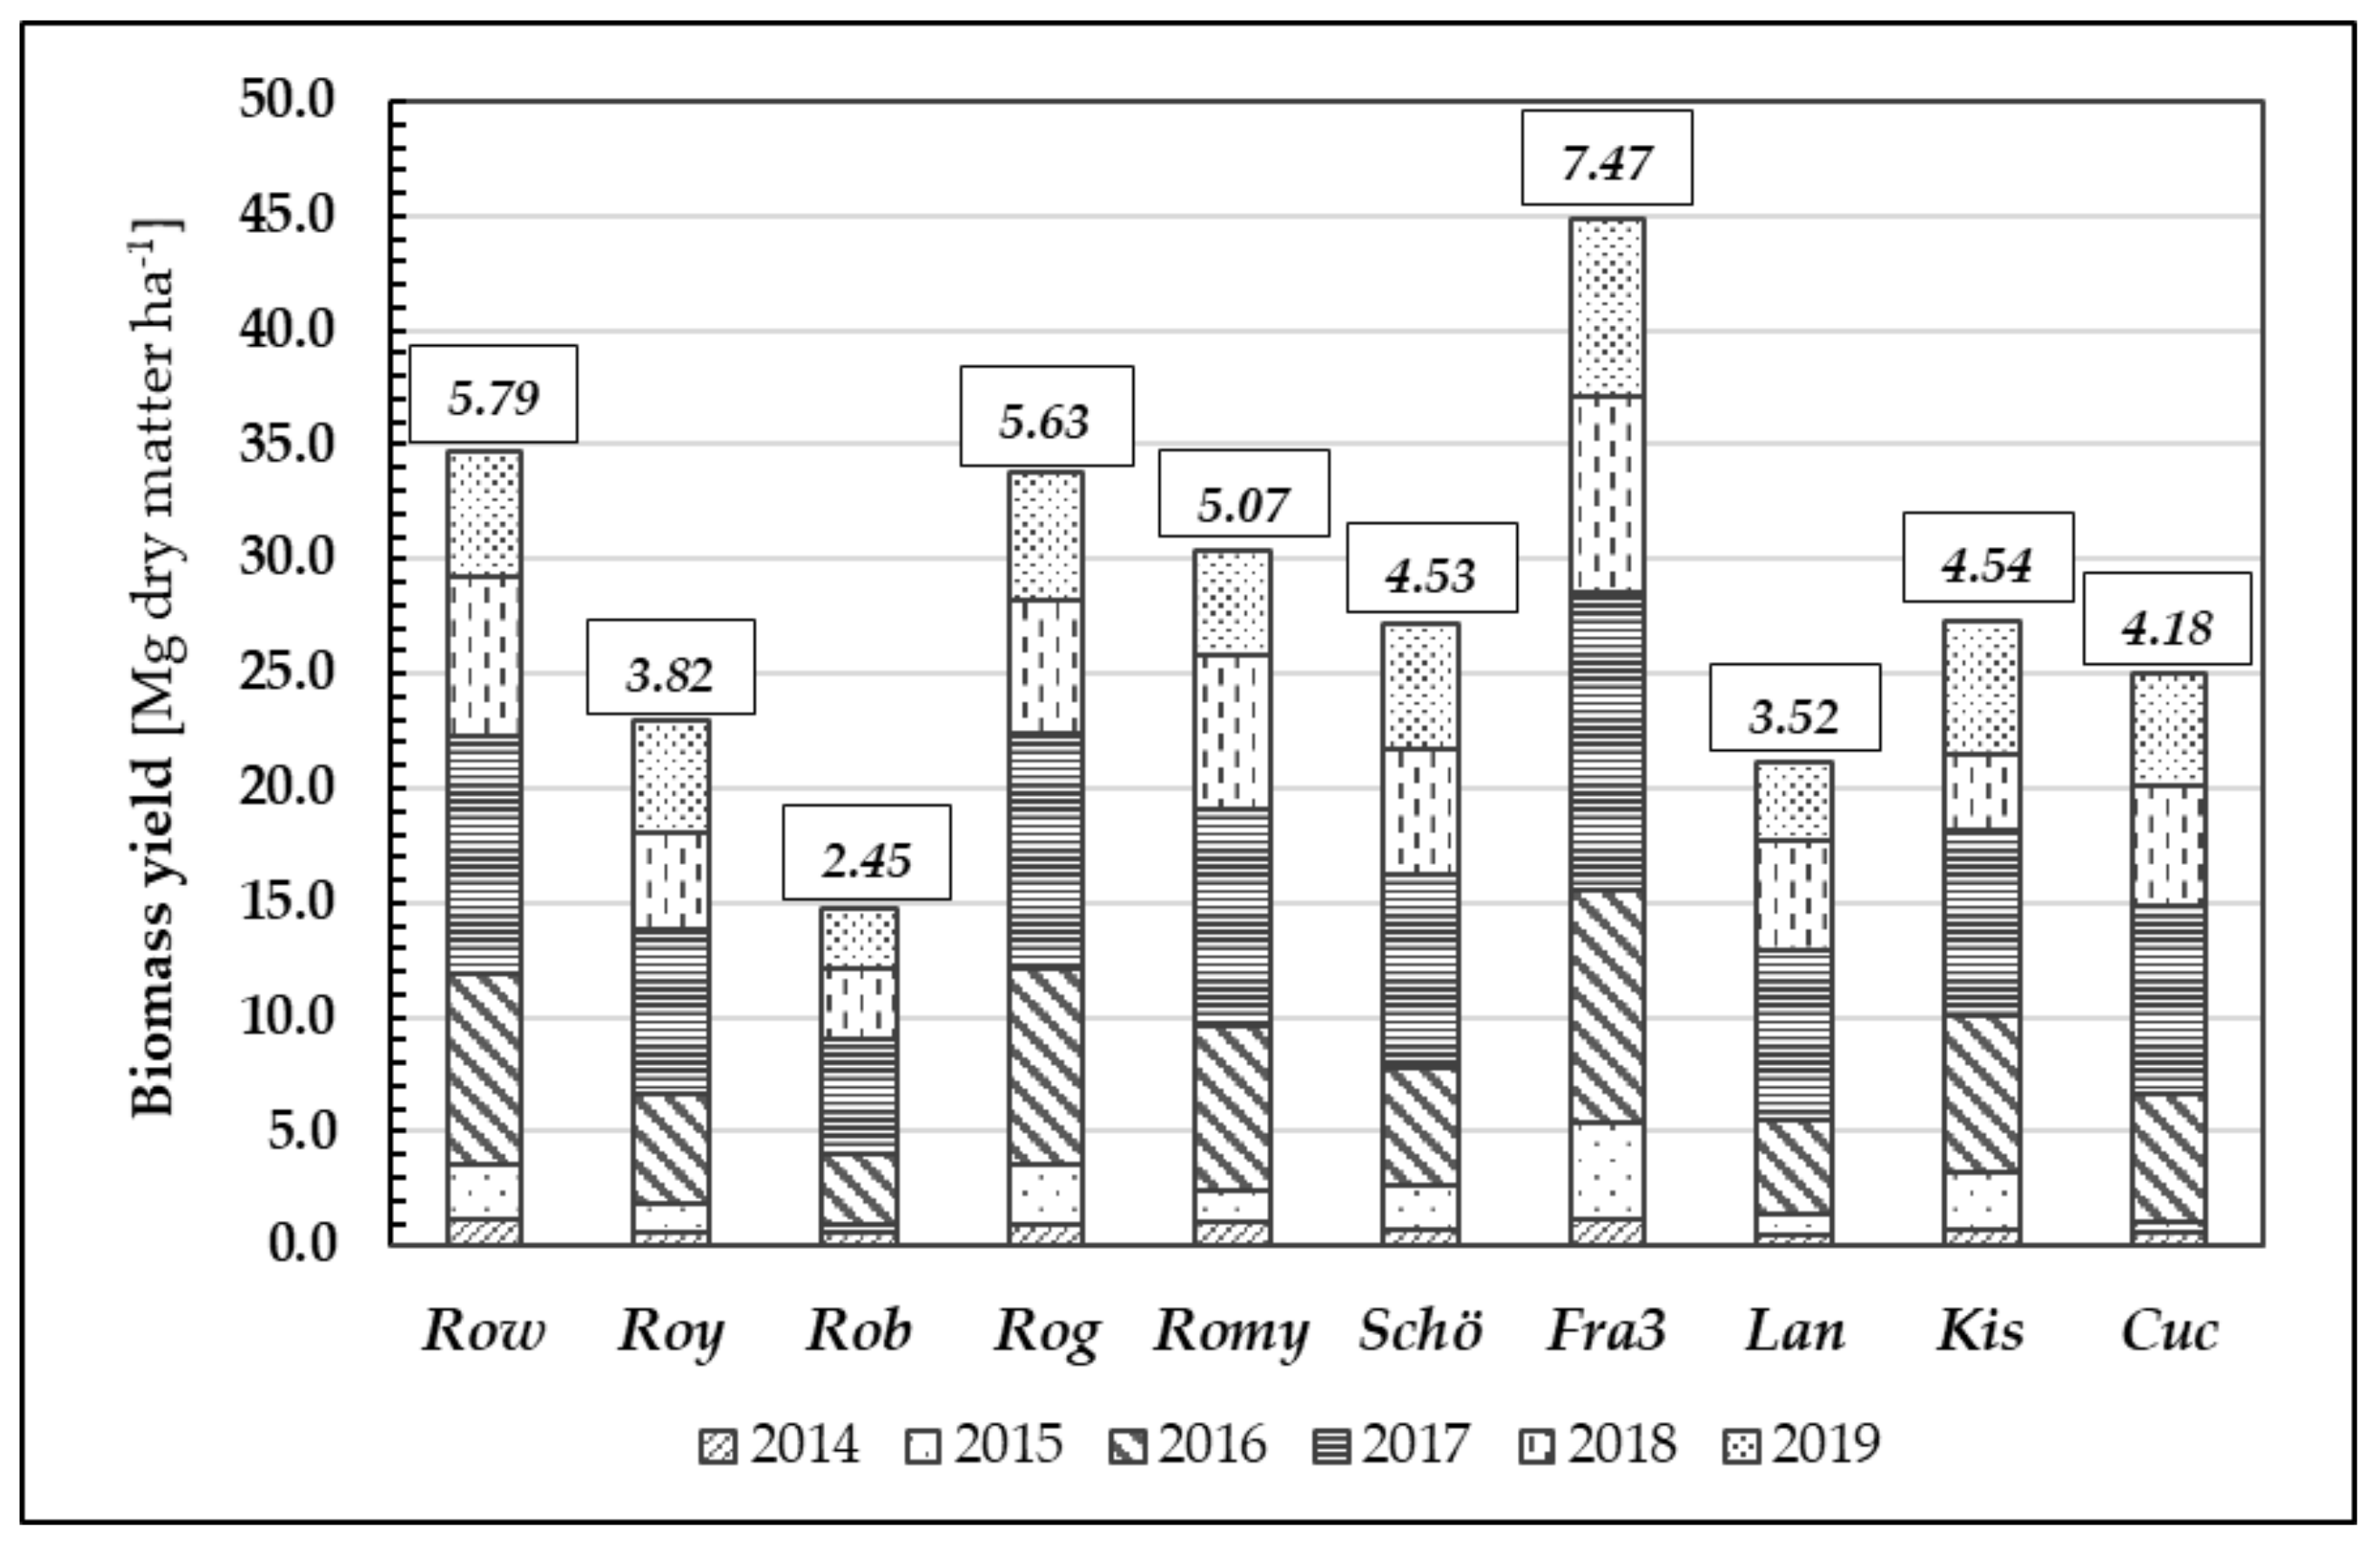
Furthermore, we examined biomass formation during the growth periods of 2014 to 2019 (
Figure 8). Annual biomass growth rates vary depending on the weather conditions during the growing season and corresponding to origin. After six years, the mean biomass yield averaged over all tested Robinia clones and provenances was 28.20 Mg d.m. ha
−1, whereas the mean annual increment was 4.70 Mg d.m. ha
−1 year
−1.
Similar to their performance in height growth, the clones Fra3 and Row achieved the highest mean biomass growth values (7.47 Mg d.m. ha−1 year−1 and 5.79 Mg d.m. ha−1 year−1, respectively) whilst the low-performing clone Rob yielded only 2.45 Mg d.m. ha−1 year−1. The differences in biomass yield between the test units were statistically significant.
3.6. Quality Assessment
A quality assessment of all the test trees revealed a frequent occurrence of crooked stem forms and unfavourable crown formation. Altogether, 66.1% of all trees tested showed multiple stem formation with varying severity between individuals. Only 30% of the test trees belonging to clone Romy were found to have forks, whereas more than two thirds (83.3%) of the plants of the provenance Kis exhibited forks. These findings raise the question of whether it is possible to generate a sufficient number of straight-boled trunks for material utilisation.
4. Discussion
Our results show that the drought, monitored in late summer 2015, is very likely to have caused limitations of nitrogen fixation and resulted in lower N and P content in the Robinia leaves’ tissue (
Table 6). Such findings have been confirmed by other authors. Mantovani et al. [
31], for example, studied carbon allocation, nodulation, and biological nitrogen fixation of two-year-old Black Locust (
Robinia pseudoacacia L.) saplings under soil water limitation. The authors used stable isotopic composition of C (δ 13C) and N (δ 15N) of the leaves to investigate adverse effects of drought as well as to identify the portion N accrued from the atmosphere by biological nitrogen fixation. They also found that drought stress significantly reduces total aboveground biomass production of the test plants as well as increases the nodule biomass of Black Locust in order to maintain biological nitrogen fixation and counteract the lower soil nitrogen availability.
Regarding adaptation to climate change, Mantovani et al. [
32] showed that Black Locust plants can adapt to prolonged drought conditions by lessening water loss through both reduced transpiration and leaf size. However, under well-watered conditions, Robinia does not regulate its transpiration. It, therefore, cannot be considered a water-saving tree species. Veste and Kriebitzsch [
7] carried out pot experiments in order to evaluate the growth and ecophysiological performance of Black Locust under drought stress. They demonstrated that when Black Locust is exposed to drought, it drastically reduces leaf area in order to minimise transpiration. Moreover, their test plants showed different adaptations and a high plasticity of the ecophysiological processes to cope with long-term drought stress and high temperatures, which also enables them to grow in drier regions [
7]. Bhusal et al. [
33] have shown that drought resistance is indicated by leaf mass per area, photosynthetic rate, leaf water potential and further factors. While drought resistance was not concretely explored in this study, it opens avenues to combine our results with investigations into drought response of Black Locust origins in the future.
Furthermore, Seserman et al. [
34] pointed out that tree yields in Black Locust short rotation coppices were positively impacted by air temperature increase and negatively by decreasing precipitation.
The reduction in biomass growth of Black Locust during the drought years (
Figure 8) is in accordance with previous studies [
34,
35]. Hence, Mantovani et al. [
35] investigated spatial and temporal variation of drought impact on Black Locust’s water status and growth. They conducted their study at two different sites: one site with fertile agricultural soil (site 1) and a reclaimed post-mining site with heterogeneous unstructured soil (site 2). They found that stem growth was drastically reduced during a period of summer drought, particularly in the post-mining area, as a result of the adverse edaphic conditions (below the critical pre-dawn water potential value of −0.5 MPa). However, the trees could cope with the extreme soil and weather conditions in the post-mining site without perishing.
Our biomass growth rates are in range with average annual values gained from other sites in the Lusatian post-mining area reported by Knoche et al. [
28]. The latter reported biomass yields after six growth years for study site
Drebkau 1 = 37.7 Mg d.m. ha
−1 (Ø 6.3 Mg d.m. ha
−1 year
−1) and for site
Drebkau 2 = 40.7 Mg d.m. ha
−1 (Ø 6.8 Mg d.m. ha−1 year
−1) as well as 19.3 Mg d.m. ha
−1 (Ø 3.2 Mg d.m. ha
−1 year
−1) for site
Senftenberg.
To give a comprehensive evaluation of all clones and provenances studied, plant physiological performance, biomass growth and quality data were individually evaluated and ranked (
Table 7). Note that parameters given in the table are not weighted and deep balanced but may nonetheless assist in identifying the best Robinia plant material for land users in post-mining areas.
5. Conclusions
Our study reveals pronounced differences in the physiological performance, biomass growth and stem quality of the Black Locust clones and provenances studied. Under the challenging climatic and edaphic conditions of our test site—considering photosynthetic vitality, chlorophyll and phenol content, nutrition state, biomass growth and stem quality—Robinia genotypes Rowena, Fra3 and Romy as well as the Brandenburg provenance Schöneiche show the most promise with regard to growth performance, especially for cultivation in short coppice rotation and on forest land.
Biophysical measurements using the Pocket PEA and Dualex®, especially when combined and used in parallel, are reliable indicators for detecting abiotic stress already in an early stage. We were able to show that while mean PIABS values vary across Black Locust test units, they still follow similar sequences/patterns. We found correlations between biophysical parameters resulting from chlorophyll a fluorescence and Dualex® measurements. Correlation analysis revealed good accordance of Dualex®-derived NBI (Nitrogen Balance Index) and Ntot content as well as P content, detected in Robinia leaves. Hence, using Dualex® measurements can provide insights into the nutrient status (especially nitrogen) of plants in a cost and time efficient manner.
We conclude that biophysical measurements have the potential to shorten otherwise long-lasting research plans in tree breeding. In addition, biophysical measurements enable the early assessment of the physiological performance and stress tolerance of different Robinia clones and provenances.
Author Contributions
Conceptualization, C.A.L., D.K. and V.S.; methodology, C.A.L. and S.L.; validation, D.K., C.A.L. and V.S.; formal analysis, C.A.L., R.H. and S.L.; investigation, D.K., C.A.L. and V.S.; resources, V.S., S.L. and C.A.L.; data curation, C.A.L., S.L. and R.H.; writing—original draft preparation, C.A.L.; writing—review and editing, D.K., R.H., C.A.L. and V.S.; visualization, C.A.L., S.L. and R.H.; supervision, D.K.; project administration, D.K.; funding acquisition, V.S. and D.K. All authors have read and agreed to the published version of the manuscript.
Funding
This work was kindly funded by the German Fachagentur für Nachwachsende Rohstoffe with support by the Federal Ministry of Food and Agriculture (joint project FastWOOD, Project No. 22001014). We would also like to thank the mining company LEAG for financial support of perennial data acquisition.
Data Availability Statement
The raw data sets generated during the time period 2014–2019 are available from the corresponding author on reasonable request.
Conflicts of Interest
The authors declare no conflict of interest. The funders had no role in the design of the study; in the collection, analyses, or interpretation of data; in the writing of the manuscript, or in the decision to publish the results.
References
- Kleinbauer, I.; Dullinger, S.; Peterseil, J.; Essl, F. Climate change might drive the invasive tree Robinia pseudoacacia into nature reserves and endangered habitats. Biol. Conserv. 2010, 143, 382–390. [Google Scholar] [CrossRef]
- Meyer-Münzer, B.; Grotehusmann, H.; Vor, T. Robinie (Robinia pseudoacacia L.). In Potenziale und Risiken eingeführter Baumarten —Baumartenportraits mit naturschutzfachlicher Bewertung; Vor, T., Spellmann, H., Bolte, A., Ammer, C., Eds.; Göttinger Forstwissenschaften, Universitätsverlag Göttingen: Göttingen, Germany, 2015; Volume 7, pp. 277–296. [Google Scholar]
- Knoche, D.; Lange, C.; Engel, J. Entwicklung von innovativen Bewirtschaftungsverfahren für Robinienbestände (Robinia pseudoacacia L.). In FastWOOD II: Züchtung schnellwachsender Baumarten für die Produktion nachwachsender Rohstoffe im Kurzumtrieb—Erkenntnisse aus 6 Jahren FastWOOD; Thünen Report; Liesebach, M., Ed.; Johann Heinrich von Thünen-Institut: Braunschweig, Germany, 2015; Volume 26, pp. 71–84. [Google Scholar]
- Roloff, A.; Grundmann, B. Waldbaumarten und ihre Verwendung im Klimawandel. Arch. Forstwes. Landsch. Ökol. 2008, 42, 97–109. [Google Scholar]
- Schneck, V. Robinie—Züchtungsansätze und Begründungsverfahren. In Proceedings of the Beiträge—Agrarholz 2010, Symposium: Berlin, Germany, 18–19 May 2010; Deutschland/Bundesministerium für Ernährung, Landwirtschaft und Verbraucherschutz, Ed.; BMELV: Bonn, Germany, 2010; pp. 1–8. Available online: https://literatur.thuenen.de/digbib_extern/dn054837.pdf (accessed on 12 January 2022).
- Guse, T.; Schneck, V.; Liesebach, M.; von Wuehlisch, G. Improving growth performance and drought tolerance of Robinia pseudoacacia L.—Analysis of seedlings of European progenies. Indian J. Ecol. 2011, 38, 95–98. [Google Scholar]
- Veste, M.; Kriebitzsch, W.U. Einfluss von Trockenstress auf Photosynthese, Transpiration und Wachstum junger Robinien (Robinia pseudoacacia L.). Forstarchiv 2013, 84, 35–42. [Google Scholar]
- Löffler, S.; Lange, C.; Kätzel, R. Der kleine Unterschied macht’s—Klonprüfung zur Trockenstresstoleranz von Robinien (Ergebnisse des FNR-Projektes—FastWOOD 3). Eberswalder Forstl. Schr. 2017, 64, 37–44. [Google Scholar]
- Lange, C.A.; Knoche, D.; Schneck, V.; Anders, A. Die Robinie—Anbauversuch unter schwierigen Bedingungen. AFZ-DerWald 2021, 2, 24–29. [Google Scholar]
- Lange, C.A.; Knoche, D.; Hanschke, R. Biophysikalische Untersuchungen zur Stresstoleranz von Robinien unterschiedlicher Herkunft. In Wasser—Lebensgrundlage für Landschaften. 25 Jahre FIB e.V.; Haubold-Rosar, M., Knoche, D., Hildmann, C., Eds.; Shaker: Düren, Germany, 2020; Volume 3, pp. 167–178. [Google Scholar]
- Hanschke, L. Bodengeologischer Kartierungsbericht. Tagebaubereich Welzow/Süd Fläche WW 0 70—H 52. Kartierungsbericht des Büros für Planung, Beratung und Standorterkundung; Vattenfall Europe Mining AG: Turnow-Preilack, Germany, 2011. [Google Scholar]
- Naujoks, G.; Schneck, V.; Hutter, I.; Grotkass, C. Die Mikrovermehrung ausgelesener Elite-Robinienklone—Eine große Chance für erfolgreichen Robinienanbau. Forst Holz 2005, 60, 458–460. [Google Scholar]
- Lange, C.A.; Böcker, L.; Katzur, J. Revegetation of a uranium mine dump by using fertilizer treated sessile oaks. Int. J. Phytoremediation 2011, 13, 18–34. [Google Scholar] [CrossRef]
- Strasser, B.J.; Strasser, R.J. Measuring fast fluorescence transients to address environmental questions: The JIP-test. In Photosynthesis: From Light to Biosphere; Mathis, P., Ed.; Kluwer Academic Publisher: Alphen aan den Rijn, The Netherlands, 1995; Volume 5, pp. 977–980. [Google Scholar]
- Strasser, R.J.; Srivastava, A.; Tsimilli-Michael, M. Analysis of the chlorophyll a fluorescence transient. In Chlorophyll Fluorescence A Signature of Photosynthesis, Advances in Photosynthesis and Respiration; Papageorgiou, G., Govindjee, Eds.; Springer: Dordrecht, The Netherlands, 2004; Volume 19, pp. 321–362. [Google Scholar]
- Lange, C.A.; Weissflog, L.; Strasser, R.J.; Krueger, G.H.J.; Pfennigsdorff, A. Phytotoxic effects of trichloroacetic acid on Scots pine and birch determined by chl a fluorescence and the JIP-test. S. Afr. J. Bot. 2004, 70, 683–694. [Google Scholar] [CrossRef] [Green Version]
- Smit, M.F.; van Heerden, P.D.R.; Pienaar, J.J.; Weissflog, L.; Strasser, R.J.; Krüger, G.H.J. Effect of trifluoroacetate, a persistent degradation product of fluorinated hydrocarbons, on Phaseolus vulgaris and Zea mays. Plant Physiol. Biochem. 2009, 47, 623–634. [Google Scholar] [CrossRef]
- Lange, C.A.; Kotte, K.; Smit, M.; van Deventer, P.W.; van Rensburg, L. Effects of different soil ameliorants on Karee trees (Searsia lancea) growing on mine tailings dump soil—Part I: Pot trials. Int. J. Phytoremediat. 2012, 14, 908–924. [Google Scholar] [CrossRef] [PubMed]
- Strasser, R.J.; Srivastava, A.; Tsimilli-Michael, M. Screening the vitality and phytosynthetic activity of plants by fluorescence transient. In Crop Improvement for Food Security; Behl, R.K., Punia, M.S., Lather, B.P.S., Eds.; SSARM: Hisar, India, 1999; pp. 72–115. [Google Scholar]
- Goulas, Y.; Cerovic, Z.G.; Cartelat, A.; MOYA, I. Dualex: A new instrument for field measurements of epidermal ultraviolet absorbance by chlorophyll fluorescence. Appl. Opt. 2004, 43, 4488–4496. [Google Scholar] [CrossRef] [PubMed]
- Blackmer, T.M.; Schepers, J.S. Use of a chlorophyll meter to monitor N status and schedule fertigation of corn. J. Prod. Agric. 1995, 8, 56–60. [Google Scholar] [CrossRef]
- Meyer, S.; Cerovic, Z.G.; Goulas, Y.; Montpied, P.; Desmotes-Mainard, S.; Bidel, L.; Moya, I.; Dreyer, E. Relationships between optically assessed polyphenols and chlorophyll content and the dry mass per leaf area of woody plants: A signature of the carbon and nitrogen balance within leaf? Plant Cell Environ. 2006, 29, 1338–1348. [Google Scholar] [CrossRef]
- Tremblay, N.; Bélec, C.; Jenni, S.; Fortier, E.; Mellgren, R. The Dualex—A new tool to determine nitrogen sufficiency in broccoli. Acta Hort. 2009, 824, 121–132. [Google Scholar] [CrossRef]
- Ketterings, Q.M.; Coe, R.; van Noordwijk, M.; Ambagu, Y.; Palm, C.A. Reducing uncertainty in the use of allometric biomass equations for predicting above-ground tree biomass in mixed secondary forests. For. Ecol. Manag. 2001, 146, 199–209. [Google Scholar] [CrossRef]
- Röhle, H.; Hartmann, K.-U.; Steinke, C.; Murach, D. Leistungsvermögen und Leistungserfassung von Kurzumtriebsbeständen. In Anbau und Nutzung von Bäumen auf landwirtschaftlichen Flächen; Reeg, T., Bemmann, A., Emmann, A., Konold, W., Murach, D., Spiecker, H., Eds.; Wiley-VCH: Weinheim, Germany, 2009; pp. 41–55. [Google Scholar]
- Carl, C.; Biber, P.; Landgraf, D.; Buras, A.; Pretzsch, H. Allometric models to predict aboveground woody biomass of black locust (Robinia pseudoacacia L.) in short rotation coppice in previous mining and agricultural areas in Germany. Forests 2017, 8, 328. [Google Scholar] [CrossRef] [Green Version]
- Knoche, D.; Lange, C. Verbundvorhaben: Züchtung schnell wachsender Baumarten der Gattungen Populus, Robinia und Salix für die Produktion nachwachsender Rohstoffe im Kurzumtrieb (FastWOOD III). Teilvorhaben 7: Frühdiagnose der ökophysiologischen Leistungsfähigkeit von Robinien (Robinia pseudoacacia L.) heimischer Bestände (FIB-Forschungsinstitut für Bergbaufolgelandschaften e.V.); Förderkennzeichen 22001014, Schlussbericht 2018; FIB-Forschungsinstitut für Bergbaufolgelandschaften e.V.: Finsterwalde, Germany, 2018; pp. 1–109. [Google Scholar] [CrossRef]
- Knoche, D.; Lange, C.; Engel, J. Short-rotation management of black locust (Robinia pseudoacacia L.) in the federal state of Brandenburg, Germany. In Novel Methods and Results of Landscape Research in Europe, Central Asia and Siberia; Sychev, V.G., Mueller, L., Eds.; Landscape Planning, Management and Rehabilitation: FGBNU “VNII agrochimii”: Moscow, Russia, 2018; Volume 5, pp. 101–104. [Google Scholar]
- Kanzler, M.; Böhm, C.; Freese, D. Impact of P fertilisation on the growth performance of black locust (Robinia pseudoacacia L.) in a lignite post-mining area in Germany. Ann. For. Res. 2015, 58, 39–54. [Google Scholar] [CrossRef]
- Heinsdorf, D. Ergebnisse eines Nährstoffmangelversuches zur Robinie (Robinia pseudoacacia L.) auf Kipprohboden. Beiträge Forstwirtsch. 1987, 21, 13–17. [Google Scholar]
- Mantovani, D.; Veste, M.; Boldt-Burisch, K.; Fritsch, S.; Koning, L.; Freese, D. Carbon allocation, nodulation, and biological nitrogen fixation of black locust (Robinia pseudoacacia L.) under soil water limitation. Ann. For. Res. 2015, 58, 259–274. [Google Scholar] [CrossRef]
- Mantovani, D.; Veste, M.; Freese, D. Black locust (Robinia pseudoacacia L.) ecophysiological and morphological adaptations to drought and their consequence on biomass production and water use efficiency. N. Z. J. For. Sci. 2014, 44, 29. [Google Scholar] [CrossRef] [Green Version]
- Bhusal, N.; Lee, M.; Lee, H.; Adhikari, A.; Han, A.R.; Han, A.; Kim, H.S. Evaluation of morphological, physiological, and biochemical traits for assessing drought resistance in eleven tree species. Sci. Total Environ. 2021, 779, 146466. [Google Scholar] [CrossRef] [PubMed]
- Seserman, D.-M.; Pohle, I.; Veste, M.; Freese, D. Simulating Climate Change Impacts on Hybrid-Poplar and Black Locust Short Rotation Coppices. Forests 2018, 9, 419. [Google Scholar] [CrossRef] [Green Version]
- Mantovani, D.; Veste, M.; Böhm, C.; Vignudelli, M.; Freese, D. Spatial and temporal variation of drought impact on black locust (Robinia pseudoacacia L.) water status and growth. iForest 2015, 8, 743–747. [Google Scholar] [CrossRef] [Green Version]
Figure 1.
Map and aerial image showing our test plot in the north of lignite surface mine Welzow-Süd, photo taken on 12 April 2018.
Figure 1.
Map and aerial image showing our test plot in the north of lignite surface mine Welzow-Süd, photo taken on 12 April 2018.
Figure 2.
Test design, comprising 4 (B, F, G, L) out of a total of 12 test subplots. Per test unit, 5 out of 9 Robinia test plants were used in our investigations (see [
8]).
Figure 2.
Test design, comprising 4 (B, F, G, L) out of a total of 12 test subplots. Per test unit, 5 out of 9 Robinia test plants were used in our investigations (see [
8]).
Figure 3.
PIABS mean values and standard deviation of Black Locust clones and provenances during the growth season 2015 at clonal test plot Welzow.
Figure 3.
PIABS mean values and standard deviation of Black Locust clones and provenances during the growth season 2015 at clonal test plot Welzow.
Figure 4.
PIABS mean values and standard deviation of Black Locust clones and provenances during the growth season 2016 at clonal test plot Welzow.
Figure 4.
PIABS mean values and standard deviation of Black Locust clones and provenances during the growth season 2016 at clonal test plot Welzow.
Figure 5.
Bivariate scatter plot illustrating the K-to-Ca-antagonism, i.e., a negative relationship between K and Ca concentration in leaves of Black Locust trees growing on clonal test plot Welzow.
Figure 5.
Bivariate scatter plot illustrating the K-to-Ca-antagonism, i.e., a negative relationship between K and Ca concentration in leaves of Black Locust trees growing on clonal test plot Welzow.
Figure 6.
Regression analysis between NBI and N content (left) and between NBI and P concentration (right) in Robinia leaves.
Figure 6.
Regression analysis between NBI and N content (left) and between NBI and P concentration (right) in Robinia leaves.
Figure 7.
Plant height growth through the years 2014–2019 of ten Robinia test units. Note that one bar usually comprised 20 Robinia test trees per origin and per year.
Figure 7.
Plant height growth through the years 2014–2019 of ten Robinia test units. Note that one bar usually comprised 20 Robinia test trees per origin and per year.
Figure 8.
Biomass growth [Mg dry matter ha−1] through the years 2014–2019 of different Robinia test units; data given in small boxes represent individual average increment of biomass [Mg dry matter ha−1] in 6 years of time.
Figure 8.
Biomass growth [Mg dry matter ha−1] through the years 2014–2019 of different Robinia test units; data given in small boxes represent individual average increment of biomass [Mg dry matter ha−1] in 6 years of time.
Table 1.
Soil chemical composition of two identified mining substrates [
11] related to the Robinia clonal test plot.
Table 1.
Soil chemical composition of two identified mining substrates [
11] related to the Robinia clonal test plot.
| | | | | | | | 10% HCl Extraction |
|---|
Substrate
No. | pH
(CaCl2) | Ctot
[%] | Ntot
[%] | C/N | Stot
[%] | CaCO3
[%] | CaO
[mg kg−1] | MgO
[mg kg−1] | K2O
[mg kg−1] | P2O5
[mg kg−1] |
|---|
| 1 | 3.8 | 0.62 | 0.016 | 38.8 | 0.07 | <0.1 | 865 | 443 | 430 | 94 |
| 2 | 4.1 | 2.07 | 0.027 | 76.7 | 0.04 | <0.1 | 1617 | 753 | 634 | 144 |
Table 2.
Experimental set up for testing different Black Locust clones and provenances. The background colour is highlighting the 10 test units actually investigated in the study (10 of 15 in total).
Table 2.
Experimental set up for testing different Black Locust clones and provenances. The background colour is highlighting the 10 test units actually investigated in the study (10 of 15 in total).
| No. | Name | Test Unit | Origin | Remarks |
|---|
| 1 | Bendida | Ben | Bulgaria | selection by company Lignum |
| 2 | Tangra | Tan | Bulgaria | selection by company Lignum |
| 3 | Fraport 1 | Fra1 | Hesse (GER) | identical to “Nyrségi” |
| 4 | Fraport 2 | Fra2 | Hesse (GER) | identical to “Jázkiséri” |
| 5 | Fraport 3 | Fra3 | Hesse (GER) | |
| 6 | Langen | Lan | Forest district Langen (GER) | |
| 7 | Habichtborn | Hab | Arboretum Habichtborn (GER) | clone “Appalachia 4183” |
| 8 | Robert | Rob | Brandenburg (GER) | Forest Hasenholz |
| 9 | Roger | Rog | Brandenburg (GER) | Forest Hasenholz |
| 10 | Romy | Rom | Brandenburg (GER) | Forest Buckow |
| 11 | Rowena | Row | Brandenburg (GER) | Forest Bollersdorf |
| 12 | Roy | Roy | Brandenburg (GER) | Forest Waldsieversdorf |
| 15 | Kiskunsagi | Kis | Hungary | origin: seed stocks |
| 22 | Schöneiche | Schö | Brandenburg (GER) | origin: seed stocks |
| 23 | Cuci | Cuc | Romania | origin: seed stocks |
Table 3.
Determination methods used for leaf sample analysis.
Table 3.
Determination methods used for leaf sample analysis.
| Parameter | Test Method | Detection Limit | Dimension |
|---|
| Sample preparation | VDLUFA Bd.III 2.1.1 (1983) | | |
| Sample preparation | VDLUFA Bd. III 2.2.1–2.2.4 (1976) | | |
| Ntot | DIN ISO 13878 (1998-11) | 0.005 | % |
| Ctot | DIN ISO 10694 (1996-08) | 0.02 | % |
Nitric acid pressure
digestion (microwave) | EPA Method 3052 (1996-12) | | |
| Ca | DIN EN ISO 11885 (E22, 2009-09) | 0.01 | g kg−1 |
| Mg | DIN EN ISO 11885 (E22, 2009-09) | 0.002 | g kg−1 |
| K | DIN EN ISO 11885 (E22, 2009-09) | 0.01 | g kg−1 |
| P | DIN EN ISO 11885 (E22, 2009-09) | 0.005 | g kg−1 |
| Water/moisture content | VDLUFA Bd. III 3.1 (1976) | 0.1 | % |
Table 4.
Monthly sum of rainfall [mm] and average air temperature [°C] throughout the years 2014–2019. Data recorded at FIB weather station Welzow, Brandenburg, Germany. The background colour is a stylistic instruments.
Table 4.
Monthly sum of rainfall [mm] and average air temperature [°C] throughout the years 2014–2019. Data recorded at FIB weather station Welzow, Brandenburg, Germany. The background colour is a stylistic instruments.
| | Precipitation [mm] | Air Temperature [°C] |
|---|
| | 2014 | 2015 | 2016 | 2017 | 2018 | 2019 | 2014 | 2015 | 2016 | 2017 | 2018 | 2019 |
|---|
| January | 18.4 | 60.6 | 40.4 | 23.6 | 40.9 | 56.3 | 0.8 | 2.8 | −0.3 | −2.4 | 3.2 | 0.6 |
| February | 13.5 | 5.2 | 46.3 | 32.4 | 4.7 | 30.6 | 4.6 | 1.3 | 3.6 | 2.0 | −2.6 | 3.5 |
| March | 24.9 | 38.0 | 30.6 | 37.8 | 27.1 | 47.2 | 7.4 | 5.7 | 4.3 | 6.9 | 1.4 | 7.0 |
| April | 20.1 | 28.9 | 35.6 | 24.2 | 31.3 | 12.3 | 11.3 | 8.9 | 8.5 | 7.9 | 13.5 | 10.4 |
| May | 102.3 | 23.9 | 29.3 | 29.0 | 31.6 | 61.0 | 13.3 | 13.5 | 14.8 | 14.7 | 16.7 | 12.3 |
| June | 41.5 | 57.2 | 97.9 | 106.4 | 11.5 | 7.6 | 17.0 | 16.3 | 18.6 | 18.5 | 19.0 | 22.5 |
| July | 100.7 | 62.2 | 84.9 | 112.3 | 33.0 | 36.9 | 20.7 | 20.1 | 19.2 | 19.0 | 20.7 | 20.0 |
| August | 124.9 | 21.6 | 39.3 | 74.4 | 26.8 | 24.9 | 17.1 | 22.1 | 17.9 | 19.0 | 21.4 | 20.5 |
| September | 79.6 | 68.7 | 8.2 | 27.0 | 35.0 | 31.3 | 15.6 | 14.0 | 16.8 | 13.3 | 16.0 | 14.8 |
| October | 55.8 | 42.2 | 71.0 | 64.2 | 20.5 | 34.3 | 12.0 | 8.0 | 8.6 | 11.7 | 11.1 | 11.2 |
| November | 6.5 | 68.2 | 35.4 | 47.3 | 13.6 | 20.6 | 6.7 | 7.6 | 3.6 | 5.5 | 5.4 | 6.2 |
| December | 36.6 | 16.8 | 39.6 | 41.7 | 69.1 | 26.9 | 2.6 | 6.6 | 2.1 | 2.9 | 4.3 | 4.2 |
| Year (Jan–Dec) | 624.8 | 493.5 | 558.5 | 620.3 | 345.1 | 389.9 | 10.8 | 10.6 | 9.8 | 9.9 | 10.9 | 11.1 |
| Veg. (Apr–Oct) | 524.9 | 304.7 | 366.2 | 437.5 | 189.7 | 208.3 | 15.3 | 14.7 | 14.9 | 14.9 | 16.9 | 15.9 |
Table 5.
Mean values of Dualex® parameter determined on Robinia leaves of different clones and provenances at clonal test plot Welzow in 2015 and 2016.
Table 5.
Mean values of Dualex® parameter determined on Robinia leaves of different clones and provenances at clonal test plot Welzow in 2015 and 2016.
| | Chlorophyll [µg cm−2] | Flavonol [µg cm−2] | Anthocyanin [µg cm−2] | NBI |
|---|
| | 2015 | 2016 | 2015 | 2016 | 2015 | 2016 | 2015 | 2016 |
|---|
| Row | Avg | 37.6 | 34.3 | 1.58 | 1.22 | 0.025 | 0.004 | 24.1 | 28.6 |
| SD | 2.8 | 3.6 | 0.14 | 0.20 | 0.017 | 0.004 | 2.9 | 3.7 |
| Roy | Avg | 37.5 | 35.3 | 1.56 | 1.22 | 0.031 | 0.008 | 24.3 | 29.5 |
| SD | 2.9 | 3.8 | 0.10 | 0.20 | 0.016 | 0.009 | 2.6 | 4.3 |
| Rob | Avg | 37.0 | 37.2 | 1.68 | 1.49 | 0.049 | 0.023 | 22.2 | 25.7 |
| SD | 3.5 | 3.1 | 0.13 | 0.25 | 0.017 | 0.023 | 2.5 | 4.4 |
| Rog | Avg | 34.8 | 33.8 | 1.70 | 1.35 | 0.050 | 0.016 | 20.6 | 25.9 |
| SD | 2.5 | 3.8 | 0.12 | 0.27 | 0.023 | 0.017 | 2.2 | 4.2 |
| Romy | Avg | 39.5 | 38.3 | 1.71 | 1.48 | 0.025 | 0.007 | 23.1 | 26.5 |
| SD | 2.2 | 4.0 | 0.08 | 0.26 | 0.015 | 0.011 | 1.6 | 3.5 |
| Schö | Avg | 37.8 | 37.3 | 1.58 | 1.26 | 0.032 | 0.004 | 24.2 | 30.3 |
| SD | 3.3 | 3.7 | 0.12 | 0.20 | 0.018 | 0.008 | 2.8 | 4.0 |
| Fra3 | Avg | 35.5 | 32.5 | 1.56 | 1.33 | 0.038 | 0.017 | 23.0 | 25.3 |
| SD | 2.1 | 2.9 | 0.13 | 0.25 | 0.017 | 0.019 | 2.8 | 3.5 |
| Lan | Avg | 40.5 | 38.0 | 1.40 | 1.09 | 0.017 | 0.005 | 29.3 | 36.0 |
| SD | 3.5 | 4.5 | 0.11 | 0.20 | 0.012 | 0.008 | 4.1 | 6.4 |
| Kis | Avg | 38.0 | 35.3 | 1.53 | 1.11 | 0.026 | 0.003 | 25.1 | 32.6 |
| SD | 5.0 | 5.1 | 0.12 | 0.18 | 0.027 | 0.006 | 4.3 | 4.7 |
| Cuc | Avg | 38.2 | 36.8 | 1.63 | 1.31 | 0.033 | 0.010 | 23.7 | 29.3 |
| SD | 3.6 | 4.3 | 0.13 | 0.25 | 0.018 | 0.013 | 3.2 | 6.5 |
| All | Avg | 37.6 | 35.9 | 1.59 | 1.29 | 0.033 | 0.010 | 24.0 | 29.0 |
| | SD | 1.7 | 1.9 | 0.09 | 0.13 | 0.011 | 0.007 | 2.3 | 3.4 |
Table 6.
Results of the determination of plant nutrients in the leaf tissue of Robinia test trees taken on 10 August 2015 and 10 August 2016 at clonal test plot Welzow. The font colour and italics are stylistic instruments.
Table 6.
Results of the determination of plant nutrients in the leaf tissue of Robinia test trees taken on 10 August 2015 and 10 August 2016 at clonal test plot Welzow. The font colour and italics are stylistic instruments.
| | Ntot
[w.-%] | P
[w.-%] | K
[w.-%] | Ca
[w.-%] | Mg
[w.-%] | Stot
[w.-%] |
|---|
| | 2015 | 2016 | 2015 | 2016 | 2015 | 2016 | 2015 | 2016 | 2015 | 2016 | 2015 | 2016 |
|---|
| Row | 2.87 | 3.76 | 0.12 | 0.15 | 1.34 | 1.35 | 2.38 | 1.84 | 0.24 | 0.16 | 0.18 | 0.19 |
| Roy | 3.29 | 3.70 | 0.15 | 0.17 | 1.25 | 1.18 | 1.95 | 1.55 | 0.19 | 0.13 | 0.20 | 0.21 |
| Fra3 | 2.67 | 3.14 | 0.11 | 0.14 | 0.98 | 1.22 | 3.33 | 2.17 | 0.30 | 0.17 | 0.18 | 0.21 |
| Lan | 3.02 | 3.97 | 0.12 | 0.18 | 1.33 | 1.35 | 2.08 | 1.40 | 0.27 | 0.15 | 0.19 | 0.23 |
| Kis | 3.21 | 3.93 | 0.14 | 0.17 | 1.35 | 1.35 | 2.02 | 1.74 | 0.21 | 0.15 | 0.21 | 0.21 |
| Cuci | 3.16 | 3.55 | 0.13 | 0.16 | 1.26 | 1.17 | 2.13 | 1.76 | 0.27 | 0.15 | 0.25 | 0.23 |
| Mean | 3.04 | 3.67 | 0.13 | 0.16 | 1.25 | 1.27 | 2.32 | 1.74 | 0.25 | 0.15 | 0.20 | 0.21 |
| SD | 0.23 | 0.30 | 0.01 | 0.02 | 0.14 | 0.09 | 0.52 | 0.27 | 0.04 | 0.01 | 0.03 | 0.02 |
Table 7.
Ranking of major plant-physiological, biomass growth and quality parameters of ten Black Locust clones and provenances. The background colour is a stylistic instrument.
Table 7.
Ranking of major plant-physiological, biomass growth and quality parameters of ten Black Locust clones and provenances. The background colour is a stylistic instrument.
| | Row | Roy | Rob | Rog | Romy | Schö | Fra3 | Lan | Kis | Cuc |
|---|
| PIABS—photosynthetic vitality | 5 | 2 | 10 | 9 | 3 | 6 | 1 | 8 | 4 | 7 |
| Chlorophyll content | 8 | 7 | 5 | 9 | 2 | 3 | 10 | 1 | 6 | 4 |
| Phenol content | 3 | 4 | 10 | 9 | 6 | 5 | 6 | 1 | 2 | 6 |
| Nutrition supply (only N, P, K) | 4 | 2 | - | - | - | - | 6 | 3 | 1 | 5 |
| NBI—Nitrogen Balance Index | 6 | 4 | 9 | 10 | 7 | 3 | 8 | 1 | 2 | 5 |
| Height growth (2014–2019) | 2 | 6 | 10 | 3 | 9 | 4 | 1 | 8 | 5 | 7 |
| Height increment (2018–2019) | 1 | 2 | 9 | 5 | 8 | 3 | 4 | 10 | 6 | 7 |
| Total biomass formation (2014–2019) | 2 | 8 | 10 | 3 | 4 | 6 | 1 | 9 | 5 | 7 |
| Biomass increment (2018–2019) | 2 | 7 | 10 | 3 | 4 | 5 | 1 | 9 | 8 | 6 |
| Multiple stem formation 2019 | 3 | 6 | 5 | 2 | 1 | 6 | 6 | 9 | 10 | 4 |
| Evaluation stem quality 2019 | 7 | 3 | 9 | 5 | 2 | 4 | 1 | 8 | 10 | 5 |
| Final Rank | 1 | 5 | 10 | 6 | 4 | 2 | 2 | 9 | 7 | 8 |
| Publisher’s Note: MDPI stays neutral with regard to jurisdictional claims in published maps and institutional affiliations. |
© 2022 by the authors. Licensee MDPI, Basel, Switzerland. This article is an open access article distributed under the terms and conditions of the Creative Commons Attribution (CC BY) license (https://creativecommons.org/licenses/by/4.0/).


