
Analysis of the Genotype Interaction of Four-Year-Old Populus euramericana Using the BLUP-GGE Technique


Abstract
:1. Introduction
2. Materials and Methods
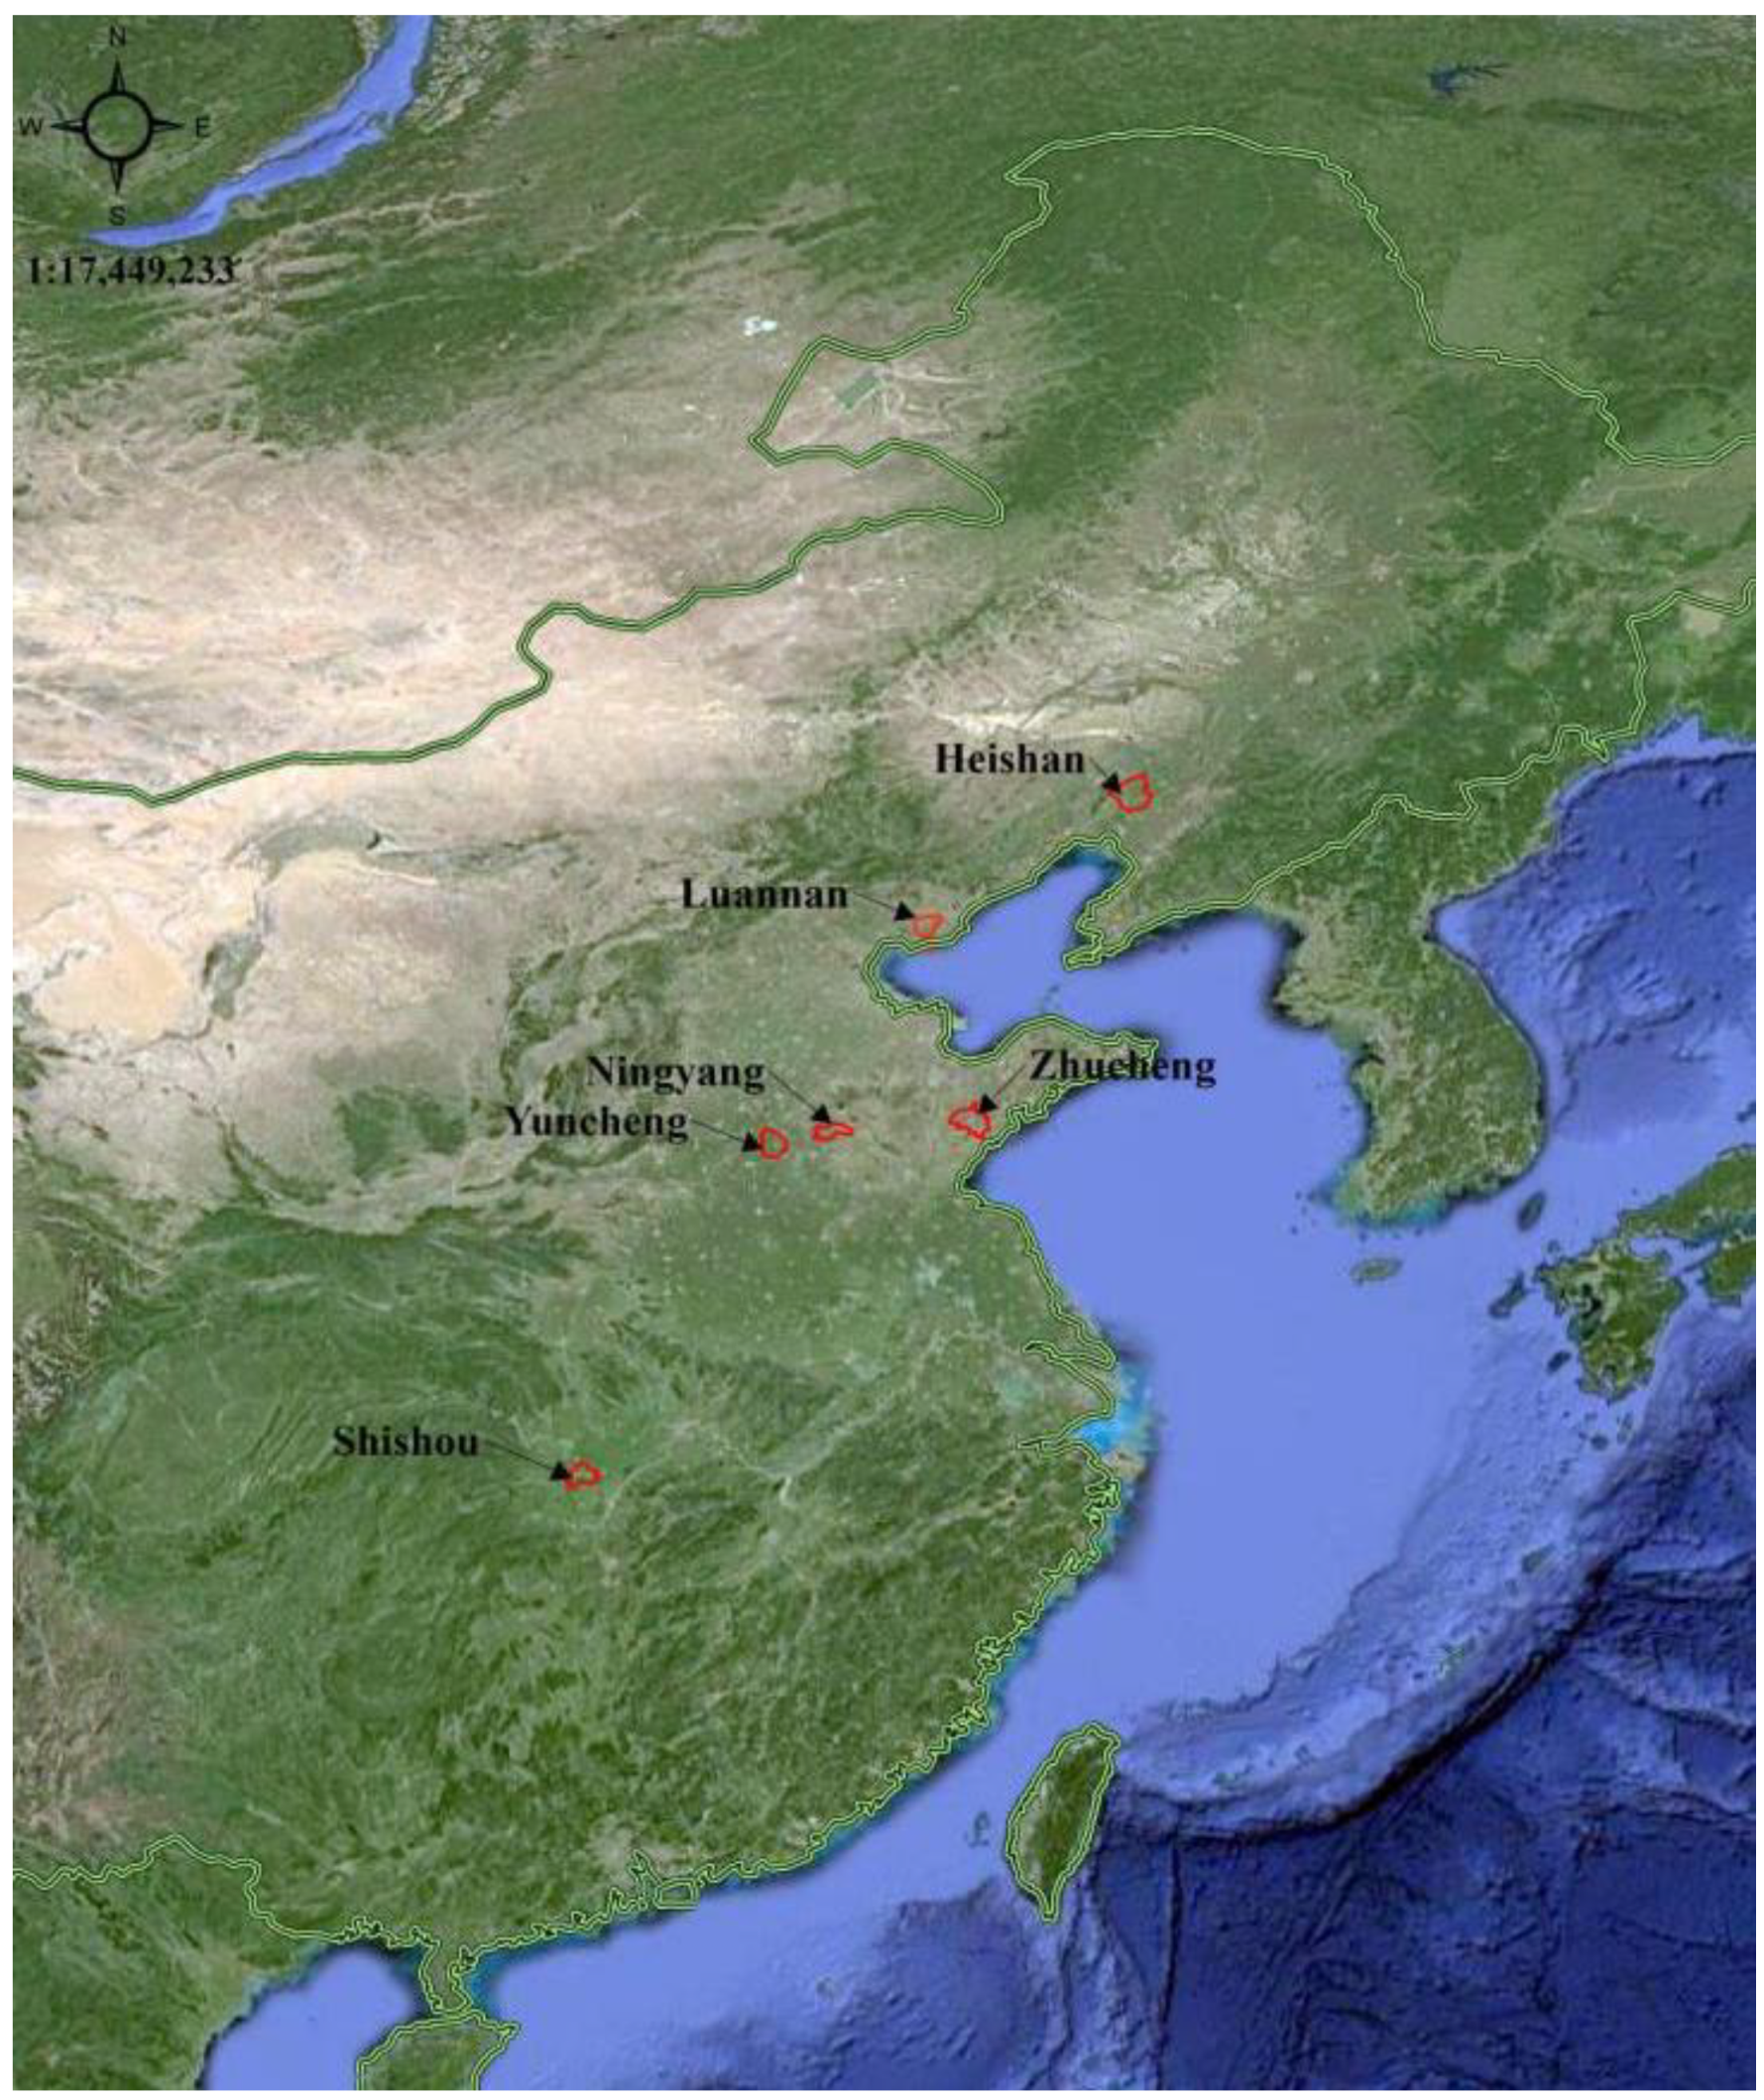
2.1. Test Sites and Conditions
2.2. Test Materials and Design
2.3. Measurements
2.4. Analysis
3. Results
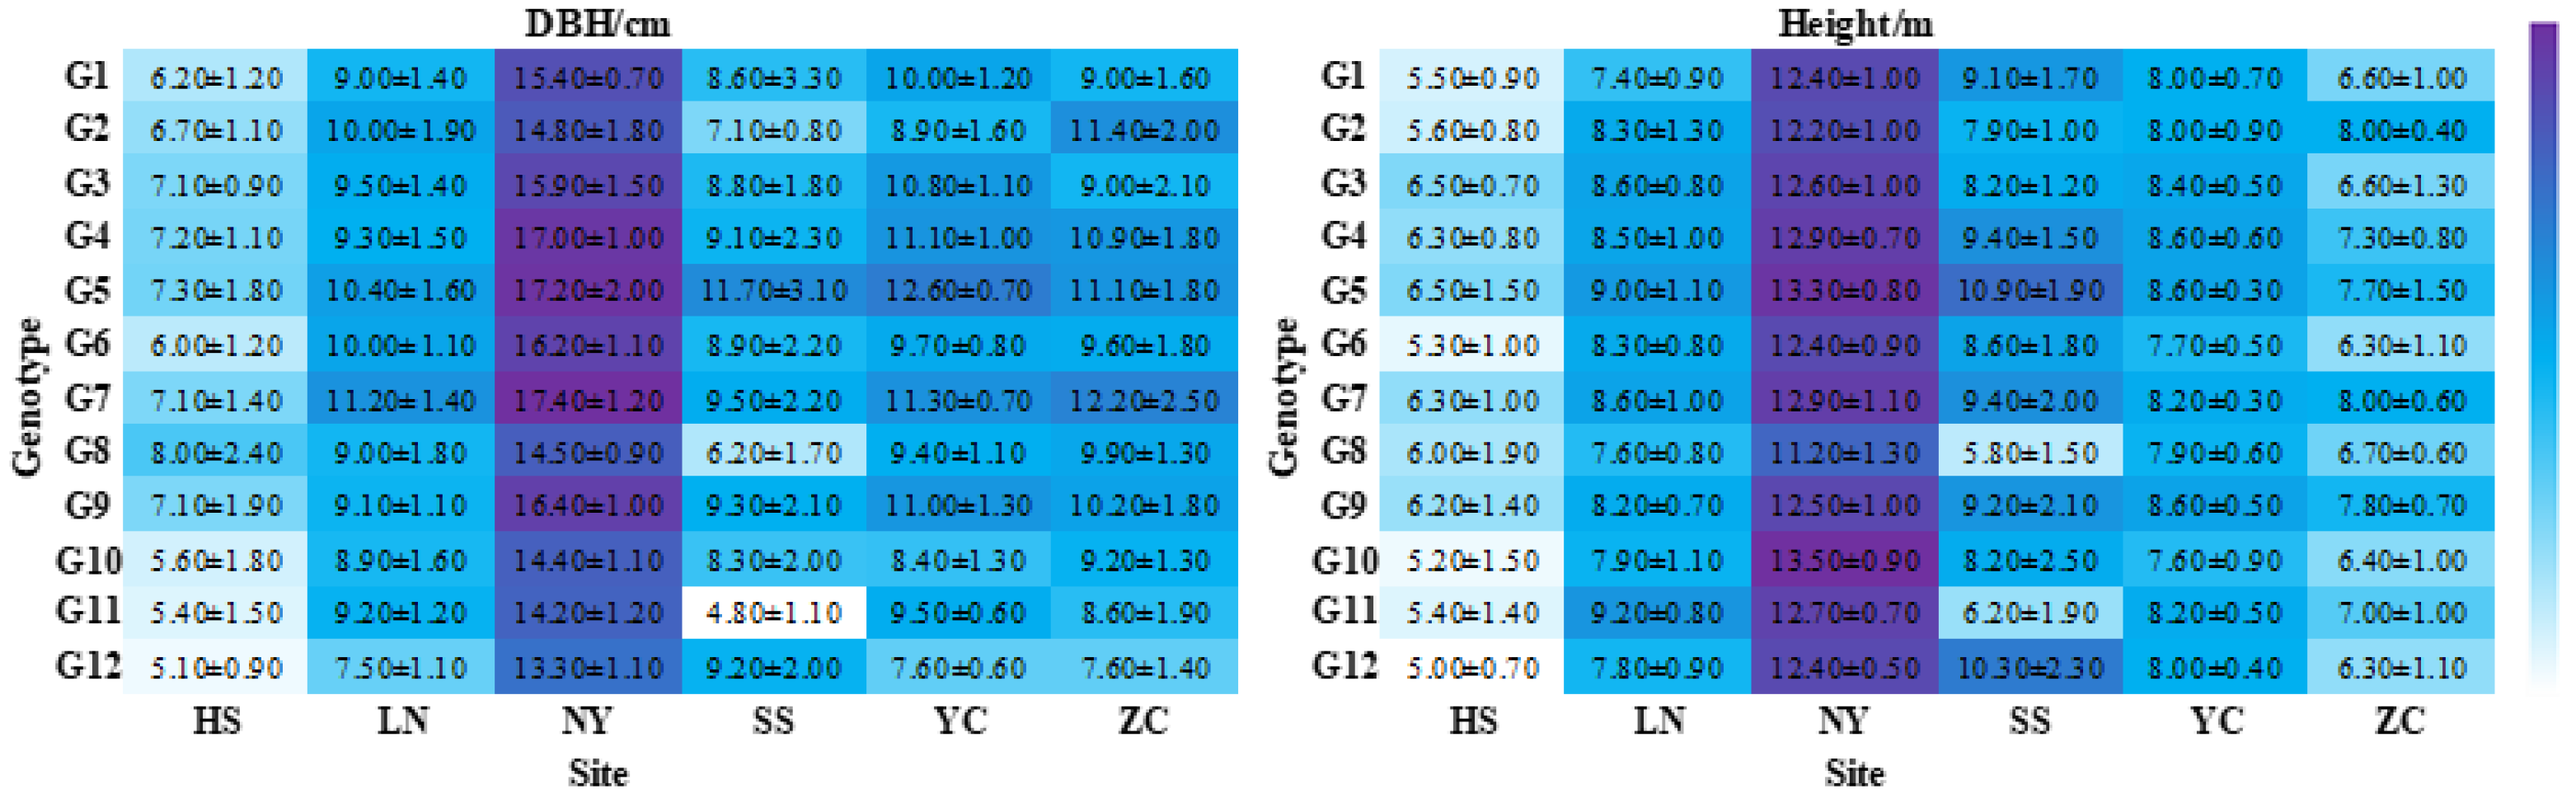
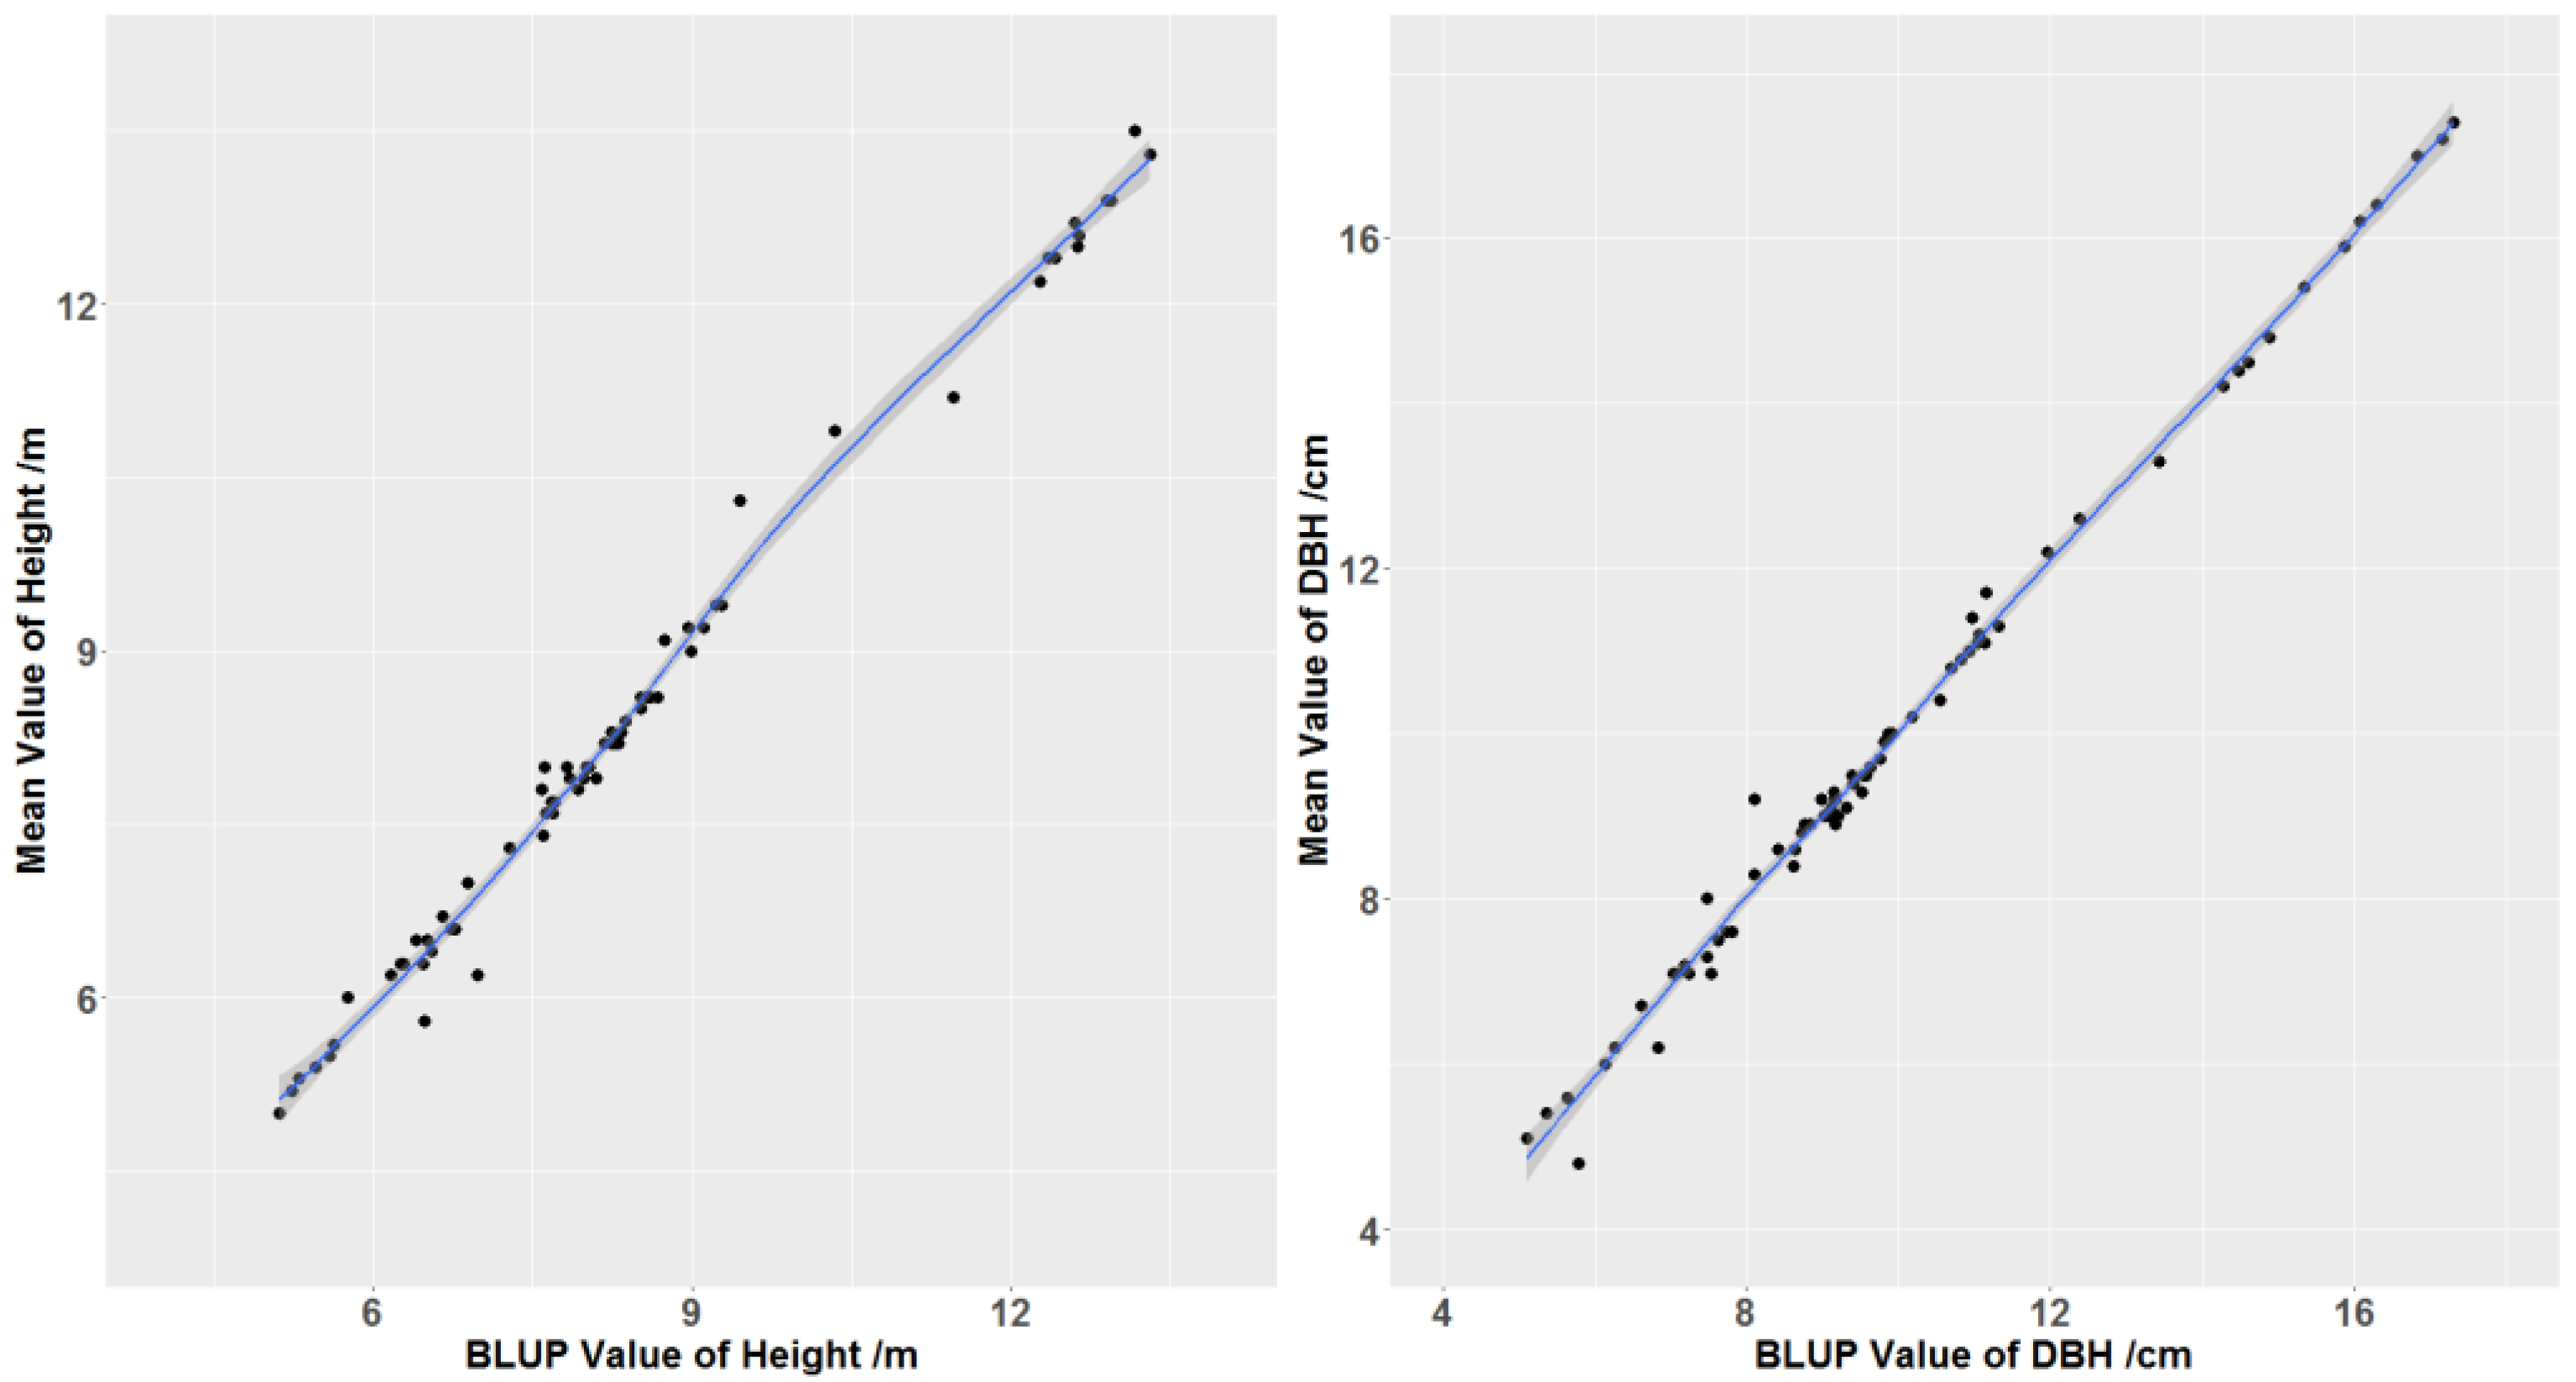
3.1. Statistics of Height and DBH Observations
3.2. Six Sites
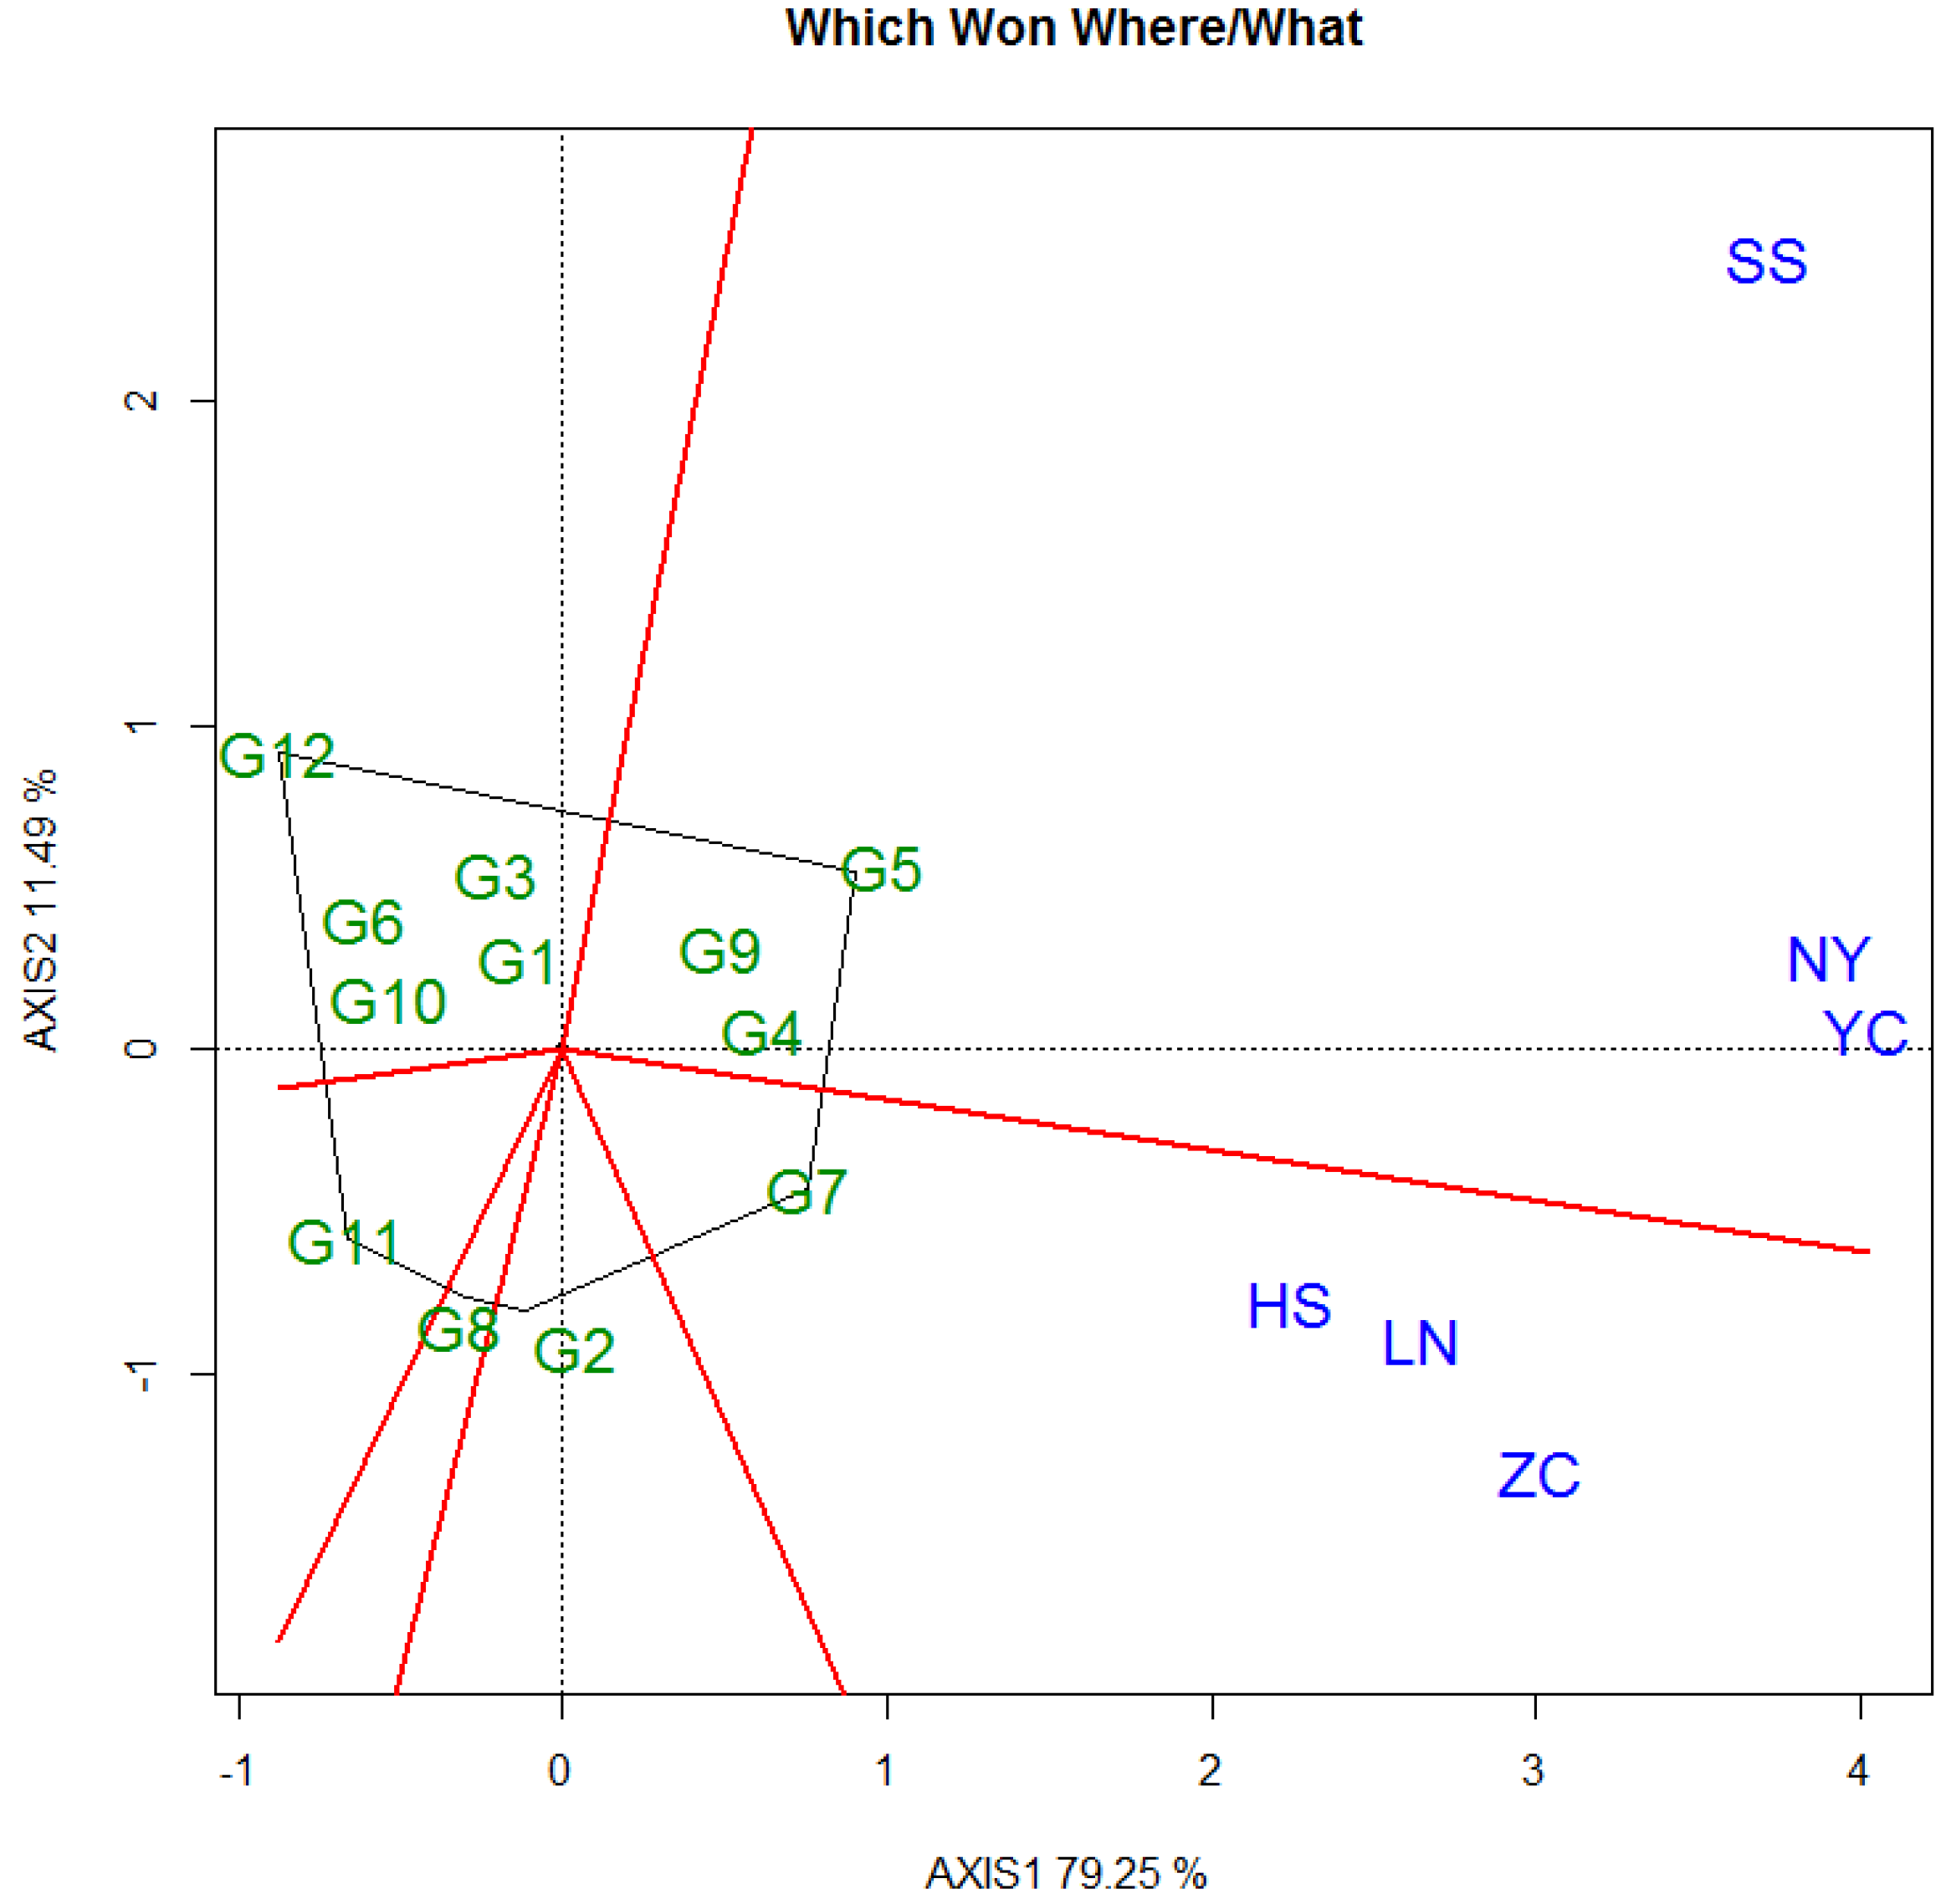
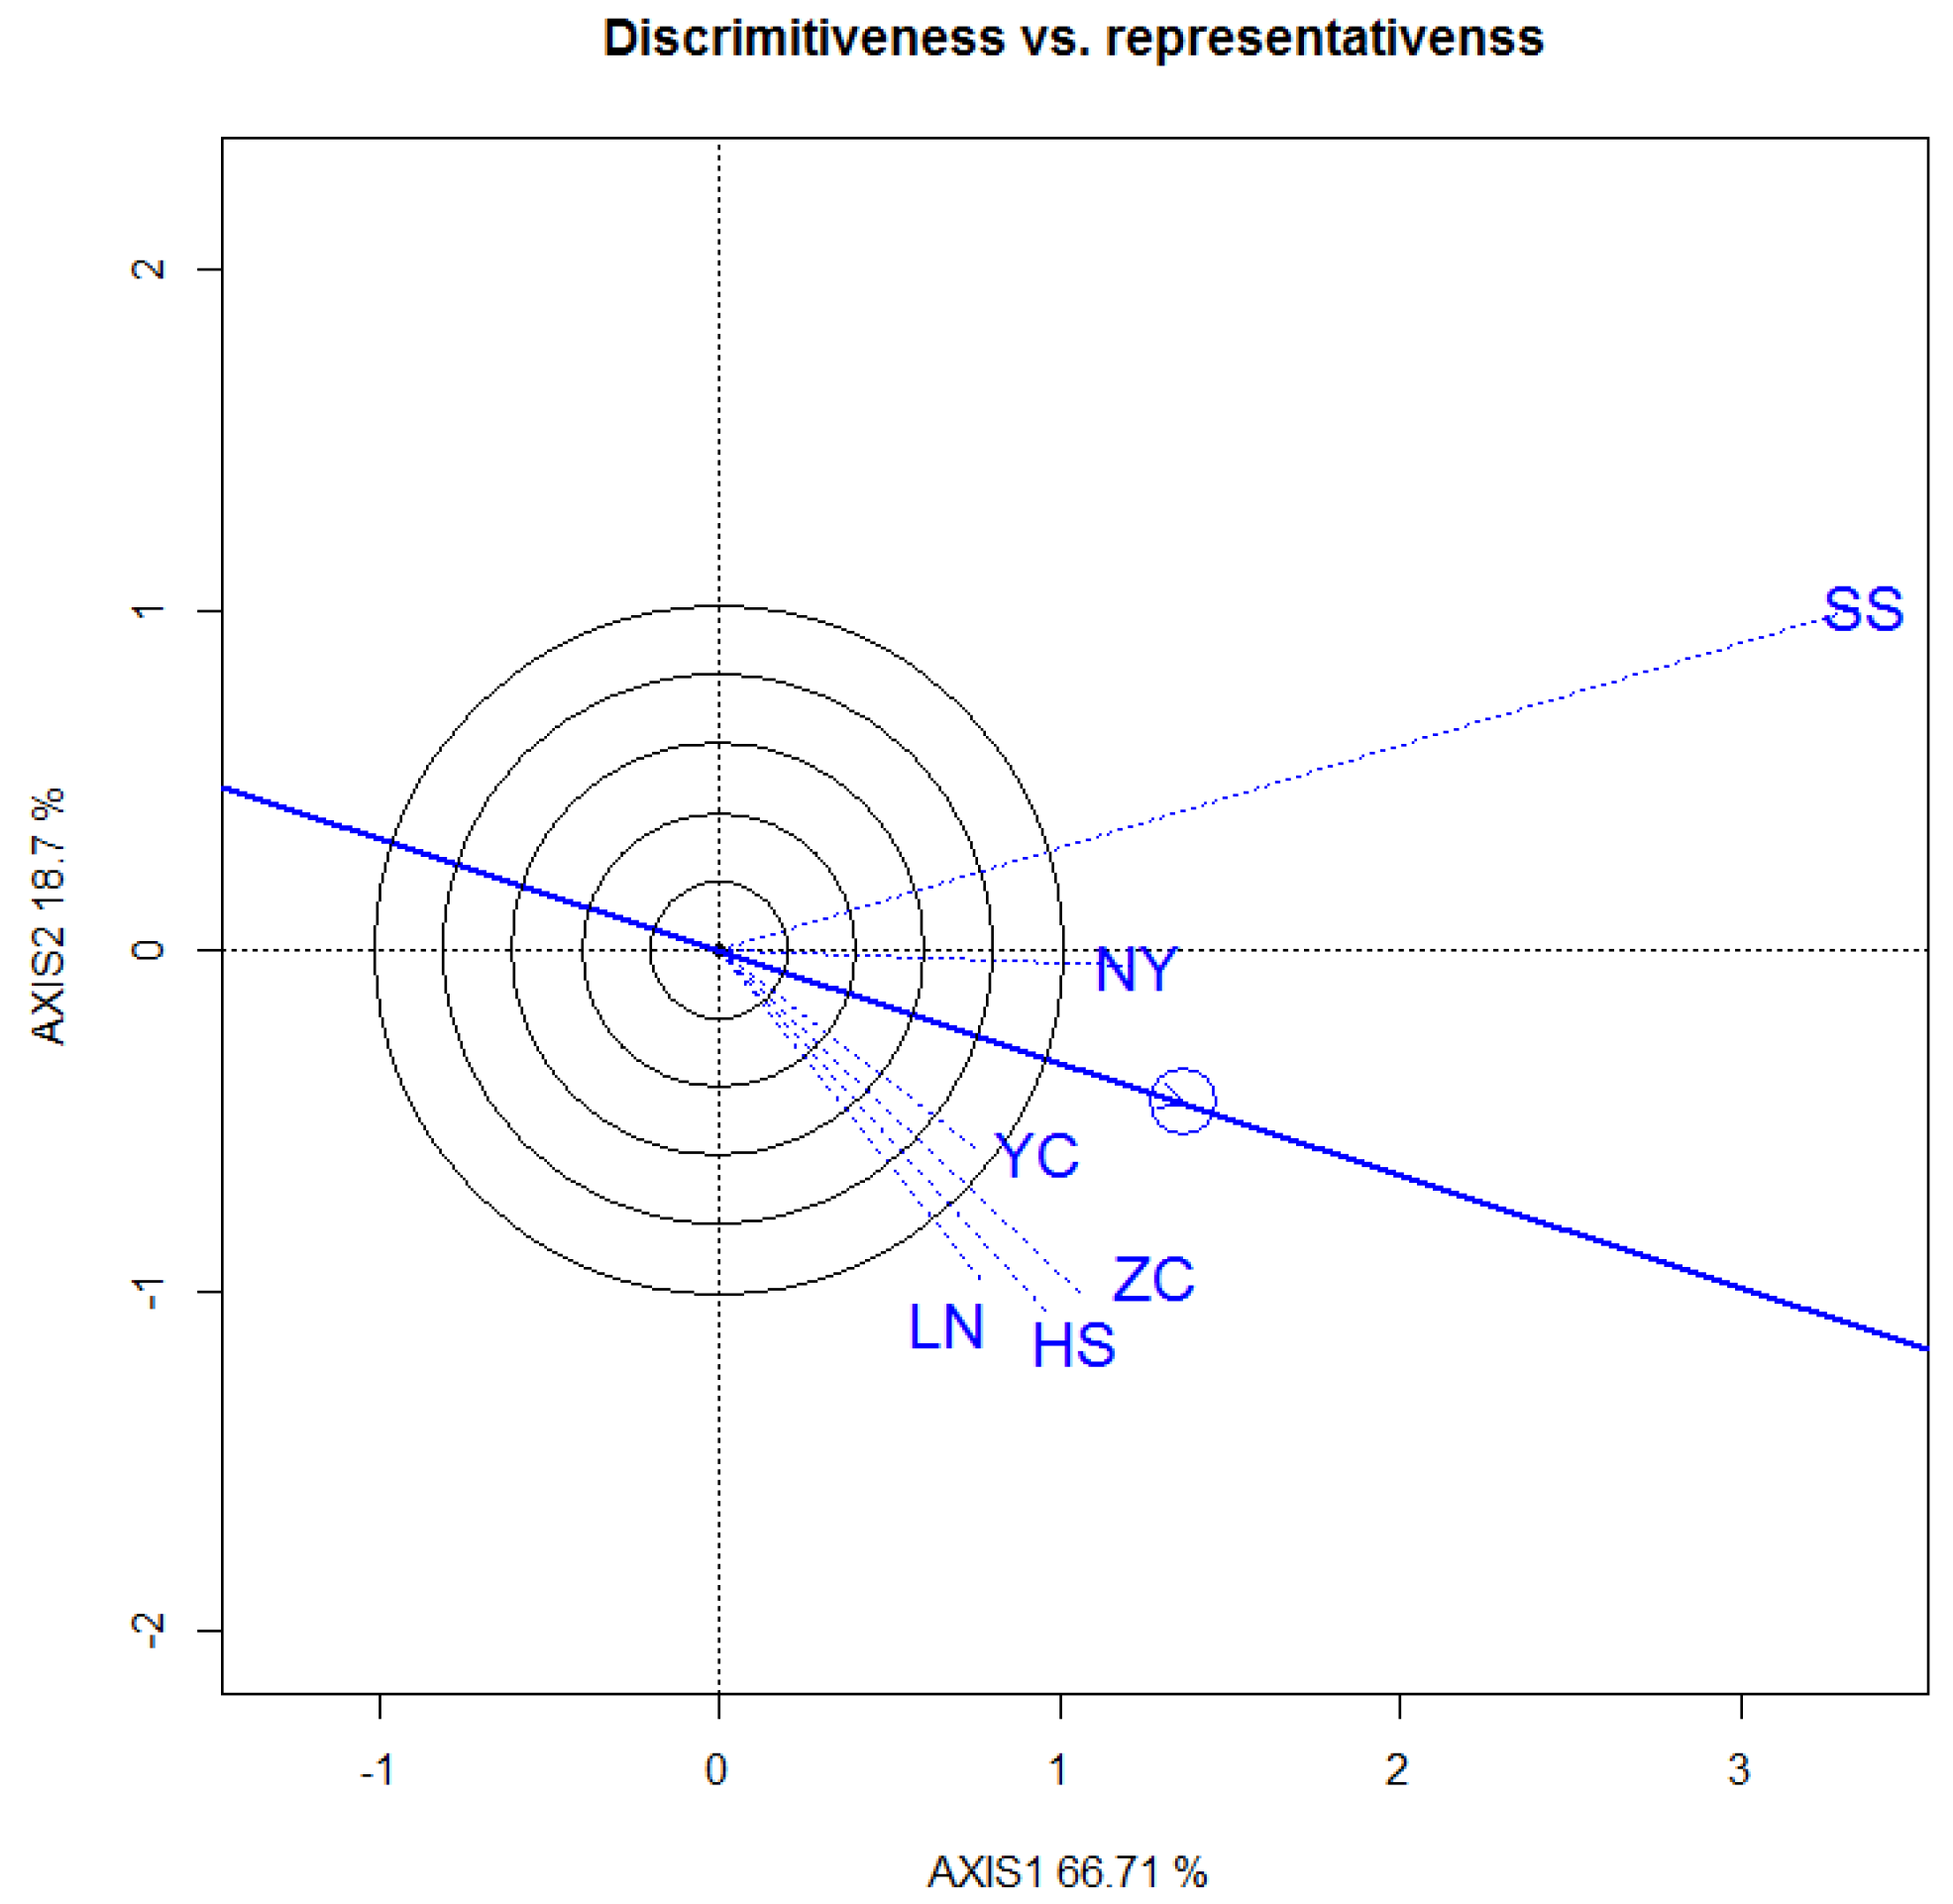
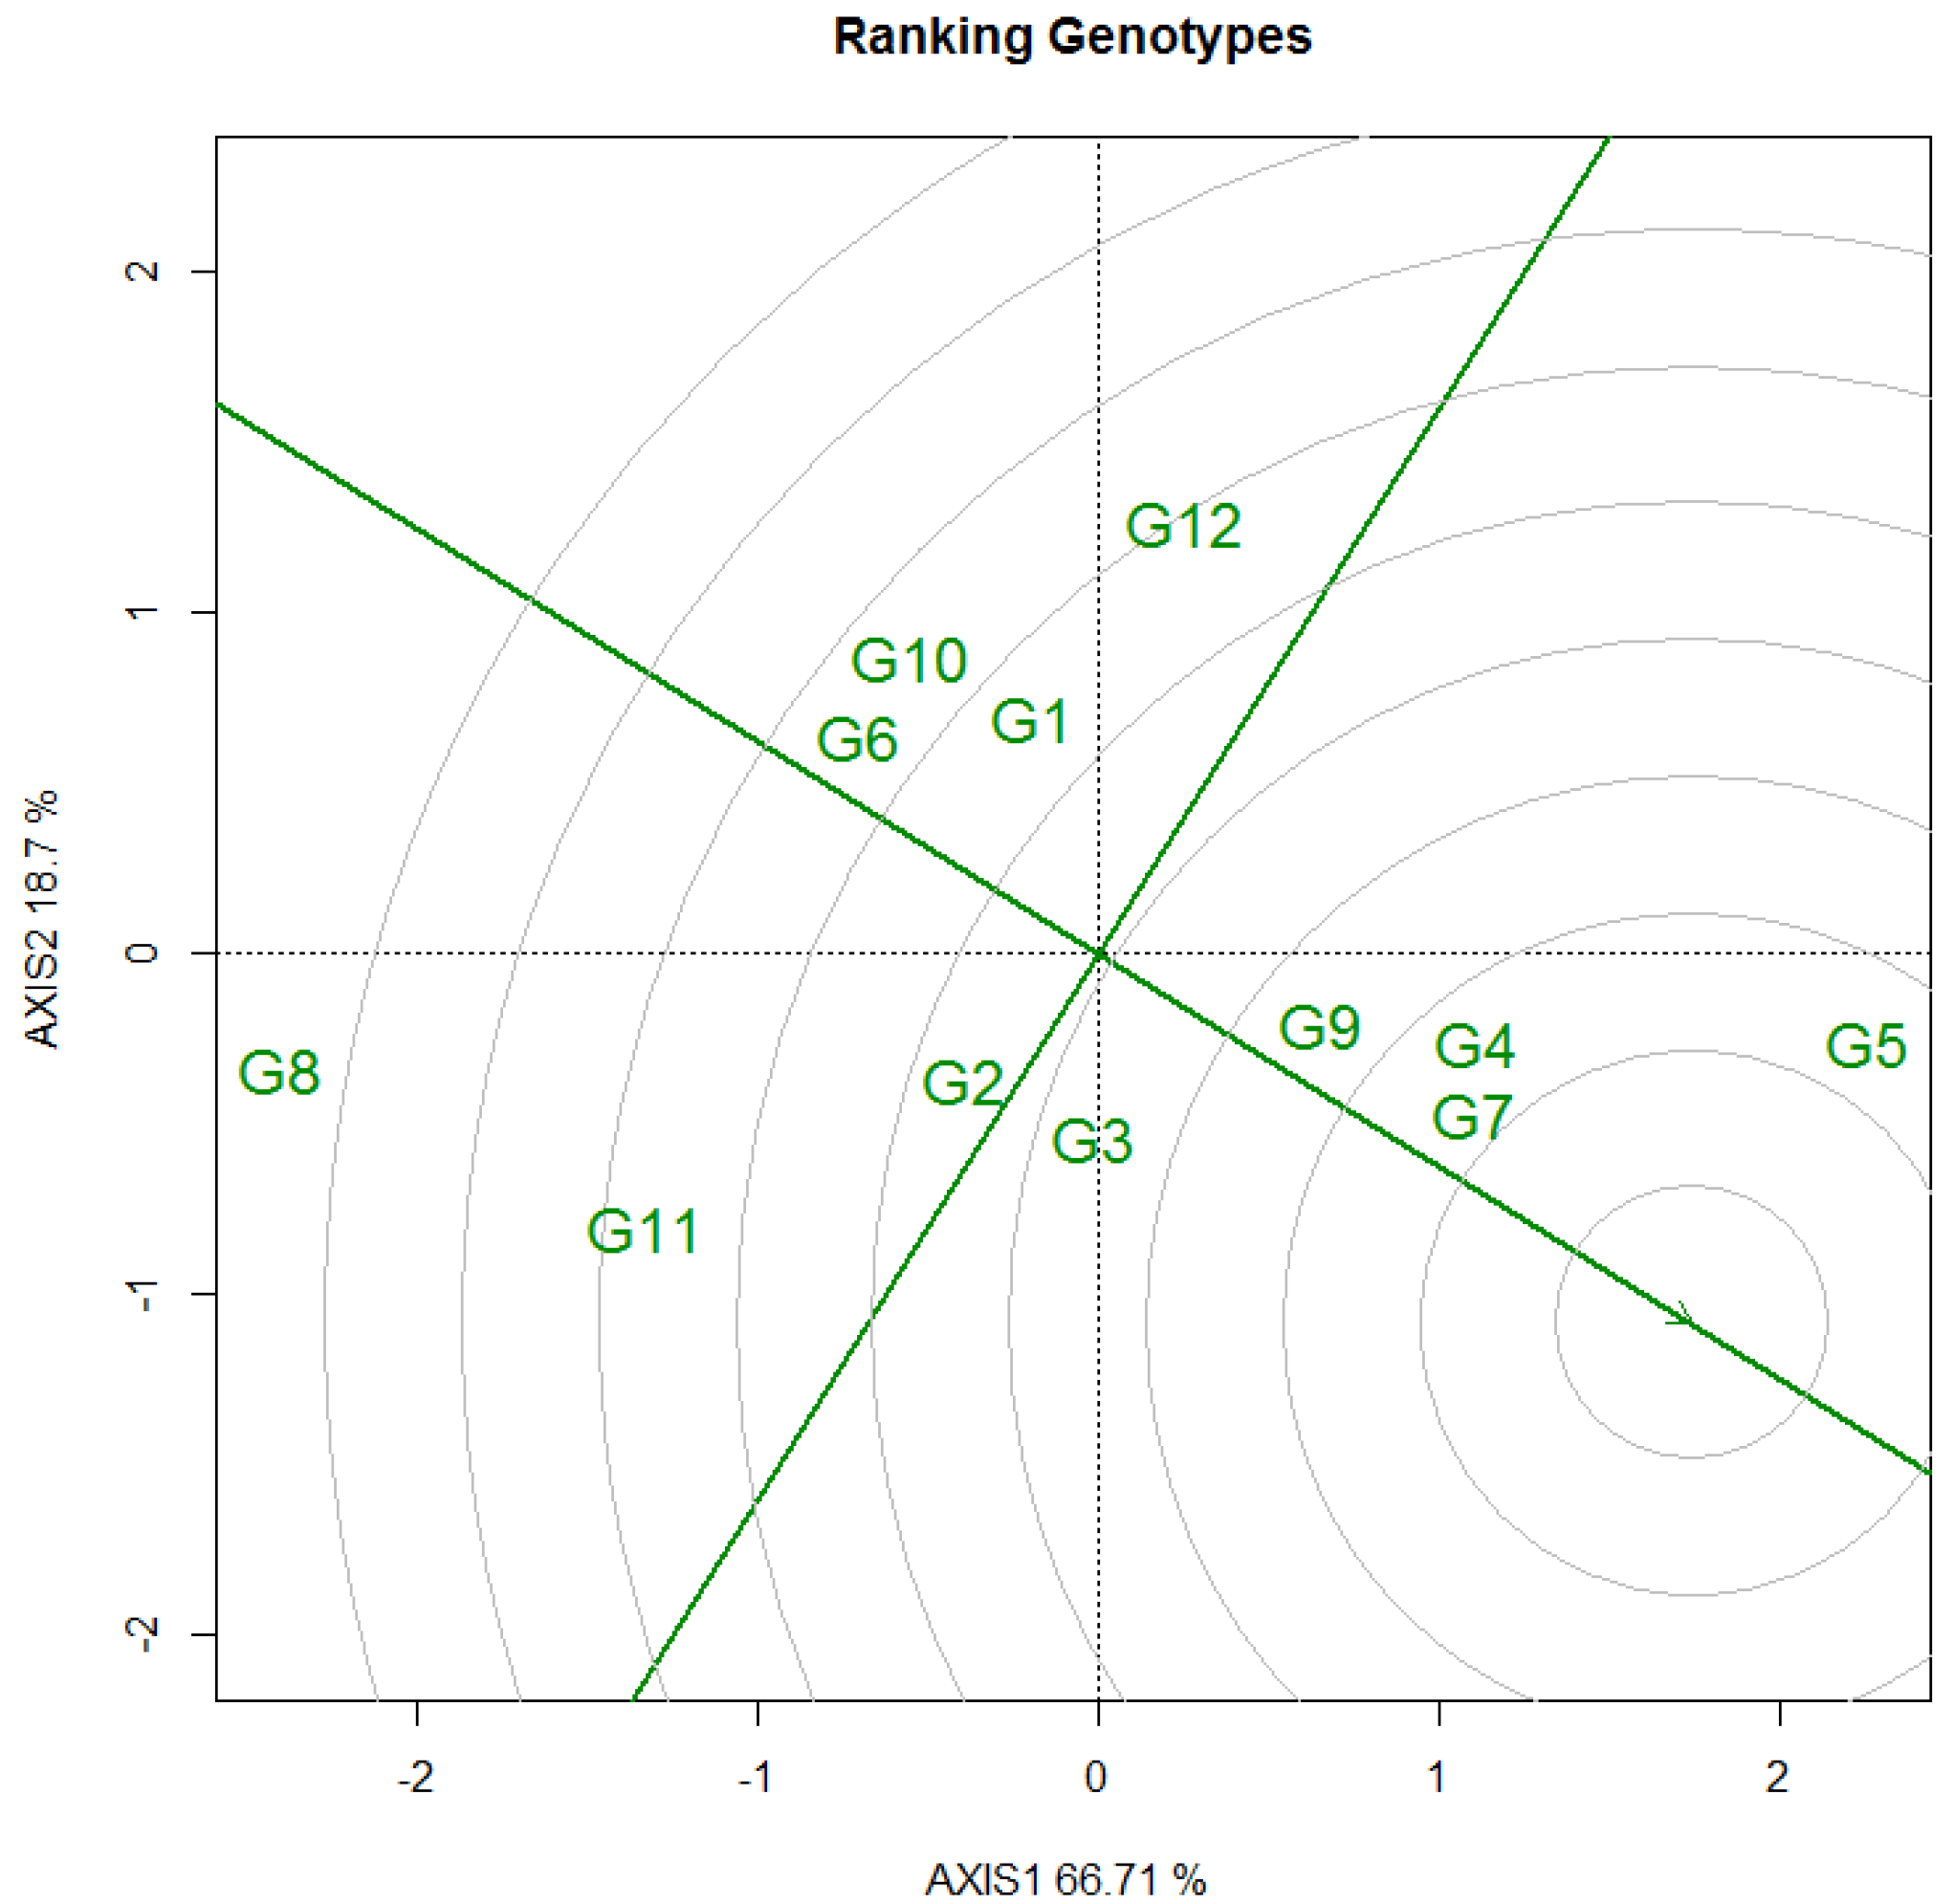
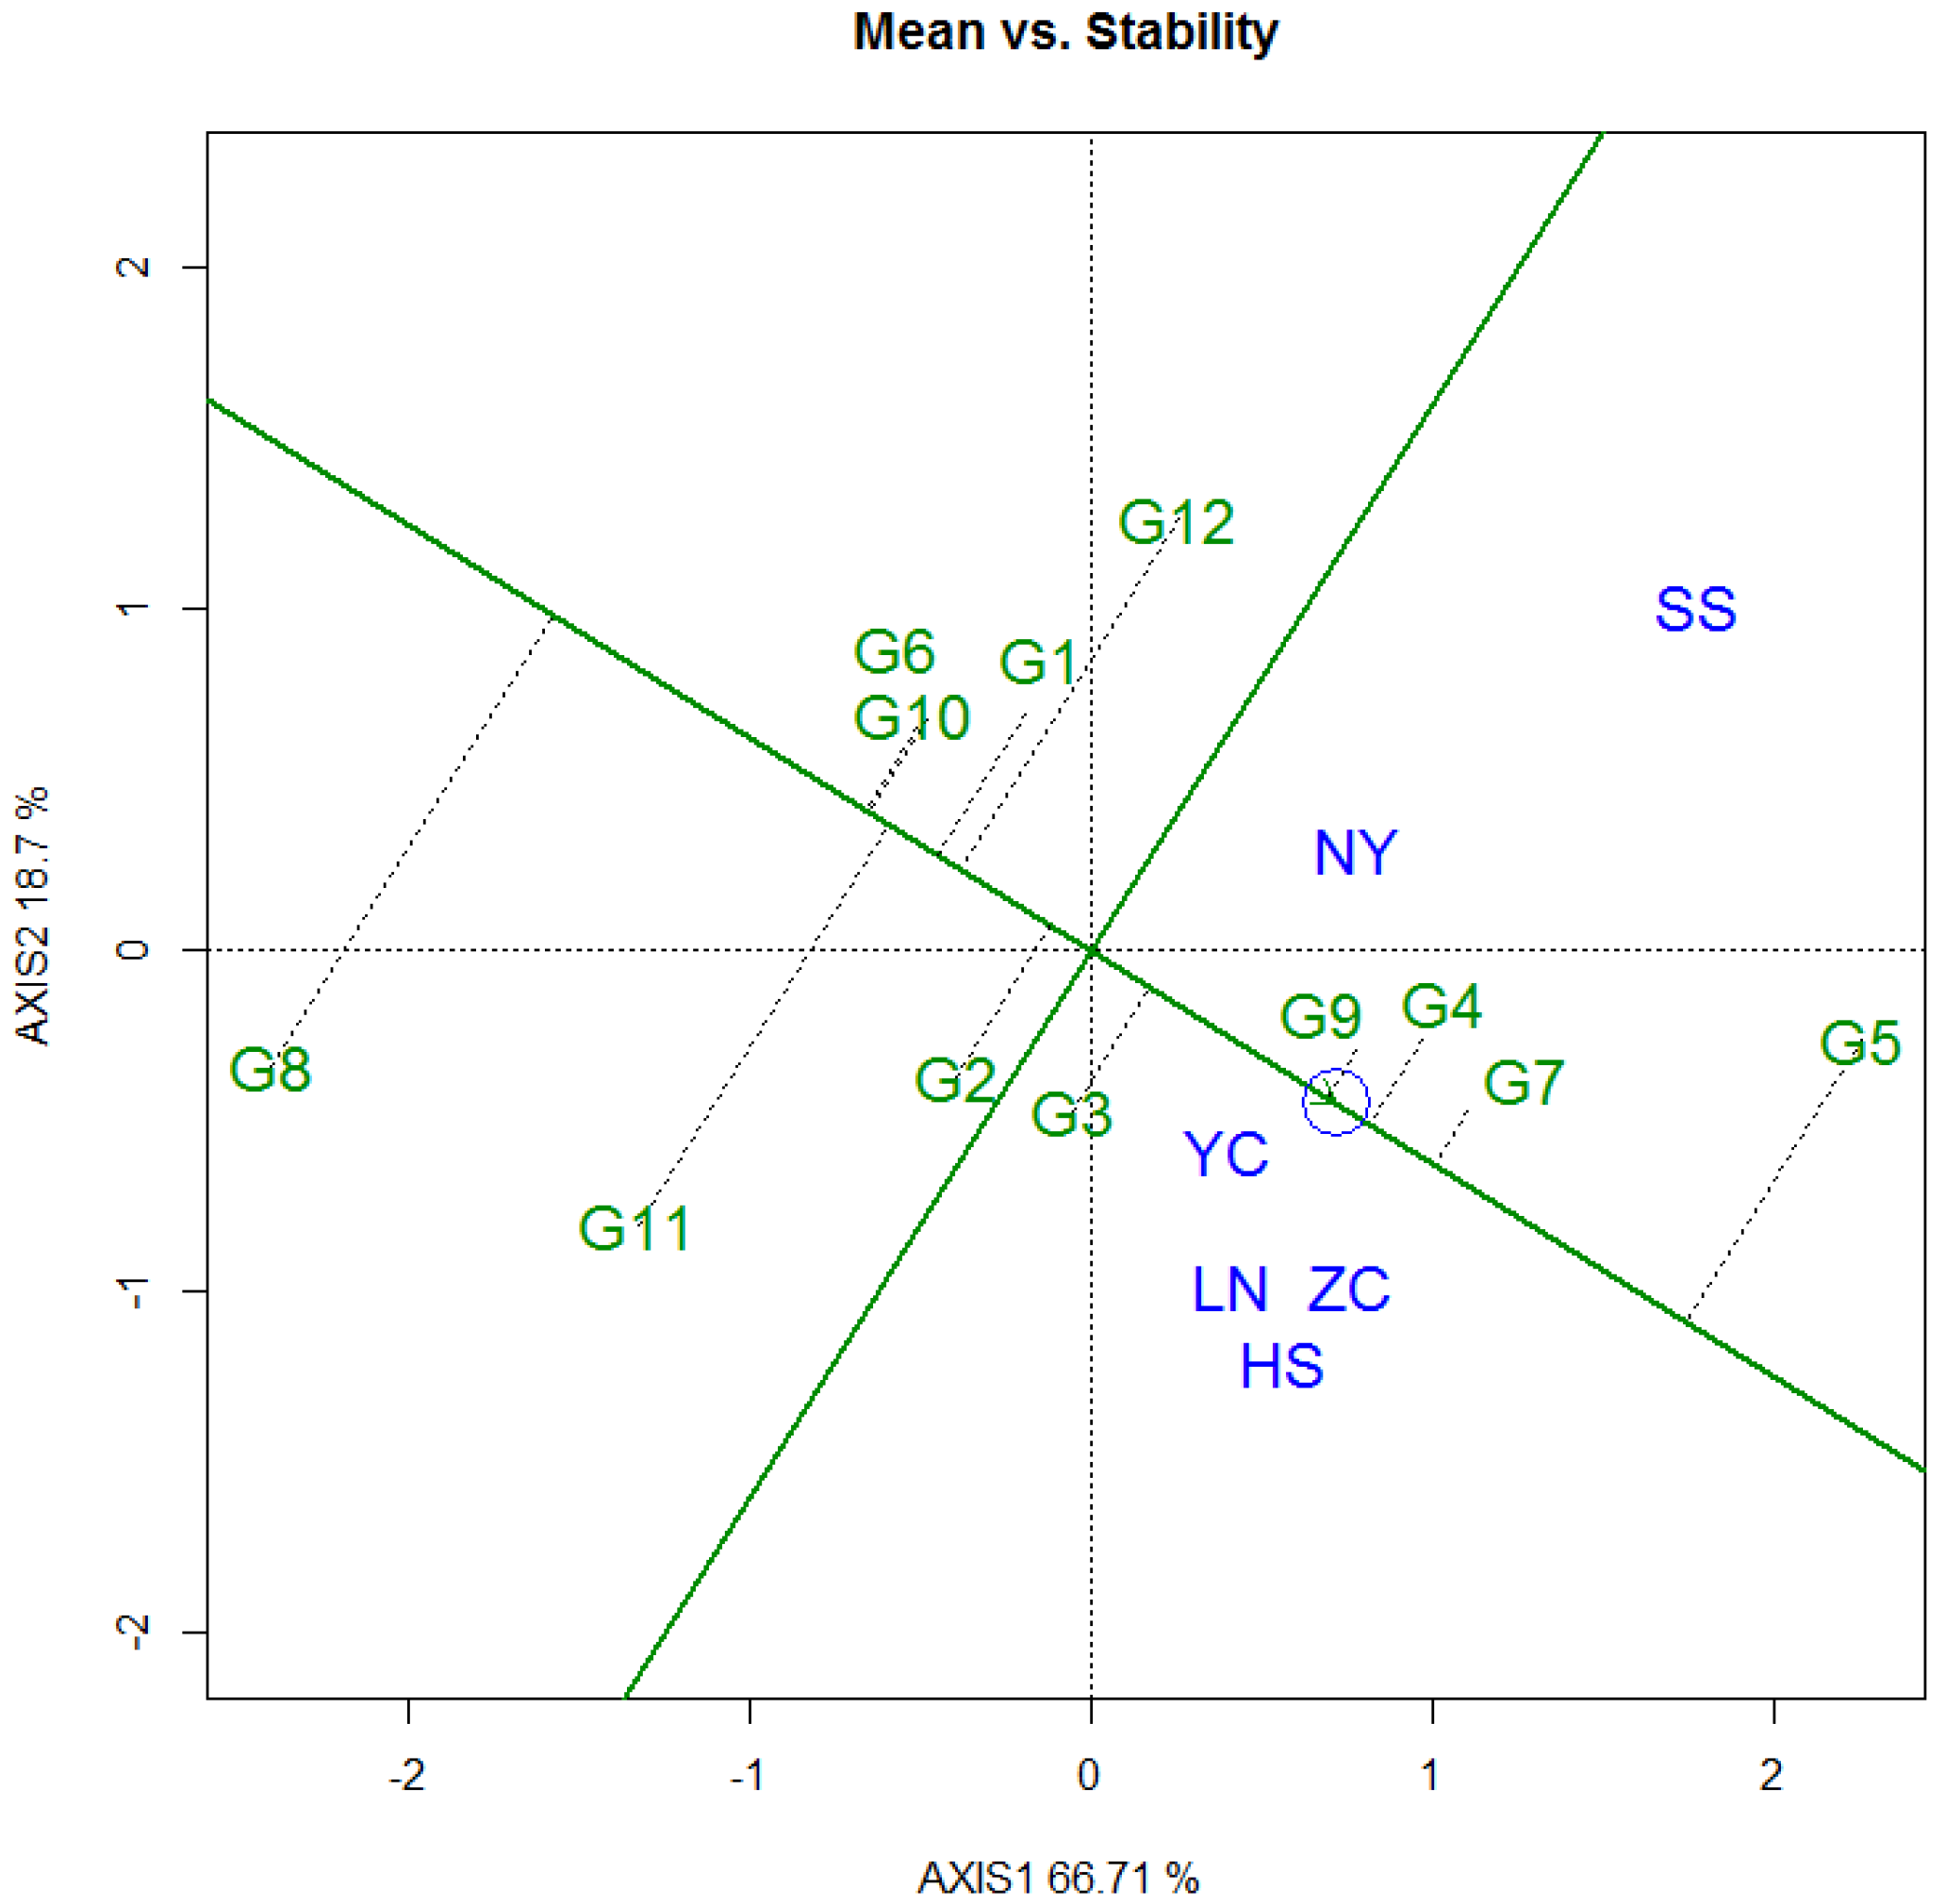
3.3. Selecton of 12 Genotypes by GGE Biplot
3.3.1. DBH
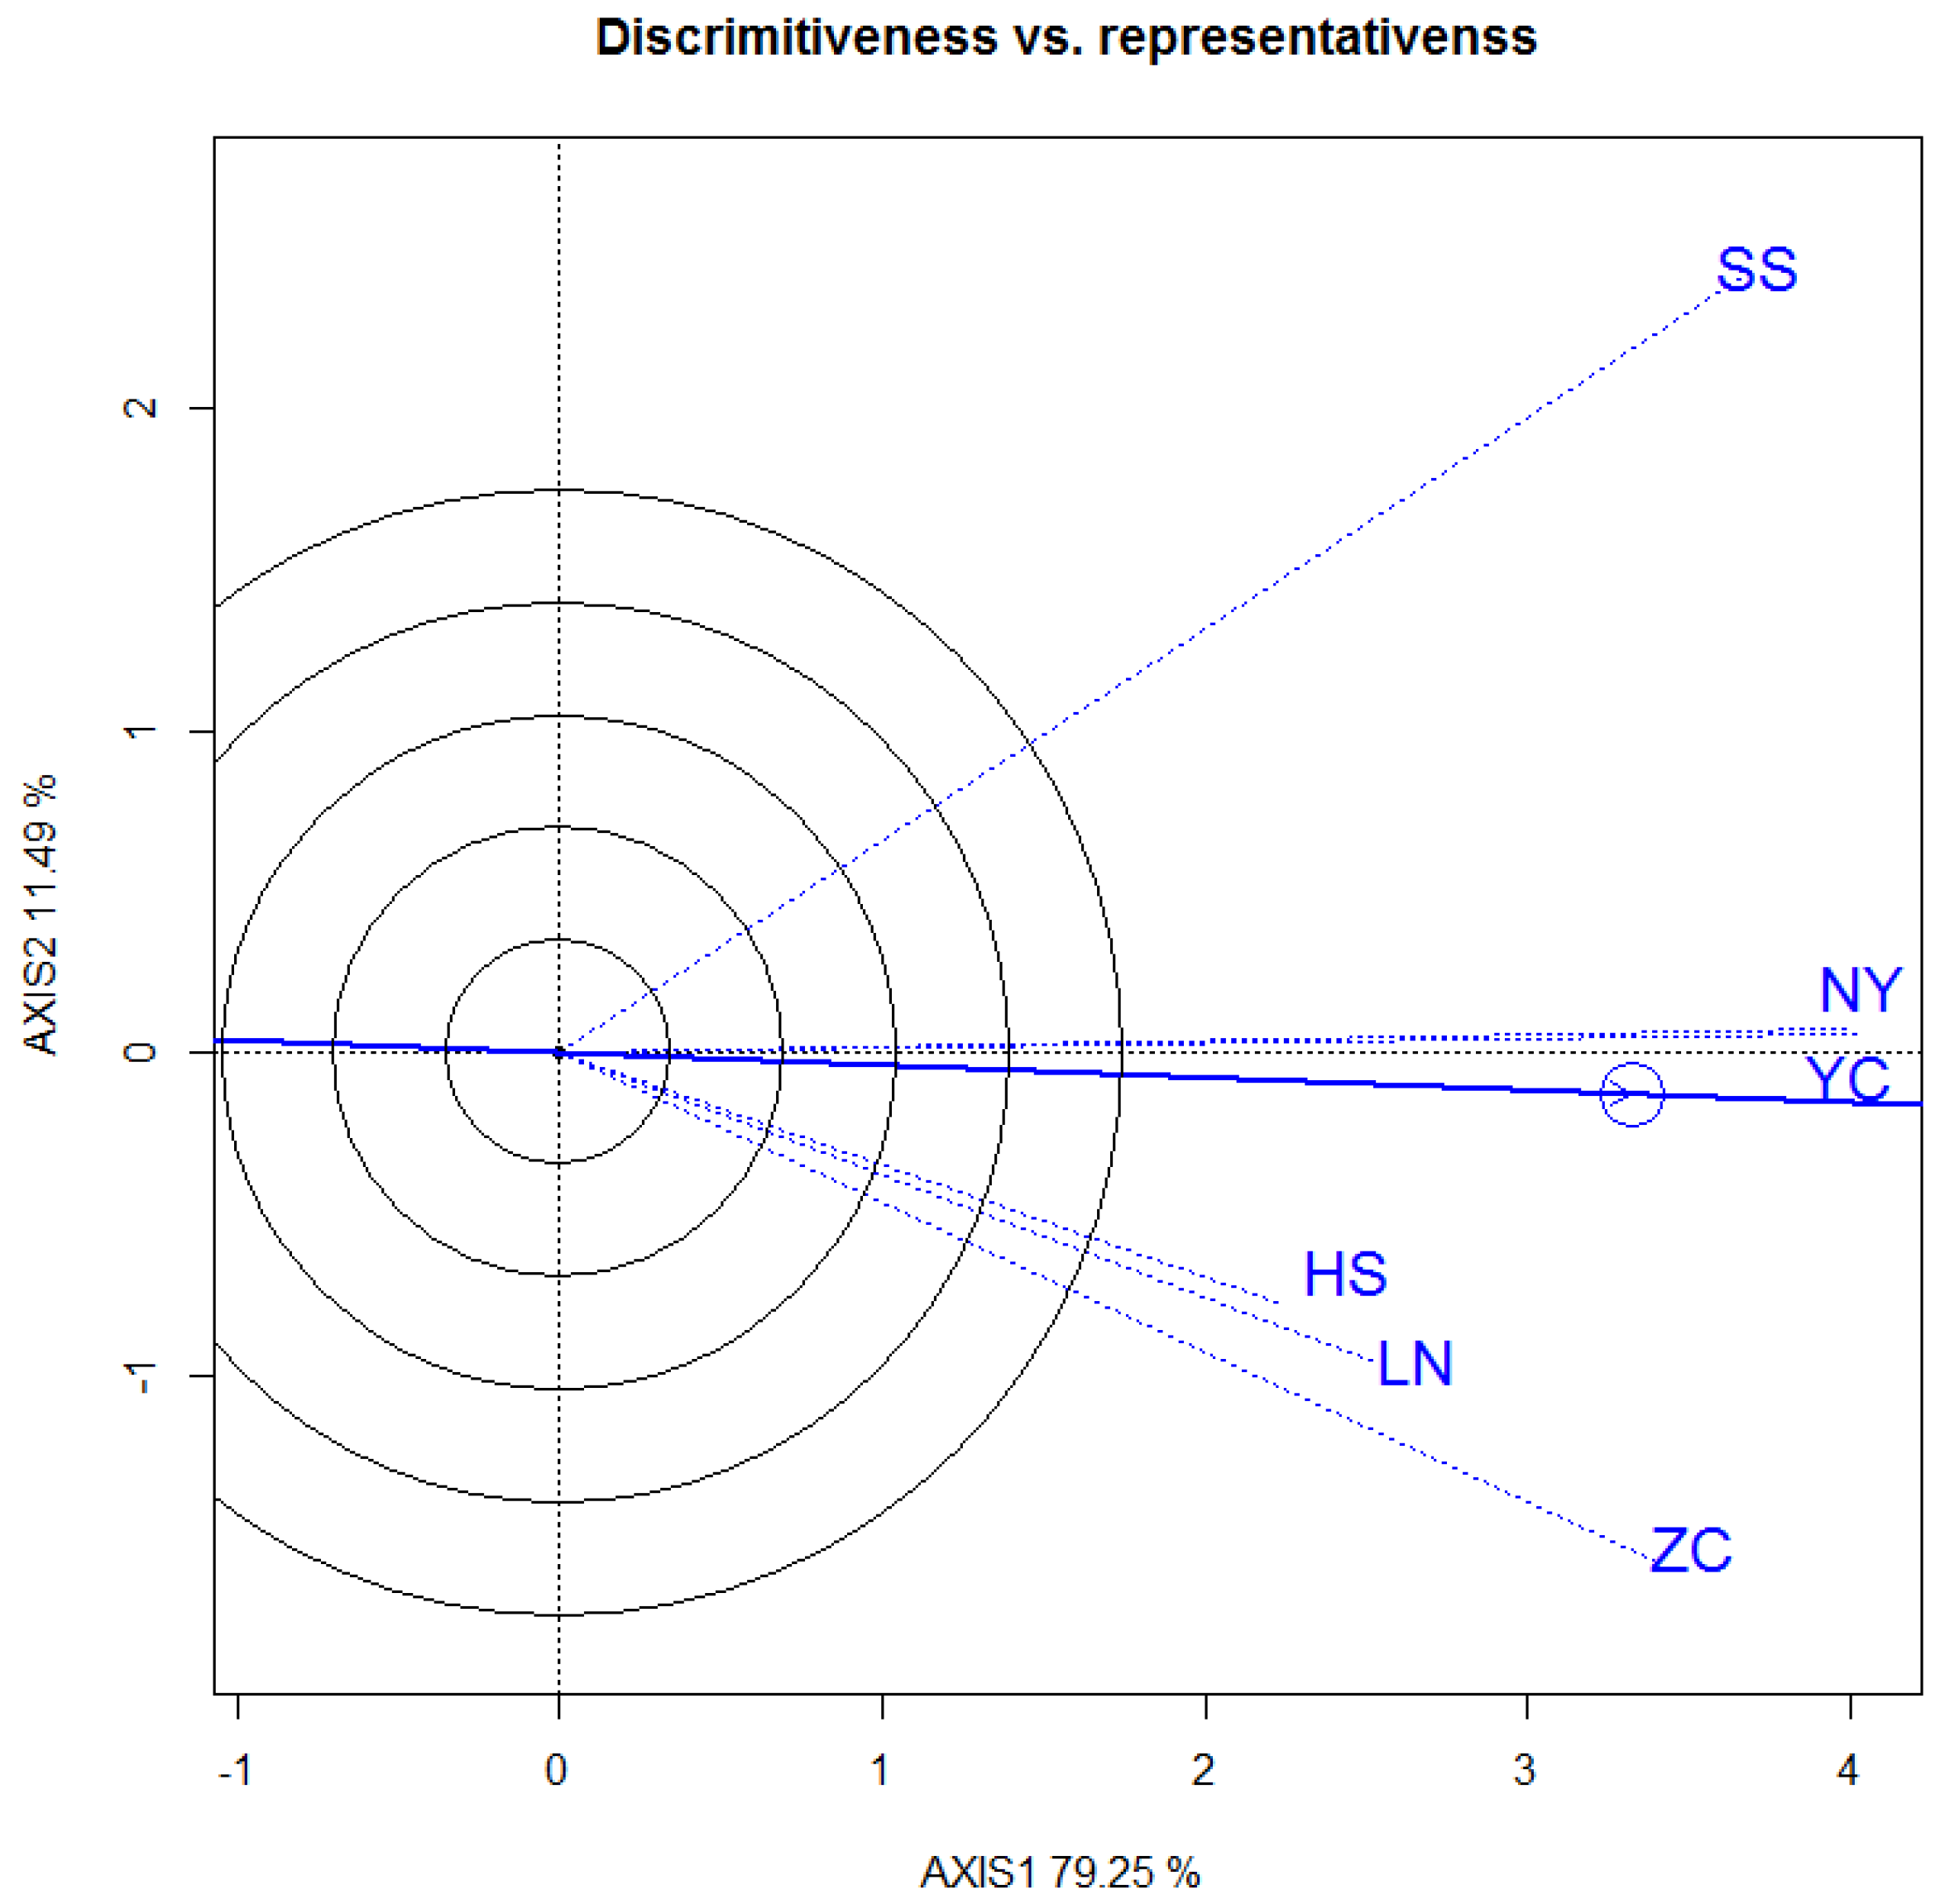
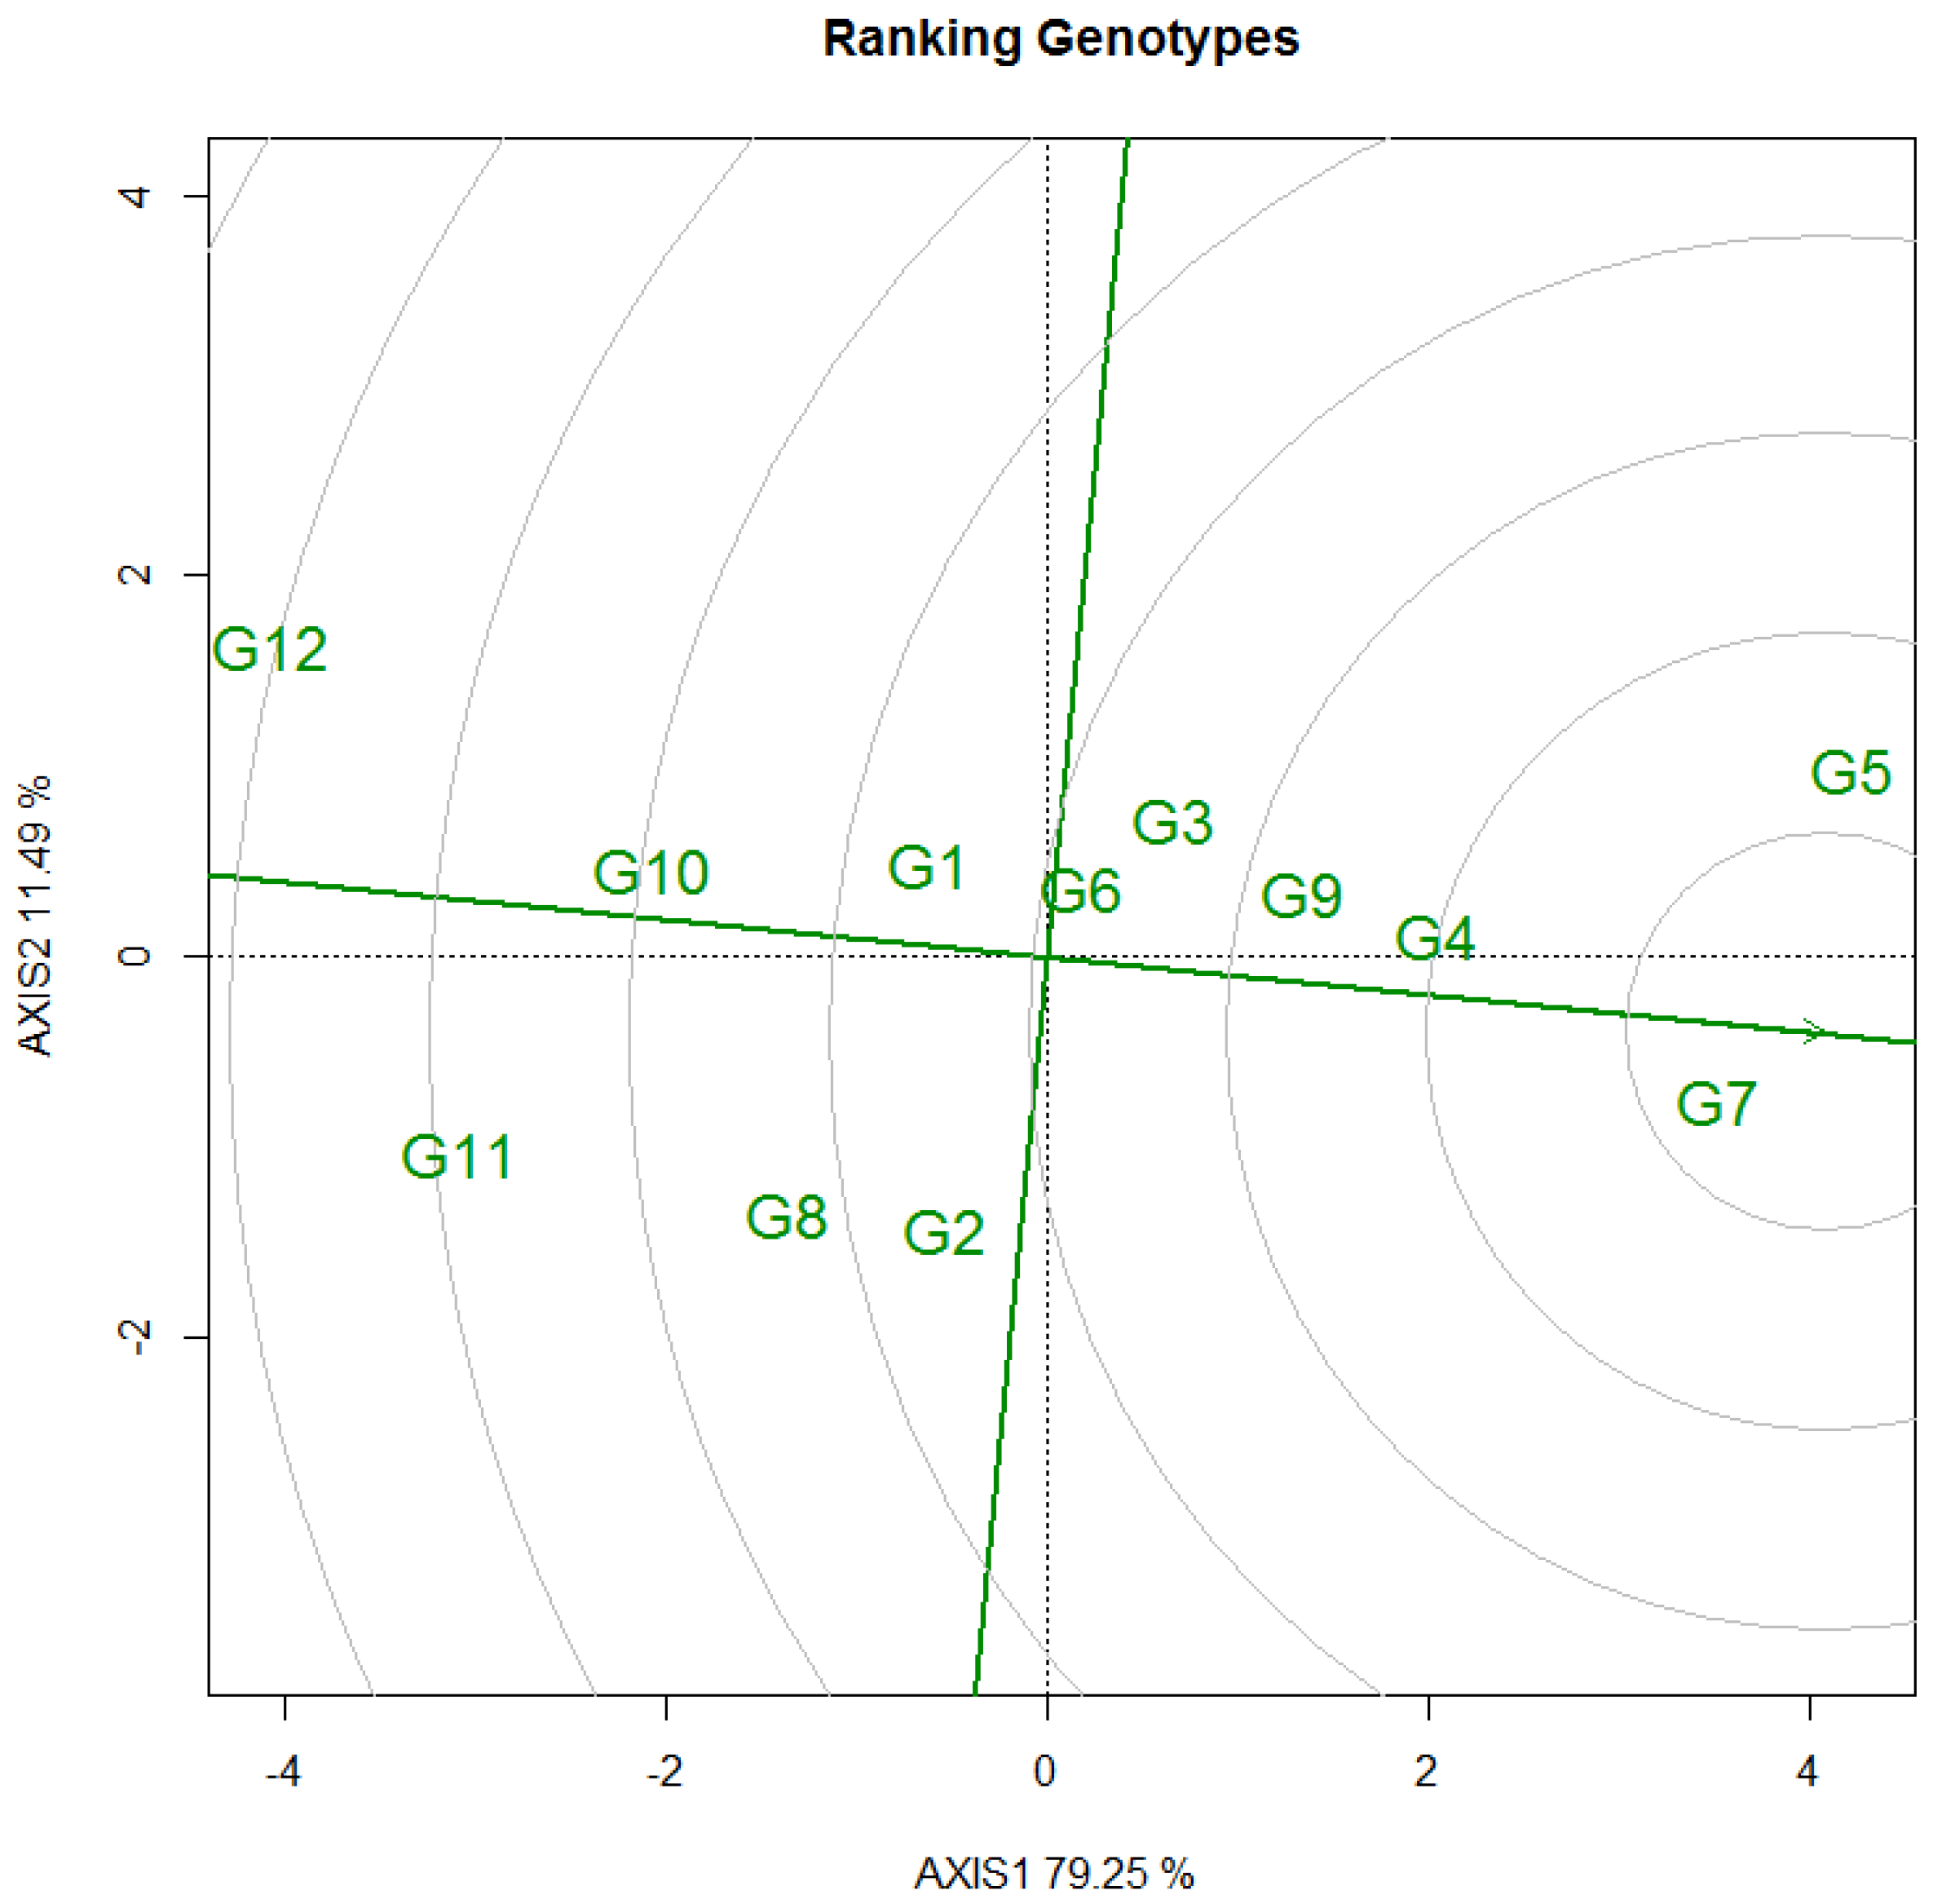
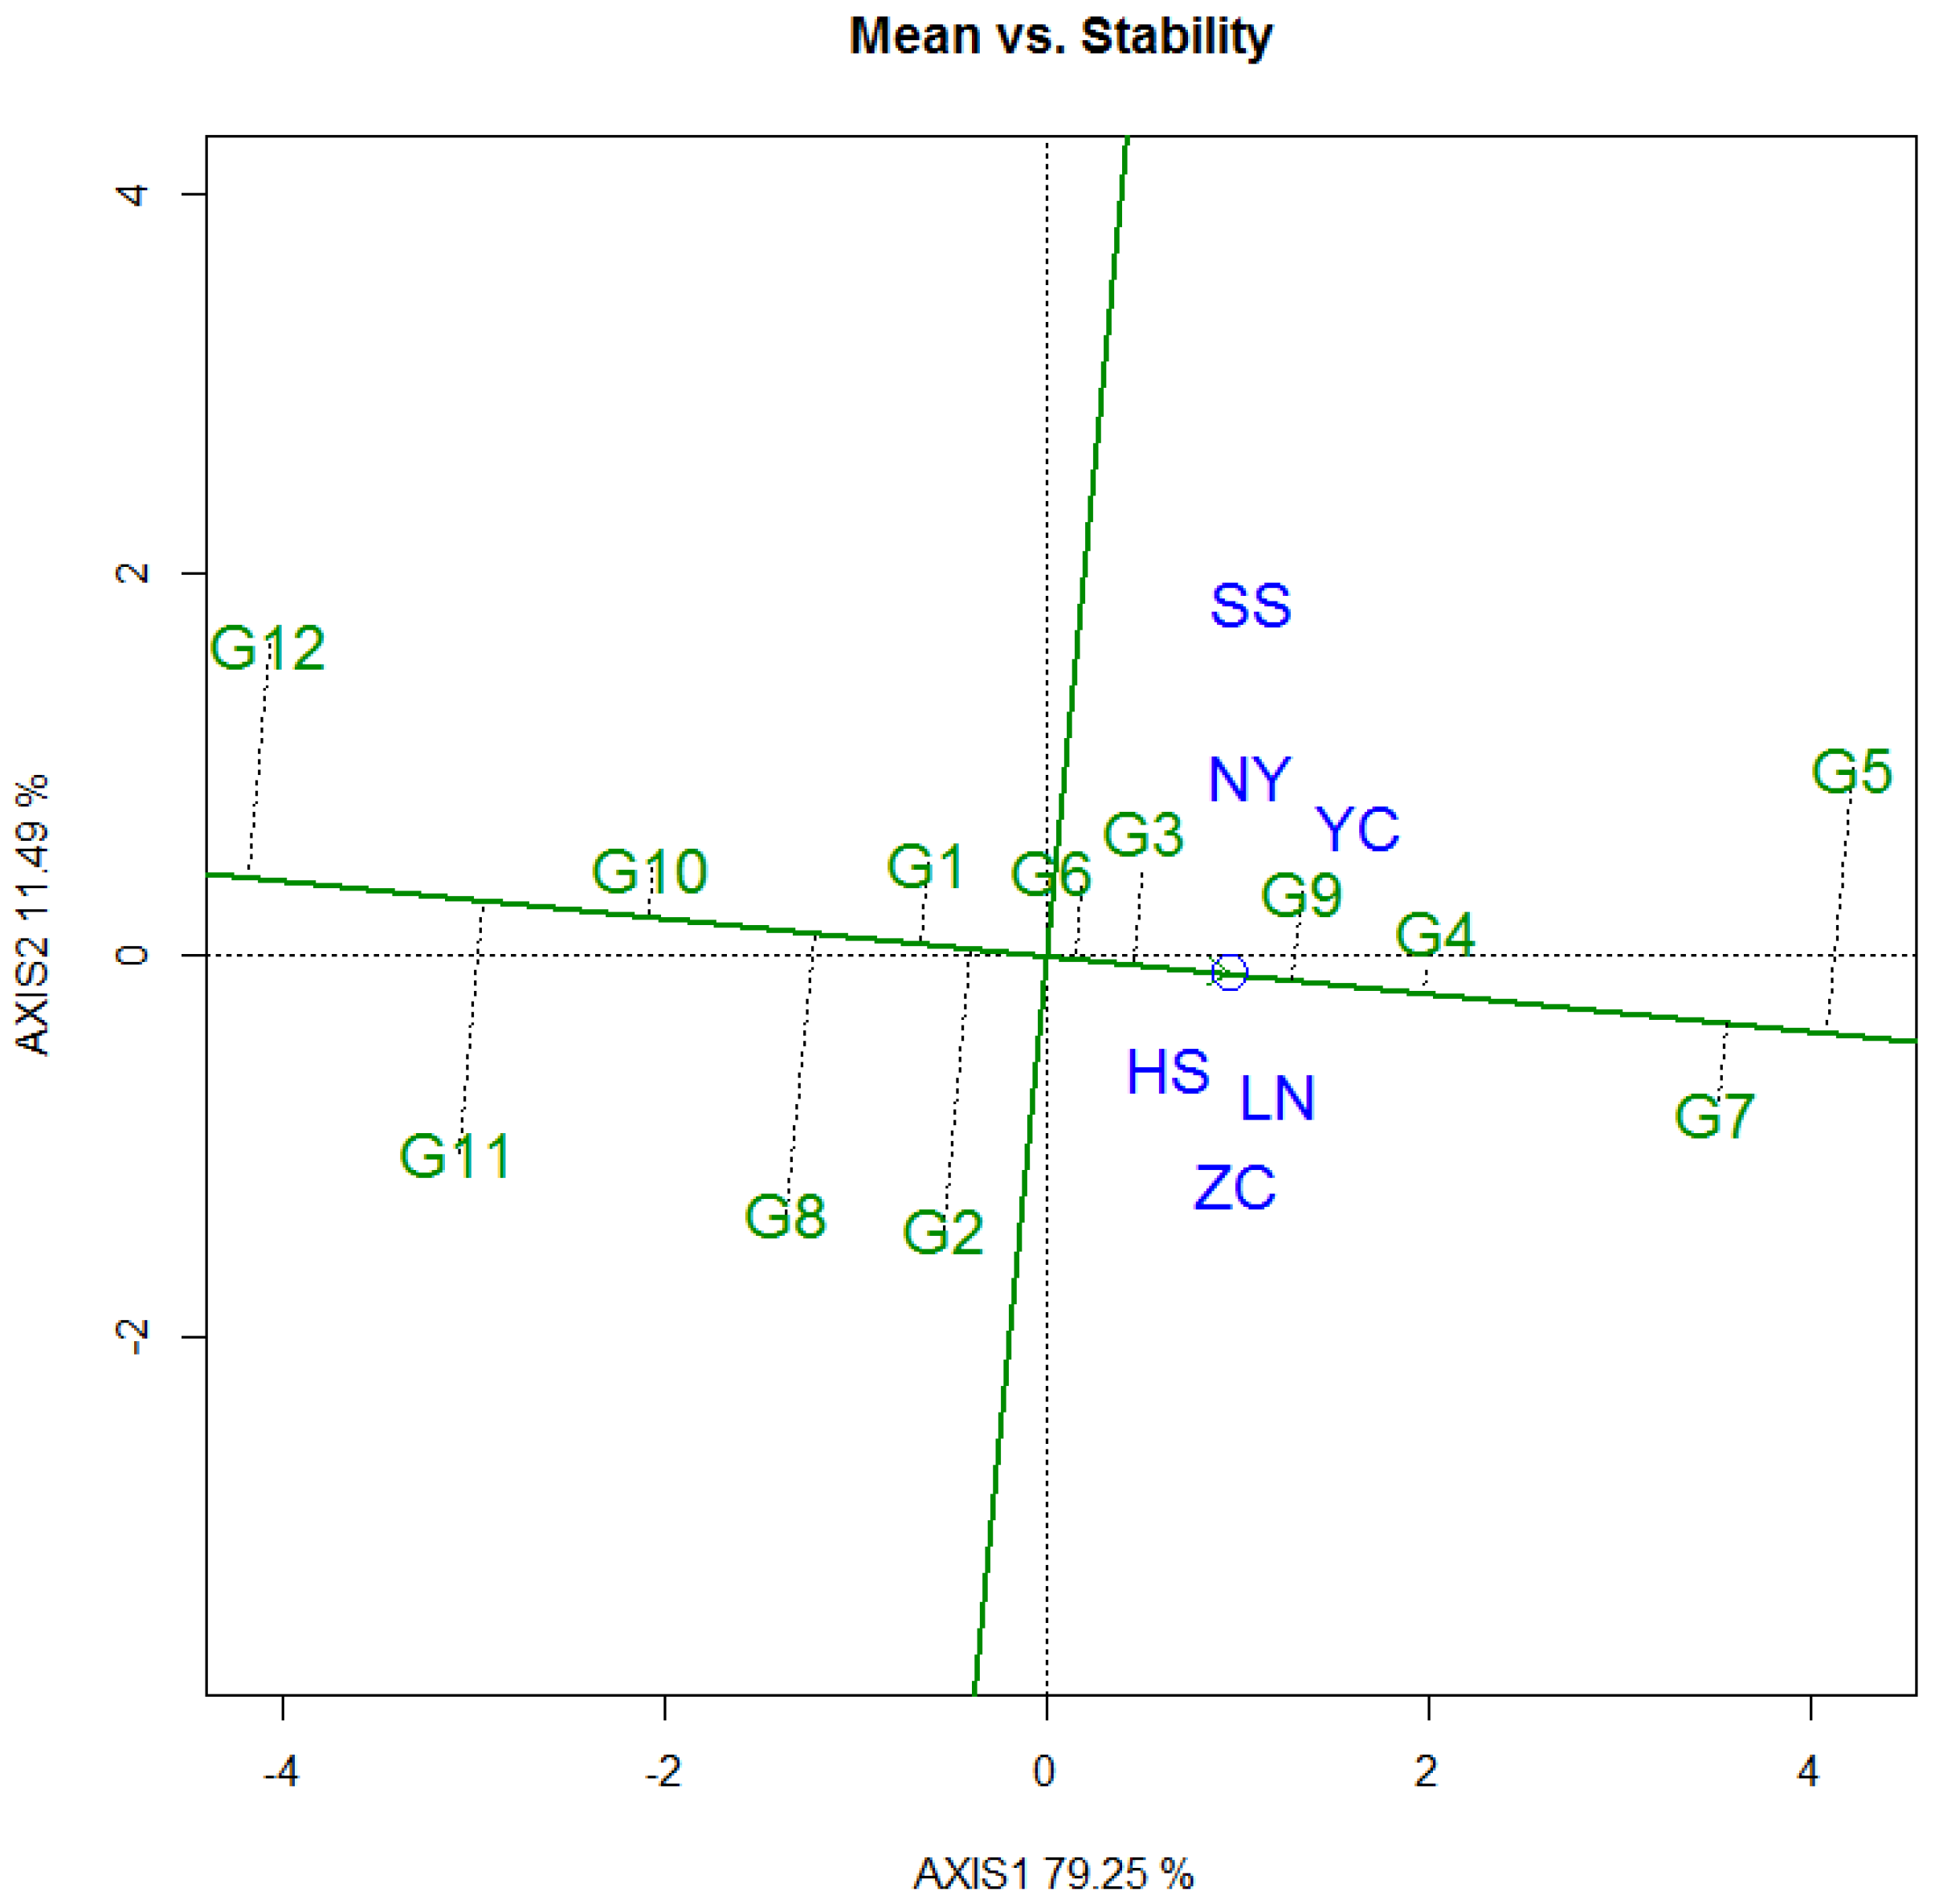
3.3.2. Tree Height
3.4. Heritability, Type B Correlation, and Genetic Gain of Selected Genotypes
4. Discussion
5. Conclusions
Author Contributions
Funding
Institutional Review Board Statement
Informed Consent Statement
Data Availability Statement
Conflicts of Interest
References
- Curovic, M.; Spalevic, V.; Sestras, P.; Motta, R.; Dan, C.; Garbarino, M.; Vitali, A.; Urbinati, C. Structural and ecological characteristics of mixed broadleaved old-growth forest (Biogradska Gora-Montenegro). Turk. J. Agric. For. 2020, 44, 428–438. [Google Scholar] [CrossRef]
- Holopainen, J.K.; Blande, J.D.; Sorvari, J. Functional role of extrafloral nectar in boreal forest ecosystems under climate change. Forests 2020, 11, 67. [Google Scholar] [CrossRef] [Green Version]
- Kim, H.; Han, S.H.; Kim, S.; Chang, H.; Son, Y. Elevated in-soil CO2 affects physiology and growth of Pinus densiflora and Quercus variabilis seedlings under an artificial CO2 release experiment. Turk. J. Agric. For. 2020, 44, 339–349. [Google Scholar] [CrossRef]
- Lin, T.; Fang, X.; Lai, Y.; Zheng, H.; Zhu, J. Shifts in leaf and branch elemental compositions of Pinus massoniana(Lamb.) following three-year rainfall exclusion. Forests 2020, 11, 113. [Google Scholar] [CrossRef] [Green Version]
- Su, X.; Ding, C.; Ma, C. Research progress and strategies of poplar breeding in China. For. Res. 2010, 23, 31–37. (In Chinese) [Google Scholar]
- Nelson, N.D.; Berguson, W.E.; McMahon, B.G.; Cai, M.; Buchman, D.J. Growth performance and stability of hybrid poplar clones in simultaneous tests on six sites. Biomass Bioenergy 2018, 118, 115–125. [Google Scholar] [CrossRef]
- Bian, L.; Shi, J.; Zheng, R.; Chen, J.; Wu, H.X. Genetic parameters and genotype–environment interactions of chinese fir (cunninghamia lanceolata) in fujian province. Can. J. For. Res. 2014, 44, 582–592. [Google Scholar] [CrossRef]
- Wu, H.X.; Matheson, A.C. Genotype by environment interactions in an Australia-wide radiata pine diallel mating experiment: Implications for regionalized breeding. For. Sci. 2005, 51, 29–40. [Google Scholar]
- Miller, R.O. Growth Variation Among Hybrid Poplar Varieties in Michigan, USA and the Implications for Commercial Biomass Production. BioEnergy Res. 2018, 11, 816–825. [Google Scholar] [CrossRef]
- Yu, Q.B.; Pulkkinen, P. Genotype-environment interaction and stability in growth of aspen hybrid clones. For. Ecol. Manag. 2003, 173, 25–35. [Google Scholar] [CrossRef]
- Bentzer, B.G.; Foster, G.S.; Hellberg, A.R.; Podzorski, A.C. Genotype × environment interaction in norway spruce involving three levels of genetic control: Seed source, clone mixture, and clone. Can. J. For. Res. 2011, 18, 1172–1181. [Google Scholar] [CrossRef]
- Yan, W.; Hunt, L.A.; Sheng, Q.L.; Szlavnics, Z. Cultivar evaluation and mega-environment investigation based on the gge biplot. Crop Sci. 2000, 40, 597–605. [Google Scholar] [CrossRef]
- Yan, W. Optimal Use of Biplots in Analysis of Multi-Location Variety Test Data. Acta Agron. Sin. 2010, 36, 1805–1819. [Google Scholar]
- Yan, W.; Hunt, L.A. Biplot analysis of diallel data. Crop Sci. 2002, 42, 21–30. [Google Scholar] [CrossRef]
- Yan, W.; Tinker, N.A. Biplot analysis of multi-environment trial data: Principles and applications. Can. J. Plant Sci. 2006, 86, 623–645. [Google Scholar] [CrossRef] [Green Version]
- Adhikari, A.; Ibrahim, A.M.H.; Rudd, J.C.; Baenziger, P.S.; Sarazin, J.B. Estimation of heterosis and combining abilities of US winter wheat germplasm for hybrid development in Texas. Crop Sci. 2020, 60, 788–803. [Google Scholar] [CrossRef]
- Yuan, C.; Zhang, Z.; Jin, G.; Zheng, Y.; Zhou, Z.; Sun, L.; Tong, H. Genetic parameters and genotype by environment interactions influencing growth and productivity in Masson pine in east and central China. For. Ecol. Manag. 2021, 11, 487. [Google Scholar] [CrossRef]
- Bai, J.; Zhao, F.; He, J.; Wang, C.; Chang, H.; Zhang, J.; Wang, D. GGE biplot analysis of genetic variations of 26 potato genotypes in semi-arid regions of Northwest China. N. Z. J. Crop Hortic. Sci. 2014, 42, 161–169. [Google Scholar] [CrossRef] [Green Version]
- Avola, G.; Riggi, E.; Gresta, F.; Sortino, O.; Onofri, A. Random effects models, BLUPs and redundancy analyses for grain legume crops in semi-arid environments. Eur. J. Agron. 2018, 93, 18–26. [Google Scholar] [CrossRef]
- Isik, F.; Holland, J.; Maltecca, C. Genetic Data Analysis for Plant and Animal Breeding; Springer International Publishing: Cham, Switzerland, 2017; pp. 141–163. [Google Scholar]
- White, T.L.; Adams, W.T.; Neale, D.B. Forest Genetics; CABI: London, UK, 2007; pp. 285–479. [Google Scholar]
- Lin, Y. Research Methodologies for Genotype by Environment Interactions in Forest Trees and Their Applications. Sci. Silvae Sin. 2019, 55, 142–151. (In Chinese) [Google Scholar]
- Frutos, E.; Galindo, M.P.; Leiva, V. An interactive biplot implementation in R for modeling genotype-by-environment interaction. Stoch. Environ. Res. Risk Assess. 2014, 28, 1629–1641. [Google Scholar] [CrossRef]
- Yan, W. Singular-Value Partitioning in Biplot Analysis of Multienvironment Trial Data. Agron. J. 2002, 94, 253–260. [Google Scholar] [CrossRef] [Green Version]
- Cornelius, J. Heritabilities and Additive Genetic Coefficients of Variation in Trees. Can. J. For. Res. 1994, 24, 372–379. [Google Scholar] [CrossRef]
- Liu, N.; Ding, C.; Li, B.; Ding, M.; Su, X.; Huang, Q. Effects of Genotype by Environment Interaction of 12 Populus×euramericana Clones in Their Early Growth. Sci. Silvae Sin. 2020, 56, 63–72. (In Chinese) [Google Scholar]
- Bian, L.; Gapare, W.J.; Ivkovi, M.; Jefferson, P.; Wu, H.X. Genetic variation between and within ex-situ native-provenance collections of Pinus radiata D.Don planted in Australia and New Zealand. Silvae Genet. 2011, 60, 276–285. [Google Scholar] [CrossRef] [Green Version]


| Environmental Factor | Zhucheng | Yuncheng | Ningyang | Luannan | Shishou | Heishan |
|---|---|---|---|---|---|---|
| Soil type | Loam | Sand | Sandy soil | Sand | Loam | Sand |
| Annual temperature range/°C | 27.2 | 27.9 | 28 | 30.6 | 23.9 | 34.2 |
| Annual average of temperature/°C | 13.1 | 13.9 | 13.7 | 11.4 | 16.9 | 9.0 |
| Annual average of daily temperature range/°C | 9.6 | 10.2 | 11.2 | 10.2 | 7.4 | 10.2 |
| Annual average of minimum temperature/°C | 8.9 | 9.4 | 8.7 | 6.8 | 13.7 | 4.2 |
| Daily precipitation in a year ≥0.1 mm days/d | 79.2 | 70.9 | 67.9 | 70.2 | 127.6 | 71.6 |
| Daily precipitation in a year ≥10.0 mm days/d | 20.9 | 16.7 | 18.2 | 15.9 | 36.1 | 16.8 |
| Daily minimum temperature in a year ≤2.0 °C days/d | 114.5 | 111.8 | 118 | 139.7 | 42.1 | 159.4 |
| Daily maximum temperature in a year ≥30.0 °C days/d | 52.7 | 73.4 | 75.7 | 46.4 | 79.9 | 22.9 |
| Annual average wind speed/(m·s−1) | 3.1 | 1.9 | 1.8 | 2.2 | 2.2 | 3.4 |
| Average monthly sunshine duration/h | 200.5 | 181.8 | 160.6 | 201.7 | 141.8 | 229.1 |
| Annual average sunshine duration/h | 2405.7 | 2182.0 | 1927.2 | 2420.7 | 1702.0 | 2749.1 |
| Genotype IDs | Clone IDs | Female Parent | Male Parent | Male Parent’s Region |
|---|---|---|---|---|
| G1 | 11-20-2 | P. deltoides ‘Danhong’ | P. nigra ‘N46-2’ | Northern Russia |
| G2 | 11-21-8 | P. deltoides ‘Danhong’ | P. nigra ‘N50-8’ | Northern Russia |
| G3 | 11-24-4 | P. deltoides ‘Danhong’ | P. nigra ‘N120-4’ | Northern Germany |
| G4 | 11-26-10 | P. deltoides ‘Danhong’ | P. nigra ‘N146-10’ | Northern Netherlands |
| G5 | 11-26-4 | P. deltoides ‘Danhong’ | P. nigra ‘N146-4’ | Northern Netherlands |
| G6 | 11-26-8 | P. deltoides ‘Danhong’ | P. nigra ‘N146-8’ | Northern Netherlands |
| G7 | 11-26-9 | P. deltoides ‘Danhong’ | P. nigra ‘N146-9’ | Northern Netherlands |
| G8 | 11-27-4 | P. deltoides ‘Danhong’ | P. nigra ‘N150-4’ | Northern Netherlands |
| G9 | 11-28-11 | P. deltoides ‘Danhong’ | P. nigra ‘N166-11’ | Northern Netherlands |
| G10 | 11-32-1 | P. deltoides ‘Zhongshi8’ | P. nigra ‘N23-1’ | Northern Germany |
| G11 | 11-36-26 | P. deltoides ‘Zhongshi8’ | P. nigra ‘N31-26’ | Southern Italy |
| G12 | 11-40-2 | P. deltoides ‘Zhongshi8’ | P. nigra ‘N39-2’ | Southern Italy |
| Trait | Source | Degree of Freedom | Sum of Squares | F-Value | Significance |
|---|---|---|---|---|---|
| DBH | Block | 2 | 10.46 | 4.67 | 0.10 |
| Site | 5 | 1880.33 | 839.28 | 0.00 | |
| Residual | - | 2.24 | |||
| Height | Block | 2 | 35.70 | 32.40 | 0.00 |
| Site | 5 | 861.20 | 780.40 | 0.00 | |
| Residual | - | 1.10 |
| Source | Height | DBH | ||||
|---|---|---|---|---|---|---|
| Variance Components | % of Variance Components | Significance | Variance Components | % of Variance Components | Significance | |
| Genotype | 0.16 | 10% | 0.00 | 0.95 | 26% | 0.00 |
| Genotype × Site | 0.29 | 19% | 0.00 | 0.51 | 14% | 0.00 |
| Error | 1.10 | 71% | - | 2.24 | 61% | - |
| Genetic Parameter | Height | DBH |
|---|---|---|
| HB2 | 0.13 | 0.30 |
| rb | 0.36 | 0.65 |
| ΔG/cm | 6.84 | 0.34 |
| % of ΔG | 3.35% | 0.81% |
Publisher’s Note: MDPI stays neutral with regard to jurisdictional claims in published maps and institutional affiliations. |
© 2021 by the authors. Licensee MDPI, Basel, Switzerland. This article is an open access article distributed under the terms and conditions of the Creative Commons Attribution (CC BY) license (https://creativecommons.org/licenses/by/4.0/).
Share and Cite
Liu, N.; Ding, C.; Li, B.; Ding, M.; Su, X.; Huang, Q. Analysis of the Genotype Interaction of Four-Year-Old Populus euramericana Using the BLUP-GGE Technique. Forests 2021, 12, 1759. https://doi.org/10.3390/f12121759
Liu N, Ding C, Li B, Ding M, Su X, Huang Q. Analysis of the Genotype Interaction of Four-Year-Old Populus euramericana Using the BLUP-GGE Technique. Forests. 2021; 12(12):1759. https://doi.org/10.3390/f12121759
Chicago/Turabian StyleLiu, Ning, Changjun Ding, Bo Li, Mi Ding, Xiaohua Su, and Qinjun Huang. 2021. "Analysis of the Genotype Interaction of Four-Year-Old Populus euramericana Using the BLUP-GGE Technique" Forests 12, no. 12: 1759. https://doi.org/10.3390/f12121759
APA StyleLiu, N., Ding, C., Li, B., Ding, M., Su, X., & Huang, Q. (2021). Analysis of the Genotype Interaction of Four-Year-Old Populus euramericana Using the BLUP-GGE Technique. Forests, 12(12), 1759. https://doi.org/10.3390/f12121759