Article

Trends of Rainfall Onset, Cessation, and Length of Growing Season in Northern Ghana: Comparing the Rain Gauge, Satellite, and Farmer’s Perceptions

by
Winifred Ayinpogbilla Atiah
1,*,†,
Francis K. Muthoni
2,†,
Bekele Kotu
3,
Fred Kizito
3,4 and
Leonard K. Amekudzi
1
1
Meteorology and Climate Science Unit, Department of Physics, Kwame Nkrumah University of Science and Technology (KNUST), UPO-PMB, Kumasi AK-039-5028, Ghana
2
International Institute of Tropical Agriculture (IITA), Duluti, Arusha P.O. Box 10, Tanzania
3
International Institute of Tropical Agriculture, Tamale NT-0000, Ghana
4
International Institute of Tropical Agriculture, Accra GA-184, Ghana
*
Author to whom correspondence should be addressed.
These authors contributed equally to this work.
Atmosphere 2021, 12(12), 1674; https://doi.org/10.3390/atmos12121674
Submission received: 17 October 2021 / Revised: 1 December 2021 / Accepted: 2 December 2021 / Published: 13 December 2021
(This article belongs to the Topic Climate Change and Environmental Sustainability)

Abstract

:
Rainfall onset and cessation date greatly influence cropping calendar decisions in rain-fed agricultural systems. This paper examined trends of onsets, cessation, and the length of growing season over Northern Ghana using CHIRPS-v2, gauge, and farmers’ perceptions data between 1981 and 2019. Results from CHIRPS-v2 revealed that the three seasonal rainfall indices have substantial latitudinal variability. Significant late and early onsets were observed at the West and East of 1.5° W longitude, respectively. Significant late cessations and longer growing periods occurred across Northern Ghana. The ability of farmers’ perceptions and CHIRPS-v2 to capture rainfall onsets are time and location-dependent. A total of 71% of farmers rely on traditional knowledge to forecast rainfall onsets. Adaptation measures applied were not always consistent with the rainfall seasonality. More investment in modern climate information services is required to complement the existing local knowledge of forecasting rainfall seasonality.

1. Introduction

Global ecosystems are experiencing changes in rainfall amount, intensity, and temporal distributions [1] that poses a great challenge to agricultural production [2,3,4]. Trends of rainfall amount are widely documented [5,6] but shifts in rainfall seasonality (onset and cessation) have received less attention although it determines timing of cropping calendar activities. The temporal variability of rainfall is a critical determinant of timing of cropping calendar in rain-fed farming systems and is defined by three indices i.e., the onset, cessation dates, and the length of the season. The onset and cessation dates are the day of the year when rainfall starts and ends. The difference between the onset and cessation dates is the length of the growing season. There are several methods for determining the onset and cessation dates of rainfall that are applicable at different agro-ecological zones and intended uses [7,8,9,10]. Ref. [10] developed a new method that is generally applicable for estimating the onset and cessation dates across Africa continent though the study applied low resolution gridded data (approximately 110 Km). Many studies determine rainfall onsets and cessation from gauge data, e.g., [11,12] in northern Ghana. Recent advances focus on the application of gridded satellite rainfall estimates for spatial determination of onsets and cessations [10,13]. Ref. [10] mapped the timing of onset and cessation of rainfall over Africa using gridded data at 110 Km resolution and reported inconsistent deviations over West Africa when ERA-Interim and ARC-v2 data was applied. Similarly, Ref. [14] evaluated the skill of onset forecasts for West Africa. Again, Ref. [13] demonstrated that daily climatology from CHIRPS-v2 data could forecast rainfall onset and cessation of rainfall with a bias of less than 7 days in large parts of Eastern Africa.
Agricultural production in the West Africa region is predominantly rain-fed. The region is also highly vulnerable to climate change and variability due to rampant poverty, rapidly increasing population, and low levels of technological development [15]. The increasing variability of rainfall amount and seasonality destabilizes the fragile ecosystem and threatens food production and livelihoods. Likewise, the variability of rainfall amount in northern Ghana has attracted more attention compared to seasonal distribution [5,6,16]. Moreover, there is no consensus in the literature on the three rainfall seasonality indices i.e., the onset, cessation, and length of growing period (LGP) in northern Ghana, although these are crucial determinants for cropping season activities. The LGP in northern Ghana is highly variable due to inconsistencies of rainfall onset and cessation dates Refs. [11,17]. For instance, Ref. [12] reported early-onset dates of the rain season ranging between −0.3 to −0.5 days/year (earlier onset of 7.5–12.5 days) between 1986–2010 in Tamale and Wa in northern Ghana. However, Ref. [18] reported a significant delay of up to 0.88 days/year in the Volta basin located in northern Ghana, which translates to late onset by 35 days over 40 years. Similarly, Ref. [11] reported a significant variability of onset and cessation of rainfall over a band of 2–8 years over different agro-ecological zones in Ghana. Recent studies using gauge observations have demonstrated that late onset or early cessation of rains and a high frequency of dry spells within the growing season in northern Ghana cause a significant decline in crop yields [19,20]. The variability of onset and mid-season breaks in the rain makes the agricultural calendar unpredictable and complicates decisions on sowing time, crop choice, and variety [17,21]. Erratic and delayed rainfall onset pose a severe challenge to food production and food security [11]. Lack of synergy between rainfall onsets and agronomic decisions such as sowing date is one of the main factors causing low maize production in Northern Ghana [20]. False starts of rains [22] have become more regular in northern Ghana and induce farmers to plough and plant without sufficient follow-up wet days to sustain the growth of crops [23]. Accurate prediction of the onset, cessation, and length of rainy days dates is essential for synchronized timing of cropping calendar activities. Precise information on the onset and cessation of seasonal rain can reduce the risks and costs of re-sowing seeds due to the season’s false onset [24]. The late onset of rains provides the first outlook of a rainy season and is a reliable early warning of food insecurity several months before harvesting [25]. A ten-day delay of onset of the rainy season makes drought conditions more likely. Early identification and warning of drought conditions can inform preparedness of interventions to save lives and livelihoods.
Inadequate weather observation networks hamper timely and accurate rainfall forecasts that can guide farmers on cropping calendar decisions [26]. The observation gauge network in Ghana is characterized by low density, skewed distribution, short-term records, and significant data gaps [6,26,27]. The information generated from a few gauge stations with long-term data is applied to generate agro-advisories over a large area beyond the (>50 Km 2 ) recommended by World Meteorological Organization (WMO). Most gauge networks are in the main urban centers, resulting in inadequate coverage in rural areas where agricultural activities take place [26]. Satellite-derived rainfall can complement the sparse gauge network to produce spatially explicit layers representing the onset, cessation, and length of the rain season [10,13,28]. In this manner, the big data generated from remote sensing platforms is applied to identify hotspots where agricultural production experiences a high risk of climate change and variability. Identifying locations that are more vulnerable to shifts in seasonal calendars associated with climate change and variability is essential to guide the evidence-based targeting of appropriate climate-smart technologies [17].
Farmer perceptions on changing rainfall patterns determine annual cropping decisions. If farmers’ perceptions agree with the trends recorded by the observation network, it means more awareness of prevalent trends and a higher likelihood of applying appropriate adaptive measures [28,29]. Proper knowledge of local trends of rainfall seasonality is required to guide the implementation of appropriate adaptation measures that reduce the negative effects of climate change. Ref. [30] showed that adaptation measures implemented without considering local climate reality led to maladaptive outcomes that exacerbated the vulnerability to climate change and variability in northern Ghana. Integrating knowledge from meteorological observations with local perceptions is essential for developing locally relevant and sustainable adaptation strategies. Several studies reported agreement between farmer perceptions of rainfall trends with observation data [29,31]. However, other studies reported deviation between farmers’ perceptions of climate change compared to observation networks [32,33]. Therefore, evaluating the seasonal trends of rainfall from farmers’ perception, observation network, and satellite time series can reduce uncertainties on climatic trends.
This study uses daily rainfall data from satellites to map the spatial variations of the onset, cessation, and length of the rain season in Ghana for 39 years (1981–2019). We validated the three indices generated from the satellite with rain gauge data. We examined the long-term trends of the three indices for almost four decades. Moreover, survey data are used to explore the farmer’s perceptions of changes on the three seasonal indices and their coping strategies. The specific objectives of this study are to; (1) generate maps of the onset, cessation, and LGP from daily rainfall from satellite and gauge networks over 39 years in northern Ghana, (2) map the variability and trends of the onset, cessation, and LGP over 39 years, (3) validate the three indices with gauge networks, (4) examine the methods farmers apply to forecast the onset of rainy seasons and (5) examine the crop management practices applied by farmers as adaptation to the observed trends of the three seasonal indices in northern Ghana.

2. Study Area and Data
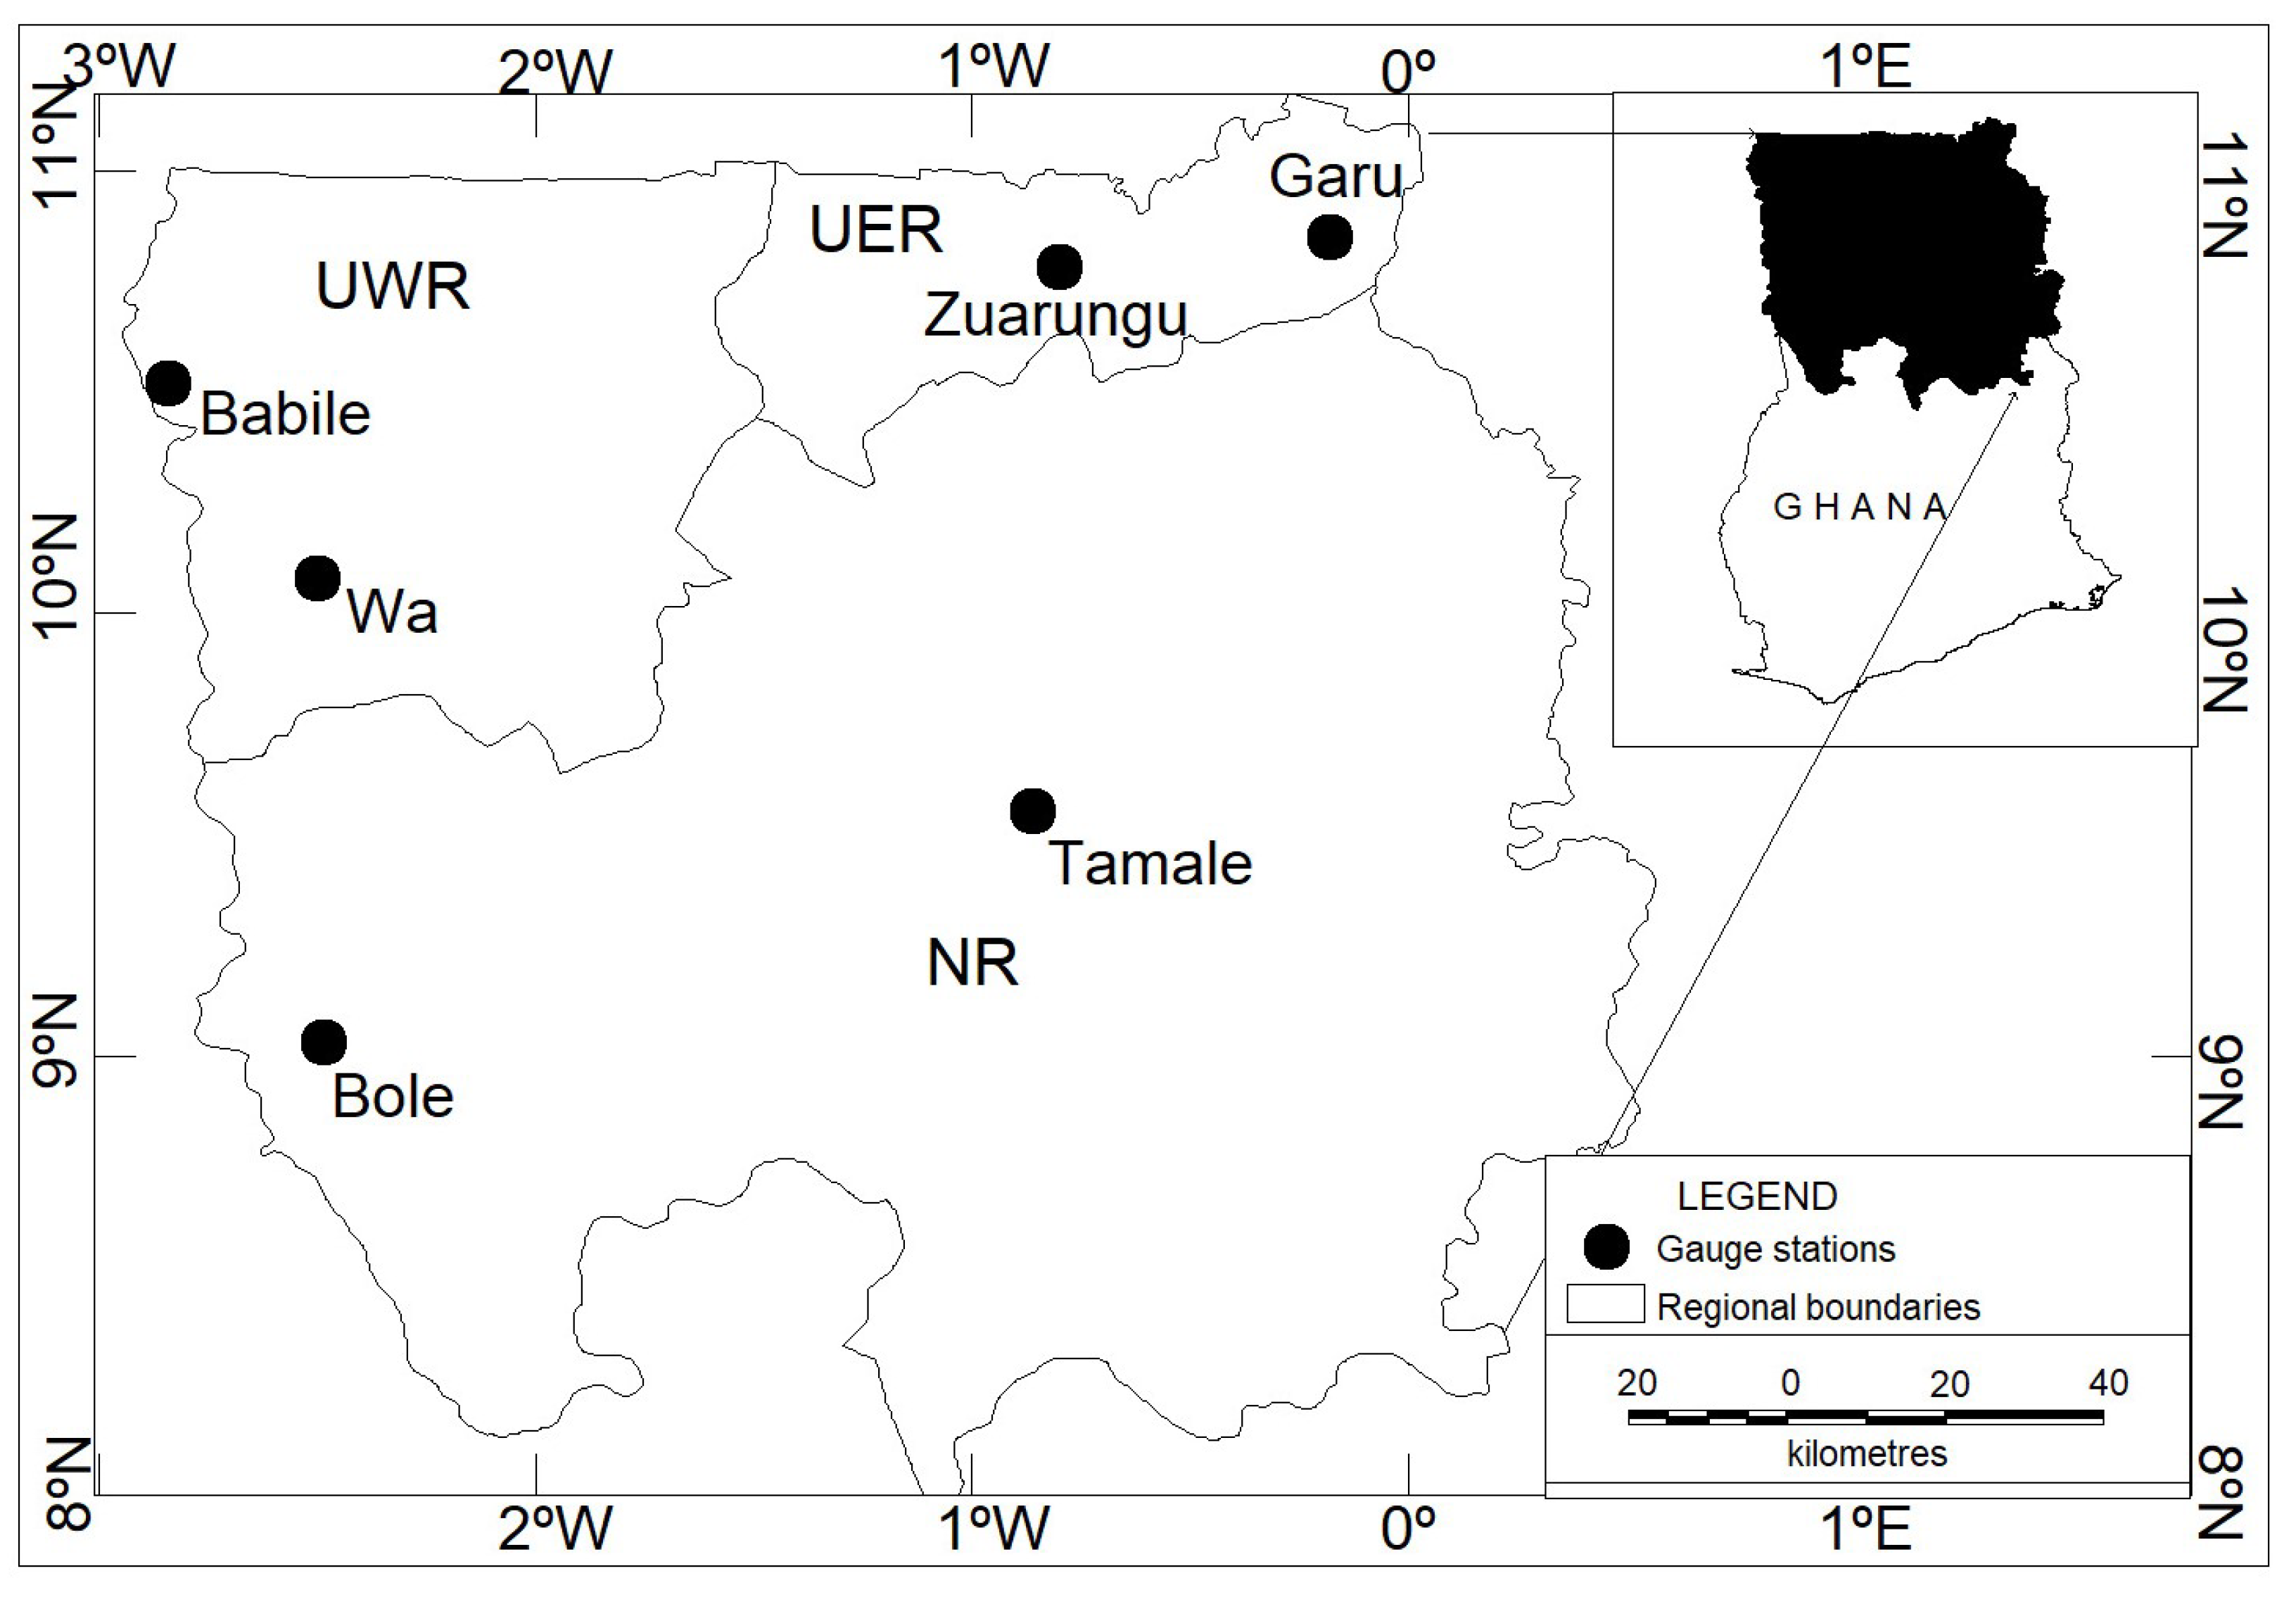
2.1. Study Area

The study area covers three administrative regions in northern Ghana, namely the Upper East (UER), Upper West (UWR), and Northern (NR) regions (Figure 1). Ghana lies in the tropics and is characterized by a tropical monsoonal climate system with two dominant seasons (wet and dry) [11]. Rainfall is controlled by the West African Monsoon (WAM) and convective activities due to the movements of the Inter-tropical Discontinuity (ITD) [11]. The ITD oscillates from South to North and retreats to the South annually. The three regions in Northern Ghana experience a unimodal rainfall pattern between May and September ranging between 500 mm and 1200 mm [5,34]. The LGP ranges from 140 to 240 days and increases in a North to South and East to West gradient [11].

2.2. Data Source

The Climate Hazards Center InfraRed Precipitation with Station data (CHIRPS-v2) has four decades of quasi-global rainfall data set [35]. Data records start from 1981 to near-present with an area coverage between 50° S–50° N. CHIRPS-v2 incorporates 0.05o resolution satellite imagery with in-situ station data to create a gridded rainfall time series for trend analysis and seasonal drought monitoring [35]. CHIRPS-v2 uses the Tropical Rainfall Measuring Mission Multi-Satellite Precipitation Analysis version 7 (TMPA-v7) to calibrate global Cold Cloud Duration (CCD) rainfall estimates. Validation studies over the region have shown that the CHIRPS-v2 dataset correlated well with gauge observations, especially on monthly to seasonal scales [6,36,37]. Additionally, CHIRPS V2 have exhibited a good skill at representing these rainfall indices as well as rainfall extremes compared to other globally available data sets such as, GPCC, TRMM 3B42 and CMORPH. This is because CHIRPS blends thermal infrared and passive microwave tend to perform better than IR-only or PM-only products [36,37]. For this analysis, the daily rainfall of CHIRPS-v2 at a spatial resolution of 0.05° × 0.05° was used. Rain gauge data for six available stations located in UER (Garu and Zuarungu), UWR (Wa and Babile), NR (Bole and Tamale) from 1981 through 2016 were obtained from Ghana Meteorological Agency (GMet). A survey was conducted in December 2020 to elicit farmers’ perception of the trends of the three rainfall indices, their impacts on cropping calendar activities, and the adaptation measures implemented to adapt to the changes (Table 1). A total of 400 farmers were interviewed in the UER (94), UWR (146), and NR (160). The average age of respondents was 50 years. The farmers were selected using a stratified random sample from a list of members involved in the ongoing Africa research in sustainable intensification for the next generation (Africa RISING; https://africa-rising.net/, accessed on 20th August 2021) program. Farmer responses were conducted using a structured interview and recorded with tablets using the KoboCollect toolbox. Farmers reported the onset dates in weekly intervals (the week of the specific month) because they could not recall the precise dates.

3. Methodology

The methods presented below aim at computing the three seasonal rainfall indices i.e., onset and cessation of rains and the LGP from gauge, satellite and farmers perceptions. The rainfall onset and cessation dates were determined using the percentage mean cumulative rainfall amount (PMCR; [11]). Daily rainfall fields for all grids over northern Ghana from 1981 to 2019 were extracted from the CHIRPS-v2 gridded rainfall data. The percentage mean annual rainfall for 5-day intervals was calculated for all grids. This was followed by accumulating the percentages of the 5-day periods. When the cumulative percentages are plotted against time through the year, the first point of maximum positive curvature of the graph corresponds to rainfall onset, and the last point of maximum negative curvature corresponds to the rainfall cessation. The points of maximum curvatures corresponding to the onset and cessation of rainfall are respectively 7–8% and over 90% of the annual rainfall (Figure A1). The length of the growing season is then the difference of the onset and cessation dates of rainfall (Equation (1)).
L G P = R C R O + 1
where LGP is the length of the growing period, RC is the rainfall cessation, RO is the rainfall onset. The time series rasters of the three seasonal rainfall indices (onset, cessation, LGP) were applied to test null hypothesis (no trend) from the entire time series data. The trends of the three seasonal rainfall indices were determined using Theil Sen’s slope estimator ([38]; Equation (2)). There are several methods for testing the significance of climatic trends such as the Mann–Kendall test [39,40], Spearman’s rho test [41,42] and graphical method [43]. Existence of serial autocorrelation and ties in time series of climate data influence the magnitude of variance of the test statistic [44]. We plotted the autocorrelation function (ACF) to check if the time series of the three rainfall indices had serial dependency. Since the dataset did not show significant serial-dependence (Figure A2), the significance of the trends was then tested using Mann–Kendall test [39] at a significant value of 0.05 (Equations (3)–(5)). The ability of the CHIRPS-v2 satellite data to capture the onset and cessation dates in the UER, UWR, and NR was assessed using data from six-gauge stations (Figure 1). A point to grid approach was applied, whereby rainfall for the six-gauge stations was extracted and matched with geolocated satellite data. Where a particular station’s data were missing, nearby station’s data were used to gap-fill. This is because stations that are close to each other, not greater than 4 Km apart, have been revealed to have similar rainfall patterns. After that, the onsets, cessations, and LGP for both gauge and satellite at these stations were computed and compared. To validate the indices’ captured by satellite data in the UER, UWR, and NR, the index’s average for the two stations that fell in each region was computed for gauge and satellite and compared.
Q = Y i Y i I I
where Q is a Theil Sen’s slope estimator. Y i are Yi the values at times i′ and i, where i′ is greater than i, and n′ is all data pairs for which i′ is greater than i.
Z M K = S 1 V A R ( S ) if S > 0 = 0 if S = 0 = S + 1 V A R ( S ) if S < 0
S = k 1 n 1 j k + 1 n s g n x j x k
and
V A R ( S ) = 1 18 n ( n 1 ) ( 2 n + 5 ) p 1 g t p ( t p 1 ) ( 2 t p + 5 )
Z M K is the MK test statistic, S is the number of positive differences minus the number of negative differences, and V A R ( S ) is the variance of S.
The satellite’s performance against the gauge station data were assessed using the Pearson correlation coefficient (r), the Root-Mean-Square Error (RMSE), and the bias. The Pearson correlation coefficient (r) measures the linear relationship between the satellite and the gauge estimates and ranges between −1 to +1 (Equation (6)). RMSE is the mean deviation of the estimates from the observations (Equation (7)). Bias estimates the extent to which the satellite under or overestimates the gauge observations (Equation (8)). The Rainfall seasonal indices and their trends were generated using shell script and Python packages.
r = i = 0 n ( G i G ¯ ) ( S i S ¯ ) i = 0 n ( G i G ¯ ) 2 i = 0 n ( S i S ¯ ) 2
R M S E = 1 n i = 0 n ( G i S i ) G i ¯
B i a s = i = 0 n S i i = 0 n G i
where S is satellite (CHIRPs) data, G is the gauge data.

4. Results and Discussion

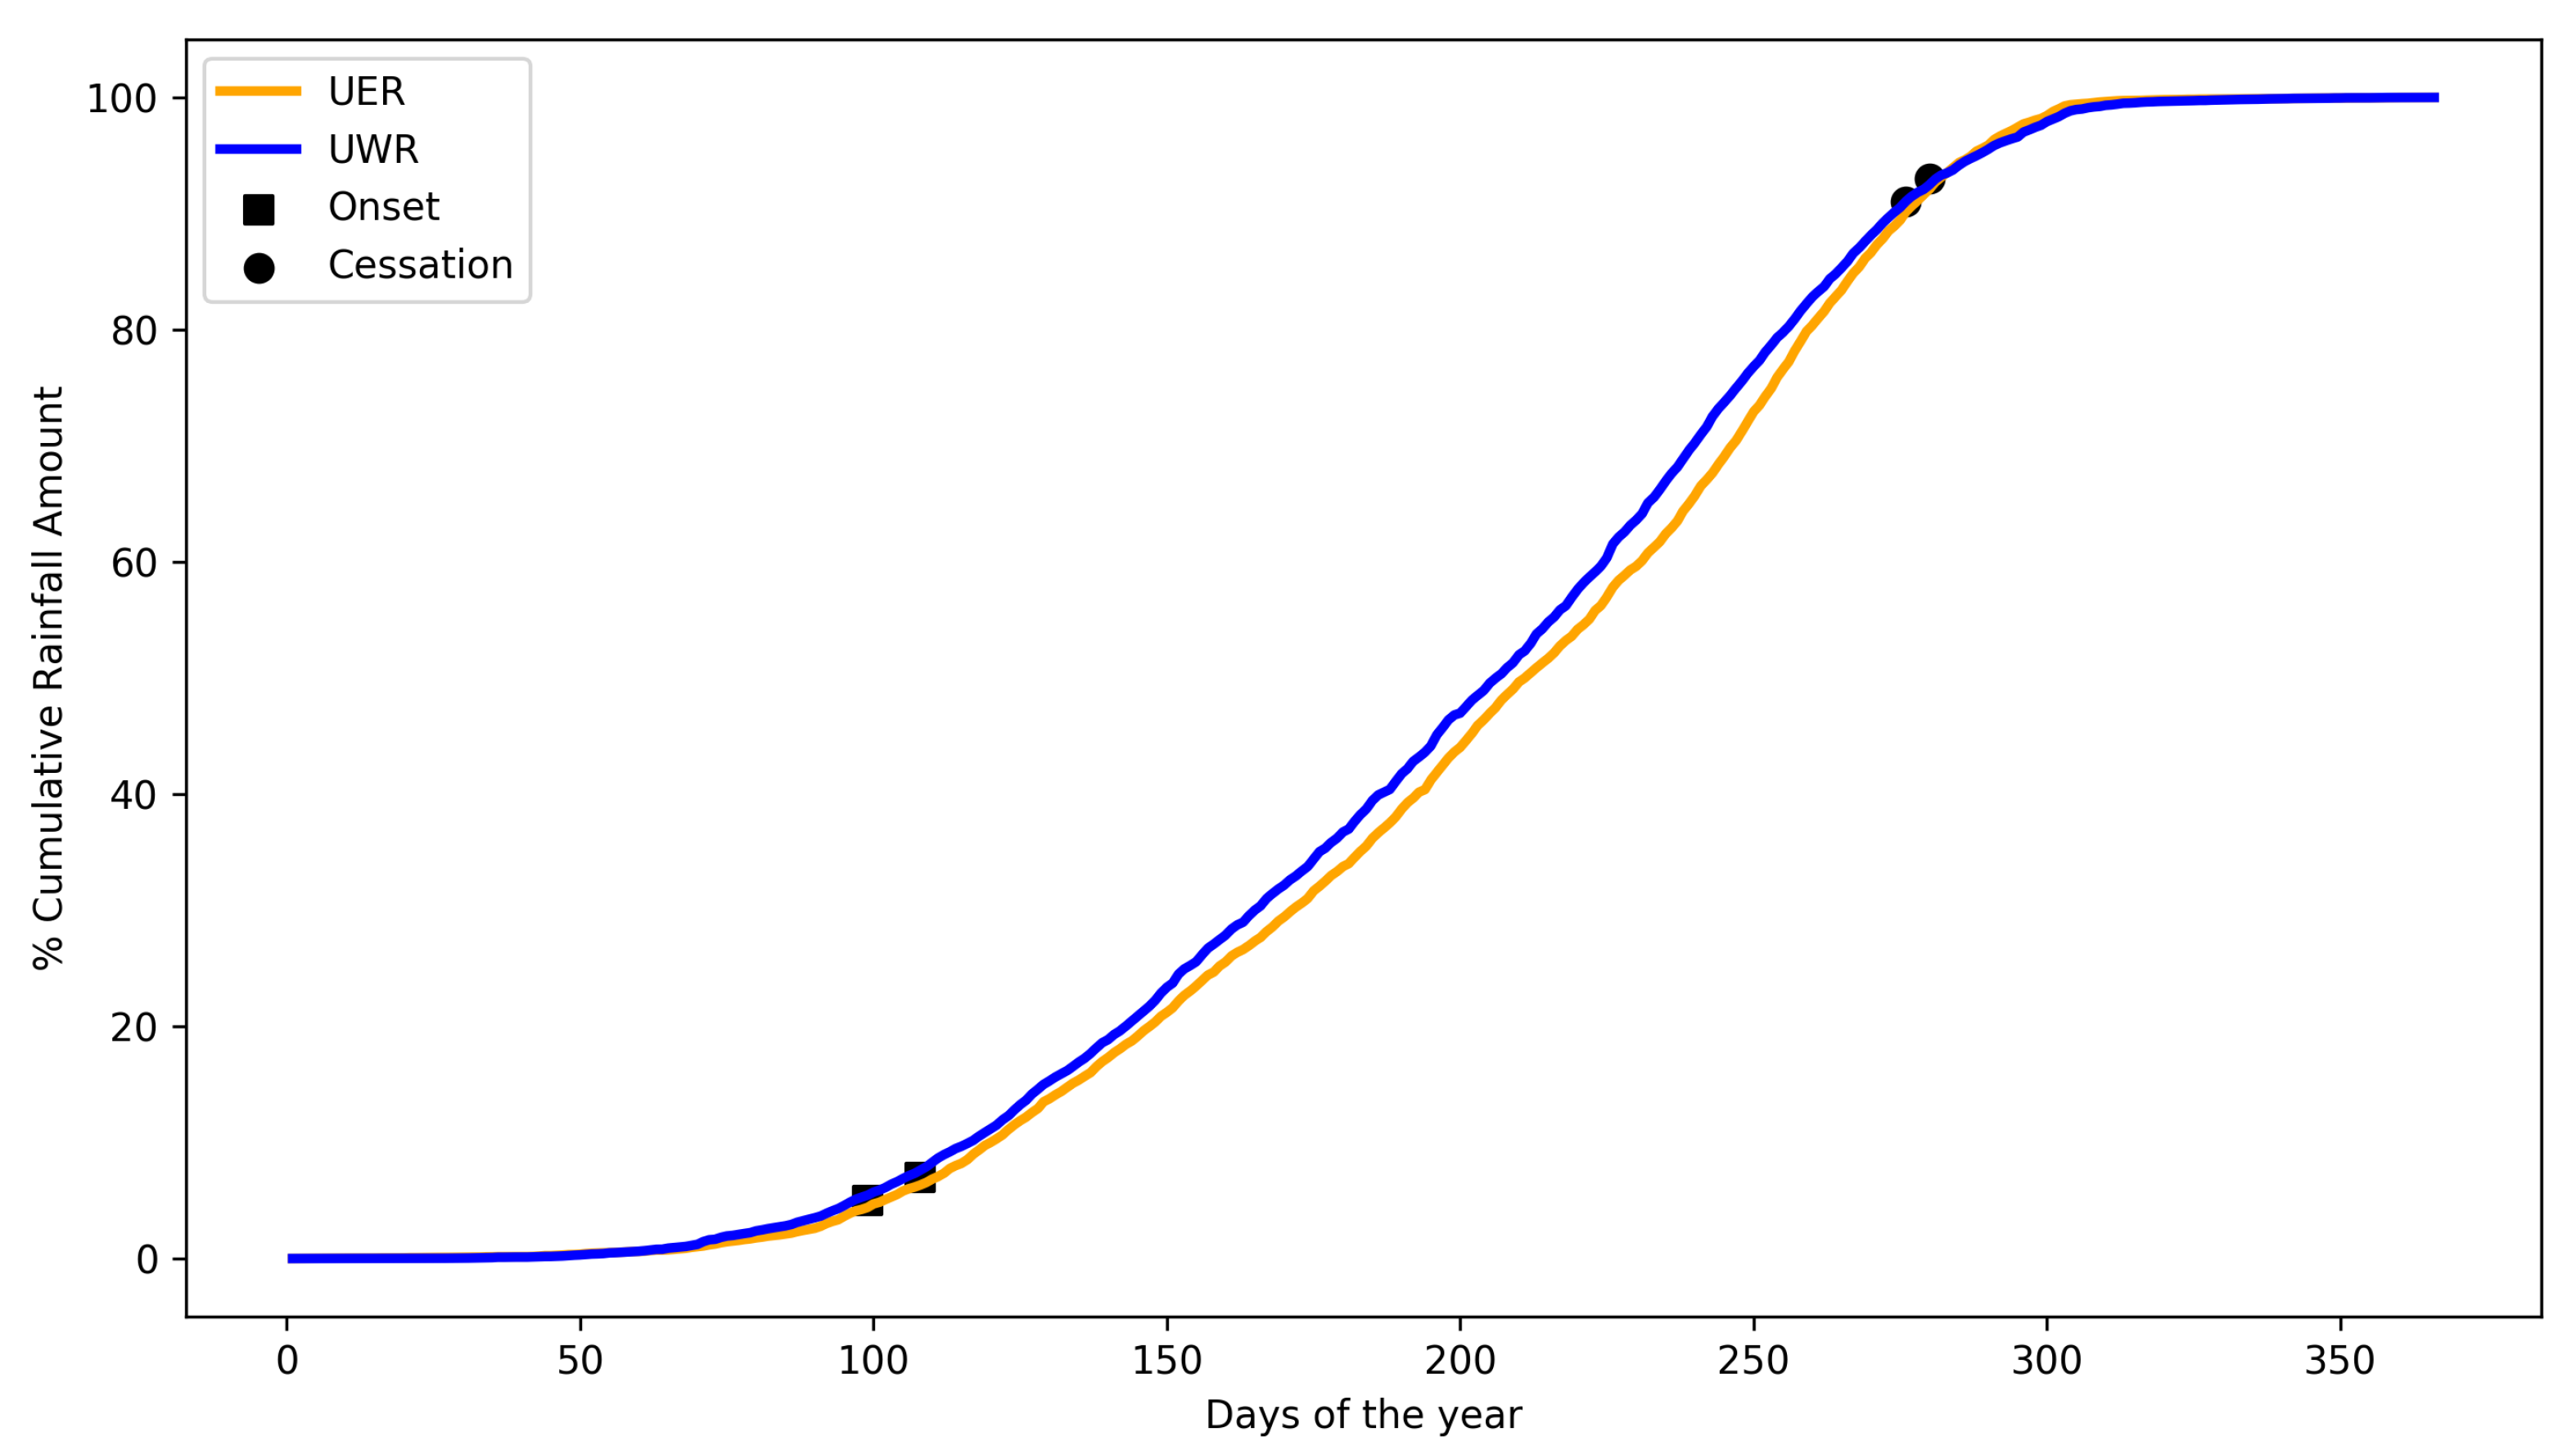
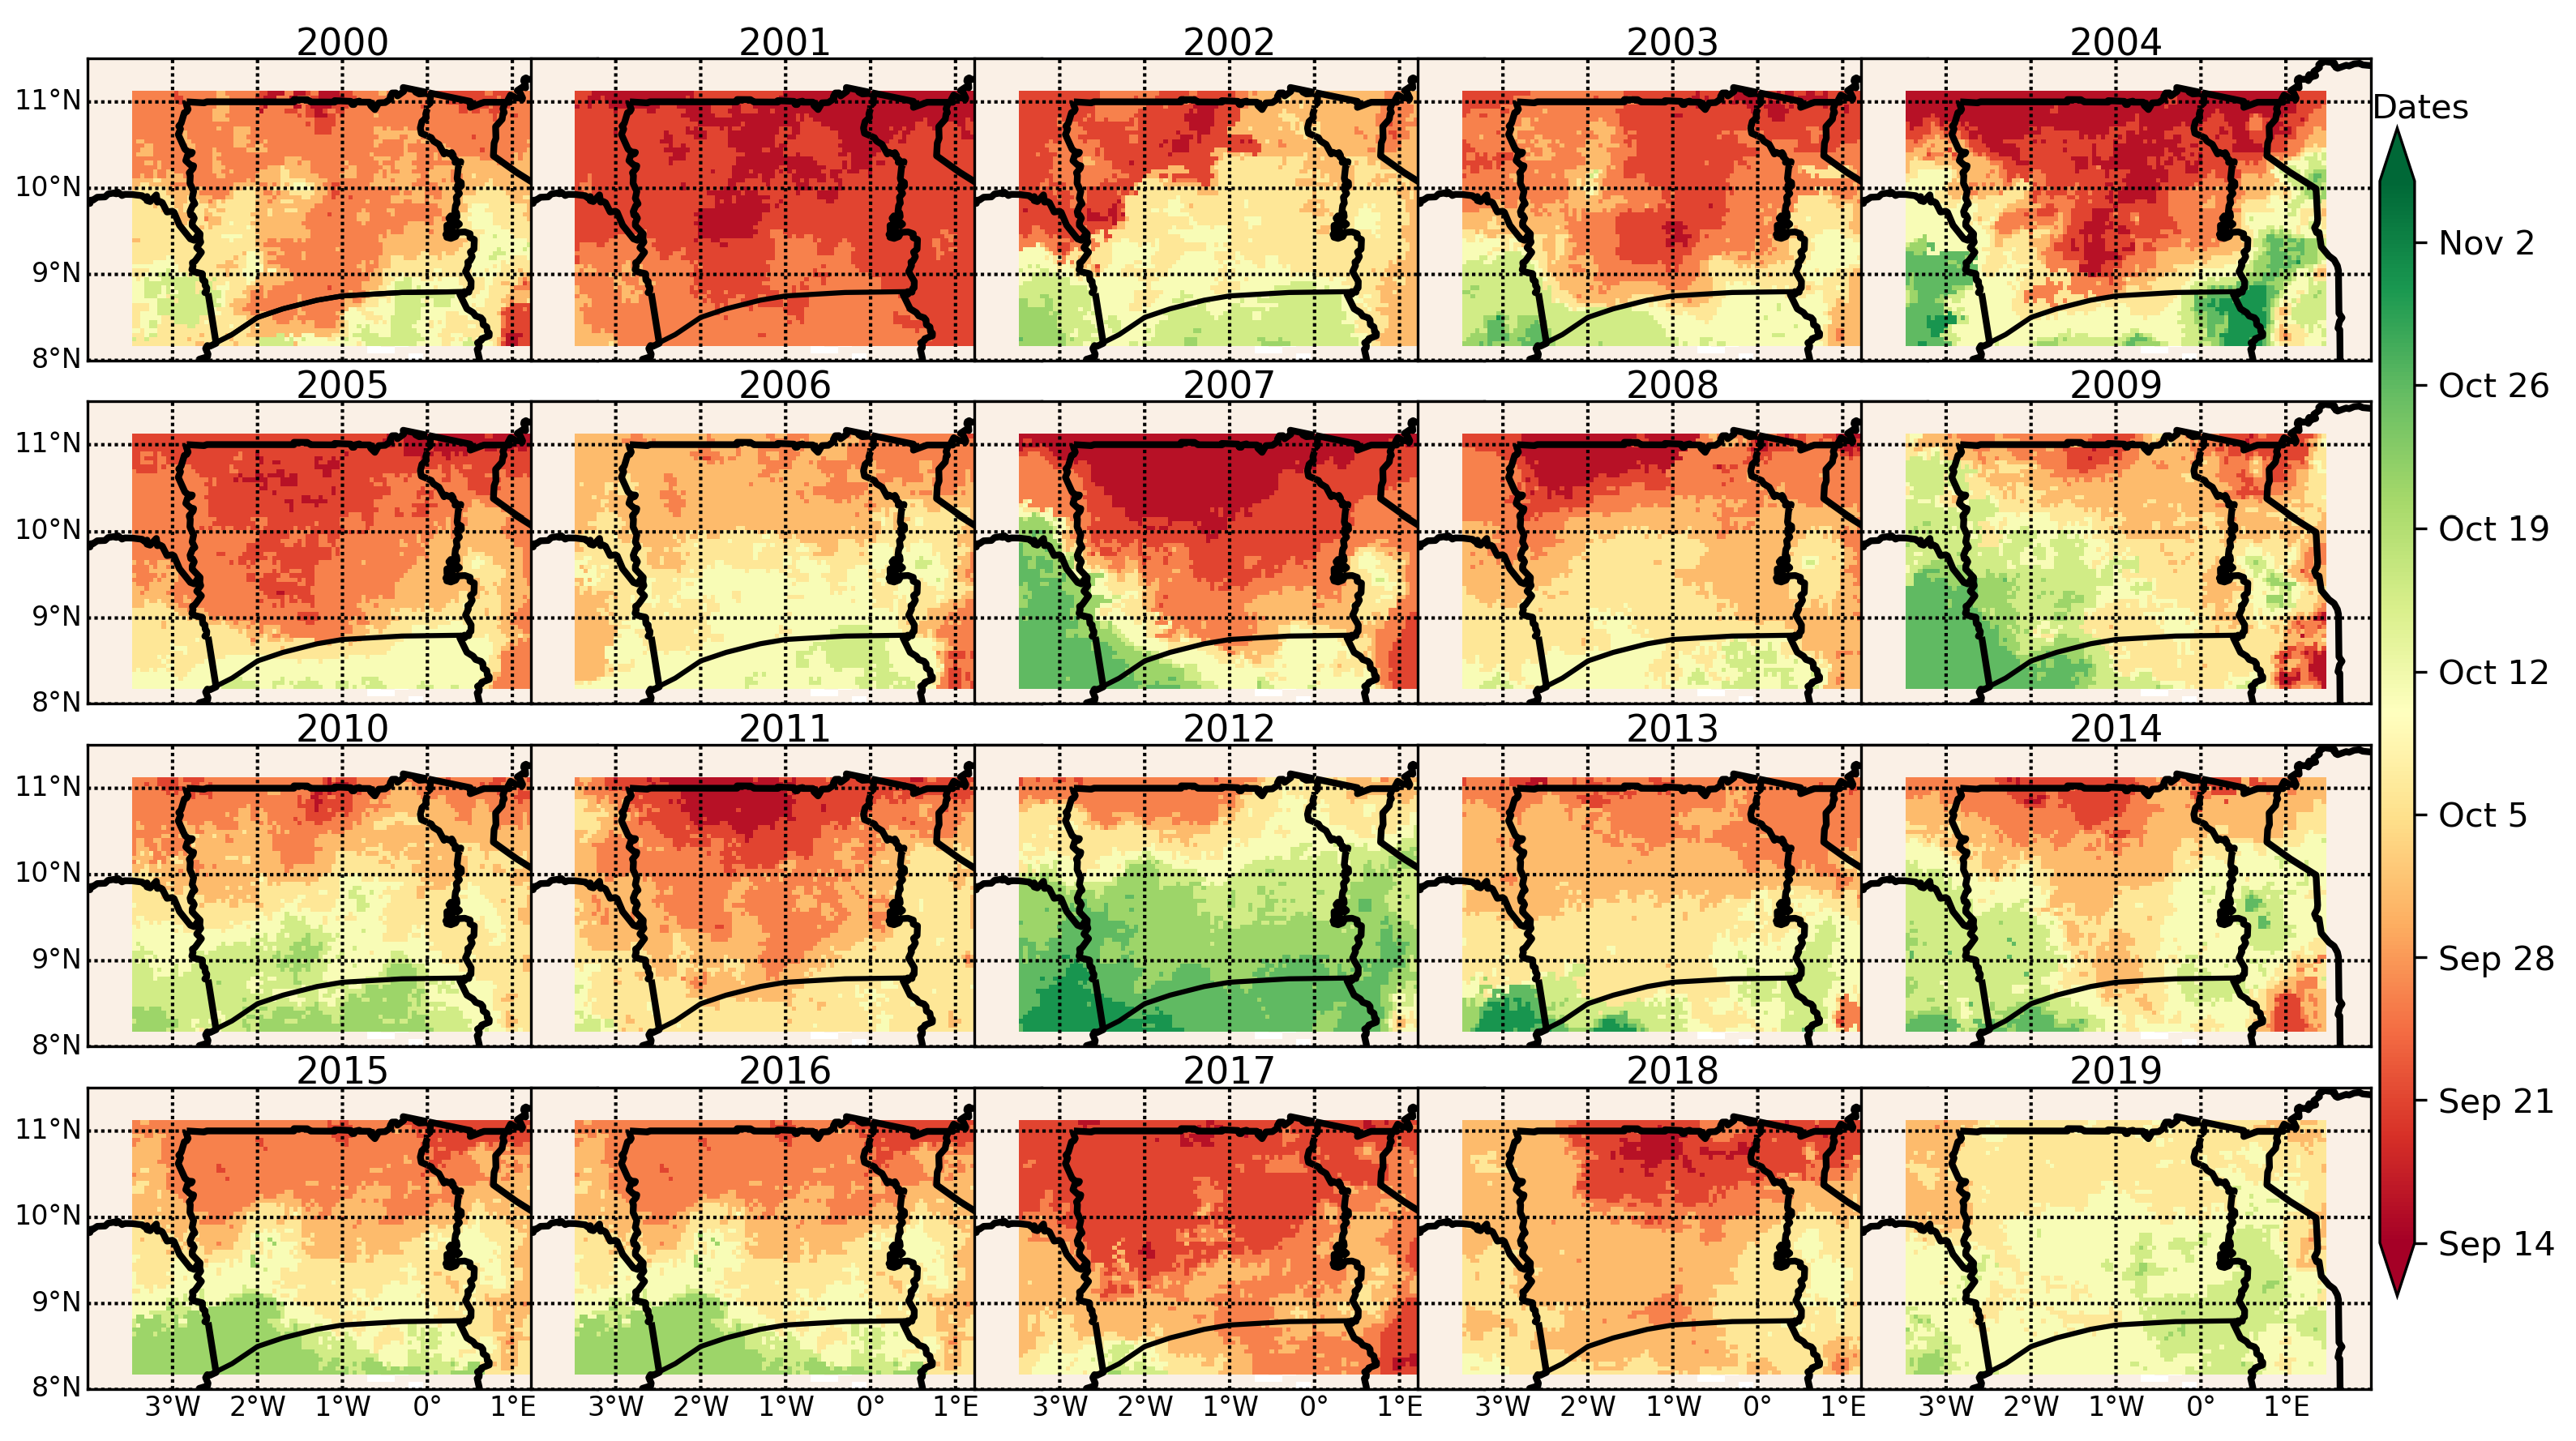
4.1. Satellite-Derived Seasonal Rainfall Indices (Onsets, Cessations, and Length of Growing Period (LGP)

Figure 1, Figure 2, Figure 3 and Figure 4 show maps of the three seasonal rainfall indices representing the onset, cessation, and the LGP, respectively, derived from the CHIRPS-v2 data. Only maps for 2000 to 2019 seasons are shown for illustration purposes but a summary for all the years is shown in Figure A3. The rainy season’s onset showed a progression along the south-west to northeast direction, with rains starting earlier in the former (Figure 2). Exceptionally early onsets were recorded in northern Ghana in 2013 that can potentially disorient farmers given it rained at the time that farmers usually prepare their fields. Figure 2 shows cases in 2009, 2011, 2013, and 2018 where early rainfall onsets (mid-March) were observed in the NR. In 2007, and 2014 seasons we observed an early onset of rain (21st March to 15th April) covering the entire region. However, the UWR experienced more instances of the early start of rainfall than the UER. Moreover, the NR has shown the earliest onset among the three regions. The transition agro-ecological zone in the NR showed the early start of rainfall (21st March) compared to areas located closer to the UER and UWR. This could also be due to the CHIRPS-v2 poor strength along the zonal boundaries, as reported in [36], which could lead to false onsets at these locations. On average, rainfall onsets occurred between 28th April to 25th May in the UER, 10th April–15th May in the UWR, and 21st March to 25th April in the NR except for exceptional seasons. Generally, the results revealed that the region’s rainfall indices have substantial latitudinal variability, with early onsets (21st March–15th April) south of 10oN latitude and late onsets (15th April–25th May) at the north of 10° N latitude.
Figure 3 represents the rainfall cessation over the northern portions of Ghana from 2000 to 2019. Rainfall cessation dates occurred between 14th September to 10th November and showed a seasonal progression from the North to South. However, for some years, almost all parts of the region showed early (2001, 2004, 2005, 2007, 2011, and 2017) and late (2009, 2012, 2019) cessation dates. These reflect the high level of uncertainty farmers encounter when making cropping decisions between seasons. Early cessations may interrupt grain filling, thus reducing the yield, while too late cessations may delay harvesting leading to increased pre-harvest losses and infestations of moulds that cause aflatoxins. On average, the UER and UWR had relatively earlier cessations (14th September–2nd October) compared to the NR (12th October–10th November). Generally, the UWR has relatively earlier rainfall cessations than UER, except in 2018. In 2012, the entire NR experienced very late cessations (1st–10th November).
The length of the growing period ranged between 120–210 days throughout the study area (Figure 4). The NR experienced longer LGP (180–210 days) than the UER and UWR (120–150 days). The southwestern of the NR exhibited relatively longer LGP (over 200 days), particularly during the 2009, 2013, and 2018 seasons. In contrast to the onset dates, the LGP showed a seasonal progression along the North-East to South-west direction, with some years having exceptionally shorter (2000–2001) or longer (2012–2013) rainy seasons (Figure 4). Similar to rainfall onset, LGP has a strong latitudinal variability with longer and shorter LGP observed south and north of the 10° N latitude, respectively. The 2012 and 2013 had exceptionally long LGP (180 to 210 days) in almost the entire region. Long LPGs are a consequence of early onset and late rainfall cessation and vice versa.

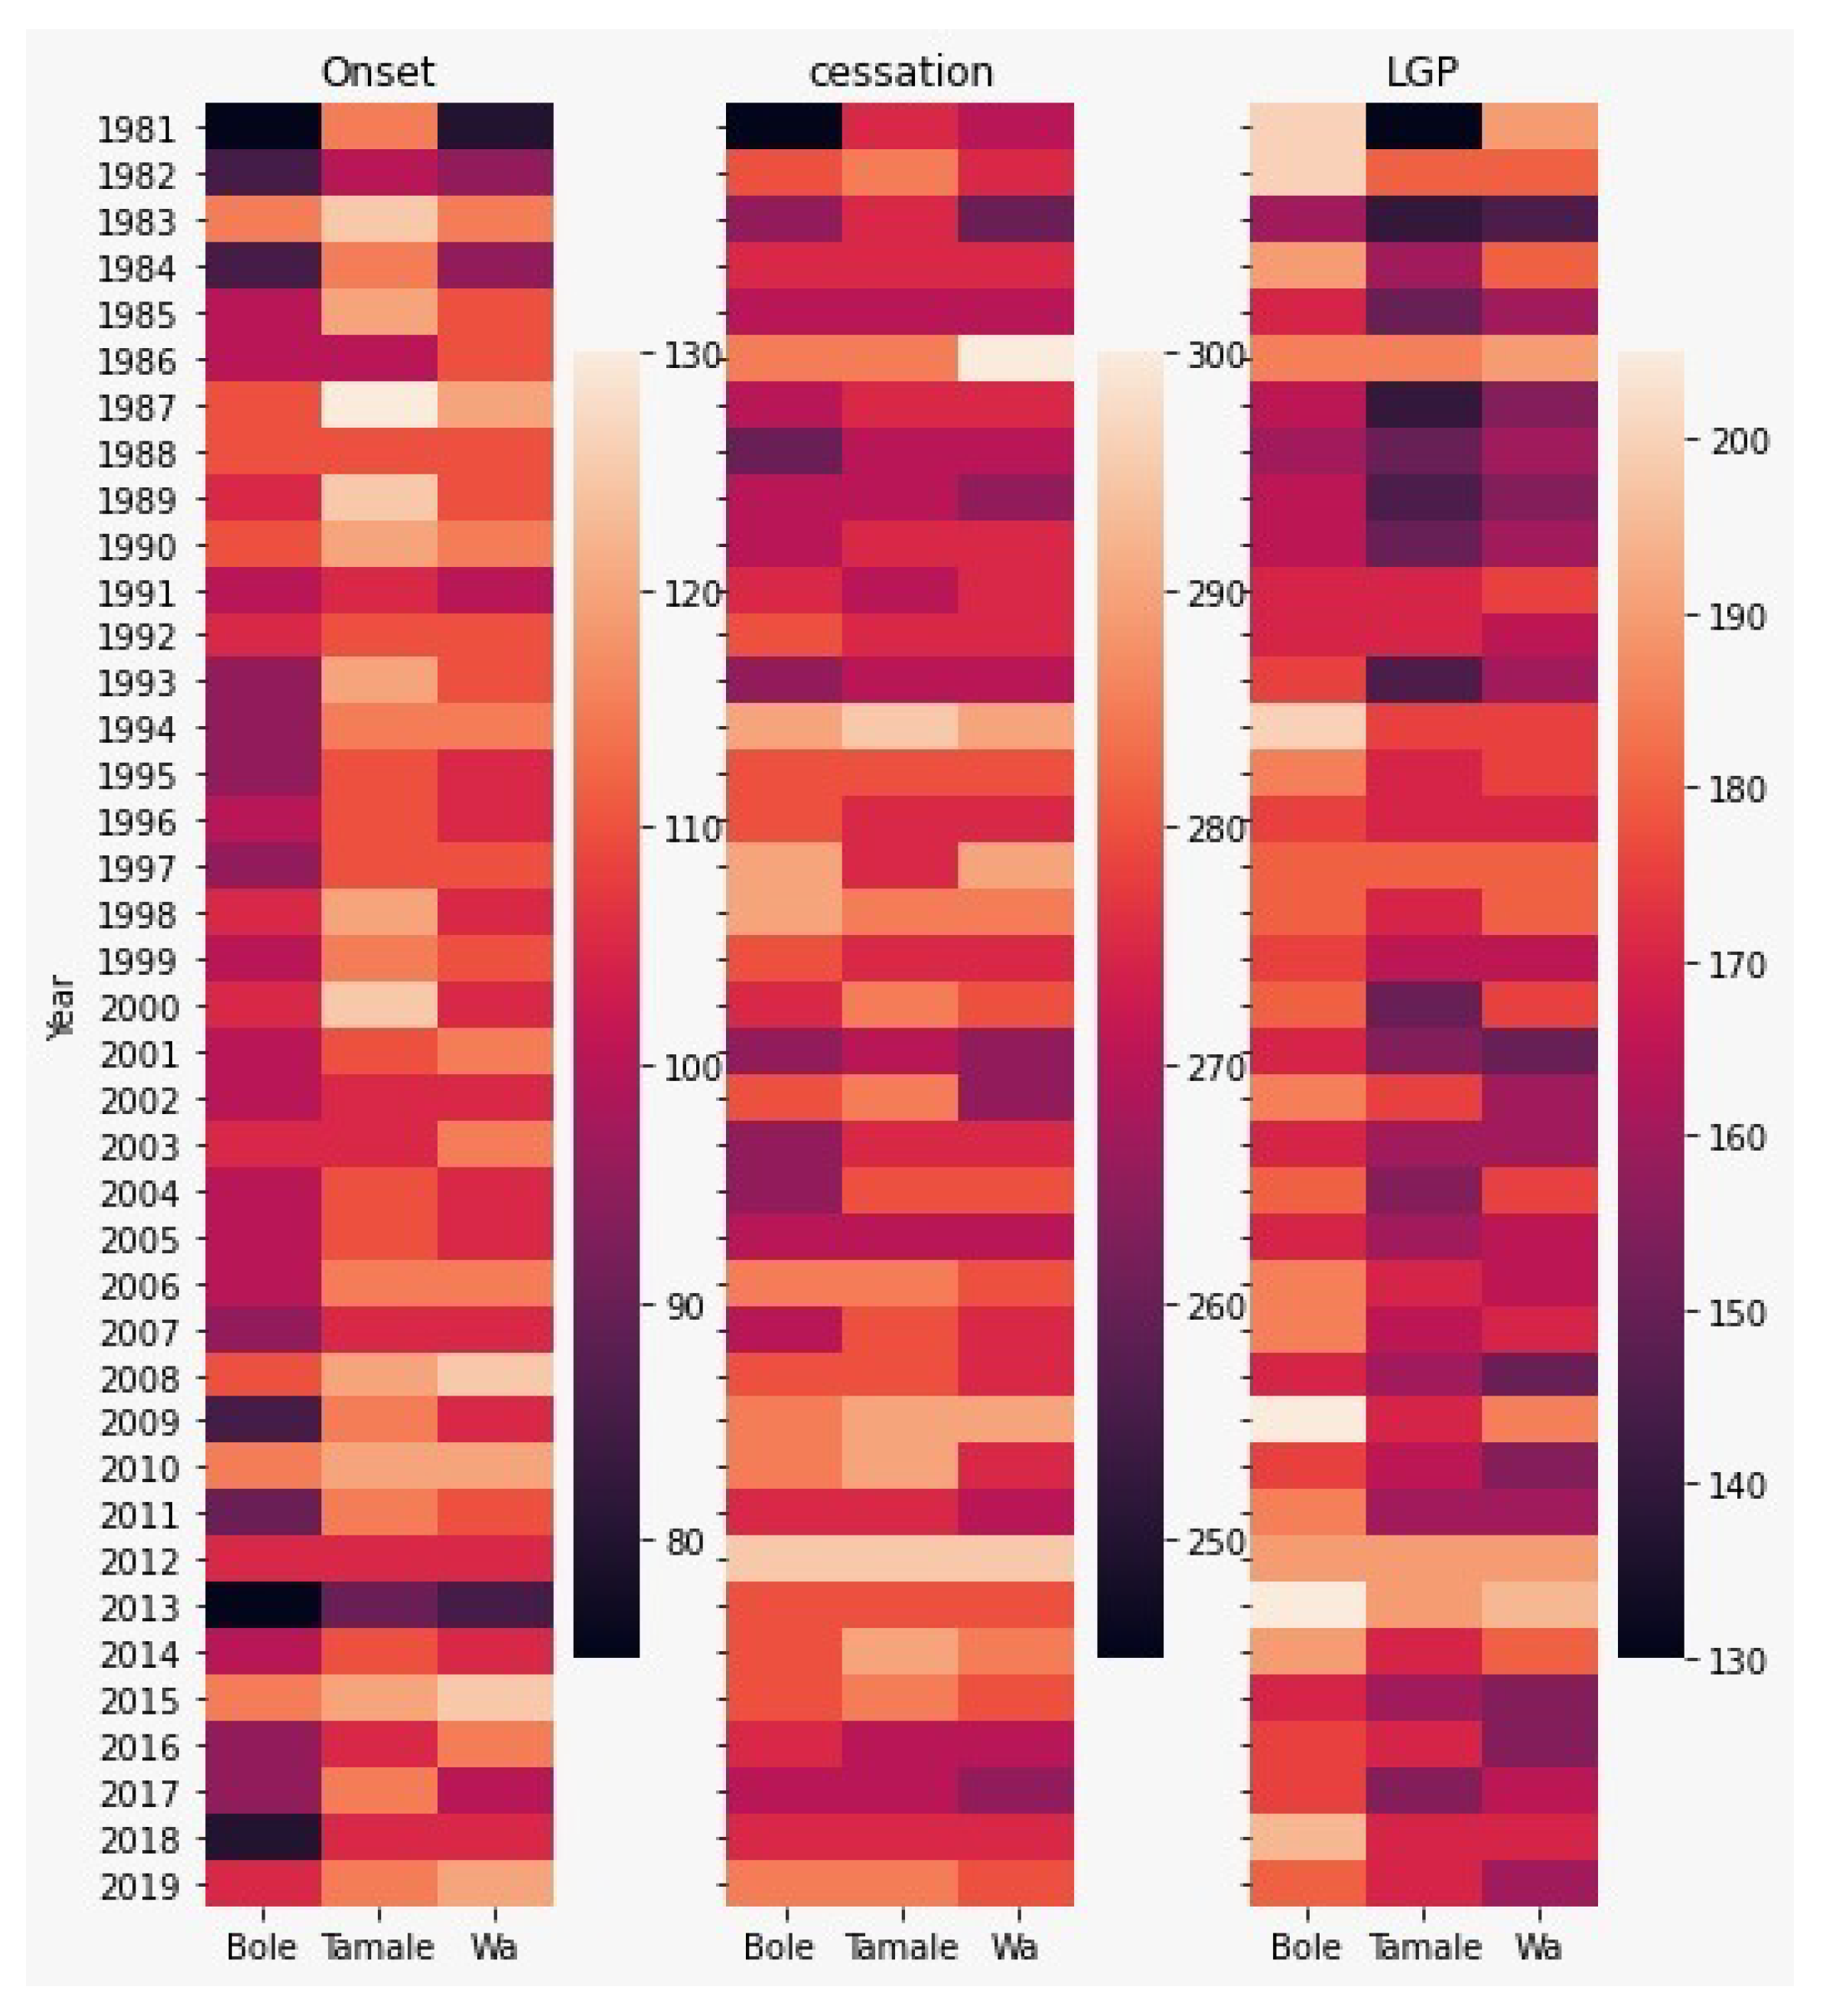
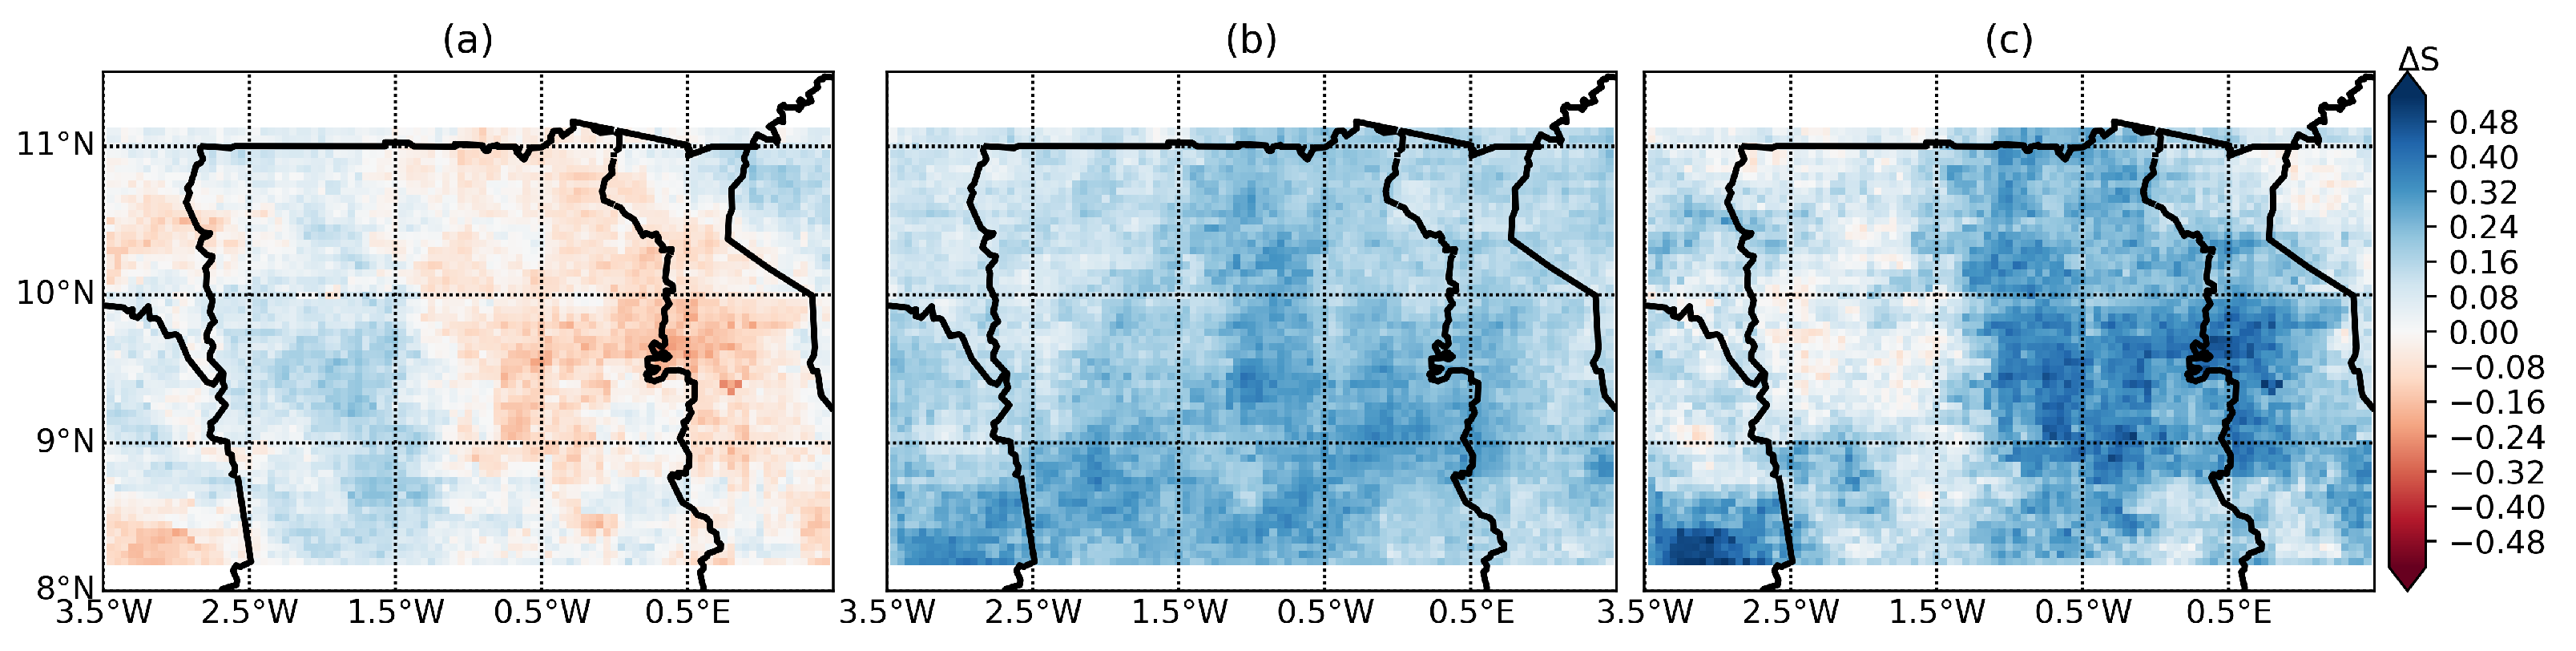
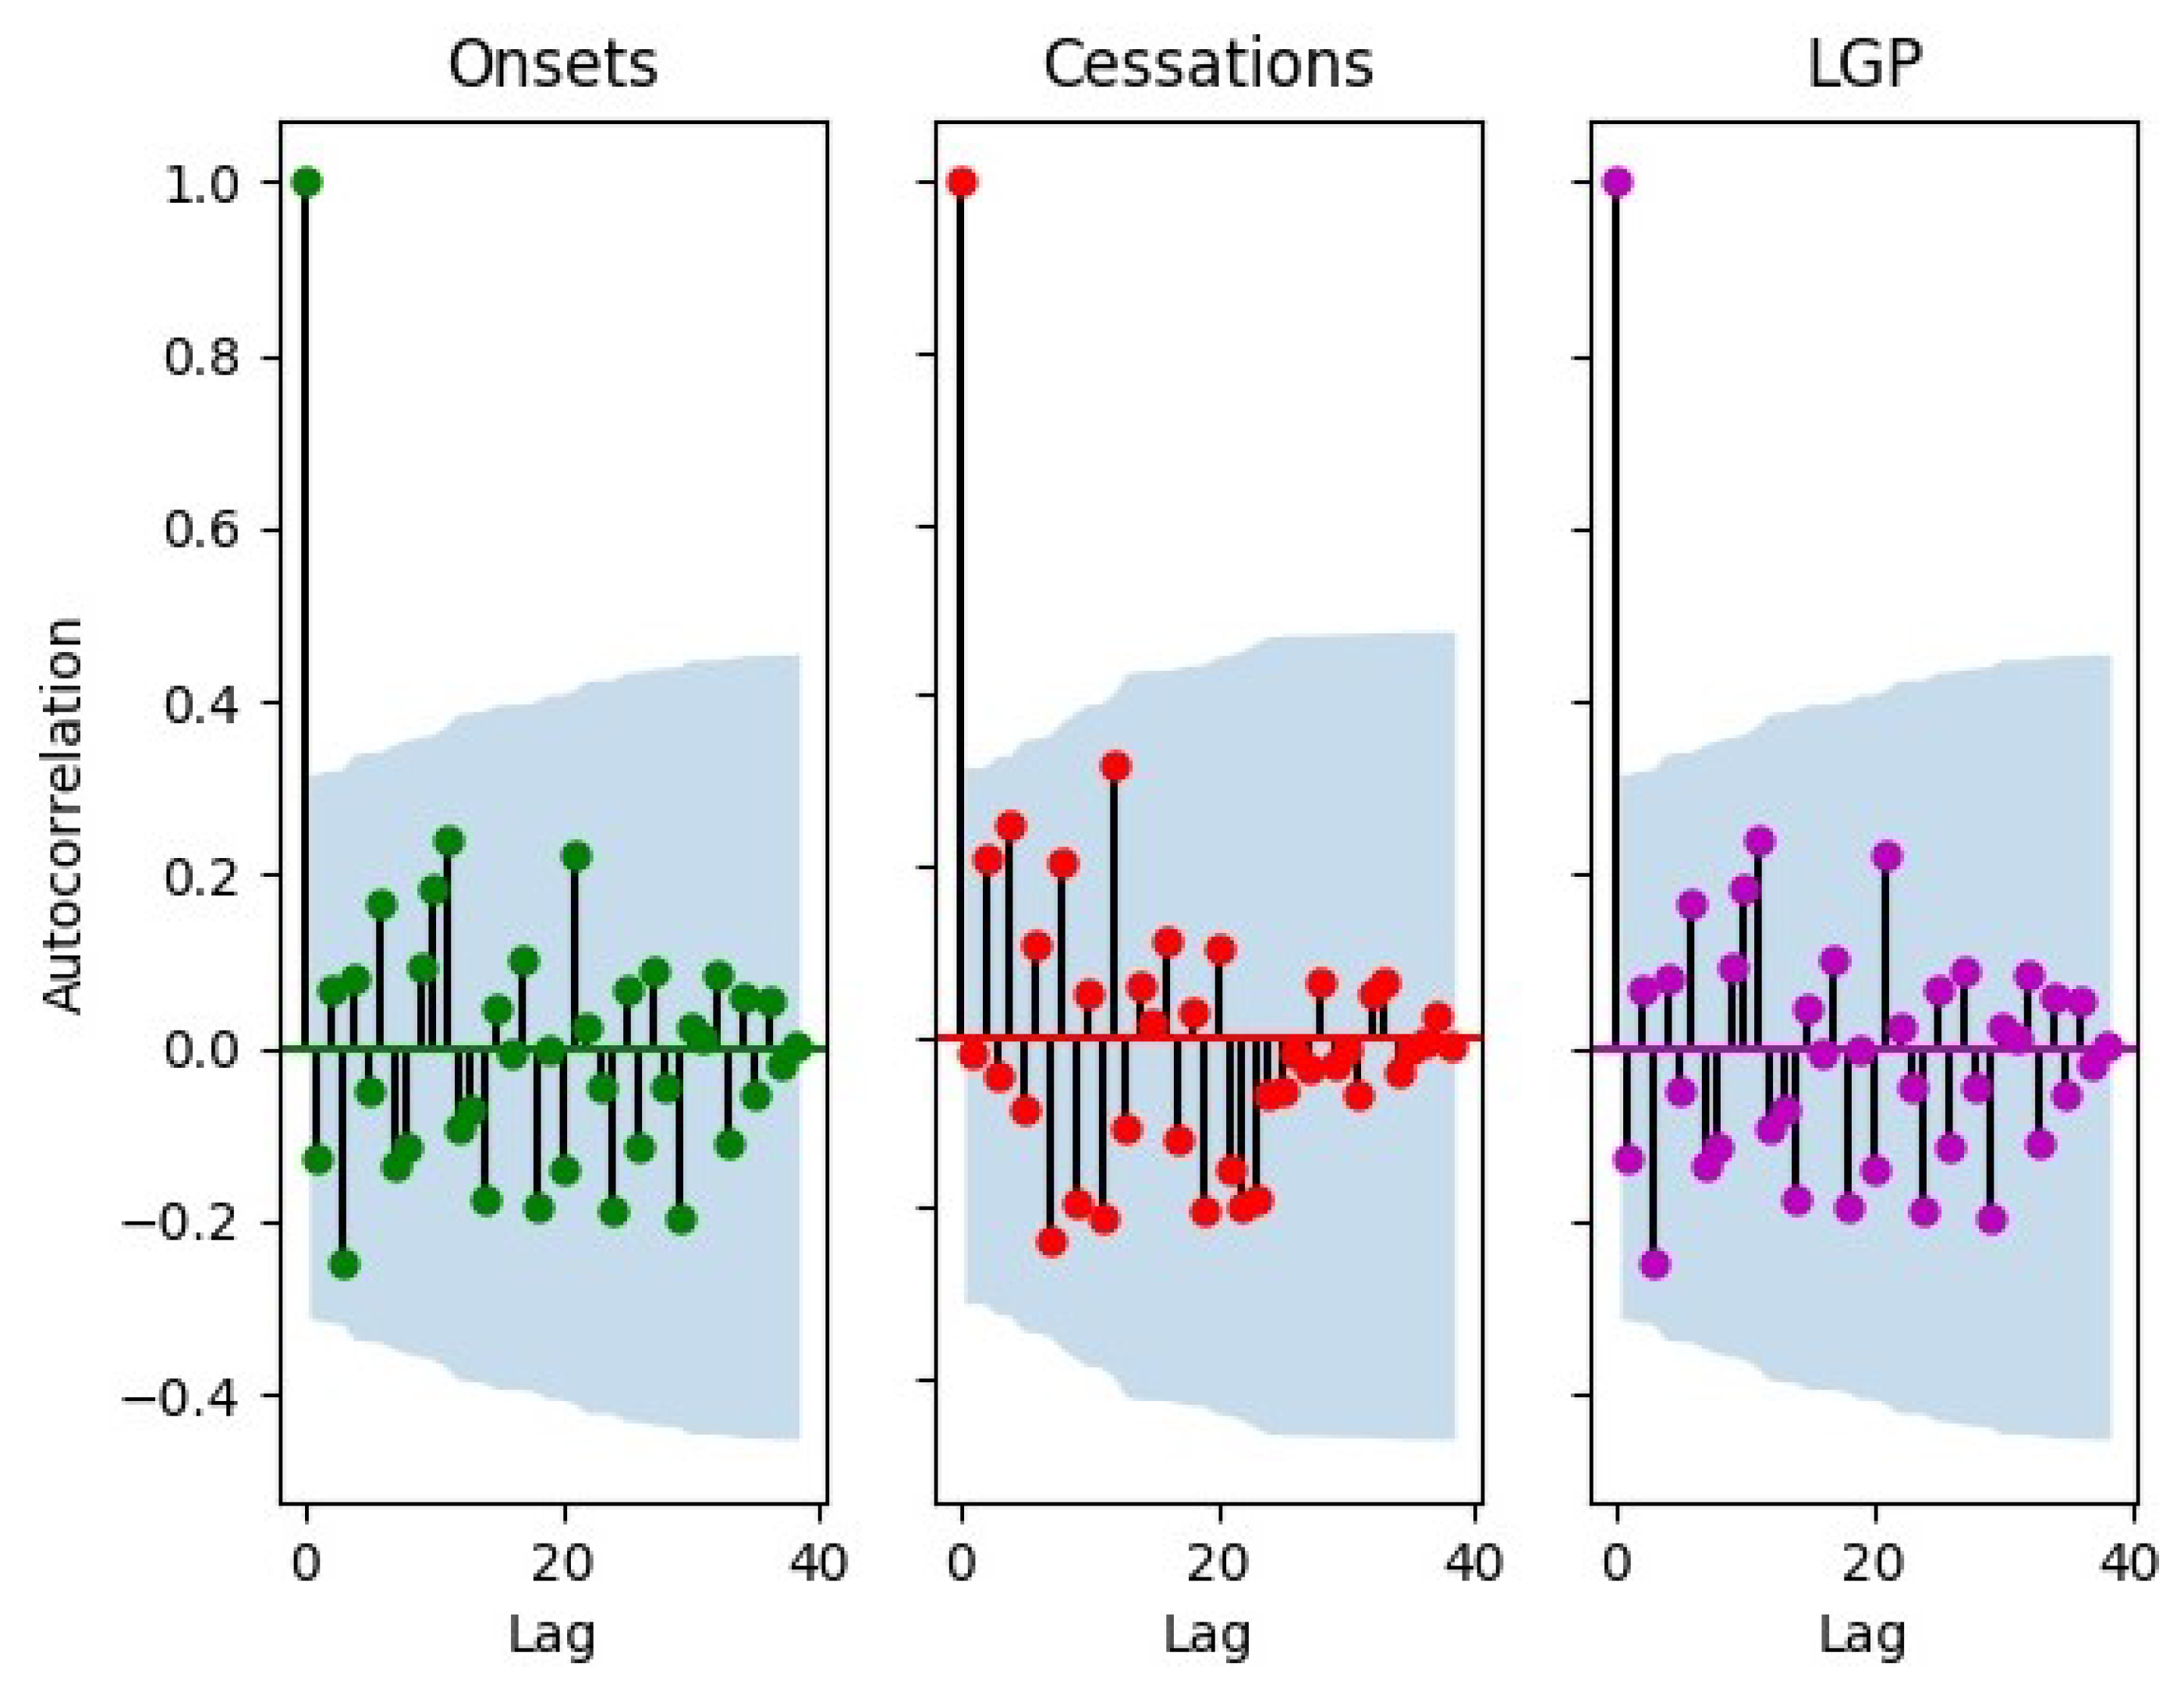
4.2. Trends of Rainfall Onset, Cessation, and Length of the Growing Season

The CHIRPS-v2 data revealed earlier, and late onsets date over the West and East of 1.5° W longitude, respectively (Figure 5a). The observed trends of rainfall onset dates confirm and contradict recent studies in the same region. For example, [12] reported earlier onset dates of the rain season in Tamale and Wa gauge stations between 1986–2010, ranging from −0.3 to −0.5 days/year 7.5 to 12.5 days earlier in the 25 years period. However, Ref. [18] reported a significant delay of onset dates up-to 0.8 days/year in the Volta basin in Ghana (35 days delay in 40 years). Ref. [17] reported a 16-day delay of rainfall onset in the UER, although they monitored a shorter period (1997–2014) with very coarse resolution gridded data (110 Km). Rainfall showed late-cessation dates over most parts of Northern Ghana (Figure 5b). Similarly, longer LGP were observed East of 1.5° W longitude of northern Ghana due to late cessation of rains (Figure 5a,c). The contrasting trends of onset and cessation dates reported in different studies could result from different datasets, the temporal span and the methods applied in the analysis. Nevertheless, several studies have demonstrated the accuracy of the PMCR method that we applied [10,11]. However, one weakness of the method is that it mostly does not take into consideration false onsets. Moreover, a weakness identified with the CHIRPS-v2 data was that it tends to be biased towards capturing false onsets near boundaries of the study area.

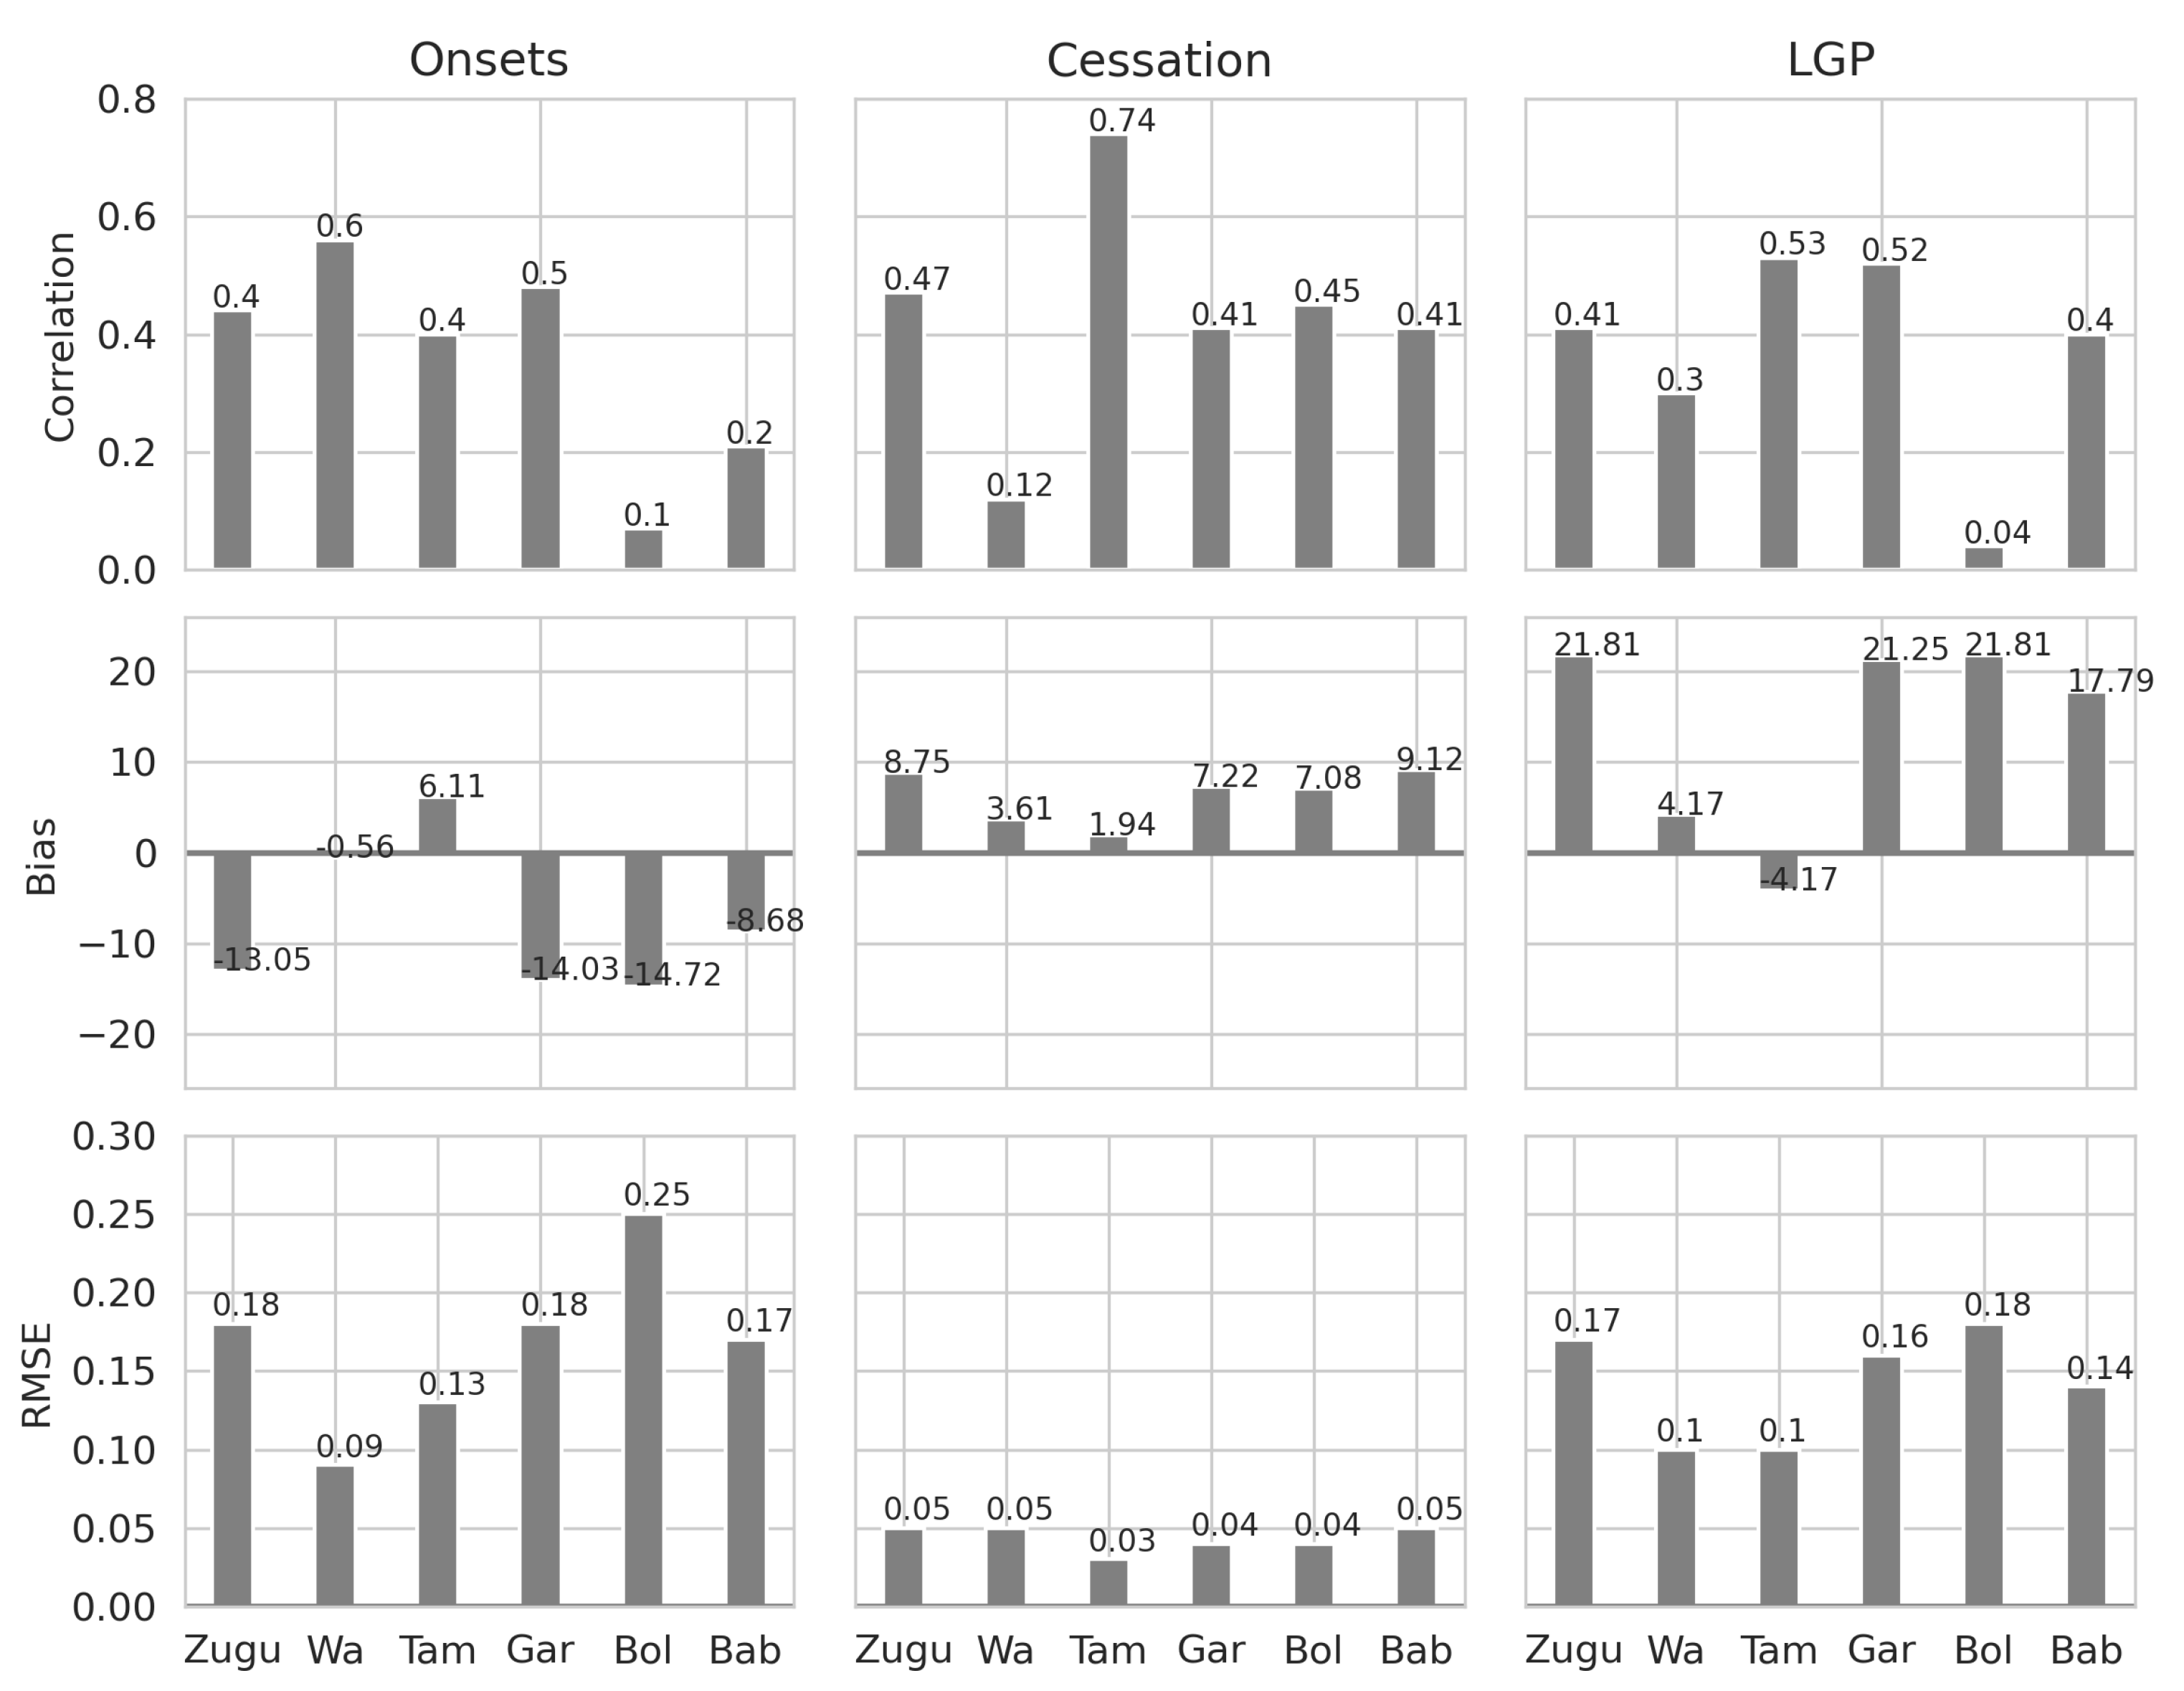
4.3. Validation of Seasonal Rainfall Indices Derived from Satellite and Farmer’s Perceptions

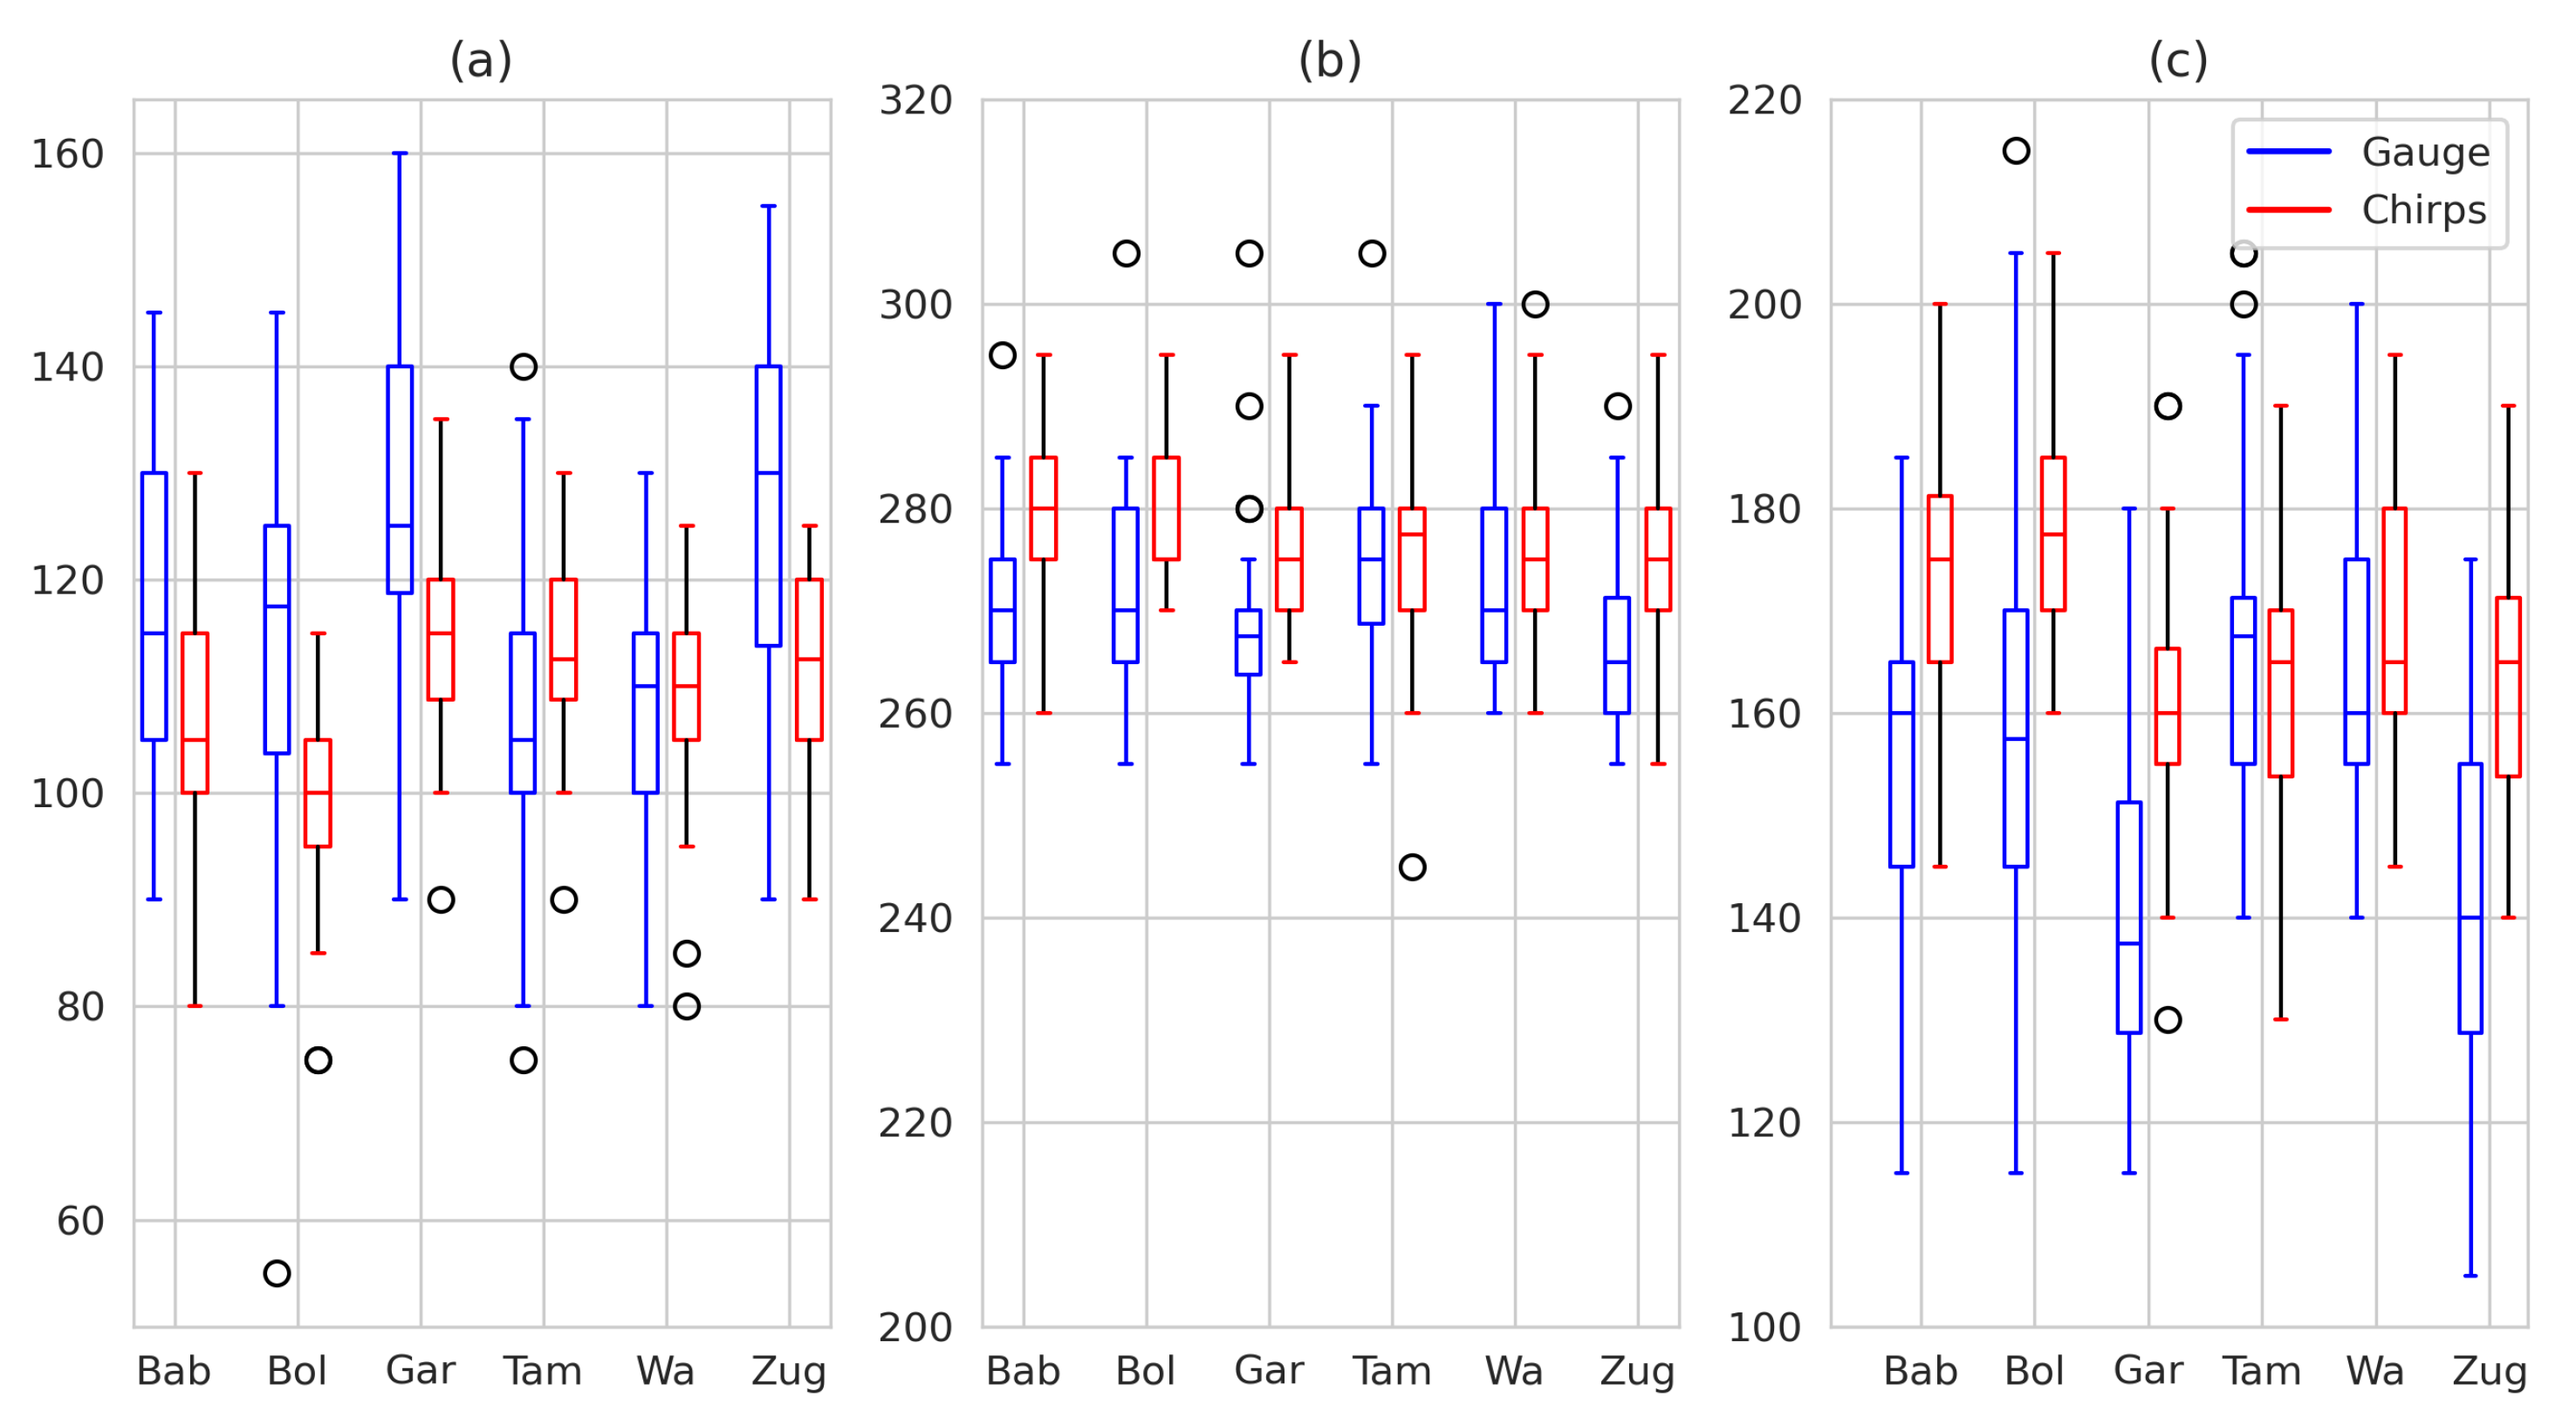
Gauge vs. Satellite Data

This section assessed the CHIRPS-v2 satellite data’s ability to capture the three seasonal rainfall indices (onset, cessation and LGP) in the UER, UWR, and NR of Northern Ghana. Figure 6 represents the variability values of the rainfall indices from satellite and gauge data at the six stations from 1981 to 2016 in, UER (Garu and Zuarungu), and UWR (Wa and Babile), and NR (Bole and Tamale). The rainfall onsets as captured by gauge occurred between 80–140 days, while the onsets captured by satellite occurred between 80–135 days in the six stations, except for exceptionally early onsets observed at some locations. It is observed that satellite data generally captured the earliest onsets in UWR (Wa) compared to gauge. Specifically, Bole showed the earliest onset recorded on 58 days for gauge and 78 days for satellite. Exceptionally early onsets were also observed at some locations as shown by outliers (in black circles). The gauge data showed that rainfall cessation dates generally occurred between 255–305 days compared to between 255–295 days from the CHIRPS-v2 except for exceptional early (late) cessations at Tamale (Wa) (Figure 6). Early cessation of rainfall was observed at the Garu and Zuarungu stations located in the Upper East region. The LGP at the location of all stations from the gauge and CHIRPS-v2 data ranged between 105–205 days and 130–205 days, respectively. The shortest LGP observed from gauge was 105 days at the Zuarungu station. On average, CHIRPS-v2 captured longer LGP compared to gauge at Babile, Garu and Zuarungu stations. Generally, CHIRPS-v2 consistently returned early (late) onset (cessation) dates across the six stations. The onset dates derived from CHIRPS-v2 had less temporal variability compared to the gauge. The cessations date had less variability over time compared to the onset dates. CHIRPS-v2 returned longer LGP as a consequent of early-onset and late-onset dates than the gauge stations.
The statistical performance of the satellite in capturing the rainfall indices at the stations (Bole, Babile, Garu, Tamale, Zuarungu, and Wa) is presented in Figure 7. CHIRPS-v2 showed an average performance for the rainfall onsets compared to the gauge at the two stations located at the UER and the Wa and Tamale stations with r values between 0.4 and 0.60. However, a very poor correspondence (r < 0.22) was observed for the Babile and Bole stations located at the UWR and NR, respectively. The rainfall onsets’ bias values range from −15 to +6 days at the six stations. Generally, the onset days are under-estimated (earlier onset dates) in all stations except in the Tamale station, where onsets were slightly over-estimated (delayed onset dates) by six days. The Root means square error values of onsets at the stations were in the range of 0.09–0.25. The Bole station in the Northern region recorded the highest value (RMSE = 0.25) while the least was observed in Wa located in the Upper West region. In general, for rainfall cessations, CHIRPS-v2 showed a good agreement with gauge (0.4–0.74) except in the Wa station where a weak correlation coefficient (r = 0.12) was recorded. The bias values are in the range of 4–9 days, indicating a late estimate of rainfall cessations dates. The minimal RMSE values (0.03–0.05) observed in all stations reveal that CHIRPS-v2 data generally captured the rainfall cessations. The correlation coefficients of LGP between gauge and CHIRPS-v2 at the stations were in the range of 0.4–0.53 except in the Bole station. The low correlation in Bole (r = 0.04) could be because this station had more than 20% of missing data that was gap-filled. CHIRPS-v2 produced longer LGP in all but Tamale station, where the estimate was shorter by 4 days than the gauge. The RMSE for the LGP from CHIRPS-v2 at all the stations ranges from 0.1–0.18. CHIRPS-v2 in the Wa and Tamale stations recorded the lowest RMSE value of 0.1.
In contrast, relatively high RMSE values (0.14–0.18) were observed in the remaining stations. Although CHIRPS-v2 showed good skill in capturing the rainfall indices over the study region, high biases were detected in some cases. According to [26], the skill of CHIRPS rainfall estimates has high spatial variability due to the influence of climate, topography, and seasonal rainfall patterns. CHIRPS-v2 is known to overestimate and under-estimate low and high-intensity rains in this region, respectively [6]. The inherent systematic biases in CHIRPS-v2 emanates from low density and decreasing Global Telecommunication System (GTS) data over time, leading to insufficient representation of rainfall [26,27,36]. The systematic bias has significant implications for agricultural production, considering that crops’ success or failure is more dependent on accurate estimating of onsets and cessations of rains. The accuracy of estimating the three rainfall indices can be improved by applying robust method for correcting systematic biases in CHIRPS-v2 data such as the bias correction and spatial disaggregation (BCSD; [45]) or the Bayesian bias correction method [46].
Figure 8 represents the temporal trends of rainfall onset, cessation, and length of the growing period during 1981–2016 derived from gauge and CHIRPS-v2 dataset in the UWR (Wa), UER (Zuarungu), and NR (Tamale). At Zuarungu station, there was a fair agreement (r > 0.4) between gauge and satellite for all rainfall indices, and the RMSE was relatively low (RMSE < 0.19; Figure 8a,d,g). Both the gauge and satellite captured the decreasing trend of rainfall onsets and increasing cessations and LGP in Zuarungu, although with differing slopes. At Wa station, the rainfall onset dates derived from CHIRPS-v2 data showed a good correlation with gauge (r = 0.57), but the direction and magnitude of slopes differed substantially (Figure 8b). At Tamale station, the satellite agreed better with the gauge for the rainfall cessation (r = 0.74, Figure 8f), followed by LGP (r = 0.53; Figure 8i), and lastly, the onsets (r = 0.4, Figure 8c). Moreover, both satellite and gauge showed earlier onset dates but late or longer cessation and LGP in Tamale. The observed trends of rainfall onset contrast and confirms some findings in [12], who reported earlier onset dates of 7.5 days in Tamale and Wa. Our results reveal early (late) onsets dates of 8 days in Tamale (Wa) as captured by CHIRPS-v2 from 1981 to 2016. Therefore, our results agree with [12] at Tamale but contrast at Wa station.

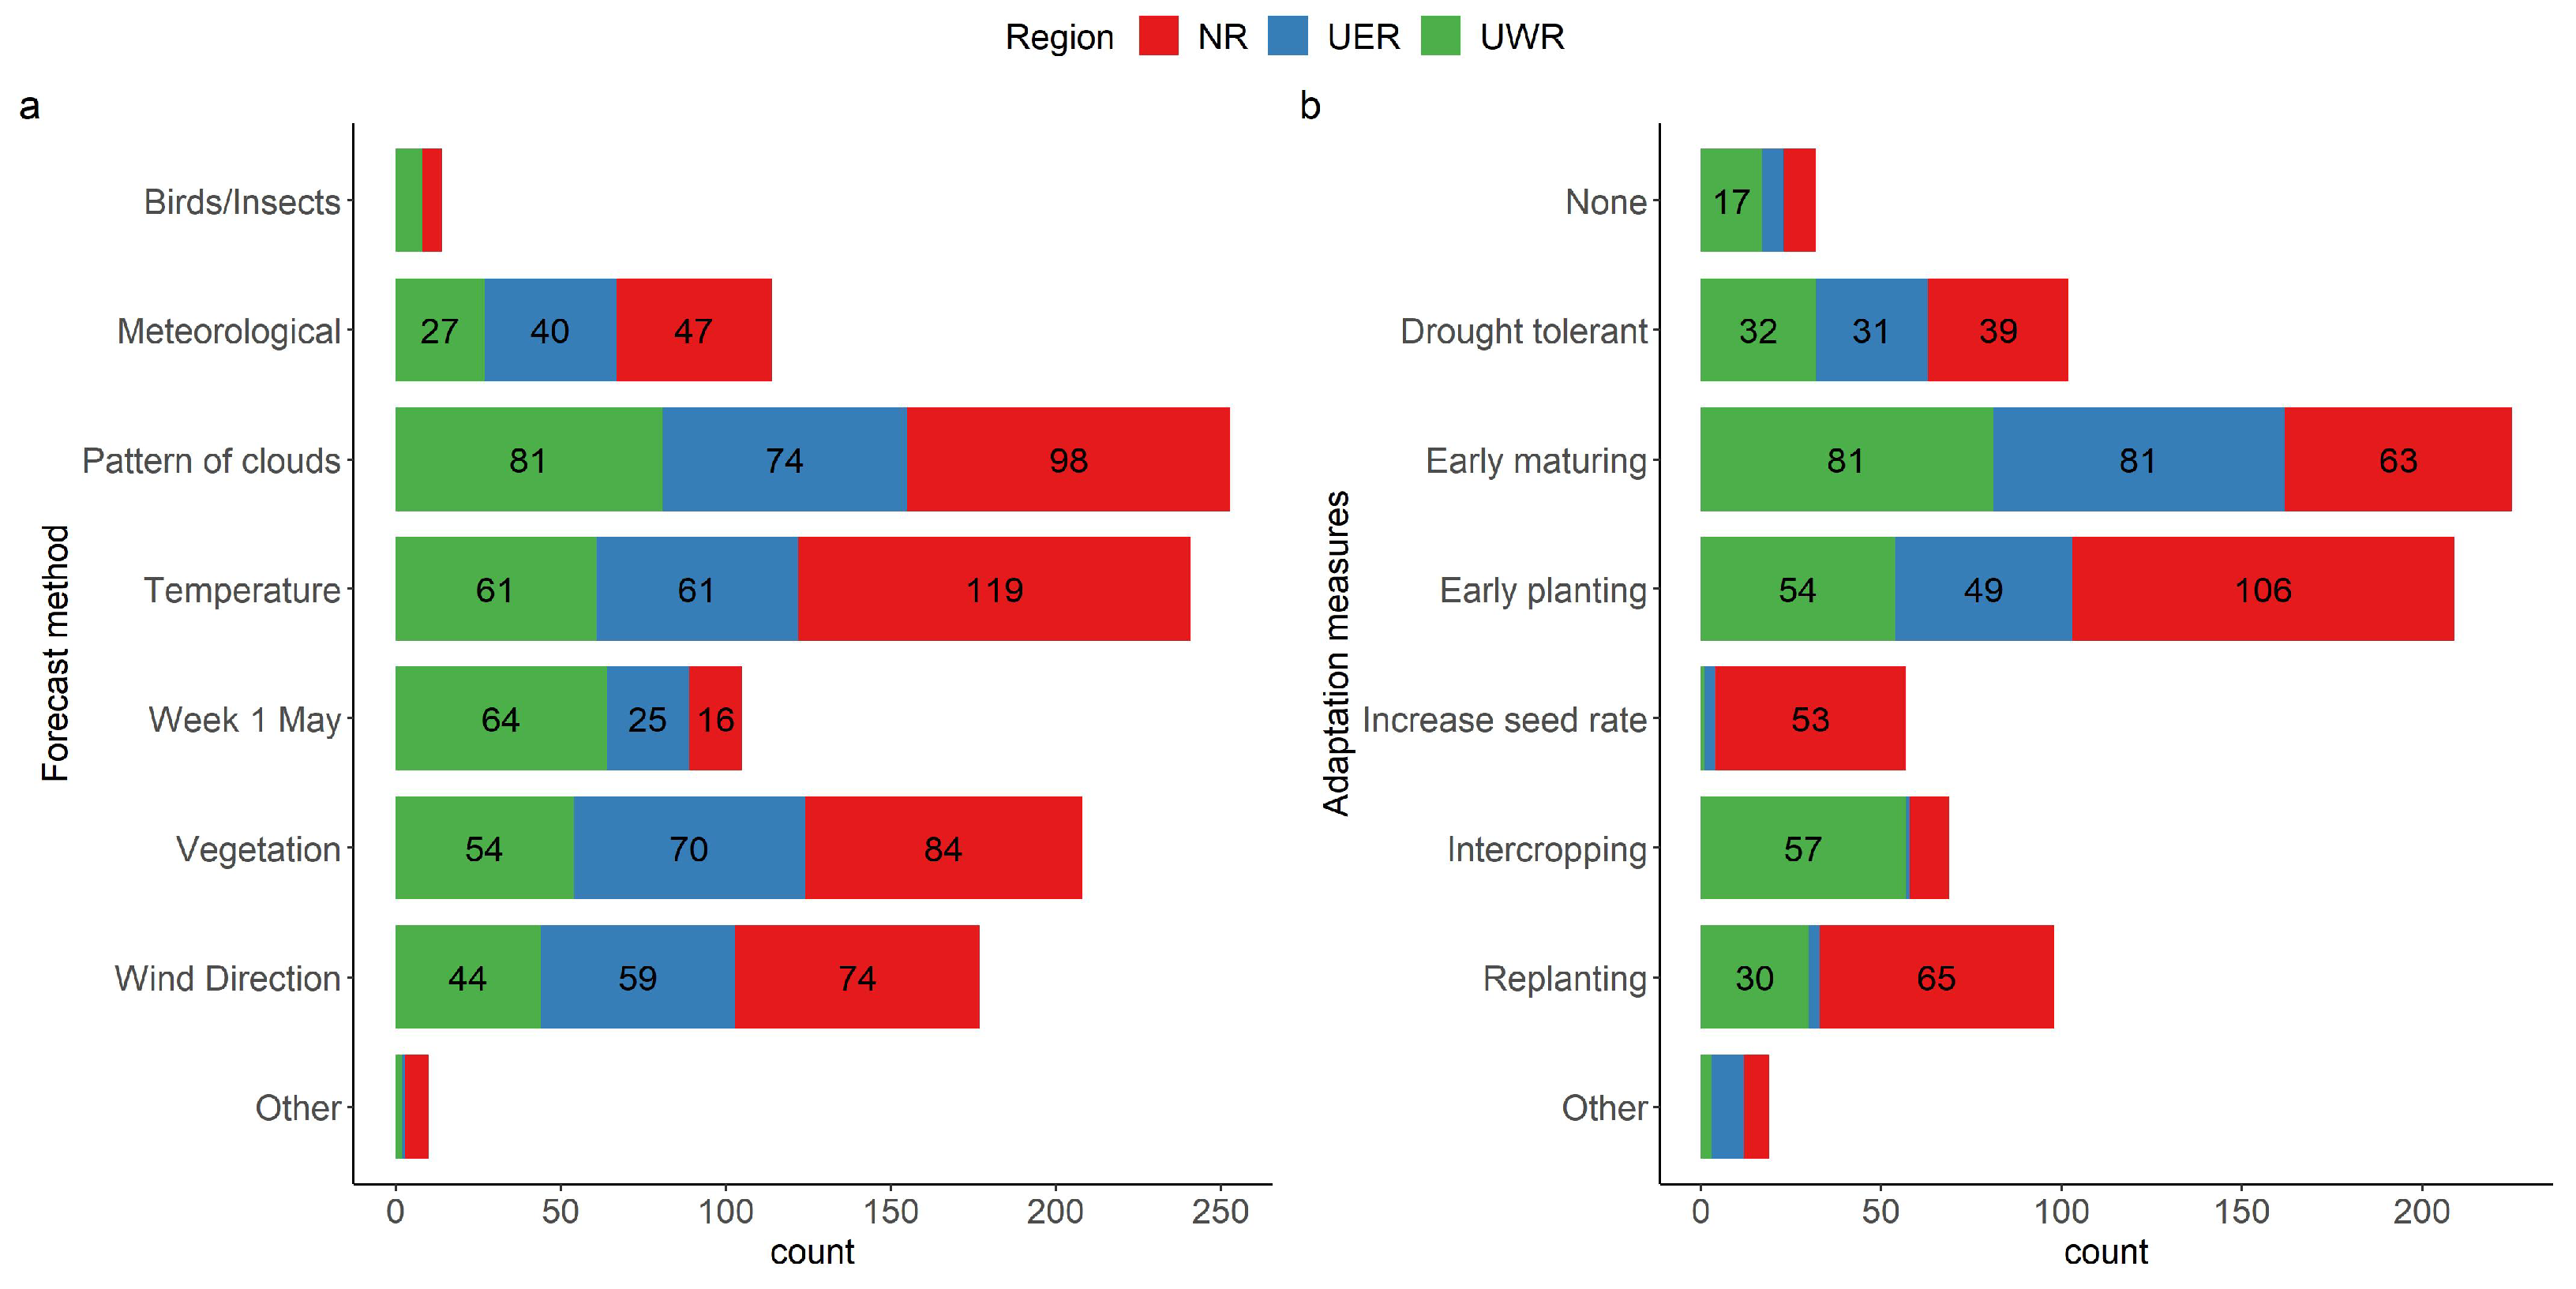
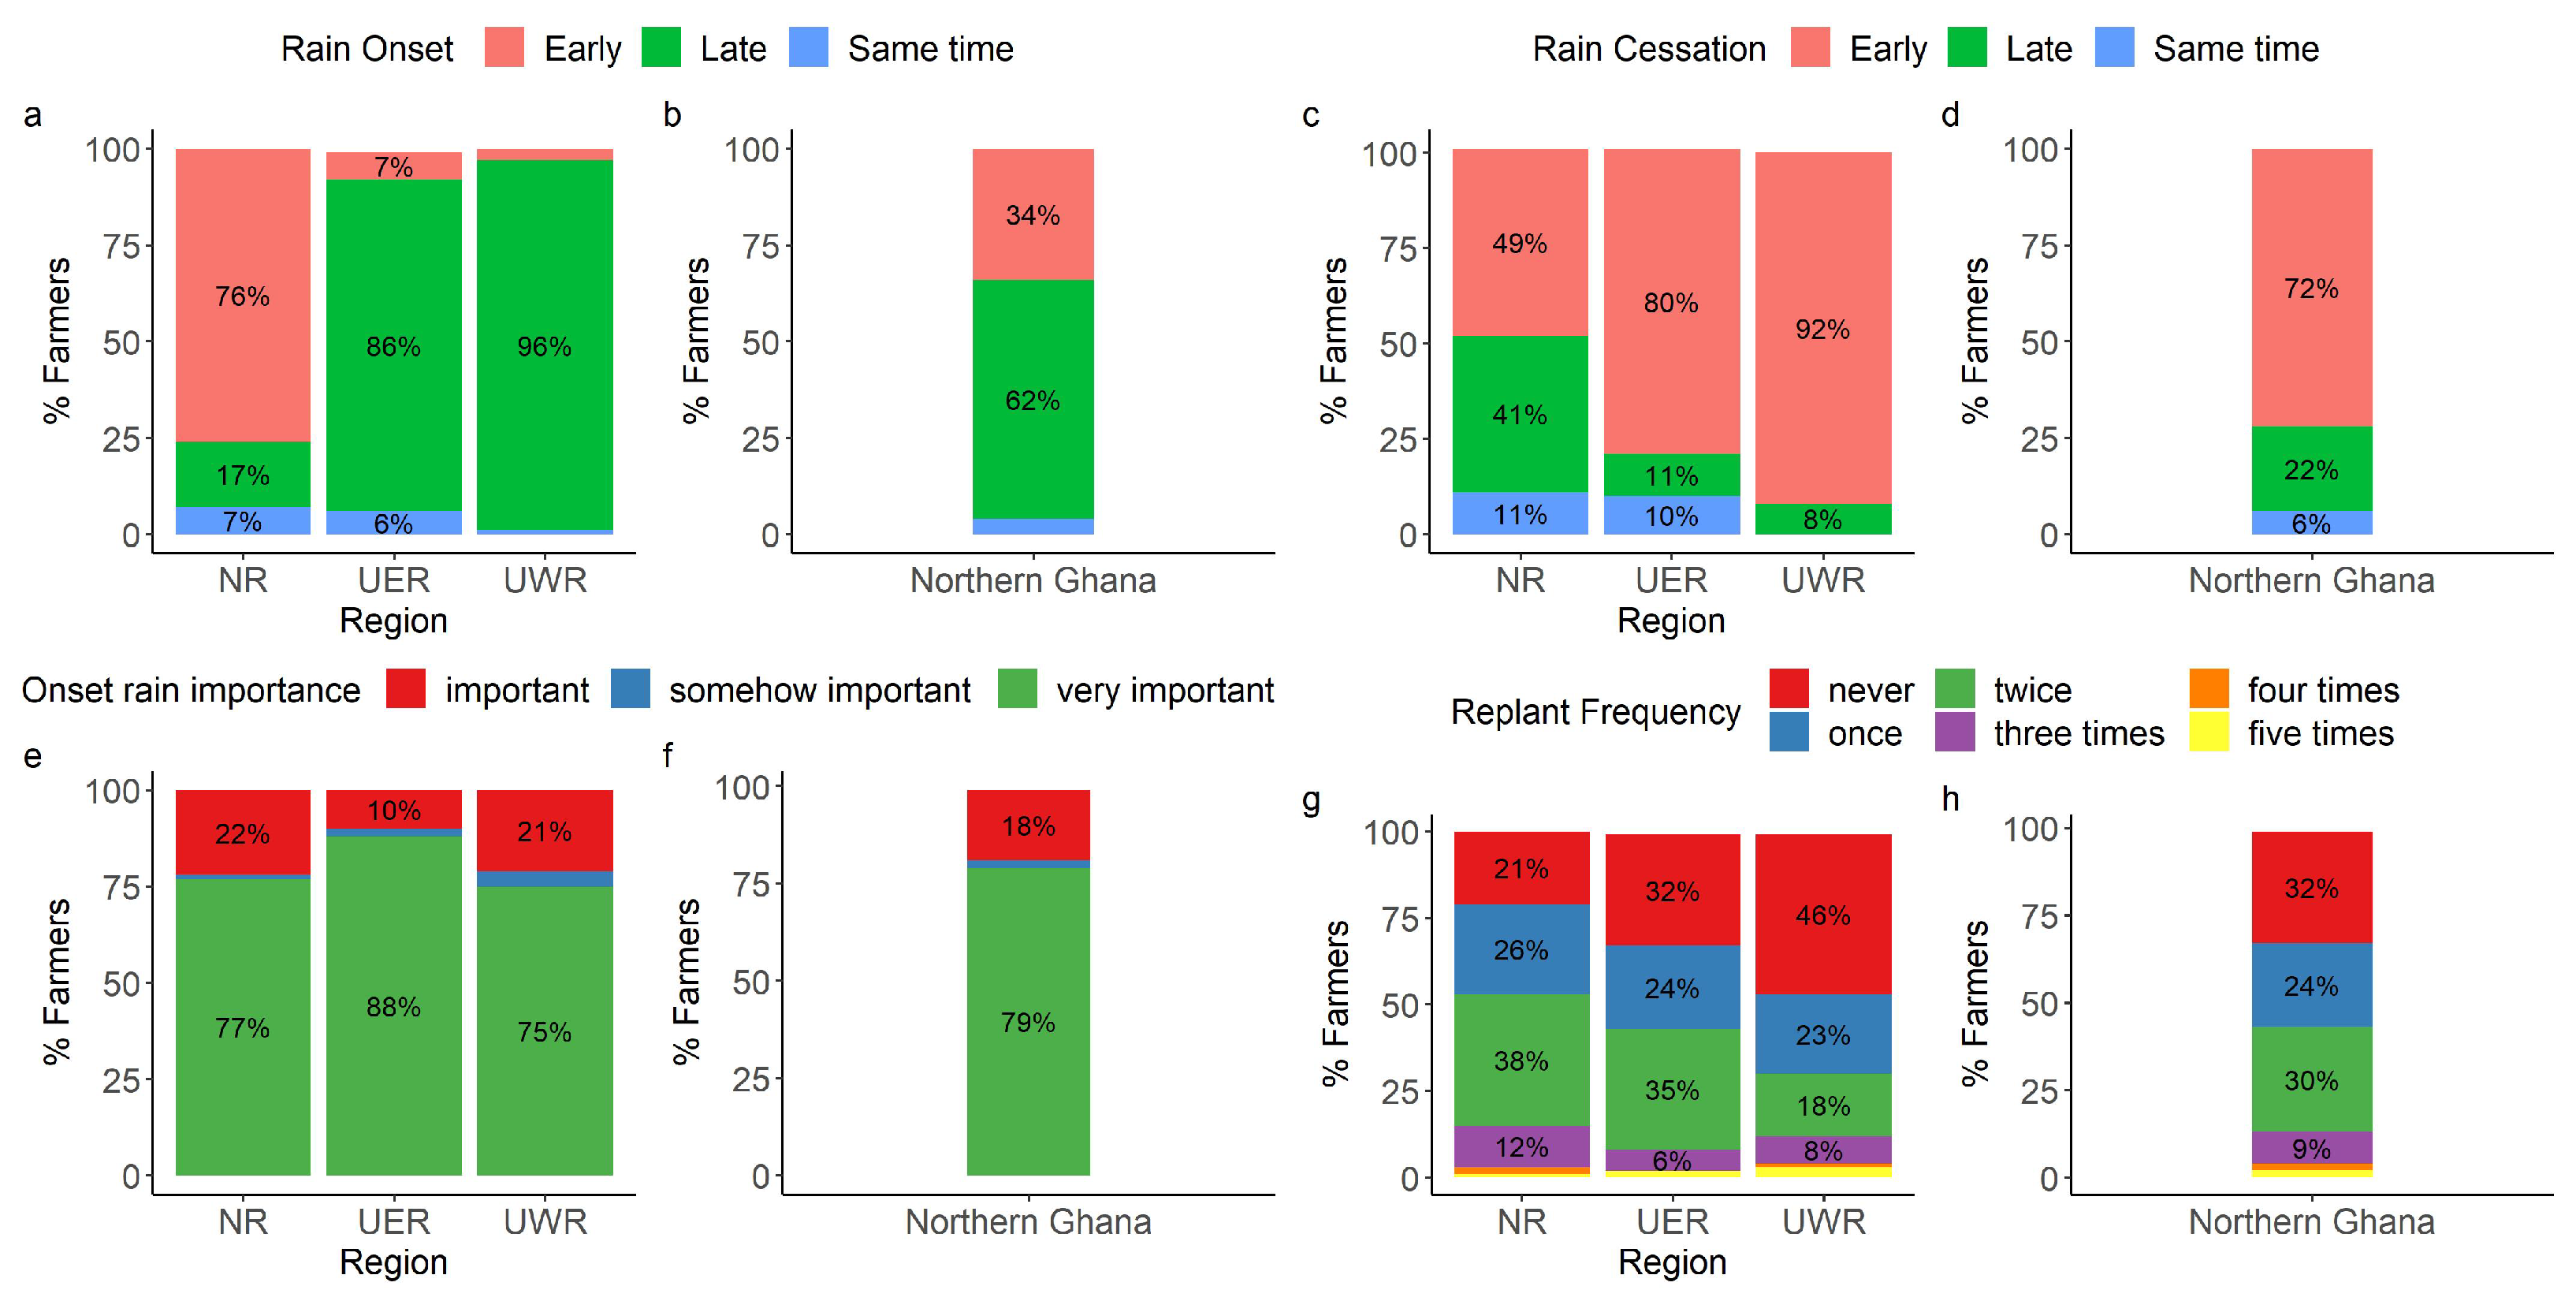
4.4. Farmers Perceptions on Timing of Rainfall Indices and Agronomic Adaptive Measures

Over 95% of the UWR and UER region farmers reported late-onset dates of the rainy season (Figure 9a). However, responses were more divergent in the NR, where 76% and 16% of farmers reported early and late-onset dates, respectively. A total of 248 (62%) and 134 (33%) of farmers reported late and early onset of the rains, respectively (Figure 9b). In contrast, over 80% of farmers in UWR and UER reported early cessation of rainfall (Figure 9c). Farmers’ experiences on the cessation of rains in NR were split between early (49%), late (41%), and no change (11%). The regional aggregates showed that a total of 288 (72%) and 86 (22%) farmers reported early and late cessation of rain, respectively (Figure 9d). The late onset and early cessation of rains in the UWR and UER imply the shortening of the growing season, but the NR status is divergent.
Table 2 shows a comparison of the trends of onset and cessation dates of rainfall from the gauge and satellite at representative stations in Figure 5 and the aggregated farmers perceptions per region (Figure 9a–c). The farmer perceptions relatively matched the long time series of the gauge and satellites because the household survey elicited farmer perceptions of the trends of onset and cessation dates by comparing the last growing season (2020) with the situation over three decades ago. However, the farmer perceptions were aggregated per region and not necessary at the location of the station, a fact that may reduce the precision. Table 2 shows an agreement between the observation network and farmer perceptions in Tamale station. However, most farmers in UER perceived late onset and early cessation dates of rainfall which completely differed from observation network. Likewise, the satellite and farmer perceptions on onset dates differed from gauge in Wa station although the cessation dates were converging. Therefore, the agreement between gauge, satellite, and farmer perceptions had wide spatial-temporal variability. Our results agree with [33] that farmers’ perceptions can vary with location, which decreases their spatial reliability compared to observation networks. Similarly, Refs. [33,47] observed that farmers’ perceptions of climate change in northern Ghana deviated from the meteorological records. One possible explanation of the deviations of farmer perceptions and the gauge observations could be their failure to differentiate between climate variability and change [29]. Climate variability has weakened farmers’ altitude on traditional forecasting methods and has become more open to scientific measurements. Farmers’ perceptions are shaped mainly by short-term variability of climate parameters and the frequency of extreme events than slow long-term changes in the average conditions [29]. Farmers are more perceptive of changes in temperature than rainfall, and their perceptions depend on location, age, and indigenous knowledge [29,33]. In areas that experience land degradation and climate change, farmers’ perceptions can confound changes in rainfall seasonality with changes in soil fertility [31].
Over 68% of farmers across all regions replanted the main crop seeds at least once in the last five seasons (Figure 3g,h). This reflects the high frequency of false onsets of the rains in the previous five cropping seasons. Replanting increases the cost of seeds, therefore reducing profitability. Studies had indicated that farmers planted up-to seven times after repeated crop failures during drought seasons in Burkina Faso [48]. Repeated replanting is done late in the growing season, making crops flower after a shortened vegetative period that eventually reduces the crop yield. Evidently, 79% of farmers identified the timing of the onset of rains as a crucial determinant of the crop yield (Figure 9e,f).
Results showed that only 29% of farmers rely on data from meteorological agencies to forecast the start of the season (Figure 10a). The use of meteorological agency data was lowest in UWR. Most farmers (>70%) rely on traditional methods to forecast the onset of the rainy season, such as a change in temperature, the pattern of clouds, vegetation phenology, movement pattern of insects/birds, and wind direction (Figure 10a). The traditional knowledge of forecasting rainfall onsets is easy to use and affordable to local farmers, but they are becoming less reliable due to increasing climate variability [48]. The traditional methods are available to different socio-economic and demographic groups over space and time, e.g., herders are more likely to observe movement and nesting of birds in the bush. At the same time, rural women are more likely to note the change of water levels or behavior of insects at water sources where they fetch water [48]. Similarly, Ref. [29] observed that farmers in Ethiopian highlands rarely used scientific climate information despite being in the frontline of implementing the adaptation measures. Our research highlights the need to invest in modern climate services such as the automated gauge network within the farming communities in northern Ghana to complement the existing local knowledge of forecasting the onset of rainy seasons. This will support the provision of tailored weather information services to farmers. Farmers in the study area are willing to pay for climate information disseminated through mobile services [49]. Moreover, by integrating the scientific and traditional methods, our study improves the understanding of the current climate knowledge systems that can help to enhance the modern observation networks in a culturally and locally relevant manner. Our study helps to enhance the observation network by identifying the degree and locations where the satellite estimates mimic the gauge data. The accuracy assessment is important considering that the satellite data are increasingly relied upon for agro-advisory due to the prevalent sparse gauge network in this region. The traditional forecasting methods observe the changes in temperature, wind and clouds that are integral variables of interest to modern meteorology. Therefore, as suggested by [48], scientific meteorologists could build on local understanding between temperature and seasonal rainfall to explore technical aspects of scientific forecasts based, for example, on sea surface temperature. The results further points to the uncertainties arising from relying solely on traditional methods and existing daily satellite rainfall estimates.
Figure 10b shows the crop management practices applied by farmers to adapt to shifts of onset and cessation dates of rainfall in the three regions. The early maturing cultivars, early planting, drought-tolerant cultivars and replanting emerged the most common but with different intensities across the three regions (Figure 10b). Planting early maturing cultivars is a strategy to cope with shortened LGP. Early planting enables crops to take advantage of every drop of soil moisture at the onset of season. The UER and eastern NR experienced longer LGP resulting from early-onset and late-cessation dates, therefore, planting early and medium-late maturing varieties are viable adaptation measures in that part. However, in the UER fewer farmers applied early planting (49) compared to early maturing varieties (81) reflecting adaptations that are mis-aligned to local reality. However, the situation was the opposite in the NR. Therefore, adaptation measures were not always consistent with the rainfall seasonality. Similarly, Ref. [30] noted the blanket recommendations policies on the adoption of early maturing crop varieties where seasons are becoming longer in northern Ghana led to maladaptation outcomes that increased vulnerability to climate change and variability. Farmers in UER respond to delayed onset and shortening of LGP by spreading out the sowing of crops across the first three months of the season through a wait-and-see or delay strategy [17,24]. They sow the drought-tolerant crops (sorghum and millet) in April to take advantage of early rains. Farmer’s shift sowing of drought-sensitive crops (maize, rice, and groundnut) from May to June or July to reduce the risk of exposure to early season drought. However, this can increase the risk of exposure to the late-season dry spell since these crops mature after 3–6 months. In addition to, the timing of rainfall seasons, selecting appropriate adaptation measures needs to consider the significant spatial-temporal trends of rainfall amount and temperature reported in northern Ghana [5,6].

5. Conclusions

Spatio-temporal variability of rainfall seasonality in northern Ghana, poses a challenge to food security and other socio-economic activities. This study presents a comprehensive analysis of the variability and trends of three rainfall indices (rainfall onsets, cessations, and length of the growing period) using the spatially high-resolution CHIRPS-v2 daily rainfall series for the period of 39 years (1981–2019) over Northern Ghana. The study further assesses the satellite and farmers’ perceptions of the start of the rainfall season over three Northern regions (Upper East, Upper West, and Northern) using gauge data obtained from the Ghana Meteorological Agency (GMet) during 2020. Our findings show that the region’s rainfall indices have substantial latitudinal variability, with late onsets at the North of 10° N latitude and early onsets south of 10° N latitude annually. Conversely, early (short) cessions (LGP) are seen to occur at the South of 10oN latitude, while late (long) cessions (LGP) are observed at the North of 10oN latitude. On average, CHIRPS-v2 captured rainfall onsets between 21st March and 25th May, rainfall cessations, 17th September to 10th November, and the LGP is usually between 120–210 days annually in Northern Ghana. Significant late cessations and longer LGP were observed over most parts of Northern Ghana. CHIRPS-v2 data revealed slightly, but significant late, and early onsets date at the West and East of 1.5° W longitude, respectively. Our findings indicated a trend towards late-cessation dates in most parts of the region. CHIRPS-v2 was biased towards capturing early onsets and late onsets, resulting in a relatively longer LPG. CHIRPS-v2 agreed better with observation for the rainfall cessation, followed by LGP, and lastly, the onsets. The satellite-generated rainfall onset dates agreed better with the gauge at Wa and Bole stations. In contrast, farmers’ perceptions were more accurate than satellite stations in the Tamale station. Therefore, farmers’ perceptions and CHIRPS-v2 to accurately estimate rainfall onsets are time and location-dependent. Approximately 29% of farmers rely on meteorological agencies’ data to forecast the rainfall season’s start, while the remainder depends on traditional knowledge. Adaptation measures were not always consistent with the rainfall seasonality. CHIRPS-v2 has inherent systematic biases that could come from low density and decreasing gauge observations over time in Ghana, leading to insufficient representation of rainfall indices. CHIRPS-v2 data were biased towards capturing false onsets near boundaries that have significant implications for agricultural production, considering that crops’ success or failure is more dependent on accurate estimating of onsets. Thus, the study recommends the correction of systematic biases in CHIRPS-v2 to improve agro-advisories on the timing of seasonal calendar activities. Moreover, our study highlights the need to invest in modern climate information services such as the automated gauge network to complement the existing local knowledge of forecasting the rainfall seasonality in in northern Ghana.

Author Contributions

Conceptualization, W.A.A. and F.K.M.; Methodology, W.A.A. and F.K.M.; Software, W.A.A.; Validation, W.A.A. and F.K.M.; Visualization, W.A.A.; Writing—original draft preparation, W.A.A. and F.K.M.; Data curation, W.A.A. and F.K.M; Supervision, W.A.A., F.K.M., B.K., F.K. and L.K.A.; Writing—Reviewing and Editing, W.A.A., F.K.M., B.K., F.K. and L.K.A. All authors have read and agreed to the published version of the manuscript.

Funding

This research was funded by the United States Agency for International Development with grant number: AID-BFS-G-11-00002.

Institutional Review Board Statement

The study was conducted according to guidelines of the declaration of Helsinki and approved by Institutional Review Board of International Institute of Tropical Agriculture (protocol code IRB/AF/001/2021 approved on 10 December 2020.

Informed Consent Statement

Informed consent was obtained from all subjects involved in the study.

Data Availability Statement

Remote sensing data is open source available at https://www.chc.ucsb.edu/data/chirps, accessed on 12 June 2021. The survey and gauge stations can be provided by authors upon request.

Acknowledgments

We thank Benedict Boyubie and the enumerators for organizing and conducting a farmer’s survey.

Conflicts of Interest

The authors declare no conflict of interest. The funders had no role in the design of the study; in the collection, analyses, or interpretation of data; in the writing of the manuscript, or in the decision to publish the results.

Appendix A

Figure A1. The percentage cumulative rainfall amount averaged over 1981–2019 in the Upper East (UER) and Upper West (UWR) regions.
Atmosphere 12 01674 g0a1
Figure A2. Autocorrelation function of rainfall onset (green), cessation (red) and length of growing season (magenta) over Northern Ghana. The blue shaded region is the confidence interval with a value of α = 0.05. Anything within this range represents a value that has no significant correlation which implies no serial autocorrelation.
Atmosphere 12 01674 g0a2
Figure A3. Summary of rainfall onset, cessation and length of growing season over three-gauge stations in northern Ghana. The onset and cessation are days of the year (DOY) while LPG is the number of days.
Atmosphere 12 01674 g0a3

References

  1. Harrison, L.; Funk, C.; Peterson, P. Identifying changing precipitation extremes in Sub-Saharan Africa with gauge and satellite products. Environ. Res. Lett. 2019, 14, 085007. [Google Scholar] [CrossRef]
  2. Atiah, W.A.; Amekudzi, L.K.; Akum, R.A.; Quansah, E.; Antwi-Agyei, P.; Danuor, S.K. Climate Variability and Impacts on Maize (Zea Mays) Yield in Ghana, West Africa. Available online: https://rmets.onlinelibrary.wiley.com/doi/full/10.1002/qj.4199 (accessed on 1 December 2021).
  3. Adhikari, U.; Nejadhashemi, A.P.; Woznicki, S.A. Climate change and eastern Africa: A review of impact on major crops. Food Energy Secur. 2015, 4, 110–132. [Google Scholar] [CrossRef]
  4. Ray, D.K.; Gerber, J.S.; MacDonald, G.K.; West, P.C. Climate variation explains a third of global crop yield variability. Nat. Commun. 2015, 6, 1–9. [Google Scholar] [CrossRef] [Green Version]
  5. Atiah, W.A.; Tsidu, G.M.; Amekudzi, L.; Yorke, C. Trends and interannual variability of extreme rainfall indices over Ghana, West Africa. Theor. Appl. Climatol. 2020, 140, 1393–1407. [Google Scholar] [CrossRef]
  6. Muthoni, F. Spatial-temporal trends of rainfall, maximum and minimum temperatures over west Africa. IEEE J. Sel. Top. Appl. Earth Obs. Remote Sens. 2020, 13, 2960–2973. [Google Scholar] [CrossRef]
  7. Liebmann, B.; Marengo, J. Interannual variability of the rainy season and rainfall in the Brazilian Amazon Basin. J. Clim. 2001, 14, 4308–4318. [Google Scholar] [CrossRef] [Green Version]
  8. Liebmann, B.; Bladé, I.; Kiladis, G.N.; Carvalho, L.M.; Senay, G.B.; Allured, D.; Leroux, S.; Funk, C. Seasonality of African precipitation from 1996 to 2009. J. Clim. 2012, 25, 4304–4322. [Google Scholar] [CrossRef]
  9. Akinseye, F.M.; Agele, S.O.; Traore, P.; Adam, M.; Whitbread, A.M. Evaluation of the onset and length of growing season to define planting date—‘A case study for Mali (West Africa)’. Theor. Appl. Climatol. 2016, 124, 973–983. [Google Scholar] [CrossRef] [Green Version]
  10. Dunning, C.M.; Black, E.C.; Allan, R.P. The onset and cessation of seasonal rainfall over Africa. J. Geophys. Res. Atmos. 2016, 121, 11–405. [Google Scholar] [CrossRef] [Green Version]
  11. Amekudzi, L.K.; Yamba, E.I.; Preko, K.; Asare, E.O.; Aryee, J.; Baidu, M.; Codjoe, S.N. Variabilities in rainfall onset, cessation and length of rainy season for the various agro-ecological zones of Ghana. Climate 2015, 3, 416–434. [Google Scholar] [CrossRef]
  12. Gbangou, T.; Ludwig, F.; van Slobbe, E.; Hoang, L.; Kranjac-Berisavljevic, G. Seasonal variability and predictability of agro-meteorological indices: Tailoring onset of rainy season estimation to meet farmers’ needs in Ghana. Clim. Serv. 2019, 14, 19–30. [Google Scholar] [CrossRef]
  13. MacLeod, D. Seasonal predictability of onset and cessation of the east African rains. Weather Clim. Extrem. 2018, 21, 27–35. [Google Scholar] [CrossRef]
  14. Vellinga, M.; Arribas, A.; Graham, R. Seasonal forecasts for regional onset of the West African monsoon. Clim. Dyn. 2013, 40, 3047–3070. [Google Scholar] [CrossRef] [Green Version]
  15. Antwi-Agyei, P.; Fraser, E.D.; Dougill, A.J.; Stringer, L.C.; Simelton, E. Mapping the vulnerability of crop production to drought in Ghana using rainfall, yield and socioeconomic data. Appl. Geogr. 2012, 32, 324–334. [Google Scholar] [CrossRef]
  16. Baidu, M.; Amekudzi, L.K.; Aryee, J.N.; Annor, T. Assessment of long-term spatio-temporal rainfall variability over Ghana using wavelet analysis. Climate 2017, 5, 30. [Google Scholar] [CrossRef] [Green Version]
  17. Boansi, D.; Tambo, J.A.; Müller, M. Intra-seasonal risk of agriculturally-relevant weather extremes in West African Sudan Savanna. Theor. Appl. Climatol. 2019, 135, 355–373. [Google Scholar] [CrossRef]
  18. Laux, P.; Kunstmann, H.; Bárdossy, A. Predicting the regional onset of the rainy season in West Africa. Int. J. Climatol. J. R. Meteorol. Soc. 2008, 28, 329–342. [Google Scholar] [CrossRef] [Green Version]
  19. Chemura, A.; Schauberger, B.; Gornott, C. Impacts of climate change on agro-climatic suitability of major food crops in Ghana. PLoS ONE 2020, 15, e0229881. [Google Scholar] [CrossRef]
  20. Owusu Danquah, E.; Beletse, Y.; Stirzaker, R.; Smith, C.; Yeboah, S.; Oteng-Darko, P.; Frimpong, F.; Ennin, S.A. Monitoring and Modelling Analysis of Maize (Zea mays L.) Yield Gap in Smallholder Farming in Ghana. Agriculture 2020, 10, 420. [Google Scholar] [CrossRef]
  21. Mkonda, M.Y.; He, X. Climate variability and crop yields synergies in Tanzania’s semiarid agroecological zone. Ecosyst. Health Sustain. 2018, 4, 59–72. [Google Scholar] [CrossRef] [Green Version]
  22. Ocen, E.; de Bie, C.; Onyutha, C. Investigating False start of the Main Growing Season: A Case of Uganda in East Africa. Available online: https://www.sciencedirect.com/science/article/pii/S2405844021025317 (accessed on 1 December 2021).
  23. Van de Giesen, N.; Liebe, J.; Jung, G. Adapting to climate change in the Volta Basin, West Africa. Curr. Sci. 2010, 98, 1033–1037. [Google Scholar]
  24. Sarku, R.; Dewulf, A.; van Slobbe, E.; Termeer, K.; Kranjac-Berisavljevic, G. Adaptive decision-making under conditions of uncertainty: The case of farming in the Volta delta, Ghana. J. Integr. Environ. Sci. 2020, 17, 1–33. [Google Scholar] [CrossRef] [Green Version]
  25. Shukla, S.; Husak, G.; Turner, W.; Davenport, F.; Funk, C.; Harrison, L.; Krell, N. A slow rainy season onset is a reliable harbinger of drought in most food insecure regions in Sub-Saharan Africa. PLoS ONE 2021, 16, e0242883. [Google Scholar] [CrossRef]
  26. Dinku, T. Challenges with availability and quality of climate data in Africa. In Extreme Hydrology and Climate Variability; Elsevier: Amsterdam, The Netherlands, 2019; pp. 71–80. [Google Scholar]
  27. Contractor, S.; Donat, M.G.; Alexander, L.V.; Ziese, M.; Meyer-Christoffer, A.; Schneider, U.; Rustemeier, E.; Becker, A.; Durre, I.; Vose, R.S. Rainfall Estimates on a Gridded Network (REGEN)—A global land-based gridded dataset of daily precipitation from 1950 to 2016. Hydrol. Earth Syst. Sci. 2020, 24, 919–943. [Google Scholar] [CrossRef] [Green Version]
  28. Salerno, J.; Diem, J.E.; Konecky, B.L.; Hartter, J. Recent intensification of the seasonal rainfall cycle in equatorial Africa revealed by farmer perceptions, satellite-based estimates, and ground-based station measurements. Clim. Chang. 2019, 153, 123–139. [Google Scholar] [CrossRef]
  29. Darabant, A.; Habermann, B.; Sisay, K.; Thurnher, C.; Worku, Y.; Damtew, S.; Lindtner, M.; Burrell, L.; Abiyu, A. Farmers’ perceptions and matching climate records jointly explain adaptation responses in four communities around Lake Tana, Ethiopia. Clim. Chang. 2020, 163, 481–497. [Google Scholar] [CrossRef]
  30. Antwi-Agyei, P.; Dougill, A.J.; Stringer, L.C.; Codjoe, S.N.A. Adaptation opportunities and maladaptive outcomes in climate vulnerability hotspots of northern Ghana. Clim. Risk Manag. 2018, 19, 83–93. [Google Scholar] [CrossRef]
  31. Diem, J.E.; Hartter, J.; Salerno, J.; McIntyre, E.; Grandy, A.S. Comparison of measured multi-decadal rainfall variability with farmers’ perceptions of and responses to seasonal changes in western Uganda. Reg. Environ. Chang. 2017, 17, 1127–1140. [Google Scholar] [CrossRef]
  32. Esayas, B.; Simane, B.; Teferi, E.; Ongoma, V.; Tefera, N. Climate variability and farmers’ perception in southern Ethiopia. Adv. Meteorol. 2019, 2019, 7341465. [Google Scholar] [CrossRef]
  33. Guodaar, L.; Bardsley, D.K.; Suh, J. Integrating local perceptions with scientific evidence to understand climate change variability in northern Ghana: A mixed-methods approach. Appl. Geogr. 2021, 130, 102440. [Google Scholar] [CrossRef]
  34. Atiah, W.A.; Amekudzi, L.K.; Quansah, E.; Preko, K. The spatio-temporal variability of rainfall over the agro-ecological zones of Ghana. Atmos. Clim. Sci. 2019, 4, 527–544. [Google Scholar] [CrossRef] [Green Version]
  35. Funk, C.; Peterson, P.; Landsfeld, M.; Pedreros, D.; Verdin, J.; Shukla, S.; Husak, G.; Rowland, J.; Harrison, L.; Hoell, A.; et al. The climate hazards infrared precipitation with stations—A new environmental record for monitoring extremes. Sci. Data 2015, 2, 1–21. [Google Scholar] [CrossRef] [Green Version]
  36. Atiah, W.A.; Amekudzi, L.K.; Aryee, J.N.A.; Preko, K.; Danuor, S.K. Validation of satellite and merged rainfall data over Ghana, West Africa. Atmosphere 2020, 11, 859. [Google Scholar] [CrossRef]
  37. Atiah, W.A.; Tsidu, G.M.; Amekudzi, L.K. Investigating the merits of gauge and satellite rainfall data at local scales in Ghana, West Africa. Weather. Clim. Extrem. 2020, 30, 100292. [Google Scholar] [CrossRef]
  38. Theil, H. A rank-invariant method of linear and polynomial regression analysis. Indag. Math. 1950, 12, 173. [Google Scholar]
  39. Mann, H.B. Nonparametric tests against trend. Econom. J. Econom. Soc. 1945, 13, 245–259. [Google Scholar] [CrossRef]
  40. Kendall, K. Thin-film peeling-the elastic term. J. Phys. D Appl. Phys. 1975, 8, 1449. [Google Scholar] [CrossRef]
  41. Spearman, C. The proof and measurement of association between two things. Am. J. Psychol. 1987, 100, 441–471. [Google Scholar] [CrossRef]
  42. Lehmann, E.L.; D’Abrera, H.J. Nonparametrics: Statistical Methods Based on Ranks; Holden-Day: Hoboken, NJ, USA, 1975; Available online: https://rss.onlinelibrary.wiley.com/doi/abs/10.2307/2344536 (accessed on 10 May 2021).
  43. Onyutha, C. Graphical-statistical method to explore variability of hydrological time series. Hydrol. Res. 2021, 52, 266–283. [Google Scholar] [CrossRef]
  44. Onyutha, C. Statistical uncertainty in hydrometeorological trend analyses. Adv. Meteorol. 2016, 2016, 266–283. [Google Scholar] [CrossRef] [Green Version]
  45. Wood, A.W.; Leung, L.R.; Sridhar, V.; Lettenmaier, D. Hydrologic implications of dynamical and statistical approaches to downscaling climate model outputs. Clim. Chang. 2004, 62, 189–216. [Google Scholar] [CrossRef]
  46. Kimani, M.W.; Hoedjes, J.C.; Su, Z. Bayesian bias correction of satellite rainfall estimates for climate studies. Remote Sens. 2018, 10, 1074. [Google Scholar] [CrossRef] [Green Version]
  47. Dakurah, G. How do farmers’ perceptions of climate variability and change match or and mismatch climatic data? Evidence from North-west Ghana. GeoJournal 2021, 86, 2387–2406. [Google Scholar] [CrossRef]
  48. Roncoli, C.; Ingram, K.; Kirshen, P. Reading the rains: Local knowledge and rainfall forecasting in Burkina Faso. Soc. Nat. Resour. 2002, 15, 409–427. [Google Scholar] [CrossRef]
  49. DONKOH, S.A. Farmers’ willingness-to-pay for weather information through mobile phones in northern Ghana. Ghana J. Sci. Technol. Dev. 2019, 6, 19–36. [Google Scholar] [CrossRef]
Figure 1. The Location of the three administrative regions and the synoptic gauge stations in Northern Ghana.
Atmosphere 12 01674 g001
Figure 2. Variability of rainfall onsets dates from 2000 to 2019 over Northern Ghana generated from CHIRPS-v2 data.
Atmosphere 12 01674 g002
Figure 3. Maps on variability of rainfall cessations dates from 2000 to 2019 over Northern Ghana generated from CHIRPS-v2.
Atmosphere 12 01674 g003
Figure 4. Maps showing the variability of LGP from 2000 to 2019 over Northern Ghana derived from CHIRPS-v2.
Atmosphere 12 01674 g004
Figure 5. Spatial-temporal trends (days/year) of rainfall onsets (a), cessation dates (b), and length of growing season (c) over Northern Ghana for 39 years period (1981–2019). The blue and red tones represent grid cells with early (shorter) and late (longer) trends, respectively.
Atmosphere 12 01674 g005
Figure 6. Variability (day of year) of rainfall onset (a), cessation (b) and the LGP (c) derived from CHIRPS-v2 (red) and gauge data (blue) at the location of the six stations in Northern Ghana from 1981 through 2016. Black circles indicate outliers. Station locations are shown in Figure 1 and their labels are Babile (Bab), Bole (Bol), Garu (Gar), Tamale (Tam), Wa (Wa) and Zug (Zuarungu).
Atmosphere 12 01674 g006
Figure 7. Agreement between CHIRPS-v2 and gauge data in representing the rainfall onset, cessation, and LGP at the six stations from 1981 to 2016. Performance was measured using Pearson correlation (r), Bias, and root-mean-square errors (RMSE). Station names are like Figure 6.
Atmosphere 12 01674 g007
Figure 8. Trends of rainfall onset (RO), cessation (RC) date and LGP captured by gauge and satellite data in the UER, UWR, and NR from 1981 through 2016. Sg and Ss are the slope of linear regression for the gauge, and satellite, respectively.
Atmosphere 12 01674 g008
Figure 9. Farmers’ perceptions of the rainfall onset trend per region (a) and aggregated in entire Northern Ghana (b). Cessation for each region (c) and aggregated for the entire Northern Ghana (d). The importance of the onset date of the rain on the yield of the main crop per region (e) and whole Northern Ghana (f). The frequency of replanting of seeds of the main crop in the last 5 growing seasons due to the false start of the rain season per region (g) and aggregate for northern Ghana (h).
Atmosphere 12 01674 g009
Figure 10. Farmers’ responses on the methods applied to forecast the season’s onset (a) and the adaptation measures to cope with observed trends on the onset and cessation of rainfall (b) in northern Ghana.
Atmosphere 12 01674 g010
Table 1. The Parameters recorded during the survey on farmer’s perceptions on rainfall seasonality in northern Ghana.
IDParameterChoices
1Sex1 = Male
2 = Female
2AgeAge of respondent
3Educational Level0 = Informal
1 = Primary
2 = Secondary
3 = Certificate
4 = Diploma
5 = Bachelor
6 = Masters or above
7 = Others (specify)
4Main economic activity1 = Crop Farming
2 = Livestock Farming
3 = Fishing
4 = Formal Employment
5 = Petty business
6 = Others (specify)
5Main CropMaize
Groundnuts
Cowpea
Soybean
6Onset/Cessation trendSame
Early
Late
7Method of forecasting rainfall onsetBirds/insect movements
Meteorological agency
Pattern of clouds
Change in temperature
Traditionally first week of May
Vegetation phenology
Wind direction
Other (specify)
8Importance of onset on yield of the main cropSomehow important
Important
Very important
9Replant frequency due to false onset of rainfallNever
Once
Twice
Thrice
Four times
Five times
10Adaptation measuresNone
Drought-tolerant cultivars
Early maturing cultivars
Increase seed rate
Intercropping
Replanting
Other (specify)
Table 2. Summary of the trends of onset and cessation dates of rainfall from the gauge and satellite at representative stations from Figure 5 and the aggregated farmer’s perceptions per region obtained from Figure 9a–c.
RegionGauge StationCorrelation Gauge vs. Satellite (r)SatelliteGaugeFarmer’s Perceptions
Onset
UERZuarungu0.44EarlyEarlyLate
UWRWa0.57EarlyLateLate
NRTamale0.40EarlyEarlyEarly
Cessation
UERZuarungu0.40LateLateEarly
UWRWa0.10EarlyEarlyEarly
NRTamale0.74LateLateDivergent
Publisher’s Note: MDPI stays neutral with regard to jurisdictional claims in published maps and institutional affiliations.

