Article

Atmospheric Effects on the Isotopic Composition of Ozone

1
Institute Earth Sciences, Academia Sinica, Taipei 115, Taiwan
2
Research Center for Environmental Changes, Academia Sinica, Taipei 115, Taiwan
3
College of Chemistry and Molecular Engineering, Peking University, Beijing 100871, China
4
Department of Earth and Planetary Sciences, University of California, Santa Cruz, CA 92697, USA
5
Division of Geological and Planetary Sciences, California Institute of Technology, Pasadena, CA 91125, USA
*
Author to whom correspondence should be addressed.
Atmosphere 2021, 12(12), 1673; https://doi.org/10.3390/atmos12121673
Submission received: 10 November 2021 / Revised: 3 December 2021 / Accepted: 10 December 2021 / Published: 13 December 2021
(This article belongs to the Special Issue Feature Papers in Atmosphere Science)

Abstract

:
The delta values of the isotope composition of atmospheric ozone is ~100‰ (referenced to atmospheric O2). Previous photochemical models, which considered the isotope fractionation processes from both formation and photolysis of ozone, predicted δ49O3 and δ50O3 values, in δ49O3 versus δ50O3 space, that are >10‰ larger than the measurements. We propose that the difference between the model and observations could be explained either by the temperature variation, Chappuis band photolysis, or a combination of the two and examine them. The isotopic fractionation associated with ozone formation increases with temperature. Our model shows that a hypothetical reduction of ~20 K in the nominal temperature profile could reproduce the observations. However, this hypothesis is not consistent with temperatures obtained by in situ measurements and NCEP Reanalysis. Photolysis of O3 in the Chappuis band causes O3 to be isotopically depleted, which is supported by laboratory measurements for 18O18O18O but not by recent new laboratory data made at several wavelengths for 49O3 and 50O3. Cloud reflection can significantly enhance the photolysis rate and affect the spectral distribution of photons, which could influence the isotopic composition of ozone. Sensitivity studies that modify the isotopic composition of ozone by the above two mechanisms are presented. We conclude isotopic fractionation occurring in photolysis in the Chappuis band remains the most plausible solution to the model-observation discrepancy. Implications of our results for using the oxygen isotopic signature for constraining atmospheric chemical processes related to ozone, such as CO2, nitrate, and the hydroxyl radical, are discussed.

1. Introduction

Atmospheric ozone possesses significant non-mass-dependent isotopic composition [1,2,3,4,5,6,7,8,9,10,11,12]. This isotopic signature can be transferred to other chemical species such as hydroxyl radical, nitrate, sulfate, carbon dioxide, and nitrous oxide [6,7,13,14,15,16,17,18,19,20,21,22,23,24,25,26], through reactions with ozone or O(1D) produced by ozone photolysis in the Hartley and Huggins bands. The resulting non-zero Δ17O (=δ17O − 0.52 × δ18O) provides useful tracers for constraining biogeochemical cycles involving those chemical compounds. Here, δnO is defined as
δnO = ([nO]/[16O])sample/([nO]/[16O])reference − 1,
where nO = 17O or 18O. The reference used in this paper is atmospheric O2. To use this special isotopic signature for practical applications requires a precise understanding of sources of Δ17O. Recent models [5,6] that included known isotopic fractionation processes can capture the magnitude of the isotopic value of ozone, but the model δ-values were >10% higher than the observed. This suggests missing sources or processes that isotopically deplete ozone. In this paper, we reevaluate the known mechanisms (ozone formation and photolysis) and examine the photolysis in the Chappuis band and atmospheric parameters such as temperature, pressure, and clouds that could affect the isotopic composition of ozone.
In this paper, we test four processes in six separate models (Table 1). The Caltech/JPL KINETICS model is used in our study. All models apply the modified zero-point-energy (ZPE) theory [27,28] for the isotopic fractionation in the Hartley and Huggins bands. The four effects considered here include temperature, pressure, photolytic fractionation in the Chappuis band, and cloud scattering. The reference model is one-dimensional (1-D) and considers an altitude-dependent profile of temperature and eddy coefficients, that can best describe globally averaged atmospheric temperature and vertical transport (see [5] and references contained therein for details). The main reason for choosing 1-D, instead of 3-D, is that alteration of ozone normally occurs predominantly in the dayside atmosphere where local photochemical equilibrium is attained. As a result, the fractionation that defines the isotopic composition of atmospheric ozone is affected dominantly by the processes of formation and photolysis, the two main factors explored here. To better compare with the observational data across latitudes in different seasons, we also run 2-D models. The ozone isotope chemistry model is taken from Liang et al. [5], which was built at the low-pressure limit for ozone formation, with modifications (see the following sections).
Models A–C and E–F use the nominal temperature profile (see Figure 1 of Liang et al. [5]). Reduction in the temperature profile is applied to Model D. Pressure dependence in fractionating the isotopic composition of ozone during its formation is considered in Models A and C–F; the low-pressure limit is assumed in Model B (same as [5]). Due to insufficient data for the isotopic fractionation caused by the photolysis in the Chappuis band, three different calculations are applied. ZPE theory [29] is assumed in Models D–E, and the rest use a laboratory-based calculation. See later sections for details. To check the validity of the adopted fractionations, we compare the calculated values with recently measured numbers at several wavelengths in the Chappuis band [30,31,32].
This paper is divided into five parts. The impacts of pressure, temperature, and Chappuis band photolysis on the isotopic composition of O3 are examined in Section 2, Section 3 and Section 4, respectively. A discussion and conclusions follow in Section 5.

2. Pressure Dependence

In previous calculations [5,6], the low-pressure limit (i.e., stratospheric condition) is emphasized. It is known that the isotopic enrichment of ozone decreases with increasing pressure [33], and hence, we expect that taking into account the pressure-dependence of the isotopic fractionation occurred during ozone formation would help reduce the difference between the model and observations at the surface.
The pressure dependence is weak at pressures less than 100 mbar but becomes significant at a higher pressure. For example, δ50O3 (or enrichment) decreases by ~30‰ at pressures from ~100 to 1000 mbar [33,34]. We follow Marcus and Gao’s model [35,36,37] for the pressure-dependent calculation of each isotope-variant rate coefficient and parameterize them following a semi-analytic approach derived by Gao and Marcus [34]; the ozone formation model adopted in this study is the same as that in Liang et al. [5]. (The same approach was also taken previously by Wiegel et al. [23].) We fit the fractionation ε of each rate coefficient at a given temperature by
ε = ε0/(1 + P/P1/2)
where P is the atmospheric pressure and P1/2 is the pressure at which ε takes one-half of the value of its low-pressure limit ε0. Both P1/2 and ε0 are isotope-variant and temperature-dependent. The latter is presented by Liang et al. [5], and the functional dependence of P1/2 is rather complicated; the effective P1/2 of δ50O3 (16O16O18O + 16O18O16O) at 300 K is 2.6 bar. The resulting pressure dependence from the expression agrees well with the results from experiments [33] and a more sophisticated model [36]. Figure 1 compares the model profile of δ50O3 for cases with (Model A) and without (Model B) the pressure-dependence; the temperature profile is the same as that used previously [5]. The surface temperature is 283.4 K and the resulting δ50O3 is ~80‰ for Model E, which is much improved over the previous low-pressure limit model [5]. The new value is consistent with tropospheric measurements at similar temperatures [2,8] but inconsistent with Model A because of considering the photolysis-induced isotope fractionation in the Chappuis band (see Section 4). A likely explanation is that the ozone is largely affected by the Leighton cycle (and NOx-CO-VOC-O3 photochemistry), not the Chapman chemistry for a clean atmosphere we emphasize here. See later sections for further discussion.

3. Temperature Variation

The isotopic fractionation by photolysis has a weak temperature dependence [5,38]. The temperature dependence of the isotopic value (δ) of ozone is primarily from the formation of ozone. The temperature sensitivity for δ in ozone formation is ~0.3‰ K−1, and the value becomes ~0.6‰ K−1 after considering O + O2 isotopic exchange processes [39]. To bring the model δ-values of ozone into better agreement with observations requires a reduction of ~15–20 K in the climatological temperature profile (Model D vs. Model E). To refine previous calculations [5,6,22], we examine the effect by replacing the temperature profile used in previous studies with more realistic daily and 6-hourly temperature profiles from the National Centers for Environmental Prediction-Department of Energy Reanalysis 2 (NCEP2) [40].
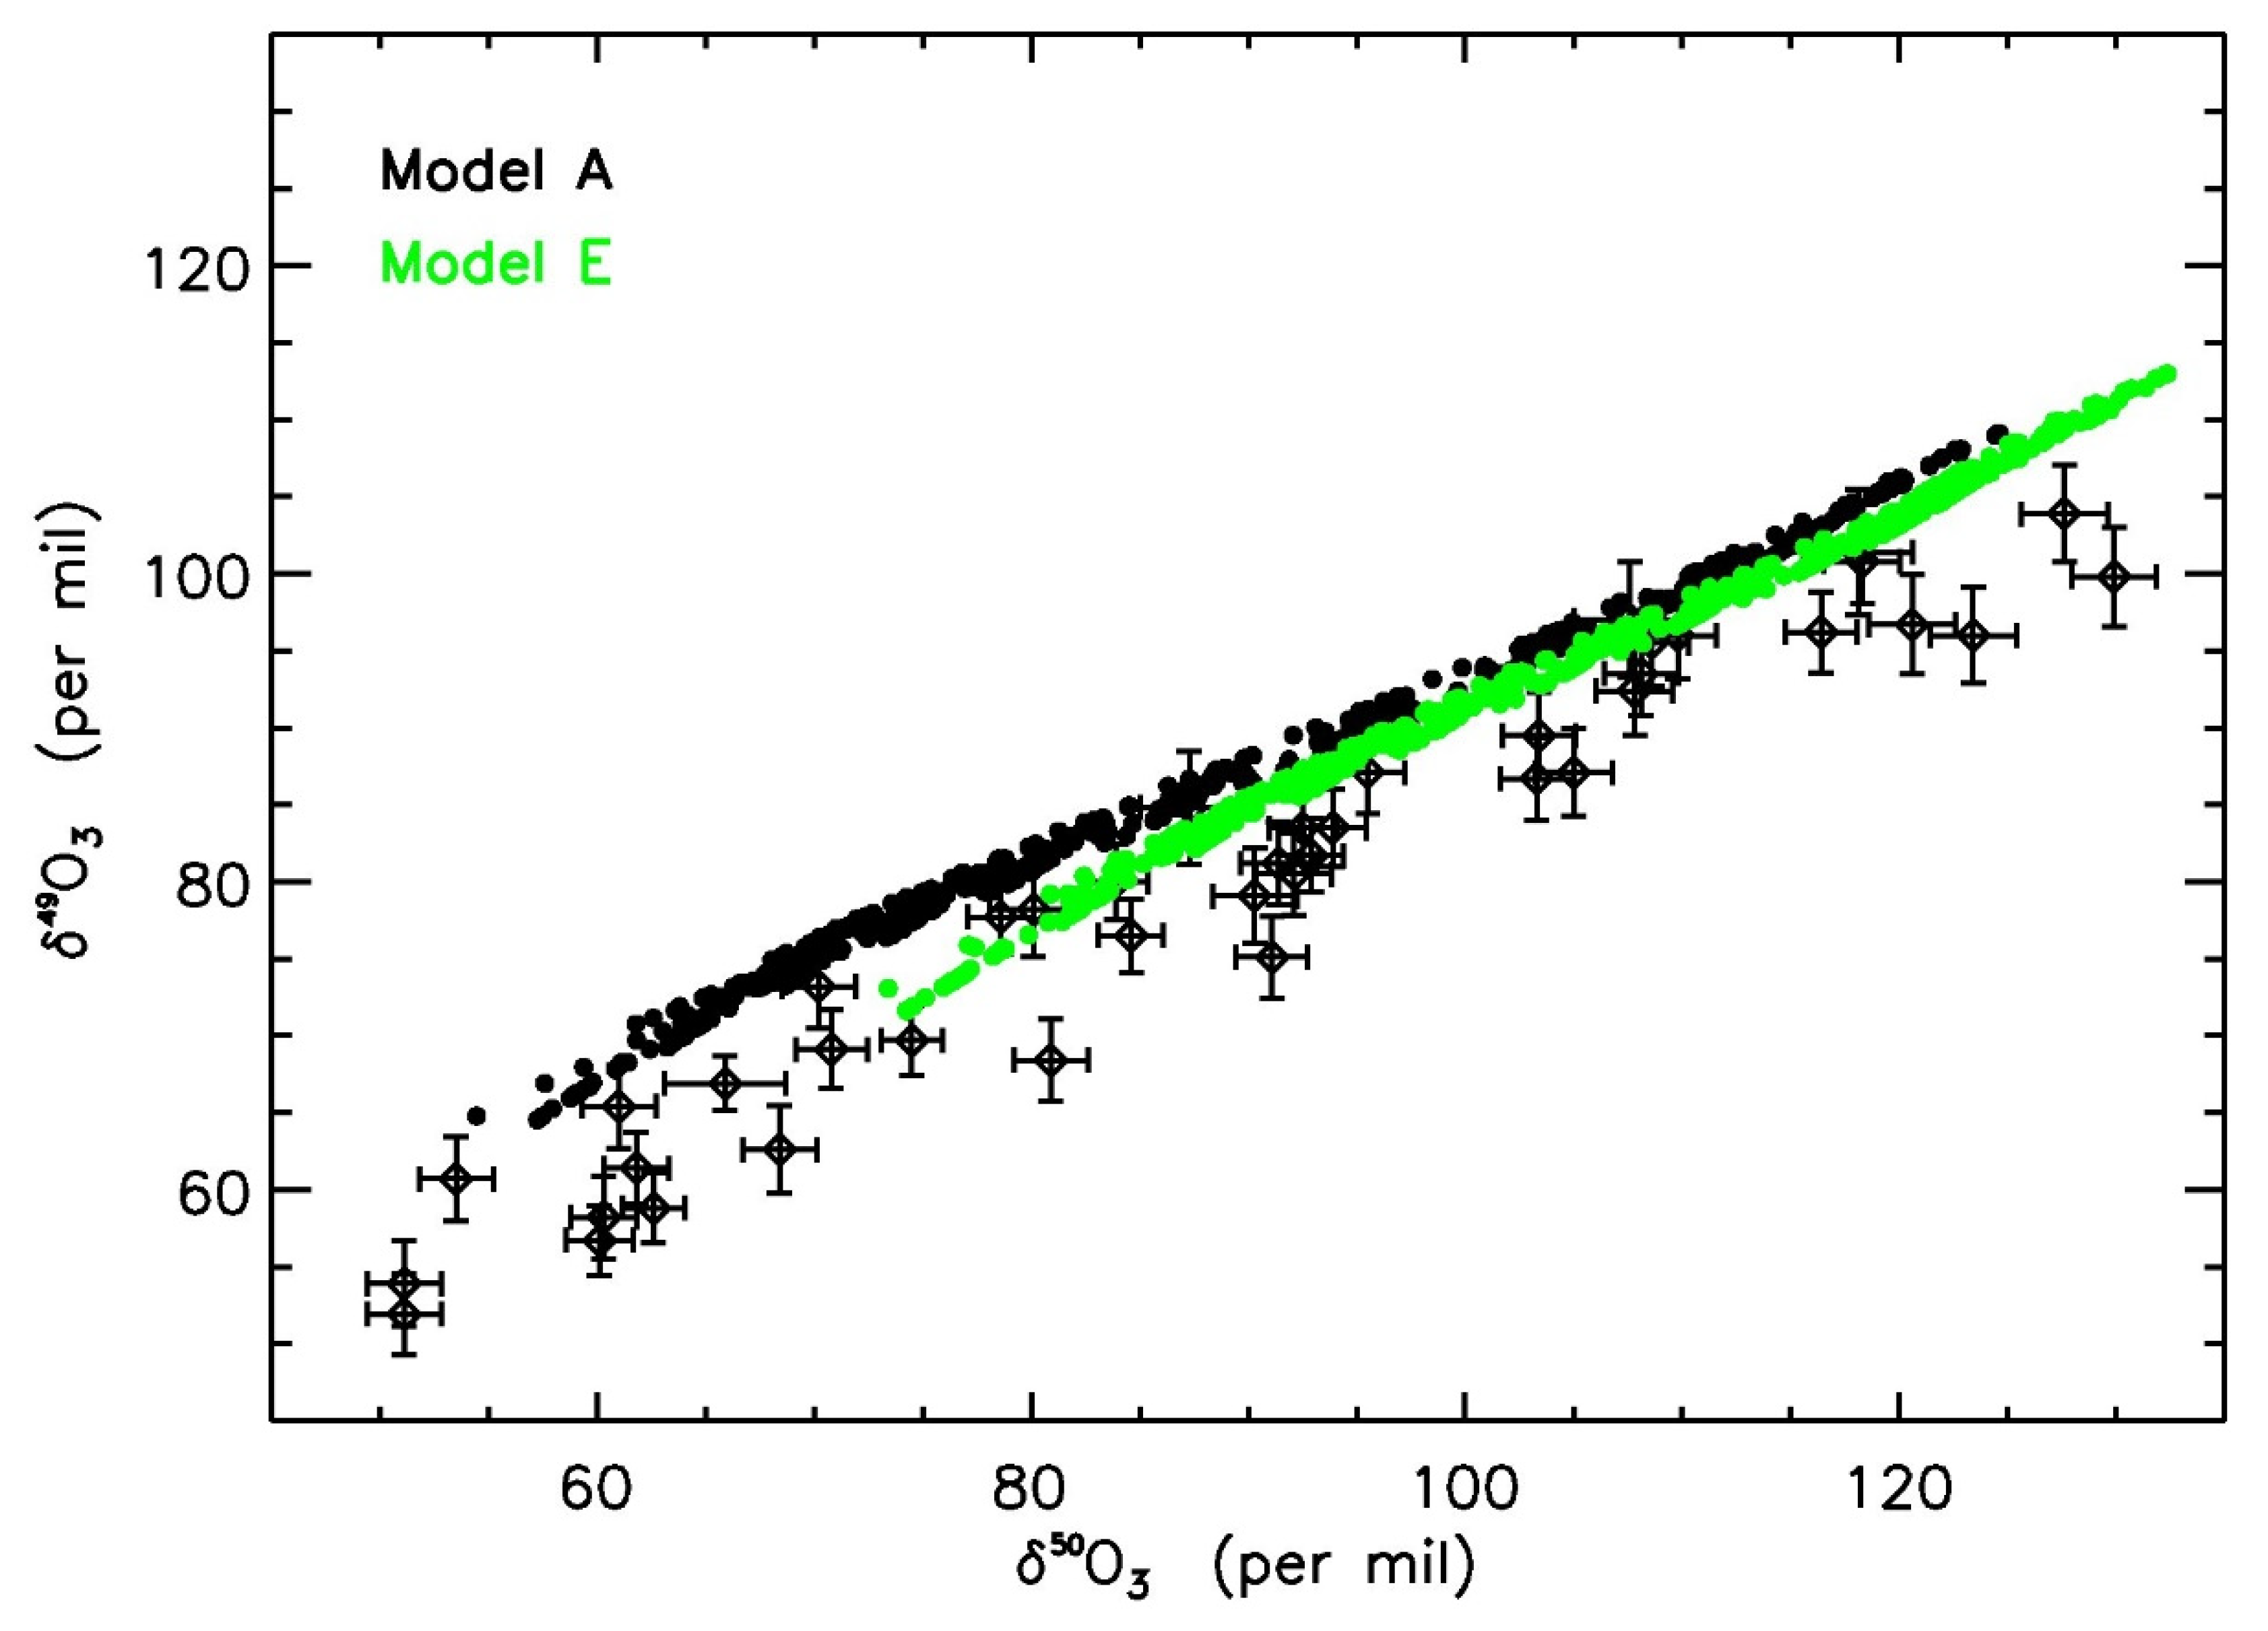
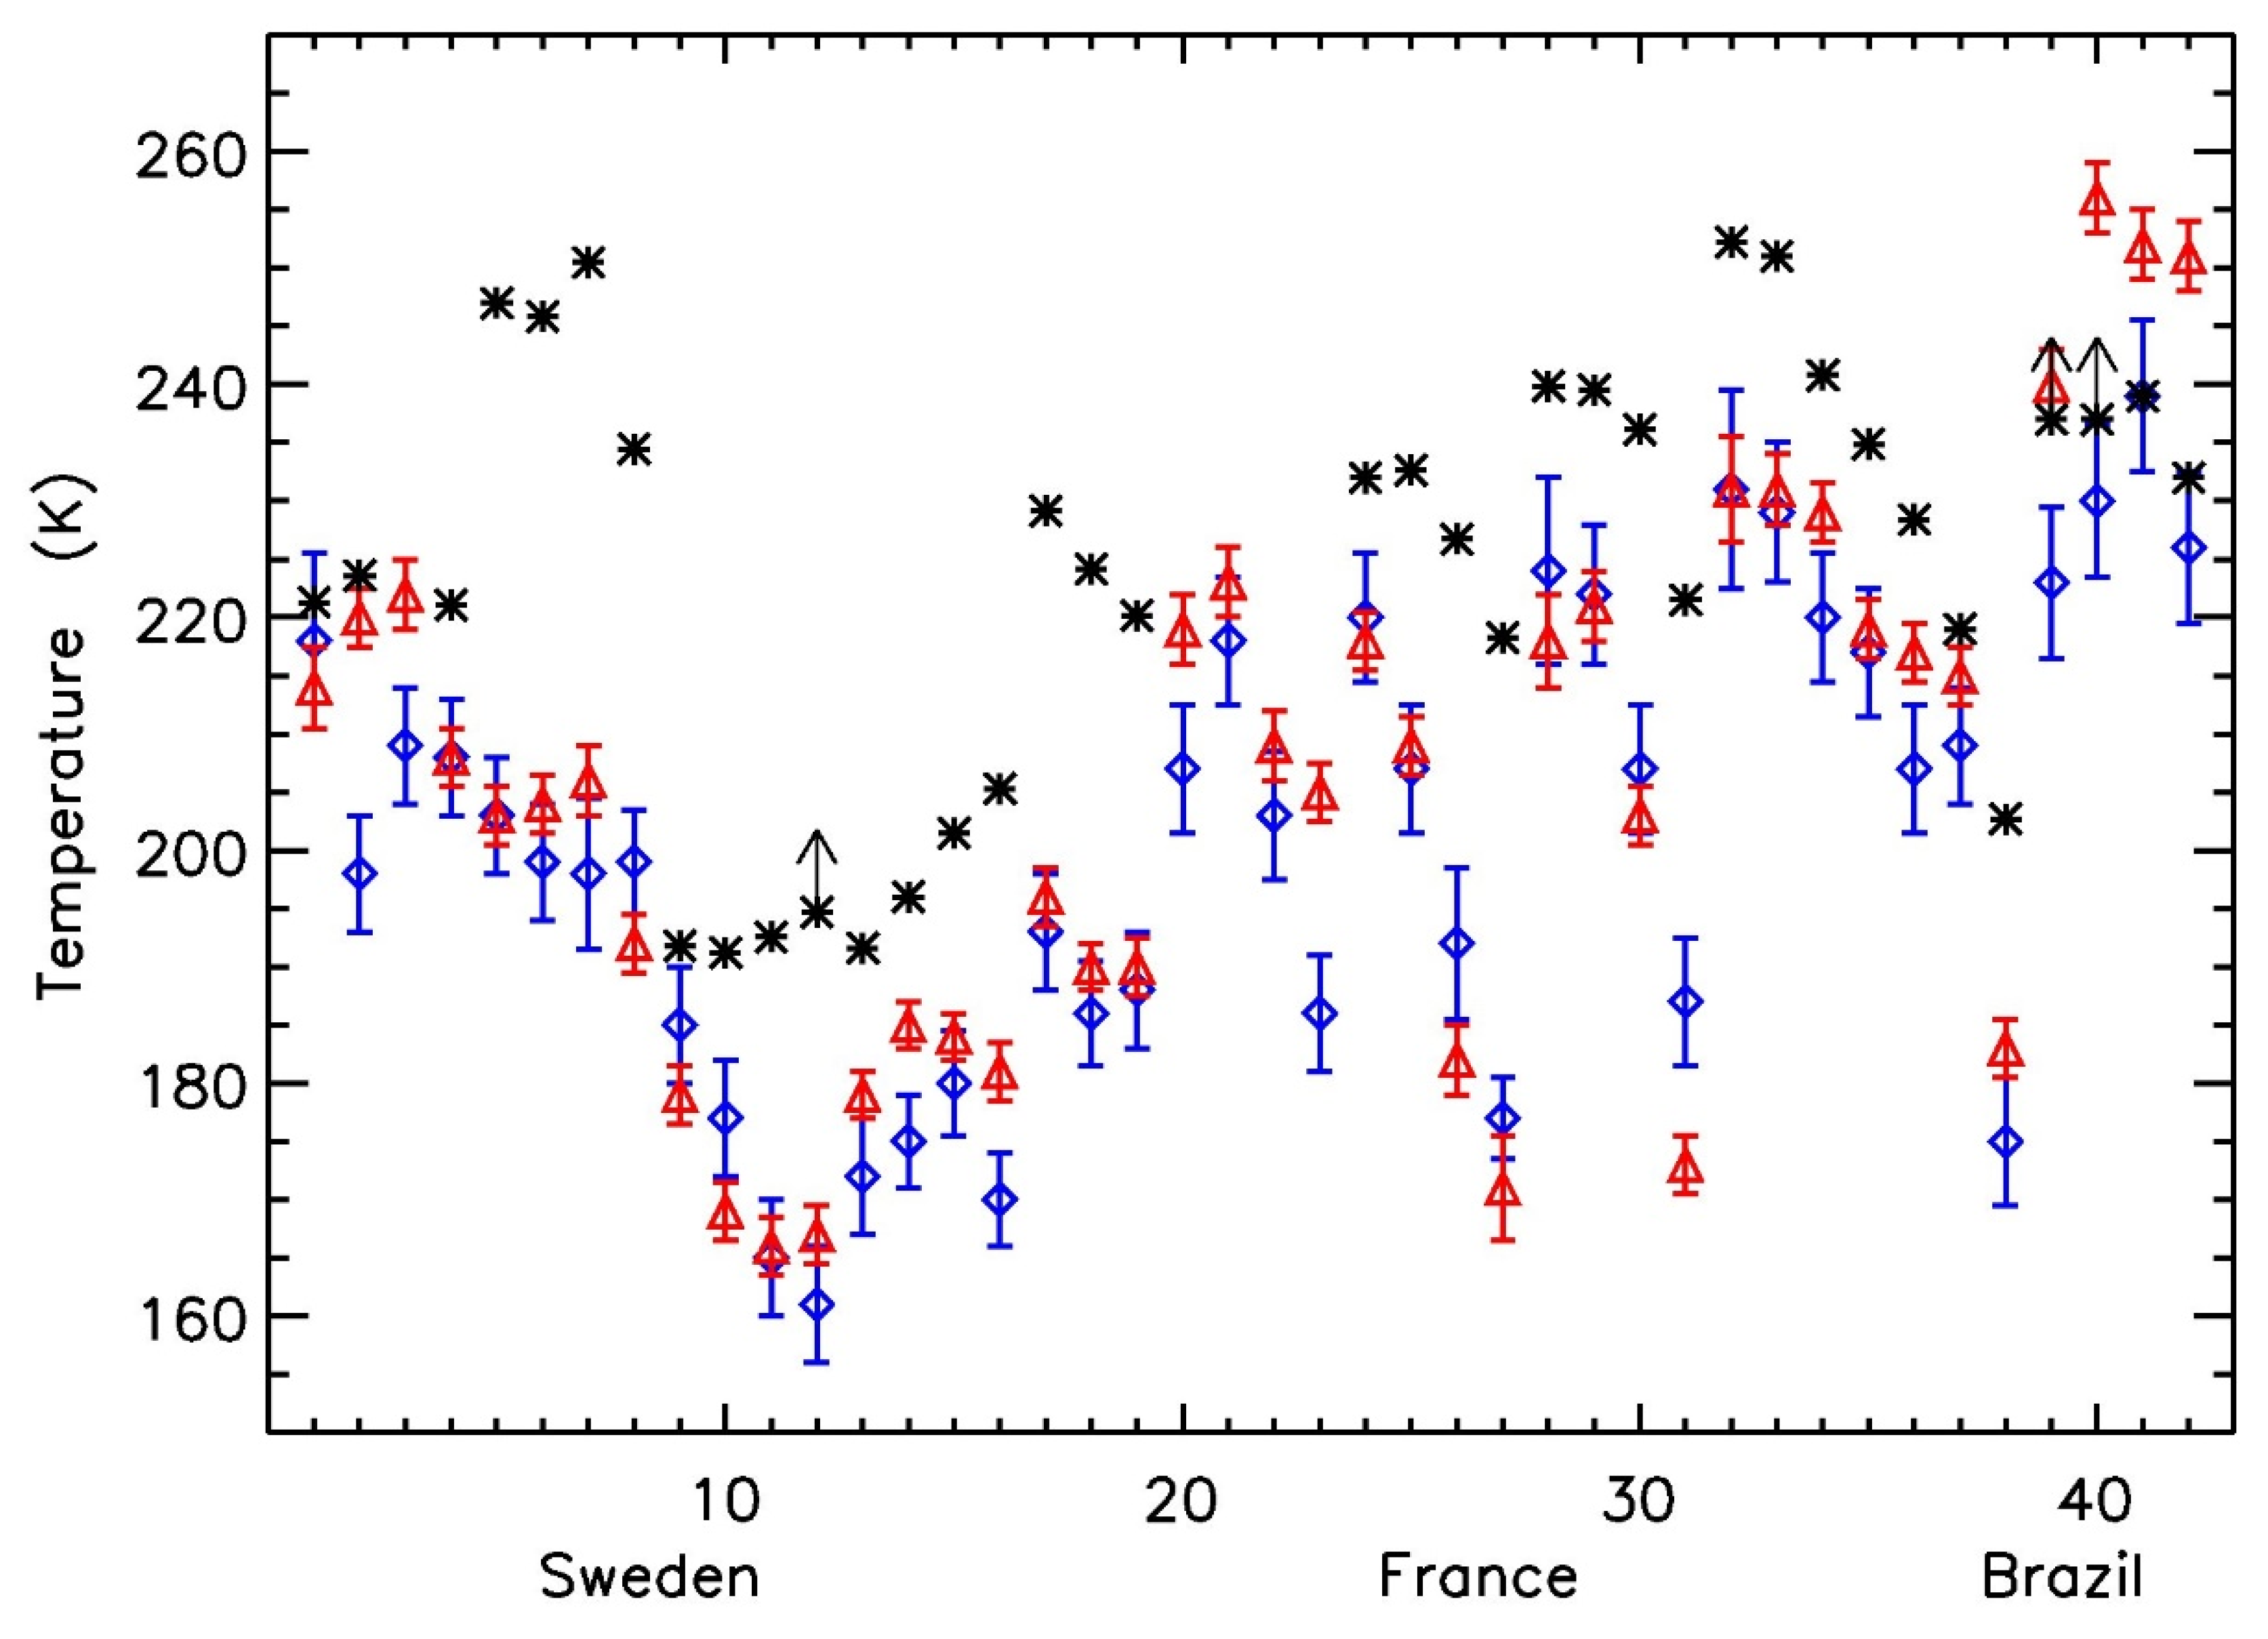
The zero-point-energy theory for estimating the isotopic fractionation of ozone in the Chappuis band is assumed, as in Liang et al. [5]. Combining the kinetic fractionation processes in the formation and photolysis of ozone, the calculated δ49O3 and δ50O3 remain >10‰ larger than the measurements (Figure 2). Here, we update previous calculations to include pressure dependence, which reduces δ-values at higher pressures. By incorporating NCEP2 daily temperature into the model, a better agreement is achieved. However, there is a difference between the observed temperature (in situ measurements and NCEP2 data) and the temperature that is required to reproduce the observed values of δ49O3 and δ50O3 (Table 1 and Figure 3). The in situ measured temperature tends to be higher than the climatological and NCEP2 daily and 6-hourly temperature.

4. Chappuis Band Photolysis

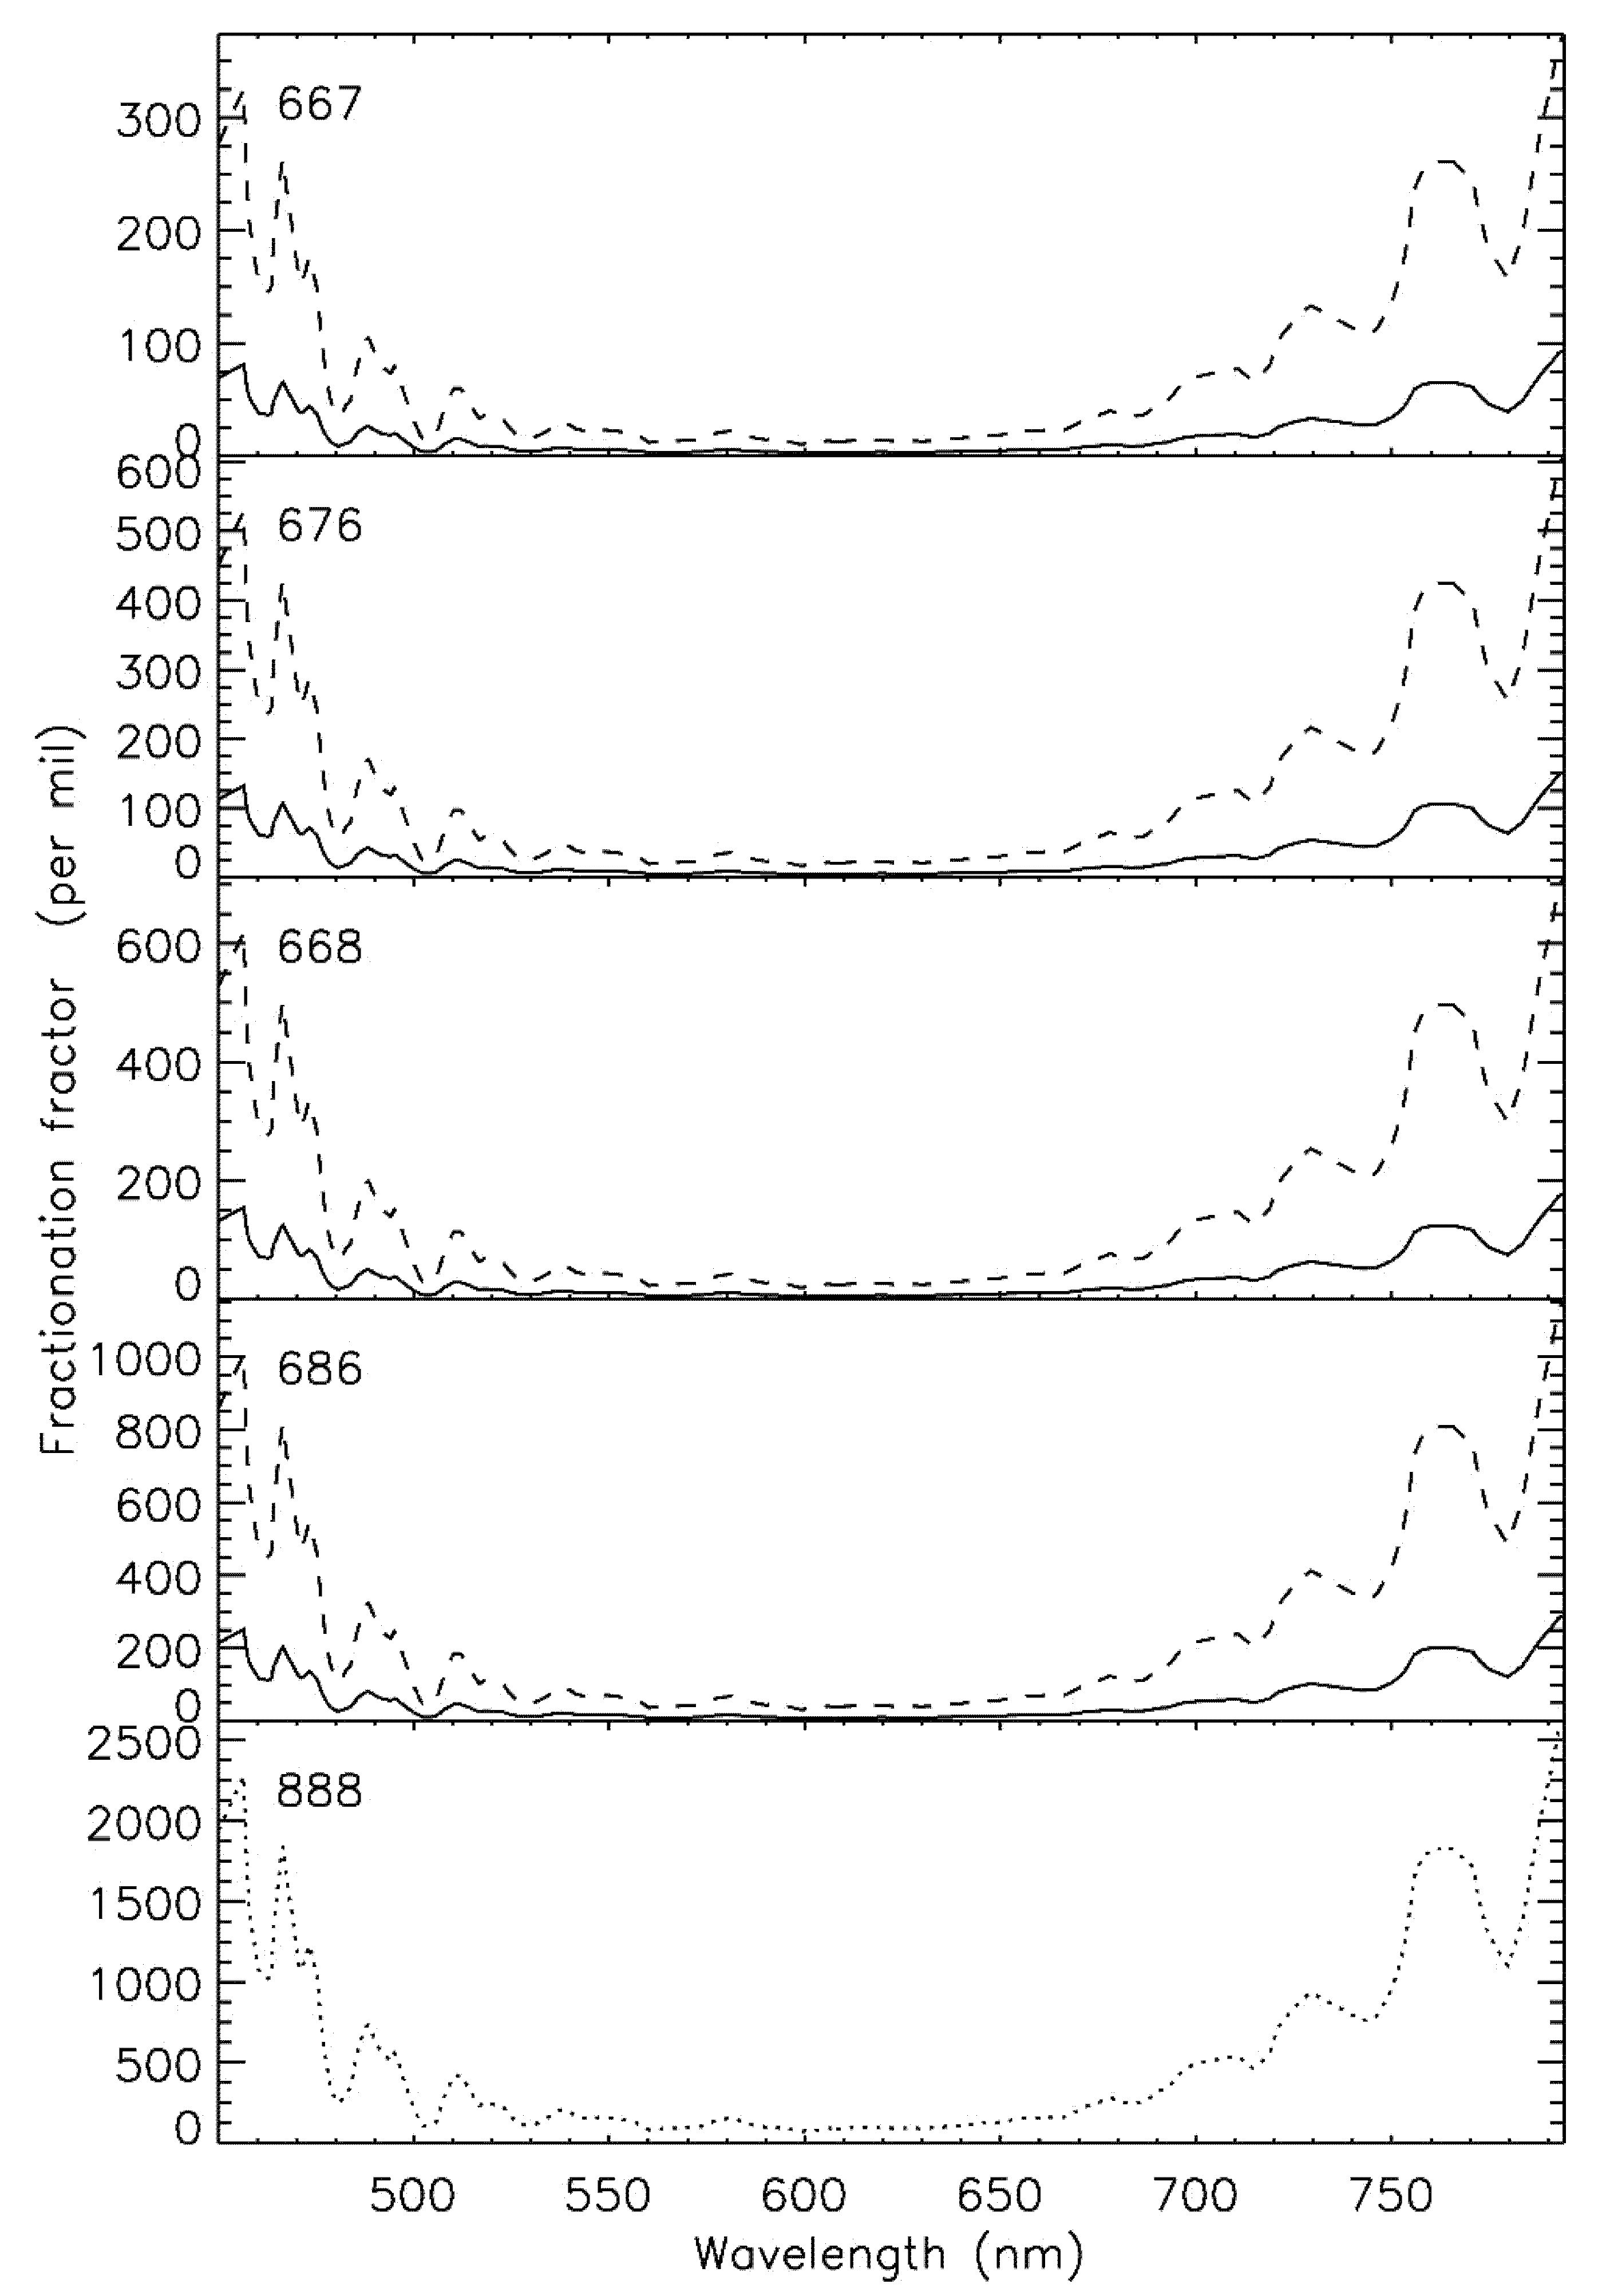
Photolysis of ozone occurs primarily in the Hartley and Huggins bands in the UV and Chappuis bands at longer wavelengths (450–850 nm). Chappuis band photolysis dominates for altitudes <35 km and could deplete heavy ozone [5,31,32,41,42,43]. Due to limited photolytic data for major isotopolocules of ozone in the visible band [31,32,44], we followed typical theories to estimate the fractionation. They are either zero-point-energy theory [29] or modified zero-point-energy theory [27,28]. The latter is applied to ozone in the Hartley and Huggins bands and turns out to be reliable [5]. Both theories predict similar and small but positive fractionation in the Chappuis band, and they cannot explain the observed data for 18O18O18O [42,43] and 49O3 and 50O3 [31,32,44]. An alternative way is to scale the fractionation from 18O18O18O, and the results obtained by assuming two approaches are shown in Figure 4. One way is to assume that the fractionation is linearly proportional to the difference of their zero-point-energies (dashed curves). This approach overestimates the effect from the Chappuis band (see Model C). A factor of four reduction (solid curves) in the zero-point-energy shift provides a better fit to the observations (Model A). However, both produce near-surface ozone isotopically too light compared with the observations (see Figure 1). This discrepancy could be explained by NO + O3 reaction that enhances the isotopic composition of ozone [45], because the measurements were taken in urban areas, instead of a clean atmosphere, where the Chapman chemistry is not valid. Thus, the isotopic compositions of near-surface ozone are affected by both the photolysis in the Chappuis band and the reaction with NO.
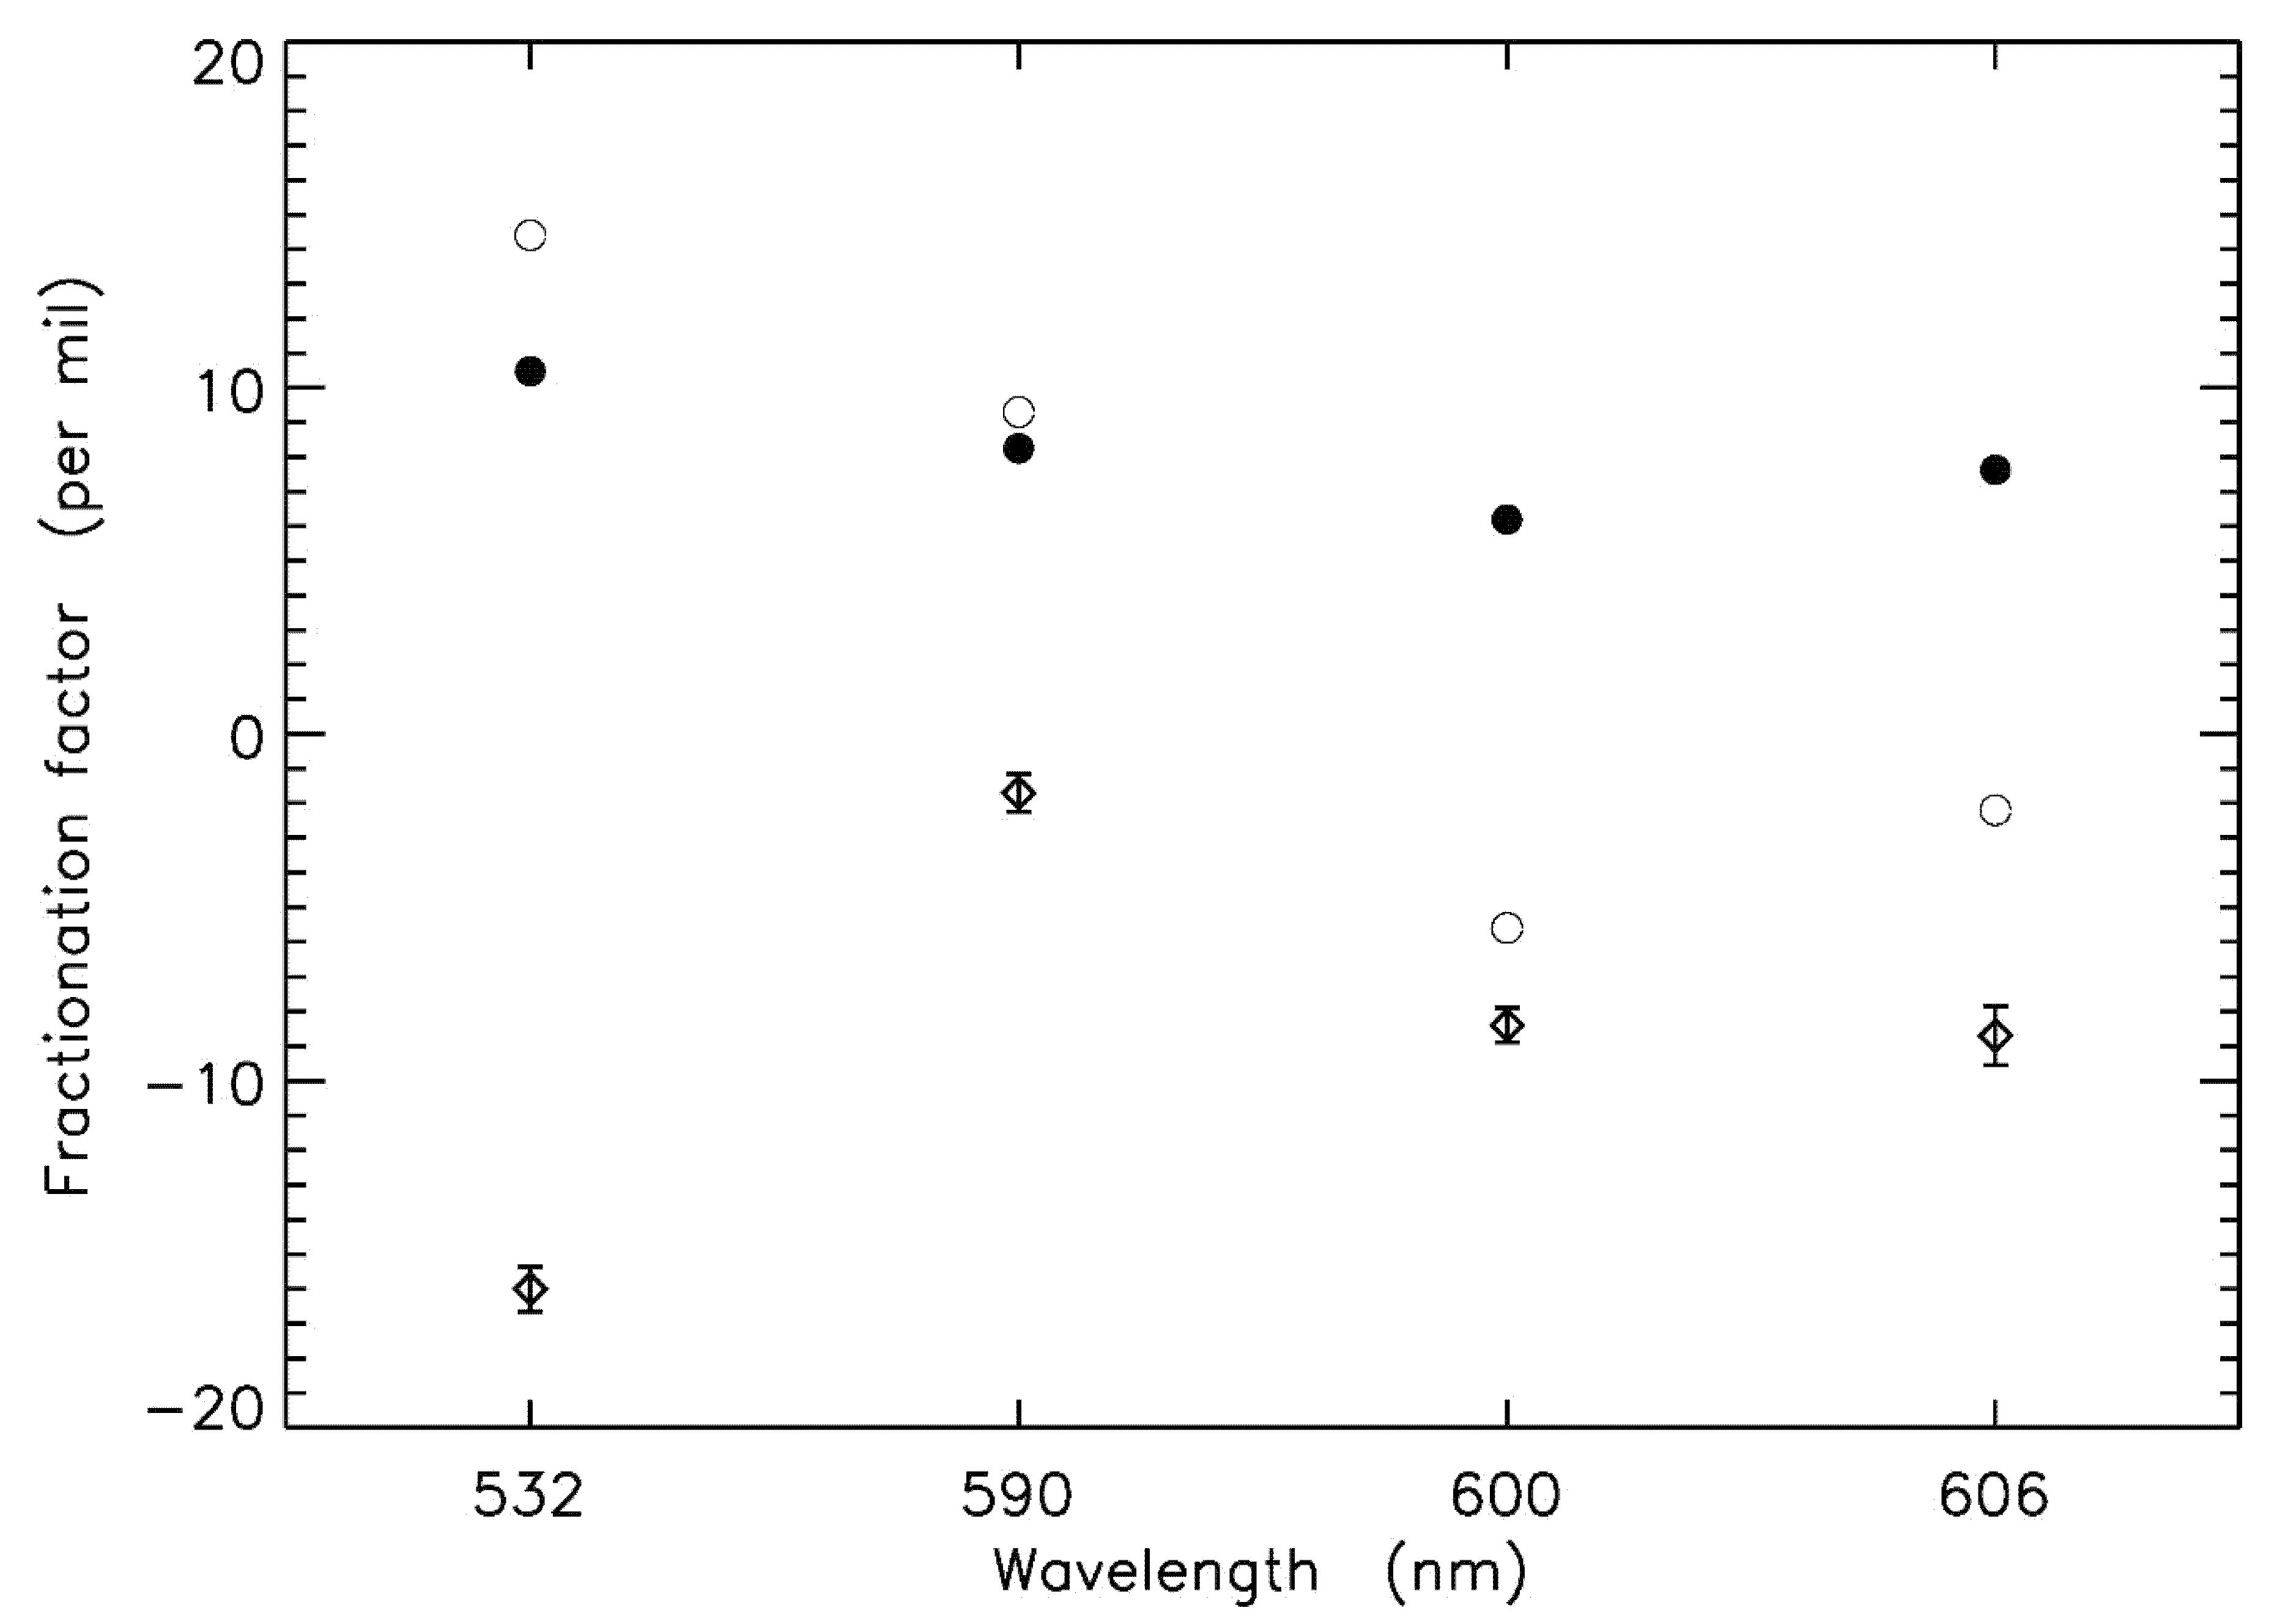
To verify the photolytic calculation shown above, we compare the model adopted fractionations with limited data. The result is summarized in Figure 5; we compare with the data from Huang et al. [32] only, because the fractionation factors were obtained at well-defined wavelengths. We see that at the four wavelengths of the measurements, the model needed fractionations deviate significantly from the laboratory data, suggesting hitherto unknown processes in affecting the photolytic process of ozone. We do not have the data at other wavelengths. Thus, the photolysis-induced isotopic fractionation in the Chappuis band remains a solution to the model-observation discrepancy mentioned above. This calls for an urgent need for laboratory measurements at other wavelengths in the Chappuis band, essential for tropospheric chemistry research.
The solar radiation at visible wavelengths is affected by multiple scattering [46]. Hence, the photolysis in the Chappuis band in the stratosphere can be significantly enhanced by clouds in the troposphere. We perform an aerosol and cloud scattering calculation, based on Discrete Ordinates Radiative Transfer Program for a Multi-Layered Plane-Parallel Medium [47], by introducing a bright cloud layer between 900–1200 m, with single scattering albedo 0.999 and asymmetry factor 0.85. The typical cloud optical depth at 300 nm is ~18.6, compared to that due to ozone absorption (~3.6) and Rayleigh extinction (~1.3). Figure 1 demonstrates an example of enhancing the photolysis rate coefficient in the Chappuis bands (Model F). Indeed, the model helps reduce the delta values in the lower stratosphere (cf. Model A). We note that cloud multiple scattering is not a solution to the aforementioned model imperfection. Instead, the role of scattering is to amplify the isotopic fractionation in the Chappuis band.

5. Discussion and Conclusions

It is known that the isotopic composition of O3 is influenced by its formation and photolysis. Here, we focus our analysis and make comparison with ozone measurements from mass spectrometry, because of its analytical precision. Remote sensing data [1,9,10,11,12], though retrieved at reduced precision, remain potentially useful, especially when retrieval algorithms are improved, because the technique provides good spatial and temporal coverages that mass spectrometry cannot. Furthermore, spectroscopic methods distinguish symmetric from asymmetric ozone molecules, essential for identifying missing processes, if they exist, in affecting the isotope composition of ozone in the atmosphere, because of their difference in, for example, altitude dependence [5].
Three factors affect the isotopic composition: pressure, temperature, and photolysis. The in situ measured δ49O3 and δ49O3 values between 20 and 35 km range from 50 to 130‰. Large discrepancies between the measurements and previous models are found (Figure 1 and Figure 2 and Table 1). To account for the observed δ49O3 and δ50O3, their temperature and pressure dependences are examined. The formation of O3 at higher pressures reduces the abundance of heavy ozone. However, the pressure in the regions of interest (>20 km) is less than 100 mbar, and the modification is about −5‰ or less, compared with the low-pressure calculation (Figure 1). Hence, the pressure dependence as a source of the discrepancy seen for the data in the stratosphere is insufficient. The isotopic value of atmospheric O3 has relatively weak temperature dependence (~0.6‰ K−1), and the required temperature to explain the data differs significantly from the reanalysis and in situ temperatures (Table 1). Therefore, the temperature mechanism becomes less plausible. This leaves attenuated dissociative photon flux as the only mechanism, though hitherto unknown mechanisms in fractionating the isotopic composition of O3 in the atmosphere are not ruled out. As the model values are biased to be too high compared with the measurements, the photolysis in the Chappuis band could help reduce the deviation if the rate coefficient or the isotopic fractionation in this band is enhanced. Calculations of multiple photon scattering that affect dissociative photon distributions are insufficient to reduce the isotopic composition of ozone. Directly tuning the fractionation factor in the Chappuis band provides a better explanation. New laboratory measurements, especially the Chappuis band, are needed to quantify the processes that affect the isotopic composition of ozone in the atmosphere.
The isotopic signature in O3 can be transferred readily to other trace species such as the hydroxyl radical, nitrate, and nitrite [7,18,19,26,48]. Take NOx (=NO + NO2) as an example. The transfer of isotope anomaly from O3 to nitrate and nitrite is due to the following reactions:
NO2 + hν → NO + O
O + O2 + M → O3 + M
NO + O3 → NO2 + O2.
The subsequent chemical reactions with O3, OH, and H2O produce nitrates and nitrites containing an isotope signature from O3. Similar transformation also applies to OH through
O3 + hν → O(1D) + O2
O(1D) + H2O → 2 OH.
Hence, the anomalous isotope signature in oxygen provides useful tools for tracing pollution chemistry because O3 is central to tropospheric chemistry [49,50]. In addition to the present-day atmosphere, the composition of paleo-atmospheres could also be constrained by the unique isotope anomaly in oxygen, such as the level of carbon dioxide [51]. The applicability requires the knowledge of processes that affect the isotopic composition of ozone, which remains unsatisfactory. Photolysis in the Chappuis band, in particular, deserves further investigation, because it is essential in affecting the isotopic composition of ozone.

Author Contributions

Conceptualization, M.-C.L. and Y.L.Y.; methodology, M.-C.L., Y.-C.C., Y.-Q.G., X.Z. and Y.L.Y.; validation, M.-C.L.; formal analysis, M.-C.L., Y.-C.C. and X.Z.; investigation, M.-C.L., Y.-C.C. and X.Z.; data curation, M.-C.L., Y.-C.C. and X.Z.; writing—original draft preparation, M.-C.L.; writing—review and editing, M.-C.L., Y.-C.C., X.Z. and Y.L.Y.; visualization, M.-C.L., Y.-C.C. and X.Z.; funding acquisition, M.-C.L. All authors have read and agreed to the published version of the manuscript.

Funding

This research was supported in part by MOST Grants 108-2111-M-001-011-MY3, 109-2111-M-001-009-, 110-2111-M-001-012-, and 110-2111-M-001-015 to Academia Sinica and an Academia Sinica Grant AS-IA-109-M03. X.Z. was supported by National Science Foundation Grant AGS-1901126 to the University of California, Santa Cruz. Y.L.Y. was supported in part an NAI Virtual Planetary Laboratory Grant from the University of Washington to the Jet Propulsion Laboratory and California Institute of Technology.

Institutional Review Board Statement

Not applicable.

Informed Consent Statement

Not applicable.

Data Availability Statement

The data used in the paper are either provided in the table or taken from the published papers refereed.

Acknowledgments

We thank D. Krankowsky for providing the in situ measured temperatures.

Conflicts of Interest

The authors declare no conflict of interest.

References

  1. Irion, F.W.; Gunson, M.R.; Rinsland, C.P.; Yung, Y.L.; Abrams, M.C.; Chang, A.Y.; Goldman, A. Heavy ozone enrichments from ATMOS infrared solar spectra. Geophys. Res. Lett. 1996, 23, 2377–2380. [Google Scholar] [CrossRef] [Green Version]
  2. Krankowsky, D.; Bartecki, F.; Klees, G.G.; Mauersberger, K.; Schellenbach, K.; Stehr, J. Measurement of Heavy Isotope Enrichment in Tropospheric Ozone. Geophys. Res. Lett. 1995, 22, 1713–1716. [Google Scholar] [CrossRef]
  3. Krankowsky, D.; Lammerzahl, P.; Mauersberger, K.; Janssen, C.; Tuzson, B.; Rockmann, T. Stratospheric ozone isotope fractionations derived from collected samples. J. Geophys. Res. Atmos. 2007, 112, D08301. [Google Scholar] [CrossRef] [Green Version]
  4. Mauersberger, K. Measurement of Heavy Ozone in the Stratosphere. Geophys. Res. Lett. 1981, 8, 935–937. [Google Scholar] [CrossRef]
  5. Liang, M.C.; Irion, F.W.; Weibel, J.D.; Miller, C.E.; Blake, G.A.; Yung, Y.L. Isotopic composition of stratospheric ozone. J. Geophys. Res. Atmos. 2006, 111, D02302. [Google Scholar] [CrossRef] [Green Version]
  6. Liang, M.C.; Yung, Y.L. Sources of the oxygen isotopic anomaly in atmospheric N2O. J. Geophys. Res. Atmos. 2007, 112, D13307. [Google Scholar] [CrossRef] [Green Version]
  7. Thiemens, M.H. History and applications of mass-independent isotope effects. Annu. Rev. Earth Planet. Sci. 2006, 34, 217–262. [Google Scholar] [CrossRef] [Green Version]
  8. Johnston, J.C.; Thiemens, M.H. The isotopic composition of tropospheric ozone in three environments. J. Geophys. Res. Atmos. 1997, 102, 25395–25404. [Google Scholar] [CrossRef]
  9. Haverd, V.; Toon, G.C.; Griffith, D.W. Evidence for altitude–dependent photolysis–induced 18O isotopic fractionation in stratospheric ozone. Geophys. Res. Lett. 2005, 32, L22808. [Google Scholar] [CrossRef] [Green Version]
  10. Jonkheid, B.; Röckmann, T.; Glatthor, N.; Janssen, C.; Stiller, G.; Clarmann, T.V. Retrievals of heavy ozone with MIPAS. Atmos. Meas. Tech. 2016, 9, 6069–6079. [Google Scholar] [CrossRef]
  11. Kasai, Y.J.; Urban, J.; Takahashi, C.; Hoshino, S.; Takahashi, K.; Inatani, J.; Shiotani, M.; Masuko, H. Stratospheric ozone isotope enrichment studied by submillimeter wave heterodyne radiometry: The observation capabilities of SMILES. IEEE Trans. Geosci. Remote Sens. 2006, 44, 676–693. [Google Scholar] [CrossRef]
  12. Fernando, A.M.; Bernath, P.F.; Boone, C.D. Ozone isotopologue measurements from the Atmospheric Chemistry Experiment (ACE). J. Quant. Spectrosc. Radiat. Transf. 2019, 238, 106547. [Google Scholar] [CrossRef]
  13. Bao, H.; Thiemens, M.H.; Farquhar, J.; Campbell, D.A.; Lee, C.C.; Heine, K.; Loope, D.B. Anomalous 17O compositions in massive sulphate deposits on the Earth. Nature 2000, 406, 176–178. [Google Scholar] [CrossRef]
  14. Boering, K.A.; Jackson, T.; Hoag, K.J.; Cole, A.S.; Perri, M.J.; Thiemens, M.; Atlas, E. Observations of the anomalous oxygen isotopic composition of carbon dioxide in the lower stratosphere and the flux of the anomaly to the troposphere. Geophys. Res. Lett. 2004, 31, L03109. [Google Scholar] [CrossRef] [Green Version]
  15. Cliff, S.S.; Thiemens, M.H. The 18O/16O and 17O/16O ratios in atmospheric nitrous oxide: A mass-independent anomaly. Science 1997, 278, 1774–1776. [Google Scholar] [CrossRef]
  16. Lammerzahl, P.; Rockmann, T.; Brenninkmeijer, C.A.M.; Krankowsky, D.; Mauersberger, K. Oxygen isotope composition of stratospheric carbon dioxide. Geophys. Res. Lett. 2002, 29, 1582. [Google Scholar] [CrossRef]
  17. Liang, M.C.; Blake, G.A.; Lewis, B.R.; Yung, Y.L. Oxygen isotopic composition of carbon dioxide in the middle atmosphere. Proc. Natl. Acad. Sci. USA 2007, 104, 21–25. [Google Scholar] [CrossRef] [Green Version]
  18. Michalski, G.; Scott, Z.; Kabiling, M.; Thiemens, M.H. First measurements and modeling of Delta O-17 in atmospheric nitrate. Geophys. Res. Lett. 2003, 30, 1870. [Google Scholar] [CrossRef]
  19. Morin, S.; Savarino, J.; Frey, M.M.; Yan, N.; Bekki, S.; Bottenheim, J.W.; Martins, J.M. Tracing the origin and fate of NOx in the Arctic atmosphere using stable isotopes in nitrate. Science 2008, 322, 730–732. [Google Scholar] [CrossRef]
  20. Thiemens, M.H.; Jackson, T.; Zipf, E.C.; Erdman, P.W.; Vanegmond, C. Carbon-Dioxide and Oxygen-Isotope Anomalies in the Mesosphere and Stratosphere. Science 1995, 270, 969–972. [Google Scholar] [CrossRef]
  21. Lyons, J.R. Transfer of mass-independent fractionation in ozone to other oxygen-containing radicals in the atmosphere. Geophys. Res. Lett. 2001, 28, 3231–3234. [Google Scholar] [CrossRef]
  22. Liang, M.C.; Blake, G.A.; Yung, Y.L. Seasonal cycle of C16O16O, C16O17O, and C16O18O in the middle atmosphere: Implications for mesospheric dynamics and biogeochemical sources and sinks of CO2. J. Geophys. Res. Atmos. 2008, 113, D12305. [Google Scholar] [CrossRef] [Green Version]
  23. Wiegel, A.A.; Cole, A.S.; Hoag, K.J.; Atlas, E.L.; Schauffler, S.M.; Boering, K.A. Unexpected variations in the triple oxygen isotope composition of stratospheric carbon dioxide. Proc. Natl. Acad. Sci. USA 2013, 110, 17680–17685. [Google Scholar] [CrossRef] [Green Version]
  24. Liang, M.C.; Mahata, S.; Laskar, A.H.; Thiemens, M.H.; Newman, S. Oxygen isotope anomaly in tropospheric CO2 and implications for CO2 residence time in the atmosphere and gross primary productivity. Sci. Rep. 2017, 7, 13180. [Google Scholar] [CrossRef]
  25. Koren, G.; Schneider, L.; van der Velde, I.R.; van Schaik, E.; Gromov, S.S.; Adnew, G.A.; Mrozek, D.J.; Hofmann, M.E.; Liang, M.C.; Mahata, S. Global 3D Simulations of the Triple Oxygen Isotope Signature Δ17O in Atmospheric CO2. J. Geophys. Res. Atmos. 2018, 145, 8808–8836. [Google Scholar]
  26. Guha, T.; Lin, C.T.; Bhattacharya, S.K.; Mahajan, A.S.; Ou-Yang, C.F.; Lan, Y.P.; Hsu, S.C.; Liang, M.C. Isotopic ratios of nitrate in aerosol samples from Mt. Lulin, a high-altitude station in Central Taiwan. Atmos. Environ. 2017, 154, 53–69. [Google Scholar] [CrossRef]
  27. Liang, M.C.; Blake, G.A.; Yung, Y.L. A semianalytic model for photo-induced isotopic fractionation in simple molecules. J. Geophys. Res. Atmos. 2004, 109, D10308. [Google Scholar] [CrossRef]
  28. Blake, G.A.; Liang, M.C.; Morgan, C.G.; Yung, Y.L. A Born-Oppenheimer photolysis model of N2O fractionation. Geophys. Res. Lett. 2003, 30, 1656. [Google Scholar] [CrossRef] [Green Version]
  29. Yung, Y.L.; Miller, C.E. Isotopic fractionation of stratospheric nitrous oxide. Science 1997, 278, 1778–1780. [Google Scholar] [CrossRef]
  30. Früchtl, M.; Janssen, C.; Röckmann, T. Experimental study on isotope fractionation effects in visible photolysis of O3 and in the O+O3 odd oxygen sink reaction. J. Geophys. Res. Atmos. 2015, 120, 4398–4416. [Google Scholar] [CrossRef]
  31. Früchtl, M.; Janssen, C.; Taraborrelli, D.; Gromov, S.; Röckmann, T. Wavelength–dependent isotope fractionation in visible light O3 photolysis and atmospheric implications. Geophys. Res. Lett. 2015, 42, 8711–8718. [Google Scholar] [CrossRef]
  32. Huang, C.H.; Bhattacharya, S.K.; Hsieh, Z.M.; Chen, Y.J.; Yih, T.S.; Liang, M.C. Isotopic Fractionation in Photolysis of Ozone in the Hartley and Chappuis Bands. Earth Space Sci. 2019, 6, 752–773. [Google Scholar] [CrossRef] [Green Version]
  33. Guenther, J.; Erbacher, B.; Krankowsky, D.; Mauersberger, K. Pressure dependence of two relative ozone formation rate coefficients. Chem. Phys. Lett. 1999, 306, 209–213. [Google Scholar] [CrossRef]
  34. Gao, Y.Q.; Marcus, R.A. An approximate theory of the ozone isotopic effects: Rate constant ratios and pressure dependence. J. Chem. Phys. 2007, 127, 244316. [Google Scholar] [CrossRef] [PubMed] [Green Version]
  35. Gao, Y.Q.; Marcus, R.A. Strange and unconventional isotope effects in ozone formation. Science 2001, 293, 259–263. [Google Scholar] [CrossRef] [Green Version]
  36. Gao, Y.Q.; Marcus, R.A. On the theory of the strange and unconventional isotopic effects in ozone formation. J. Chem. Phys. 2002, 116, 137–154. [Google Scholar] [CrossRef] [Green Version]
  37. Marcus, R.A.; Gao, Y.Q. Pressure effects on bimolecular recombination and unimolecular dissociation reactions. J. Chem. Phys. 2001, 114, 9807–9812. [Google Scholar] [CrossRef] [Green Version]
  38. Kaiser, J.; Rockmann, T.; Brenninkmeijer, C.A.M. Temperature dependence of isotope fractionation in N2O photolysis. Phys. Chem. Chem. Phys. 2002, 4, 4420–4430. [Google Scholar] [CrossRef]
  39. Morton, J.; Barnes, J.; Schueler, B.; Mauersberger, K. Laboratory Studies of Heavy Ozone. J. Geophys. Res. Atmos. 1990, 95, 901–907. [Google Scholar] [CrossRef]
  40. Kistler, R.; Kalnay, E.; Collins, W.; Saha, S.; White, G.; Woollen, J.; Chelliah, M.; Ebisuzaki, W.; Kanamitsu, M.; Kousky, V.; et al. The NCEP-NCAR 50-year reanalysis: Monthly means CD-ROM and documentation. Bull. Am. Meteorol. Soc. 2001, 82, 247–267. [Google Scholar] [CrossRef]
  41. Miller, C.E.; Onorato, R.M.; Liang, M.C.; Yung, Y.L. Extraordinary isotopic fractionation in ozone photolysis. Geophys. Res. Lett. 2005, 32, L14814. [Google Scholar] [CrossRef] [Green Version]
  42. Anderson, S.M.; Maeder, J.; Mauersberger, K. Effect of Isotopic-Substitution on the Visible Absorption-Spectrum of Ozone. J. Chem. Phys. 1991, 94, 6351–6357. [Google Scholar] [CrossRef]
  43. Anderson, S.M.; Mauersberger, K. Ozone Absorption-Spectroscopy in Search of Low-Lying Electronic States. J. Geophys. Res. Atmos. 1995, 100, 3033–3048. [Google Scholar] [CrossRef]
  44. Wen, J.; Thiemens, M.H. Experimental and Theoretical-Study of Isotope Effects on Ozone Decomposition. J. Geophys. Res. Atmos. 1991, 96, 10911–10921. [Google Scholar] [CrossRef]
  45. Chakraborty, S.; Chakraborty, S. Isotopic fractionation of the O3-nitric oxide reaction. Curr. Sci. 2003, 85, 1210–1212. [Google Scholar]
  46. Liao, H.; Yung, Y.L.; Seinfeld, J.H. Effects of aerosols on tropospheric photolysis rates in clear and cloudy atmospheres. J. Geophys. Res. Atmos. 1999, 104, 23697–23707. [Google Scholar] [CrossRef] [Green Version]
  47. Stamnes, K.; Tsay, S.C.; Wiscombe, W.; Jayaweera, K. Numerically stable algorithm for discrete-ordinate-method radiative transfer in multiple scattering and emitting layered media. Appl. Opt. 1988, 27, 2502–2509. [Google Scholar] [CrossRef]
  48. Berhanu, T.A.; Savarino, J.; Bhattacharya, S.K.; Vicars, W.C. 17O excess transfer during the NO2 + O3 --> NO3 + O2 reaction. J. Chem. Phys. 2012, 136, 044311. [Google Scholar] [CrossRef]
  49. Liu, S.C.; Kley, D.; Mcfarland, M.; Mahlman, J.D.; Levy, H. On the Origin of Tropospheric Ozone. J. Geophys. Res. Ocean. 1980, 85, 7546–7552. [Google Scholar] [CrossRef]
  50. Liu, S.C.; Trainer, M.; Fehsenfeld, F.C.; Parrish, D.D.; Williams, E.J.; Fahey, D.W.; Hubler, G.; Murphy, P.C. Ozone Production in the Rural Troposphere and the Implications for Regional and Global Ozone Distributions. J. Geophys. Res. Atmos. 1987, 92, 4191–4207. [Google Scholar] [CrossRef]
  51. Bao, H.; Lyons, J.R.; Zhou, C. Triple oxygen isotope evidence for elevated CO2 levels after a Neoproterozoic glaciation. Nature 2008, 453, 504–506. [Google Scholar] [CrossRef]
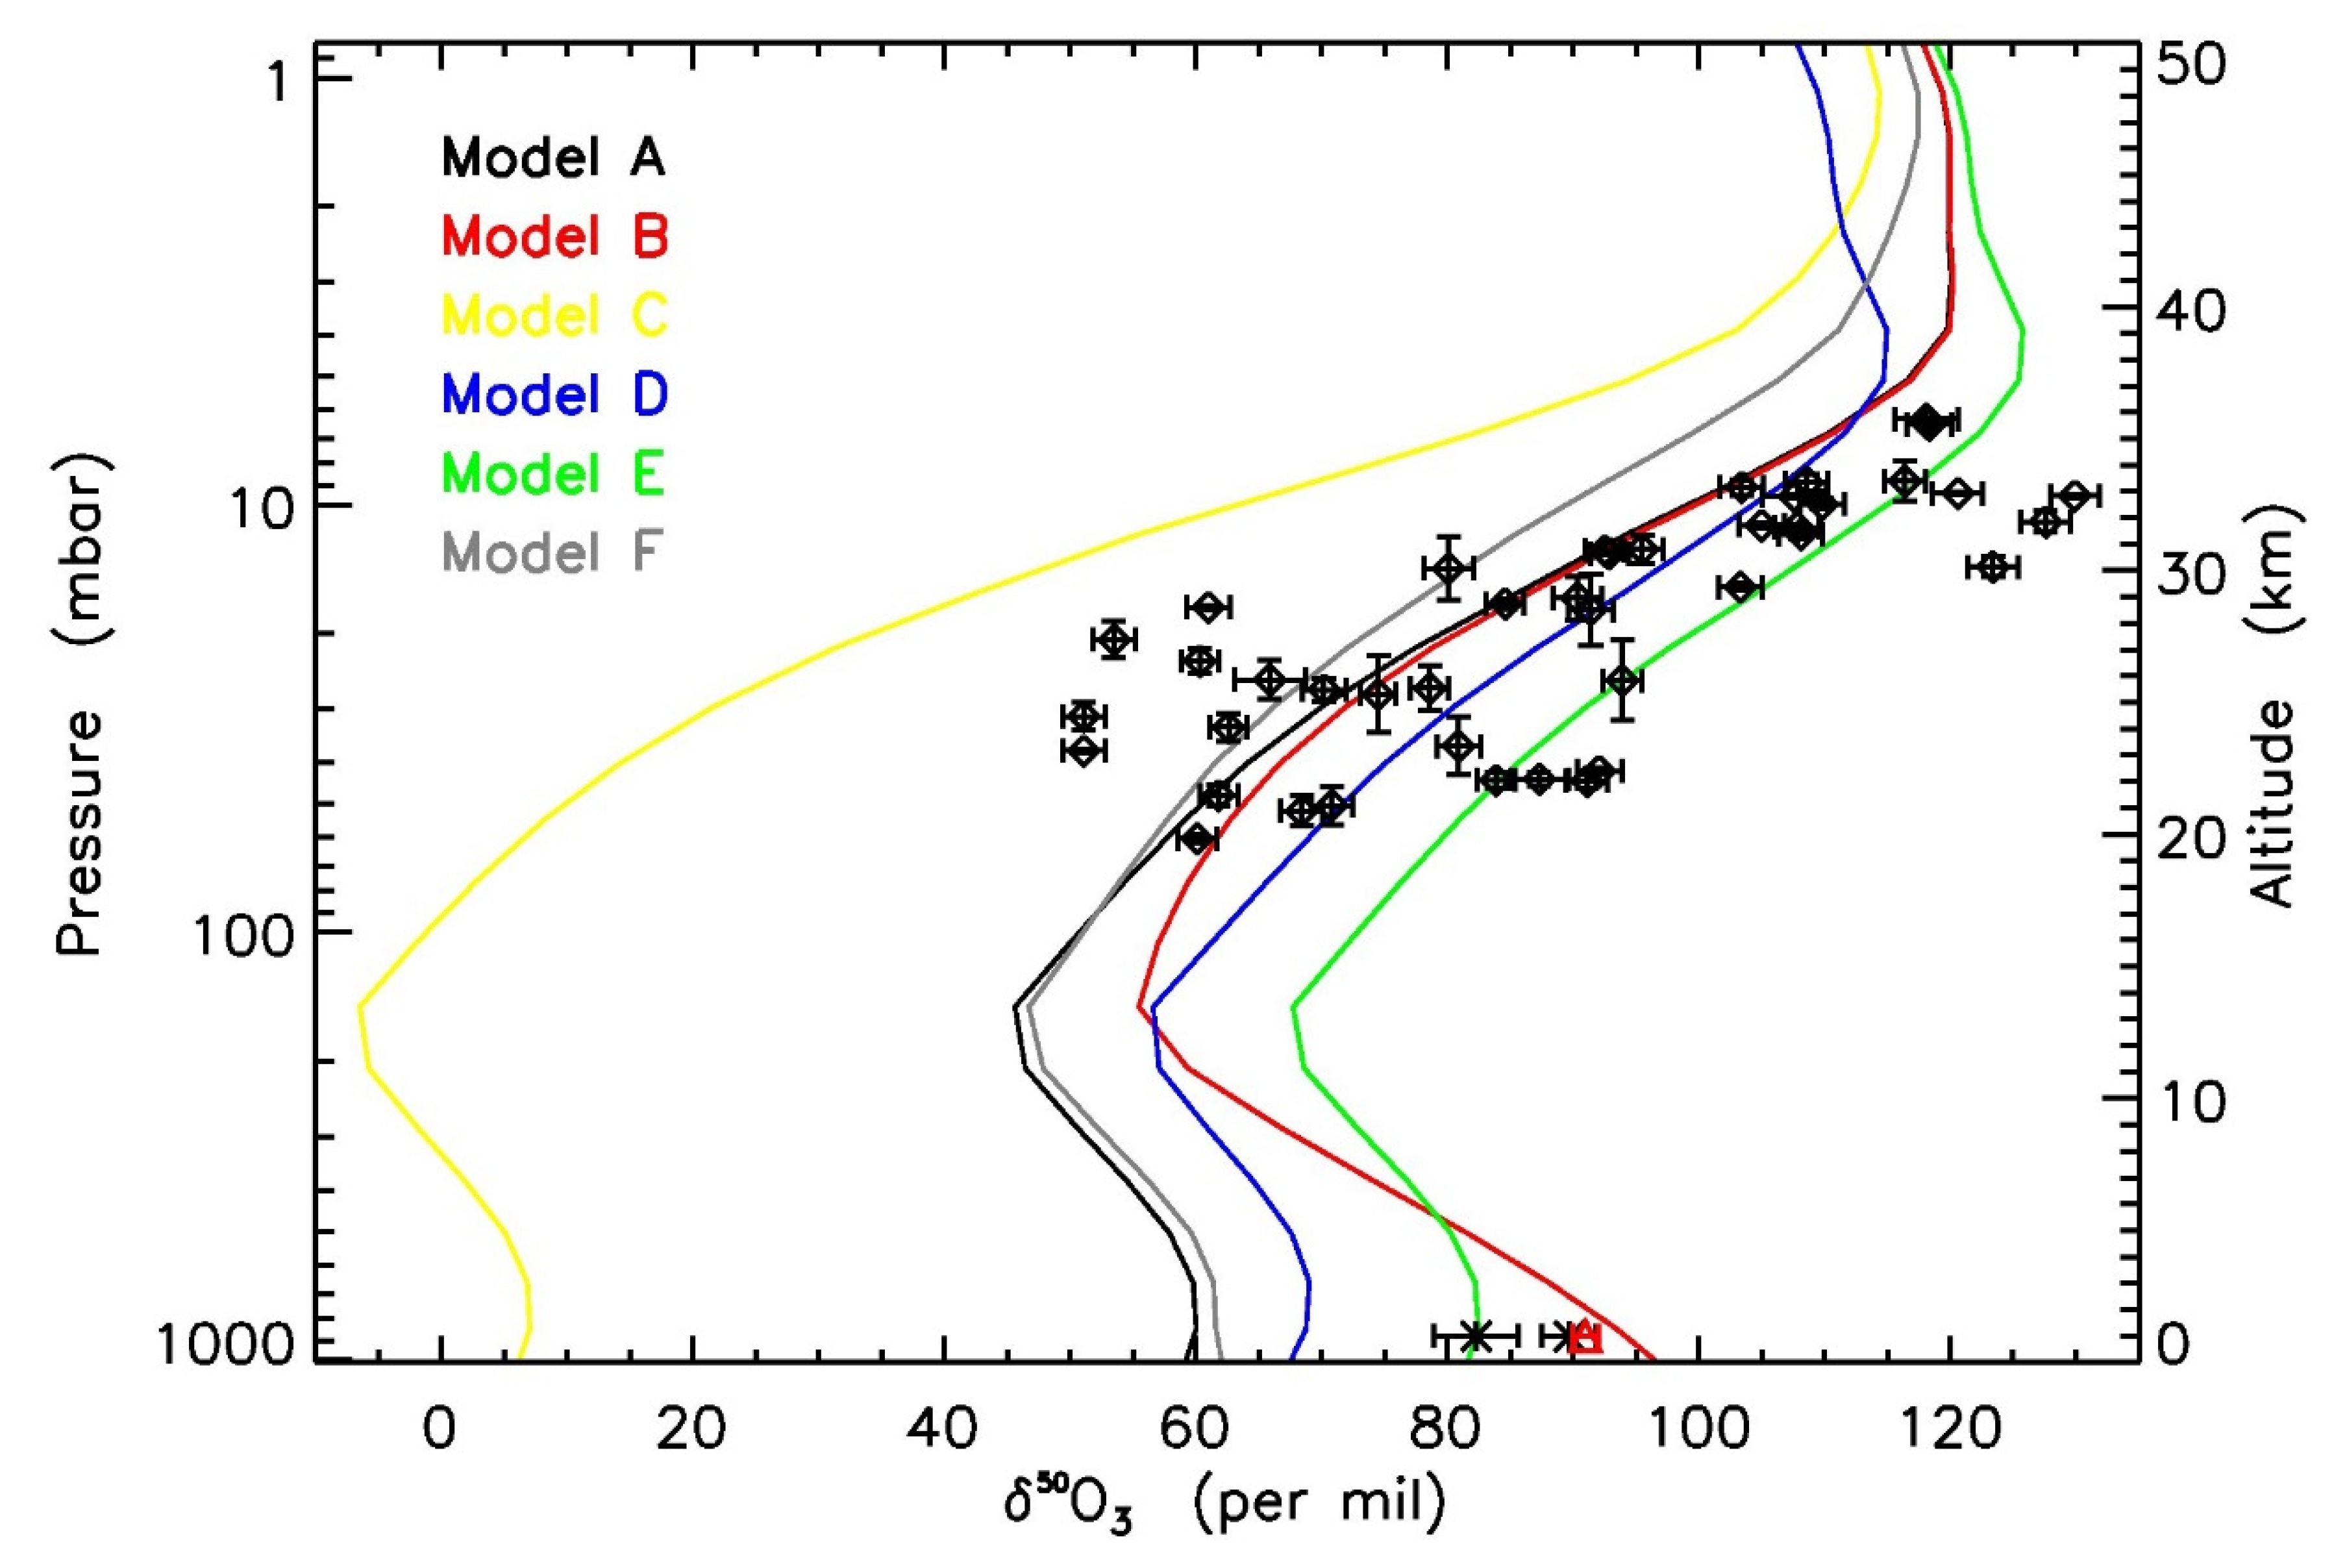
Figure 1. δ50O3 (referenced to atmospheric O2) calculated using the same model atmosphere profile as that in Liang et al. [5]. Pressure and temperature dependences in O3 isotopic fractionations are taken into account, and the isotopic fractionation for ozone photolysis in the Chappuis band is scaled from 18O18O18O (see text). See Table 1 for model differences. Diamonds are balloon-borne mass spectrometer measurements [3]. The asterisks [8] and triangle [2] are the near-surface measurements. The error bars in the atmospheric measurements are for 1-σ. The experimental data variations represent spatial and temporal differences at which the data were taken.
Atmosphere 12 01673 g001
Figure 2. Three-isotope plot of O3, where the variations caused by sampling in different seasons and localities are largely reduced. Diamonds are balloon-borne mass spectrometer measurements [3]. The error bars in the atmospheric measurements are for 1-σ. The 2-D model results, calculated by Models A and E, at the same altitudes and seasons as the atmospheric measurements, are shown by the solid circles.
Atmosphere 12 01673 g002
Figure 3. Values are from Table 2 for Sweden (horizontal number index 1 to 16), France (17 to 35), and Brazil (36 to 42). T(δ49O3) and T(δ50O3) are shown by the diamonds and triangles, respectively. The in situ measured Tin situ is represented by the asterisks.
Atmosphere 12 01673 g003
Figure 4. Calculated fractionations for 16O16O17O (667), 16O17O16O (676), 16O16O18O (668), and 16O18O16O (686). The solid and dashed are the fractionation factors used in Model A and Model C, respectively. See text for details. The laboratory determined fractionation for 18O18O18O (888; dotted curve) is taken from Anderson et al. [39], who measured at conditions of ~40 torr with 0.46 m pathlength and 2.3 nm bandwidth.
Atmosphere 12 01673 g004
Figure 5. Comparison of the model fractionations (Model A: solid circles; Model D: open circles) and laboratory measurements (diamonds, with 1-σ measurement errors overplotted; see Huang et al. [32]) in the Chappuis band.
Atmosphere 12 01673 g005
Table 1. List of processes considered in the photochemical models.
TemperaturePressurePhotolysisCloud
Model ANominalYModifiedN
Model BNominalNModifiedN
Model CNominalYScaledN
Model DReducedYZPEN
Model ENominalYZPEN
Model FNominalYModifiedY
Table 2. Model inferred and measured temperatures for the sites.
NumberDateHeightT(δ49O3)T(δ50O3)TclimTin situTNCEP
Sweden
110 May 199822.1218 ± 15214 ± 7218221.3222
210 May 199822198 ± 10220 ± 5218223.59222
310 May 199822.4209 ± 10222 ± 6218N/A222.1
410 May 199822.1208 ± 10208 ± 5218221.08222
53 May 199930.8203 ± 10203 ± 5229247230
63 May 199930.6199 ± 10204 ± 5229245.85229.8
73 May 199929198 ± 13206 ± 6226250.5226.5
83 May 199925.5199 ± 9192 ± 5221234.45220.7
93 December 200128.6185 ± 10179 ± 5201191.8205.8
103 December 200127.4177 ± 10169 ± 5201191.2205.7
113 December 200124.5165 ± 10166 ± 5201192.55206.3
123 December 200123.2161 ± 10167 ± 5202>194.7207
1328 November 200226.6172 ± 10179 ± 4198191.6192.4
1428 November 200224.1175 ± 8185 ± 4199196195
1528 November 200221.5180 ± 9184 ± 4204201.5199.7
1628 November 200219.8170 ± 8181 ± 5208205.3203.2
France
173 October 199828.7193 ± 10196 ± 5222229.15223.1
183 October 199825.3186 ± 9190 ± 4216224.15218.7
193 October 199821.1188 ± 10190 ± 5214220.15215.2
2011 October 199931.7207 ± 11219 ± 6223N/A225.4
2111 October 199931.6218 ± 11223 ± 6223N/A225.3
2211 October 199928.5203 ± 11209 ± 6221N/A219.9
2311 October 199923.4186 ± 10205 ± 5216N/A212.8
244 October 200033.4220 ± 11218 ± 5226232230.4
254 October 200033.1207 ± 11209 ± 5226232.63230
264 October 200030.1192 ± 13182 ± 6222226.73223.7
274 October 200025.9177 ± 7171 ± 9217218.25215.8
2811 May 200132.8224 ± 16218 ± 8231239.86238.7
2911 May 200132.5222 ± 12221 ± 6231239.55238
3011 May 200130.8207 ± 11203 ± 5229236.15233.5
3111 May 200125.5187 ± 11173 ± 5220221.5220.4
3225 April 200235.8231 ± 17231 ± 9233252.25242.8
3325 April 200235.5229 ± 12231 ± 6233251242.2
3425 April 200233.4220 ± 11229 ± 5233240.81237.2
3525 April 200231.4217 ± 11219 ± 5230234.89232.4
Brazil
3629–30 November 200429.4207 ± 11217 ± 5224228.4227.5
3729–30 November 200425.8209 ± 10215 ± 5216219220
3829–30 November 200420.9175 ± 11183 ± 5207202.7206.6
394 June 200532.9223 ± 13240 ± 6230>237232.4
404 June 200532.8230 ± 13256 ± 6230>237232.3
414 June 200531.9239 ± 13252 ± 6229239230.8
424 June 200530.1226 ± 13251 ± 6227232228.2
Note: Height and temperature are in units of km and Kelvin, respectively. T(δ49O3) and T(δ50O3) are the model inferred temperatures from the observed δ49O3 and δ50O3 [3]; the low-pressure limit is assumed. Tclim, Tin situ, and TNCEP are the climatological, in situ measured, and NCEP2 reanalysis daily temperatures, respectively. Zero-point-energy theory for estimating the ozone fractionation in the Chappuis band is applied.
Publisher’s Note: MDPI stays neutral with regard to jurisdictional claims in published maps and institutional affiliations.