
Economic Implications of Smallholders’ Collaborative Groupings on Household Income and Adaptability to Climate Change in Nigeria


1
Department of Agricultural Economics, Adekunle Ajasin University, Akungba Akoko PMD 001, Nigeria
2
Department of Agricultural & Resource Economics, Federal University of Technology, Akure PMB 704, Nigeria
*
Author to whom correspondence should be addressed.
Sustainability 2021, 13(24), 13668; https://doi.org/10.3390/su132413668
Submission received: 17 August 2021
/
Revised: 27 November 2021
/
Accepted: 5 December 2021
/
Published: 10 December 2021
(This article belongs to the Special Issue Challenges to Sustainable Development in Family Farms: Global and Local Context)
Abstract
:This study assessed the impact of smallholders’ collaborative groupings on farm household income and their decision to adapt management strategies to mitigate the effects of climate change within their farming areas. A sample of 225 households’ farms from the participating 15 LGAs in Ondo State were randomly selected. However, only 200 questionnaires were properly filled and returned. The study deployed both descriptive and inferential statistics (t-test and regression models) to achieve its objectives. The study found that only 20% of the households have strategies to ensure a smooth succession of the management in the family farm. The results of the probit regression analysis showed that the membership of collaborative groupings significantly and positively influenced the per capita household farm income and households’ decision to adapt management strategies to mitigate the effects of climate change. In addition, findings from the study also empirically validated that farmers who adapted to the climate earned a higher farm income than non-adapters. On the strength of these findings, the study recommends that more farmers should be encouraged to form collaborative groupings where they can also share in the numerous benefits of being in such a network, including the access to more information on adaptation to climate change.
1. Introduction
Studies on the influence of collaborative groupings on farming outcomes are increasingly gaining traction in the literature. Small-scale agriculture is the occupation of the majority of those living in the rural communities in Nigeria. There is evidence that more than 90 percent of the food crops produced in Nigeria are from the farms of the smallholder farmers [1,2]. Smallholder farmers are those whose farm operations are characterized by subsistence agricultural production on a farm land size between 0.1 and 4.99 hectares [small-scale] [3]. By international standards, however, the farm land size is broader, and thus a smallholder farmer is anyone who practices agriculture on less than 10 hectares of land [4]. In Nigeria and other countries in sub-Saharan Africa, smallholder farmers have very limited access to modern and improved technologies. Besides, their general circumstances do not always allow for tangible investments in capital, inputs and labour [2]. At the individual level, they can hardly influence both the input and the output market, but collaboratively they can jointly own farm machines, pool production resources together and enjoy other benefits as a result of a scale economy. In Nigeria, agriculture is mainly rain-fed, and most often smallholder farmers are not well organised to take economic advantage of the available production resources. Hence, their farm production is characterized by low productivity [5].
Nigeria has a potential comparative advantage in the production of a variety of fresh and processed high-value crops, especially vegetables during the dry season and livestock (meat and milk) and fisheries products throughout the year [5,6]. This is because the country is endowed with underground and surface water reserves, rich pastures and favourable agro-ecological conditions in the country’s low-lying plains, with an alluvial deposit called Fadama. However, developing appropriate strategies to economically explore these resources for the benefit of mankind remains a herculean challenge for the government for various reasons. The Community-Driven Development (CDD) approach is one of the key development strategies used by both government and development assistance programmes [7,8,9,10]. Its popularity has been propelled by the sufficiency of its strategies to drive the sustainability of development projects and programmes. Such projects are responsive to local priorities, and the strategies are projected to empower local communities to manage and govern their own development programmes. According to [10,11], these development projects and programmes are targeted towards alleviating the economic challenges of the poor and the vulnerable groups. The evidence of the impact of participatory projects on income-generating activities and poverty is mixed [9].
However, empirical evidence is also mixed concerning the effectiveness of targeting using CDD’s approach in Nigeria. In heterogeneous communities with a high social inequality, CDD’s performance in targeting the poor has been worse than that of externally managed programmes [12]. However, in egalitarian communities with open and transparent systems of decision making, targeting was better with CDD than with externally managed projects and programmes. The latter birthed the National Fadama Development Project (NFDP), a collaboration between Nigerian governments and the World Bank with a view to fully realising the potential of Fadama resources in Nigeria [13]. Although the chunk of the project cost was borne by the World Bank, it is not without counterpart funding from the Federal and benefiting state governments. Therefore, NFDP, an example of a CDD approach, provided the platform upon which to access the rural poor and assess the impact of collaborative groupings in their income generation, climate adaptability and acquisition of productive assets.
Besides the conventional developmental challenges bedevilling agriculture in Nigeria and other distressed economies, the recent decline in agricultural productivity has been linked to the vulnerability of farmers and farming activities to unfavourable climate changes and weather variability [14,15]. Across the sub-region, this phenomenon is generally characterised by a fluctuation of the period and duration of precipitation, a change in annual rainfall, an increasingly hot climate, drought, soil degradation, unexpected flooding, etc. [14,15]. In Nigeria, adverse climate changes in the form of variable rainfall, increased drought, intense heat in the northern arid region and increased erosion in the southern rainforest parts of the country are reported to persist [16,17]. The impact of climate change in the distressed economies is further accentuated by endemic poverty, ecosystem degradation and limited access to capital, markets, infrastructure and technology. It has further restricted the capacity to acquire the necessary farm inputs, such as improved crop varieties, fertilizers, irrigation and other production inputs, particularly the farmers’ capacity to appropriately adapt to climate change. Some of the frequently deployed adaptation to climate change includes, but is not limited to, sustainable land management (SLM) practices [18,19,20] as well as a variation in sowing time, the use of improved crop varieties, such as stress-tolerant varieties, and shifting to new crops [21].
In view of the challenges associated with individual farmers’ capacity to access adequate production resources and/or acquire the necessary knowledge about climate change adaptation, a significant number of researchers have empirically found the relevance of social capital in the development and the rate of diffusion of innovation to rural farmers [22,23,24]. Social capital takes the form of trust, norms and networks, and it is in these contexts that the role of collaborative groupings can be examined with regard to the adoption of innovations [25]). Collaborative groupings have the capacity to provide real economic benefits to farmers’ families by increasing the stability of the farming sector, strengthening the farmers’ position in the agri-food chain and improving members’ access to credit and production assets [26]. In addition to this, they facilitate the relevant training, including how to improve members’ adaptation to climate change, with the ultimate objective of improving members’ welfare. In order to benefit from this collaboration, members’ commitments are important. Evidence abound in the literature that being a committed and active member of a collaborative group or belonging to a social capital network increases the uptake of technological innovations [27]. Consequently, in line with the basic theory of production, improved technological innovations enhance farmers’ productivity [28] which leads to increased farm income [29]. Similarly, collaborative groupings facilitate members’ access to production assets, which promotes a cost-effective production and competitive prices of farm output [26,30].
1.1. Problem Statement
Smallholders in the Sub-Saharan Africa operate at a subsistence level, and hence they are faced with peculiar challenges such as the lack of access to productive assets and low-income and low-quality lives [5,31]. The increasing negative effects of climate change on farming activities have also raised serious concerns [29]. These challenges have largely snowballed into a serious poverty trap affecting the income-generating activities of smallholders in Africa and, particularly, Nigeria [6,29,32]. They can barely have sufficient resources to acquire enough farm input to prepare for the new farming season, and where they struggle to do that, the adaptation to climate change becomes a major challenge [29]. Therefore, the lack of access to input and understanding factors influencing income and the adaptability to climate change require immediate policy attention, though successive governments in Nigeria have developed programmes and projects to address these challenges impeding the economic expansion of smallholders beyond the subsistence level. However, the inadequate information on the dynamics of their economic activities within the context of the economy and emerging climate changes with which they operate have made various efforts to address these challenges, but they have failed to yield the desirable results.
Flood, erratic rainfall, high temperature and other forms of weather variability arising as a result of climate change have had serious negative effect on agriculture, particularly on farming in Nigeria. These have resulted into a loss of farm output, low productivity, a low production output and, consequently, a low farm income [29]. Farmers obviously need to appropriate information to address the challenges that are connected to climate change, with a view to improving their farm income. Since one of the benefits of belonging to groups of economic interests is information-sharing and education, there is a need to understand the effect of collaborative groupings on farmers’ adaptability to climate change.
This study therefore examines the impact of smallholders’ collaborative groupings on their household income and their choice of farm-adaptable management strategies to climate change within their farm areas. The study specifically assesses the performance of the smallholder farmers in Fadama III project in Ondo State.
However, some questions have arisen concerning the welfare of the farmers as well as factors that influence their decision to adapt appropriate strategies to mitigate the effect of climate change in their farm areas. Therefore, this study attempts to provide answers to the following questions: how well do collaborative groupings influenced by economic interests develop mechanisms to improve household farm income? How effectively can these collaborative groups influence the adaptability of members’ economic activities to climate change in the study area?
1.2. Objectives of the Study
- i.
- To determine whether participants’ membership of collaborative groupings like cooperative associations, religious groups and mutual support groups have a significant influence on per capital household farm income.
- ii.
- To determine whether participants’ membership of collaborative groupings like cooperative associations, religious groups and mutual support groups have a significant influence on participants’ decisions to adapt to climate change.
- iii.
- To determine whether participants’ membership of collaborative groupings like cooperative associations, religious groups and mutual support groups have a significant influence on the use of Sustainable Land Management (SLM) practices as an adaptation to climate change.
1.3. Literature
The literature review is in two parts: one, to review the past studies on the significance and contributions of collaborative groupings to household (family) farm income; and two, the empirical evidence of the cost–effectiveness of adapting or using SLM for climate change adaptation. That is, to empirically find out whether there is a significant difference between the production resources, on the one hand, and income, on the other hand, of the adopters and non-adopters of climate change adaptation strategies.
A number of collaborative groupings have been identified in the literature, including cooperative societies, religious or faith-based associations and mutual support groups. Ref. [33] summarised cooperative societies as enterprises jointly owned and managed by members. They engage in the production or sale of goods (input and output) and/or services for the common benefit of its members. Cooperative societies can also be defined as an autonomous group of individuals pooling their resources together in order to jointly elevate themselves economically, socially or culturally. Cooperative societies come in many types and kinds. In a simple description, some cooperative societies are formed by a set of people who intend to lift each other up financially or otherwise, so they pool their resources, and each member benefits at intervals. Some of these cooperatives engage in businesses, facilitating the relevant training to farm businesses, and their members share the returns.
According to the Food Faith and Farming Network, faith-based or religious farming groups give voice to the sacred connections between the land and the people. Therefore, the groups foster solid and transparent relationships among members, with a view to improving farm productivity as well as an enhanced farm income among members. They do this by helping members to carry out their farming and other agribusiness activities with the mindset of spirituality and economic justice through healthy food and sustainable farming practices. On behalf of the members, these groups collaborate with individuals, organizations and faith communities that share the same vision to help their members overcome their farm-related challenges.
According to the Social Solidarity Economy resource website, mutual support groups are voluntary associations, with each group having a maximum of twenty people who live close to one another and have shared interests. Although they are democratically constituted, no political affiliation is tolerated. A mutual support group meets regularly to constitute their savings and discuss any problems they may have. These shared savings provide the members of the group with access to loans, with each member having their turn. In addition, they help in the education and diffusion of innovation to their members. A key factor of the success of these groups is their egalitarian nature.
A family (household) farm is generally understood to be a farm owned and/or operated by a family (household); it is sometimes considered to be an estate passed down by inheritance or owned through the collaborative efforts of the family/household members. Quite a number of studies have been carried out to investigate the influence of collaborating groupings in promoting family/household farm, but similar studies concerning Nigerian farmers are just beginning to gain traction. However, Refs. [34,35,36,37] and others present well-documented evidence.
Ref. [38] examined the effect of the membership of group-farming cooperatives on the farmers’ food production and poverty status in Nigeria. The study employed a probit regression model estimate to analyse the decision to join group-farming cooperatives and the effect of membership of group-farming cooperatives on the poverty status. Similarly, an ordinary least square was employed to examine the effect of the membership of group-farming cooperatives on food production and the productivity of farmers. The study found that group-farming cooperatives have a positive and statistically significant effect on food production at a 5% level of significance; and that the prevalence of poverty was higher among non-members of group-farming cooperatives. The study recommends more awareness among farming households, which can motivate more farmers to partake in this kind of organization. However, beyond the farmers’ productivity and production output, their household income tells more about their welfare and their ability to acquire or access more production resources. The inability of the study to look at the effect of collaboration on household income remains a gap in the literature.
Ref. [35] measured the effects of cooperatives on agricultural development. Employment generation and the welfare conditions of farmers were taken as proxies for agricultural development. The study found that farmers’ membership of cooperatives influenced agricultural development. In another study, ref. [39] investigated the effects of group membership on the farm income of smallholder potato producers in Middle Guinea. A probit model was used as a selection equation to identify factors that influence group membership decisions by smallholder potato farmers. The result revealed a positive and significant effect of group membership on the farm income of potato farmers.
Ref. [40] explored the effect of agricultural cooperative membership on farmers’ income and poverty in Delta State, Nigeria. Data on the membership of agricultural cooperatives, farm income and poverty status were obtained from a total of randomly selected 244 respondents comprising 122 farmers’ cooperators and 122 non-cooperators, utilizing an interview schedule. The data were analysed using both descriptive and inferential statistics. According to the study, multipurpose cooperatives attracted the highest number of members. The income of the farmers who were involved in cooperatives was found to be significantly higher than that of non-cooperators. Therefore, the study concludes that the membership of agricultural cooperatives will help improve farmers’ income and well-being.
From the debate in the literature, there seem to be some gaps in the areas of effects of other collaborative groupings, like mutual and religious groups on household farm income and even farmers’ decision to adapt to climate change. In view of the significant effects of climate change on the farming system in Nigeria, there is a compelling need to interrogate the effect of collaborative groupings on farmers’ adaptability to climate change.
The study also reviewed the literature with regard to the devastating effect of climate change and weather variability on smallholder farmers in developing countries, particularly those in sub-Saharan Africa [SSA], and the findings raised some concern [28,41]. In view of this challenge, experts have advocated various climate change adaptation strategies to mitigate these effects and to improve farmers’ livelihood and food security [14,42,43,44]. In some studies, even a slight increase in temperatures and/or changes in rainfall patterns have negative impacts in terms of crop failure and yield losses for major cereal crops [45], although despite the adverse conditions posed by climate change, some studies have also identified beneficial effects for some crops if suitable adaptation measures are implemented [46]. Interestingly, the literature is replete with evidence that an increasing number of farmers in SSA have continued to embrace various adaptation strategies to mitigate the negative effects of climate change [47,48,49,50]. One of those strategies is Sustainable Land Management (SLM). Sustainable land management was defined by the UN 1992 Rio Earth Summit as “the use of land resources, including soils, water, animals and plants, for the production of goods to meet changing human needs, while simultaneously ensuring the long-term productive potential of these resources and the maintenance of their environmental functions.” According to the Food and Agricultural Organization (FAO), some of the SLM practices include: preventing land conversion and protecting vulnerable lands; preventing and mitigating land degradation and restoring degraded soils; controlling soil erosion; improving soil–water storage; managing soil organic matter for soil carbon sequestration; managing and enhancing soil fertility; promoting integrated soil–crop–water management and integrated agroforestry and agrosilvopastoral systems; rehabilitating and sustainably managing dryland environments (e.g., managing grazing and livestock; rainwater harvesting; sand-dune reclamation; oasis management; drought management; and precision agriculture); and improving crop–water productivity and managing soil salinity in irrigated dryland agriculture.
However, whether or not this has translated into an improved farm income, welfare and livelihood remains a subject of debate. To summarise this debate, ref. [14] concluded that the outcome of various climate change adaptation measures adopted by farmers are context- and location-dependent. In Pakistan, ref. [42] found that farmers who adopted appropriate strategies against climate change are more food-secure than those who did not.
Ref. [41] analysed time-series climate data to see how crop yield responds to climate variability in Ethiopia. The study revealed that that farmers who adopted adaptation strategies would have gained a lower yield if they had not adopted them; and those who did not adopt a strategy would have gained a higher yield than if they had. In a similar study, ref. [28] found that a strategic implementation of adaptive measures significantly increased the average output of adapters by 49%. Evidence from the study indicate that the access to credits, other incomes, farmers’ age, extension services and farmer groupings form key factors that significantly affects farmers’ decision to adapt to climate change. Ref. [51] found that farmers’ decision to adapt to climate change had positive and significant effects on farm incomes and household dietary diversity scores. However, there are concerns that a good number of farmers across countries in SSA are struggling to adapt to climate change due to perceptions and socio-economic factors [28]. In Nigeria, ref. [52] linked the declining agricultural productivity to climate vulnerability.
2. Materials and Methods
This study was conducted in Ondo state, covering 15 Local Government Areas (LGAs) out of the 18 LGAs. Ondo State has a surface area of approximately 15,317 km2, which represents only 1.66 percent of the total surface area of Nigeria, which is 923,768 km2. Participants in Fadama III in Ondo State are known to share similar characteristics with participants across Nigeria [53]. This informed the choice of participants of Fadama III in Ondo State. Agriculture remains a major source of livelihood for the majority of people living in the rural communities in the state. Although most farmers operate largely at a subsistence level, they committed to sustaining their livelihood within the context of the available means and opportunities. Most rural and farming communities in Ondo State are more egalitarian than heterogeneous. The state has a very rich history in the production of cocoa and oil palms as well as many cash and arable crops. With the longest coastline bedding the state in the south, fishing is a popular economic activity to those in the south. Although the presence of crude oil accounts for the reason the state is considered as one of the oil producing states in Nigeria, historically, agricultural activities had a significant influence in shaping the state’s economy. That is, the majority of the labour force are engaged in the production and trading of agricultural commodities as means of livelihood.
In this study, the primary data were specifically sourced. The beneficiaries of Fadama III projects were the targets for this study, providing the sampling frame for the study. The sample was drawn from participants of Fadama III projects under these three treatment groups: (a) Members of cooperative societies exclusively (cooperative, according to [54] is defined as an autonomous association of persons united voluntarily to meet their common economic, social and cultural needs and aspirations through a jointly-owned and democratically-controlled enterprise), (b) Members of a mutual support group exclusively (a mutual support group is a group in which the participants support each other in promoting economic interests and recovering or maintaining the recovery from unfavourable market dynamics and declining production output), and (c) Members of a religious group exclusively (a religious group is one formed on the basis of sharing the same faith. It is a faith-based collaborative group driven by economic interests). These three sub-groups were purposively selected because the members cut across the participating 15 LGAs. From each of the sub-groups, 5 participants were randomly selected per treatment group per LGA. For this particular study, 225 family (households) farms were targeted. Therefore, 15 participants’ smallholder Fadama III from each of the participating 15 LGAs in Ondo State were randomly selected from the list of participants per LGA. However, only 200 questionnaires were properly filled by enumerators who were employed to collect the required data from the targeted households. The survey was carried out in December 2020, in total compliance with COVID-19 protocols.
2.1. Data Analysis
For this study, different analytical techniques and models were adopted to analyse the data. They include descriptive statistics using frequency tables and percentages and a graphical presentation. Other analytical techniques include pair-wise t-test statistics and a regression analysis. A semi-log functional form was deployed to analyse the effects of collaborative groupings and socio-demographic variables on household farm income, and a probit model to determine the predictors of the choice of adaptation strategy.
The semi-log form of the regression model, as given by [55], is implicitly stated below:
Y is the per capita income; is each of the selected predictors (age of household head, number of years spent in school, membership of a mutual support group, membership of a religious group, number of adult males, number of adult females, male- headed household, value of production asset, total livestock, size of farmland under rain-fed, distance to the nearest market, distance to all weather roads, access to an extension service); is the slope for each of the predictors, and is the error term.
For the Tobit Model, the study is guided by the works of [56]
where .
is a latent variable, representing the choice of adaptation to climate change/adaptation of sustainable soil and land management practices to mitigate against climate change. Therefore,
And for Pr(, we obtain
Setting makes the distribution on a standard normal density.
Stata statistical software was used to estimate from the probit model:
where is each of the selected predictors (number of years spent in school, membership of a cooperative group, membership of a mutual support group, membership of a religious group, number of adult males, number of adult females, male-headed household, value of the production assets, total livestock, size of farmland under rain-fed, distance to the nearest market, distance to all weather roads, access to an extension service); is the slope for each of the predictors; and is the error term.
2.2. Hypotheses
In view of the socio-economic dimension of the adaptation to climate change, experts have advocated sustainable land management practices in order to sustain the livelihood of smallholder farmers [57]. However, two lines of argument have arisen from the literature: one of these is to find out if farmers adapting to climate change are adopting the most cost-effective strategy. If so, they should experience an improved productivity and a better livelihood than those who are not adapting to climate change at all [28,41,42]. In line with the argument of [14], there is a need to contextualize the effects of the adaptability to climate change using the socio-economic variables farmers are most responsive to. [51] also found that adapting to climate change significantly enhances farmers’ farm income. The assumption is that farmers who adapted to climate change will have a higher per capita farm income than non-adapters. This assumption is hypothesized thus:
Hypothesis 1 (H1).
There is no significant difference between the per capita income of those who are adapting to climate change (adapters) and those who are not (non-adapters).
Empirical evidence has suggested that Sustainable Land Management is one of the most cost-effective approach for farmers to adapt to climate change [18,19,20]. This submission has also generated some debate in view of the increasing advocacy of other adaptation strategies, including a variation in sowing time, the use of improved crop variety (e.g., stress-tolerant variety) and shifting to new crops [21]. This study attempts to empirically verify if using SLM confers economic advantages over using other climate change adaptation approach. This assumption is hypothesized thus:
Hypothesis 2 (H2).
There is no significant difference between the per capita income of those who are using an SLM strategy to adapt to climate change and those who are not.
3. Results
The results cover the socio-economic and demographic variables of the households, production activities, income indicators. Other relevant tables are presented in the Appendix A, Appendix B and Appendix C.
3.1. Distribution of Respondents by Their Demographic Characteristics
Table 1 shows the distribution of respondents by their demographic characteristics. The age distribution of the household heads observed across the study area showed that the majority of the sampled household heads were above 60 years of age, constituting 36% of the entire sample. Respondents whose age were within the 46–59 years’ bracket were also of considerably numerous, representing 29% of the sample. The young adults, with 33–45 years, were 19% of the sampled respondents, whereas those in the youth category were just 17% of the sample. This implies that a considerable proportion of the respondents across the LGAs were within the economically viable age bracket, 19–59 years. The findings align with those of [49,58,59]. It is an evidence that the FADAMA programmes included a significant proportion of those within the active service age bracket in their projects. About 17% of the participants were young (19–32 years). This may be attributed to the recent policies initiated in the last decade by the state government, geared towards encouraging more youths to embrace agriculture with a view to solving the intimidating challenges arising from youth unemployment. This is expected to provide opportunities for the youth to contribute to the economic growth and development of the economy.
The results of the analysis of gender distribution, as shown in Table 1, revealed that male respondents represented 51% of the entire sample. The study found out that in the 200 households surveyed, there were about 1018 other members of the households. The distribution of other household members and their relationship with their family heads in the sampled households showed that the children accounted for 72%, whereas the wives made up 9% of the other members of households. There was a very low proportion of respondents who were siblings (5%) to the family heads. Similarly, there were other people within the households but not related to the household heads by blood, although it is customary for non-family members and other categories of family members to live together as a single entity. This category of other members of the household not related by blood constituted 6% of the surveyed households. Therefore, the distribution, as contained in Table 1, suggests that the average household size in the study area is 6 persons. This is relatively less than what was obtained by [59,60]. Ref. [59] found the average household size for rural farmers to be 9 in southeast Nigeria, whereas [60,61] found the average household size to be 6 and 7, respectively. The category of rural farmers captured and the type of farming system operated in these studies could have accounted for the different average value for household size. In this study, the labour-intensive nature of farming in the study area requires that more people be housed under the same roof, with a view to helping in the farm operations.
On the distribution of respondents based on the size of the farmland cultivated, Table 1 shows that 27% of the respondents cultivated less than 2 hectares and 2.01–4.00 hectares apiece. In the same vein, 20% of respondents cultivated 4.01–6.00 hectares of farmland, 18% cultivated about 6.01–8.00 hectares and about 9% cultivated more than 8 hectares of farmland. According to this distribution, the average size of farmland cultivated is 2.56 hectares, with a standard deviation (SD) of 2.43.
As shown on Table 1, 38% and 12% of the farmers in the sample established their farms on land they purchased out-rightly and on inherited farms accordingly. However, about 28% and 23% of the farmers got their farmland established on inherited and leased lands with documentary evidence as conditioned to be enlisted in Fadama III projects. These findings suggest that farmers have begun to acquire legal documents on their land to ward off legal encumbrances and position their farms for financial supports.
The distribution of respondents on the basis of the succession strategy put in place by the household showed that 20% of the households had strategies to ensure a smooth succession of the management in the family farm upon the demise of the head of the household or the lack of capacity to provide leadership (Table 1). Regrettably, about 51% of the respondents said no strategy or plan had been put in place to ensure a smooth succession on the management of the family farm (Table 1). According to the Table, about 29% of the respondents were undecided in their response.
Table A1 reveals the results of the analysis of the primary economic activities engaged in by all members of the households as captured during the survey. The results revealed that about 36% of the members of the households were students in school, whereas about 27% were into a crop enterprise, and 9% said they were into the agricultural trading business. The study revealed that out of the entire 1218 households, only 41% were directly involved in agricultural activities. Other economic activities engaged in by the members of the surveyed households are contained in Table A1.
The distribution of the highest level of education attained by the respondents across the study area, as presented in Table A2, shows that about 28% and 17% of them had a complete secondary education and a post-secondary school education, respectively. About 68% of the entire household members had some form of secondary education and above. According to [59], farmers with a secondary education enhance their chances of accessing and processing information that can enhance their choice of farm-adaptable management strategies for climate change within their farm areas, with the ultimate goal of improving their family agribusiness.
The distribution of the productive assets (Table A3 owned by the respondents across the local government areas covered in the study was an indication of the economic capacity of the respondents to participate in several income-generating activities. It was shown that 34% of the respondents owned cutlasses/hoes, which were the basic implements/tools for farming activities. Table A3 shows that a total of 9% respondents owned motorcycle and knapsack sprayers apiece, whereas 7% owned a wheelbarrow. Similarly, about 3% owned a bicycle, indicating the importance of these items as production assets to many households in the study area.
3.2. Distribution of Households by Membership of Association
The distribution of Fadama III beneficiaries by their membership of association is shown in Figure 1. The level of commitment of the members to their association’s obligations was assessed using a scale of 1 to 10. Those who rated themselves above 5 were considered to be committed, whereas those who scored themselves below 5 were considered to be non-committed members. On the basis of this scale, the study found that 84% of the cooperative members were committed to their association’s obligations. In the same vein, 71% and 75% of the members of a religious group and a mutual support group were strongly committed to their association’s membership obligations. The level of commitment of the members to their socio-economic association can influence the level of benefits members can access from the association.
3.3. Distribution of Households’ Farm Income
Figure 2 shows the distribution of the respondents by their annual income. The Figure reveals that about 34% of the households generate less than N150,000 (USD365) annually. The average farming household size of 6 in Nigeria [23] implies a per capita income of N25,000 (USD60). If this is what about 34% of farmers in Ondo State earn, then this may not be considered a sufficient incentive to sustain them in the business. Similarly, about 20% of the households were making about N150,001 to N300,000 (USD365.1–USD730) annually. That is about USD60 to USD122 per capita for a household size of 6. The study also revealed that about 6% of the households were making N750,000–N900,000 (USD1824.82–USD2189.78) annually. This could give about USD304.14–USD364.96 per capita for an average household size of 6. Only 4% of the households were making above N900,000 (USD2189.78) annually, which implies more than USD364.96 per capita. The study revealed that about 84% of the households were making less than N600,001 (USD1459.85) annually, which implies USD243.31 per capita per annum. The average income is between the income bracket, N300,001–N450,000 (SD = 302,473.88). When the income distribution is compared to a poverty threshold of USD381.75/person per year (National Bureau of Statistics [62]), all the households in the study area who earn below N900,000 are below the poverty threshold. This further confirmed the huge proportion of farmers who are living below the poverty threshold.
3.4. Comparing Income across All Treatments Based on Association
The paired t-test of household income distribution based on association is presented in Table 2. Given the 5% decision threshold, there is a significant difference in the household income level of those who belonged to a mutual support group (annual average = N388,782.42) and the households that did not belong to one (annual average = N338,417.1)
This is an indication that it is beneficial to hold a membership of a mutual support group. There is a significant difference in the income of those who are members of a religious (faith-based) group (annual average = N411,323.77) and those who are not members of a faith-based mutual group (annual average = N359,387.94). The analysis showed that there is no significant difference in the level of household income between households who belong to cooperative groups (annual average = N591,273.39) and those that are not members (annual average = N556,264.49).
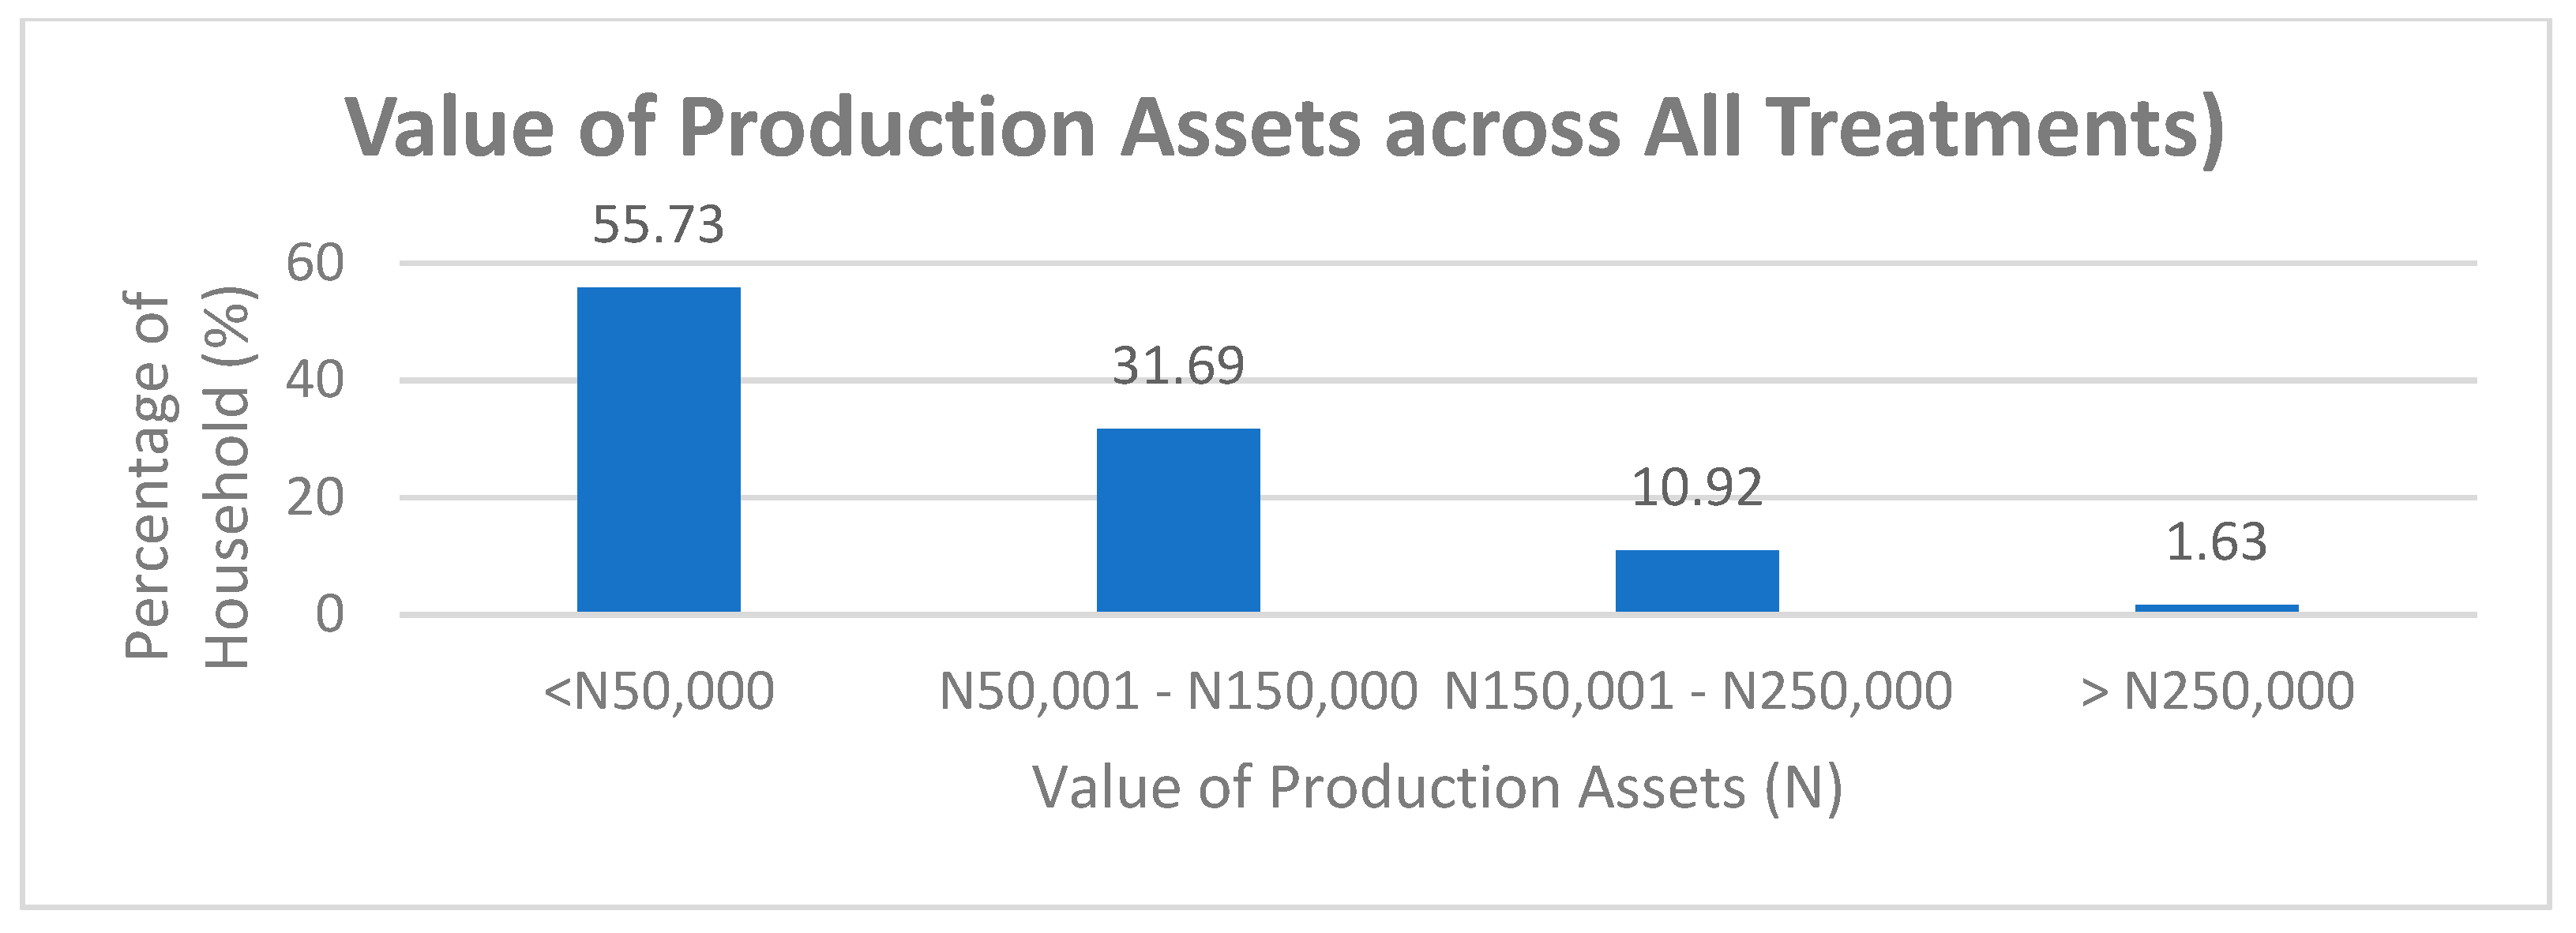
3.5. Distribution of the Value of the Production Assets
Figure 3 shows the distribution of respondents by the value of their production assets. The distribution of the household production assets was analysed across the treatment groups to determine the variations on the productive capacity of every household across the treatment groups. Figure 3 shows that 56% of the respondents reported the value of their production asset as less than N50,000, whereas 32% of the households reported the value of their production assets to be between N50,000 and N150,000. This distribution indicates that about 87% of the households have a very low production. Where there is no adequate working tool, production and productivity may be affected due to the inability to perform farm operations more conveniently or promptly.
3.6. Production Assets and Membership of Association
Table 3 shows the paired t-test to compare the value of production assets based on association. The value of the production assets of family farms (households) was obtained across all treatment groups based on the membership of a cooperative society, a mutual supports group and a religious group. Table 3 reveals that there is a significant difference (a 10% statistical level of significance) in the value of the production assets between those who belong to a mutual support group (annual average = N150,490.09) and those who did not belong to a mutual support group (annual average = N109,344.52). Table 3 reveals that there is a significant difference in the value of the production assets between those who belong to cooperative societies (annual average = N133,622.34) and those who do not (annual average = N103,983.26). The evidence from these findings implies that the membership of the groups would result in a significant improvement in the production capacity of farmers who belong to a collaborative group compared to those who do not belong to a collaborative group. However, there is no significant difference between farmers who belong to a religion-based collaborative group (annual average = N78,423.66) and those who do not (annual average = N81,125.35).
Determinants of Family (Household) Farm Income
Table 4 presents the regression output of the determinants of the per capita income across the treatment groups. To determine the socio-economic factors which influence the per capita income, a step-wise approach was deployed to run a semi-log functional form of regression analysis to determine the factors that have significant influence on the variations in the household income. A Ramsey’s reset was conducted as a diagnostic test to determine the appropriate functional forms for the parameters to be included in the estimated model.
The interpretation of the results followed the documented pattern of interpreting the semi-log functional form of the regression model in the literature [55]. Therefore, the slope coefficient of 0.0015 for the age of the household head is interpreted, as the log of income has been increasing at the rate of 0.0015 per year, on average. In other words, the per capita income has been increasing at the rate of 0.2% per year as a result of a unit increase in age when other variables are controlled for. In this context, the more the household heads advance in age, the more experienced they become in their agribusiness.
Table 4 shows the effects of a unit increase in each of the other variables, such as: number of years spent in school, value of the production assets (N), membership of a mutual support group, membership of a religious group, male-headed household, number of female adults, number of male adults, total livestock units, size of farmland under rain-fed owned by the household (ha), access to extension services, distance to the nearest market(km) and access to all weathered roads on per capita income are given in column 3. From the table it is evident that all these factors significantly influenced the household farm income of Fadama III participants.
The robust regression differs from the ordinary least square (OLS) results because it is not affected by the influence of outliers which might be present in the datasets or affected by zero responses. The result of the robust regression showed that many of the predictors were positive, except for number of male adults, the distance to the nearest market and the distance to all weathered roads, which carried negative effects.
3.7. Adaptation to Climate Change across Agroecological Zones (AEZ)
Table 5 shows the results of the compared adaptation to climate change across agro-ecological zones in the state. Ondo State belongs to the tropical humid forest part of agro-ecological zones of Nigeria. A comparative analysis to determine the difference in the level of adaptations among households that adopt specific sustainable soil and land management (SLM) practices was carried out.
It was observed from the result that 68% have adapted to the impact of climate change. Of this proportion, only about 46% have adapted soil and land management (SLM) practices across the treatment groups, whereas the remaining 54% have devised other strategies to cope with climate change apart from SLM. The results of the t-test to evaluate the hypotheses suggest that the null for value Hypothesis 1 is rejected. Therefore, there is a significant difference in the per capita income of households who have adapted to climate change using soil and those who did not. Similarly, the null value for Hypothesis 2 is also rejected. Therefore, there is a significant difference in the per capita income of households who have adopted land management practices as a coping strategy against climate change and those who did not. The results showed there was strong evidence to reject the null hypotheses. Therefore, the per capita income was significantly different in both cases.
3.8. Drivers of the Choice of Strategy to Mitigate the Effect of Climate Change
The results of the probit regression are shown on Table 6. The table shows that the number of years spent in school, being a member a religious groups, being a member of a mutual support group, female-headed households the and size of rain-fed owned by farmers have a significant influence (p-value < 0.05) on the participants’ decision to adopt strategies to mitigate the effect of climate change. When all the variables listed above positively influence the participants’ decision, the influence of the female-headed households is negative.
Upon further investigation to know the determinants of participants’ use of SLM, as the adaptation to climate change, Table 6 reveals that the membership of religious groups, the membership of a mutual support group, the number of adult males, female-headed households, the size of the farmland rain-fed owned and the access to extension services significantly influence the respondents’ decision to use SLM to mitigate the effects of climate change (p-value < 0.05).
4. Discussion
The study was carried out on 200 households and 1018 other members of the households, 730 children (72%) and 96 wives (9%). Interestingly, about 6% (58 members) of the households were non-family members. In all, the average household size was found to be 6 persons per household. Although this is less than 9, which [59] found as the average for farmers in southeastern Nigeria. The composition of the household in this study strikes a new dimension, with about 6% of the household members not related to the household head by blood. This triggers the thought that, in view of the increasing difficulty in sourcing farm labour, households keep farm labour under the same roof with them in order to provide them with some basic needs, including shelter and feeding as part of the incentives to engage them in the household farm. There is sufficient evidence in the literature that household size is a positive determinant of household farm income [59,61,63] as well as a determinant for household food security [26]. In other words, the presence of able and willing members of the household suggest a positive impact on the household farm income. A succession crisis cuts across all business sub-sectors, particularly family-owned businesses in developing countries, including Nigeria [64,65,66]. Agriculture (farming), a branch of the business sub-sector, is not excluded from this type of crisis. Ref. [67] submit that the early crafting of a comprehensive, well thought-out, market-focused and people-centred succession plan is a way to avoid the problems associated with succession.
However, in this study, only 20% of the households have clearly mapped out a succession strategy for the sustainability of their family farms. This raises a lot of concern about the other family farms without succession strategy and highlights the onerous tasks of the household heads to ensure their households achieve an improved standard of living. Furthermore, the study found that, contrary to the general opinion that the majority of farmers are of age—and thus old, weak and less productive—about 64% of the respondents were within the economically viable age bracket, 19–59 years, with the youth including young adults representing about 35% of the sampled household heads. This is quite revealing, and could be useful for policymaking to improve agribusiness activities in the study area.
The study revealed that almost all the family members of the participating households live below the poverty threshold as given by the National Bureau of Statistics. About 84% of the households were making less than N600,001 (USD1459.85) annually, which corresponds to USD243.31 per capita per annum. The range of household income distribution in this study suggests that it is lower than the poverty threshold of USD381.75 per year. This fact can significantly aggravate other socio-economic factors threatening the family farming sector. The young members of these households are not likely going to sustain economic activities that keep them below the poverty threshold. This is another pointer for policy consideration.
Using a step-wise regression approach to estimate the effects of participants’ membership of collaborative groupings (like cooperative associations, religious groups and mutual support groups) on the per capita household farm income, the study found that only the membership of religious and mutual support groups statistically and significantly influences the per capita farm income. Surprisingly, the membership of a cooperative group in the study area did not have a significant effect on the per capita farm income, as was found by [38,39,68]. This may not be unconnected with the increasing crises of ideology, capital, credibility and management associated with cooperatives in Nigeria, which have greatly decimated the popularity of cooperative societies [69,70]. Another challenge confronting the conventional cooperative groups is the largely uncoordinated heterogeneous nature and inability to adequately accommodate the interests of the poor rural farmers. Interestingly, the faith-based collaborative group and mutual support group have taken centre stage to re-enact and invigorate the trust, norms and networks that once defined the conventional cooperative association.
Exploring the effects of the participants’ membership of collaborative groupings on their decisions to adapt to climate change, the study found that all the collaborative groupings controlled for in the model statistically and significantly influence participants’ decisions to adapt to climate change. The findings toed the line of the a priori expectation, as memberships of collaborative groupings were expected to enhance the livelihood and improve the welfare of rural farmers [28]. The understanding is that memberships of collaborative groupings open up opportunities for farmers to have access to credit and production assets without stringent conditions and/or high interest rates. This results in a cost-effective production, and with enough exposure to relevant trainings on the adaptation to climate change, farmers could have relatively more resources saved from cost-effective production or competitive prices of output to adopt new innovations, including improved climate change adapting techniques. The findings also revealed the null hypothesis: there is no significant difference between the per capita income of those who are adapting to climate change (adapter) and those who are not (non-adapters). In other words, the household farms adapting to climate change earn a better farm income than the non-adapters. This confirm the findings of other authors in the literature [28,41,42]. This position is also corroborated by [51], whose study empirically confirmed that adapting to climate change significantly enhances farmers’ farm income.
On whether the participants’ membership of collaborative groupings has a significant influence on participants’ decisions to use Sustainable Land Management (SLM) practices as an adaptation to climate change, the study rejected the null hypothesis for each. This implied that the participants’ membership of cooperative, religious and mutual support groups significantly and positively affect their decision to adopt SLM as an adaptation to climate change. The findings aligned with the a priori expectation that the members of collaborative groupings have access to information on recent and useful innovations that can help them improve their livelihood, and particularly their farm income. This thought was corroborated by [15], who found that SLM is a popular climate-resilient adaptation measure among rural farmers in Nigeria. Similarly, in line with empirical evidence in the literature, scholars have argued that Sustainable Land Management is one of the most cost-effective approaches for farmers to adapt to climatic change [18,19,20]. An empirical proof of this assertion is the rejection of the null hypothesis: there is no significant difference between the per capita income of those who are using the SLM strategy to adapt to climate and those who are not. Therefore, this shows that the per capita income of household farms using the SLM strategy is significantly higher than the household farms that are not using it.
The study also found that the commitment of farmers to their agribusiness and other factors can positively help it thrive, including their membership of collaborative associations. Therefore, it is noteworthy that 84% of the cooperative members, as well as 71% and 75% of the religious group and mutual support group, were strongly committed to their association’s membership obligations. As established in the literature, this level of commitments can be seamlessly transmitted to their agribusiness ventures if they have access to adequate production resources at competitive prices and markets.
The null hypothesis that there is no significant difference between the income of those who adapted to climate change was rejected. This implies that those who adapted to climate change earned more income than their counterparts who did not adapt to climate change. Similarly, the null hypothesis—i.e., there is no significant difference between the income of those who deployed soil and land management techniques as an adaptation to climate change and those who adopted other methods—was rejected. The SLM practices as an adaptation to climate change seemed to mitigate the effects of climate change better than other methods adopted in the study area. Hence, the return on the investments among the farmers who adapted to climate change using the SLM method is relatively higher. The findings in this study corroborate similar findings in the literature [71,72] indicating that the average income of those who adopt mitigation strategies against climate change is higher than that of those who do not bother. This outcome is not unconnected with the level of participants’ (farmers’) awareness of the risk associated with climate change [72].
5. Conclusions
This study aimed to assess the impact of rural smallholders’ collaborative groupings to examine the family (household) farm income and the ability to devise farm adaptable management strategies to mitigate the effects of climate change within their farming area. Only 200 of the 225 respondents surveyed were analysed. This study found that, among others, the membership of a mutual support group and a religious group are major determinants of respondents’ household farm income. Surprisingly, the membership of cooperative groups did not significantly influence the changes in household farm income. However, the three collaborative groupings—membership of cooperative groups, membership of a mutual support group and membership of a religious group—are major determinants of respondents’ decision to adapt to climate change and/or using SLM as a method to adapt to climate change. On the strength of these findings, the study recommends that more farmers should be encouraged to form themselves into collaborative groups with economic interests where they can have access to more information about climate change and its consequences. Doing this will also help them mitigate the effect of climate change on the household farm income.
Author Contributions
Conceptualization, I.A.A. and E.S.I.; methodology, E.S.I.; software, I.A.A.; validation, I.A.A. and E.S.I.; formal analysis, E.S.I.; investigation, I.A.A.; resources, I.A.A. and E.S.I.; data curation, I.A.A.; writing—original draft preparation, I.A.A.; writing—review and editing, E.S.I.; visualization, E.S.I.; supervision, I.A.A.; project administration, I.A.A. All authors have read and agreed to the published version of the manuscript.
Funding
This research received no external funding.
Institutional Review Board Statement
Not available.
Informed Consent Statement
Not available.
Data Availability Statement
When the research is concluded, the data will be made available.
Conflicts of Interest
The authors declare no conflict of interest.
Appendix A

Table A1.
Primary activities across LGAs. Source: field survey, 2020; N = 200.
| LGA | Akure North | Akure South | Akoko N/E | Akoko N/w | Akoko S/E | Akoko S/W | Idanre | Ifedore | Irele | Ilaje | Odigbo | Okit-ipupa | Ondo East | Ondo West | Owo | Mean Total % |
|---|---|---|---|---|---|---|---|---|---|---|---|---|---|---|---|---|
| crop production | 16.8 | 29.6 | 25.5 | 16.7 | 26.2 | 30.6 | 56.9 | 27.3 | 33.1 | 4.1 | 28.6 | 36.6 | 28.8 | 22.9 | 15.1 | 26.6 |
| livestock production | 2.1 | 0.0 | 0.0 | 12.5 | 0.0 | 1.6 | 0.0 | 2.3 | 0.0 | 6.1 | 0.0 | 0.0 | 3.6 | 4.2 | 5.7 | 2.5 |
| Fisheries | 0.0 | 0.0 | 2.0 | 6.3 | 0.0 | 3.2 | 0.0 | 2.3 | 0.0 | 4.1 | 0.0 | 2.4 | 0.0 | 0.0 | 0.0 | 1.3 |
| forest production | 7.4 | 0.0 | 0.0 | 2.1 | 2.4 | 0.0 | 0.0 | 0.0 | 1.6 | 8.2 | 0.0 | 0.0 | 0.0 | 0.0 | 0.0 | 1.4 |
| Agricultural Trading business | 11.6 | 11.1 | 11.8 | 8.3 | 2.4 | 3.2 | 1.7 | 18.2 | 6.3 | 10.2 | 17.9 | 8.1 | 6.3 | 18.8 | 1.9 | 9.2 |
| Non-Agricultural Trading business | 3.2 | 3.7 | 15.7 | 0.0 | 7.1 | 3.2 | 3.4 | 6.8 | 3.9 | 10.2 | 12.5 | 2.4 | 6.3 | 2.1 | 7.5 | 5.9 |
| Transportation business | 3.2 | 0.0 | 0.0 | 0.0 | 0.0 | 0.0 | 0.0 | 0.0 | 1.6 | 0.0 | 1.8 | 0.0 | 0.9 | 0.0 | 0.0 | 0.5 |
| Agricultural processing | 0.0 | 7.4 | 0.0 | 0.0 | 0.0 | 1.6 | 6.9 | 0.0 | 0.0 | 0.0 | 0.0 | 0.8 | 1.8 | 0.0 | 3.8 | 1.5 |
| Formal private employment | 0.0 | 0.0 | 0.0 | 0.0 | 2.4 | 0.0 | 0.0 | 2.3 | 1.6 | 2.0 | 0.0 | 0.8 | 3.6 | 2.1 | 0.0 | 1 |
| Construction | 0.0 | 0.0 | 0.0 | 0.0 | 0.0 | 0.0 | 0.0 | 0.0 | 0.0 | 0.0 | 0.0 | 0.8 | 0.0 | 2.1 | 0.0 | 0.2 |
| Public sector employment | 1.1 | 0.0 | 5.9 | 8.3 | 2.4 | 3.2 | 1.7 | 0.0 | 3.1 | 14.3 | 1.8 | 8.9 | 1.8 | 0.0 | 3.8 | 3.8 |
| Domestic duties | 1.1 | 0.0 | 0.0 | 2.1 | 0.0 | 0.0 | 0.0 | 0.0 | 0.8 | 4.1 | 0.0 | 0.0 | 0.0 | 0.0 | 3.8 | 0.8 |
| student In school | 45.3 | 44.4 | 27.5 | 31.3 | 35.7 | 43.5 | 22.4 | 31.8 | 44.1 | 36.7 | 26.8 | 35.0 | 45.9 | 47.9 | 26.4 | 36.3 |
| Retired | 5.3 | 0.0 | 0.0 | 4.2 | 0.0 | 0.0 | 0.0 | 0.0 | 0.0 | 0.0 | 0.0 | 0.0 | 0.0 | 0.0 | 0.0 | 0.6 |
| Unemployed | 3.2 | 0.0 | 9.8 | 6.3 | 9.5 | 8.1 | 5.2 | 2.3 | 2.4 | 0.0 | 7.1 | 4.1 | 0.0 | 0.0 | 3.8 | 4.1 |
| Handcraft | 0.0 | 3.7 | 0.0 | 0.0 | 2.4 | 0.0 | 0.0 | 0.0 | 0.8 | 0.0 | 1.8 | 0.0 | 0.9 | 0.0 | 0.0 | 0.6 |
| Artisans | 0.0 | 0.0 | 2.0 | 2.1 | 9.5 | 1.6 | 1.7 | 6.8 | 0.8 | 0.0 | 1.8 | 0.0 | 0.0 | 0.0 | 28.3 | 3.6 |
Appendix B
Table A2.
Distribution of respondents by educational qualification. Source: field survey, 2020.
| LGA. | Akure North | Akure South | Akoko N/E | Akoko N/w | Akoko S/E | Akoko S/W | Idanre | Ifedore | Irele | Ilaje | Odigbo | Okitipupa | Ondo East | Ondo West | Owo | Mean Total % |
|---|---|---|---|---|---|---|---|---|---|---|---|---|---|---|---|---|
| no formal edu | 16.8 | 18.5 | 9.8 | 7.3 | 11.6 | 8.1 | 20.7 | 15.9 | 9.4 | 7.7 | 20.7 | 7.6 | 6.3 | 16.7 | 3.8 | 12.1 |
| Adult Literacy | 0.0 | 0.0 | 3.9 | 1.8 | 0.0 | 0.0 | 0.0 | 0.0 | 0.0 | 3.8 | 1.7 | 0.8 | 0.0 | 0.0 | 0.0 | 0.8 |
| Some pri edu | 6.3 | 7.4 | 0.0 | 5.5 | 2.3 | 14.5 | 6.9 | 2.3 | 3.1 | 3.8 | 5.2 | 2.3 | 6.3 | 4.2 | 3.8 | 4.9 |
| Complete pri edu | 13.7 | 11.1 | 11.8 | 18.2 | 4.7 | 11.3 | 17.2 | 11.4 | 16.5 | 15.4 | 17.2 | 13.6 | 9.0 | 18.8 | 22.6 | 14.2 |
| some sec edu | 17.9 | 29.6 | 17.6 | 14.5 | 18.6 | 24.2 | 34.5 | 34.1 | 26.0 | 19.2 | 13.8 | 22.7 | 18.0 | 29.2 | 28.3 | 23.2 |
| complete sec edu | 25.3 | 25.9 | 29.4 | 27.3 | 30.2 | 24.2 | 17.2 | 22.7 | 32.3 | 32.7 | 20.7 | 30.3 | 45.9 | 22.9 | 30.2 | 27.8 |
| post sec edu | 20.0 | 7.4 | 27.5 | 25.5 | 32.6 | 17.7 | 3.4 | 13.6 | 12.6 | 17.3 | 17.2 | 22.7 | 14.4 | 6.3 | 11.3 | 16.6 |
| koranic edu | 0.0 | 0.0 | 0.0 | 0.0 | 0.0 | 0.0 | 0.0 | 0.0 | 0.0 | 0.0 | 3.4 | 0.0 | 0.0 | 2.1 | 0.0 | 0.4 |
Appendix C
Table A3.
Distribution of respondents by production assets owned (N = 200). Source: field survey, 2020.
Table A3.
Distribution of respondents by production assets owned (N = 200). Source: field survey, 2020.
| Productive Assets | Owo | Akoko North West | Akoko North East | Akoko South West | Akoko South East | Akure North | Akure South | Ifedore | Idanre | Ondo West | Ondo East | Odigbo | Okitipupa | Irele | Mean Total |
|---|---|---|---|---|---|---|---|---|---|---|---|---|---|---|---|
| Cutlass/Hoes | 23.30 | 38.9 | 26.70 | 22.20 | 33.30 | 46.90 | 33.30 | 27.30 | 42.10 | 42.10 | 36.40 | 50.0 | 40.00 | 43.80 | 33.75 |
| Knapsack sprayers | 3.30 | 1.0 | 6.70 | 0 | 0 | 9.40 | 8.30 | 13.60 | 5.30 | 26.30 | 18.20 | 20.80 | 12.50 | 9.40 | 8.98 |
| Honey proc. equip. | 0 | 0 | 0 | 0 | 0 | 3.10 | 8.30 | 0 | 5.30 | 0 | 0 | 0 | 5.00 | 9.40 | 2.07 |
| Oil press machine | 0 | 0 | 0 | 2.80 | 0 | 0 | 8.30 | 4.50 | 5.30 | 5.30 | 0 | 8.30 | 2.50 | 6.30 | 2.88 |
| Bicycle | 6.70 | 0 | 0 | 0 | 0 | 6.30 | 16.70 | 0 | 5.30 | 0 | 9.10 | 0 | 2.50 | 3.10 | 3.31 |
| Motor cycle | 6.70 | 5.70 | 6.70 | 0 | 3.30 | 15.60 | 8.30 | 18.20 | 15.80 | 10.50 | 15.20 | 16.70 | 12.50 | 6.30 | 9.43 |
| Wheelbarrow | 0 | 16.90 | 9.90 | 14.0 | 3.30 | 12.50 | 8.30 | 4.50 | 15.80 | 0 | 9.10 | 0 | 7.50 | 6.30 | 7.20 |
References
- Sabo, B.B.; Isah, S.D.; Chamo, A.M.M.; Rabiu, A. Role of smallholder farmers in Nigeria’s food security. Sch. J. Agric. Sci. 2017, 7, 1–5. [Google Scholar]
- Mgbenka, R.N.; Mbah, E.N.; Ezeano, C.I. A review of smallholder farming in Nigeria: Need for transformation. Int. J. Agric. Ext. Rural. Dev. Stud. 2016, 3, 243–254. [Google Scholar]
- Federal Office of Statistics (FOS). Poverty and Agricultural Sector in Nigeria, Poverty; Federal Office of Statistics: Abuja, Nigeria, 1999. [Google Scholar]
- Wolfenson, K.D.M. Coping with the Food and Agriculture Challenge: Smallholders’ Agenda; Food and Agriculture Organization of the United Nations: Rome, Italy, 2013. [Google Scholar]
- Ajibefun, I.A. Nigeria Agricultural Policy, Productivity and Poverty: The Critical Nexus. FUTAspace Repository; Inaugural Lecture Series 69; Federal University of Technology: Akure, Nigeria, 2015; p. 138. Available online: http://196.220.128.81:8080/xmlui/handle/123456789/338 (accessed on 23 November 2021).
- Mafimisebi, T.E. Agribusiness Income and Conquest of Poverty: What Nexus? FUTAspace Repository; Inaugural Lecture Series 137; Federal University of Technology: Akure, Nigeria, 2021; p. 138. Available online: http://196.220.128.81:8080/xmlui/handle/123456789/4825 (accessed on 23 November 2021).
- Wong, S.; Guggenheim, S. Community-driven development: Myths and realities. In World Bank Policy Research Working Paper; No. 8435; World Bank: Washington, DC, USA, 2018. [Google Scholar]
- Wong, S. What have been the impacts of World Bank Community-Driven Development Programs? In CDD Impact Evaluation Review and Operational and Research Implications; World Bank: Washington, DC, USA, 2012. [Google Scholar]
- Mansuri, G.; Rao, V. Localizing Development. Does Participation Work? Licence: Creative Common Attribution CC BY 3.0; World Bank: Washington, DC, USA, 2013. [Google Scholar] [CrossRef]
- Gillespie, S. Scaling up community driven development: A synthesis of experience. In Food and Nutrition Division Discussion Paper #181; International Food Policy Research Institute (IFPRI): Washington, DC, USA, 2013. [Google Scholar]
- Dongier, P.; Van Domelen, J.; Ostrom, E.; Ryan, A.; Wakeman, W.; Bebbington, A.; Alkire, S.; Esmail, T.; Polski, M. Community-Driven Development. In A Sourcebook for Poverty Reduction Strategies; Klugman, J.C., Ed.; World Bank: Washington, DC, USA, 2003. [Google Scholar]
- Conning, J.; Kevane, M. Community based targeting mechanisms for social safety nets. A critical review. World Dev. 2002, 30, 375–395. [Google Scholar] [CrossRef] [Green Version]
- Onoja, A.F. History of Second National Fadama Development Project (NFDP-II) and it’s Implementation Arrangements. Presented at the Occasion of 2-Day Fadama Sensitization Workshop Organized by Manic Promotions (Nig) Limited in Collaboration with Local Government Service Commission, Lokoja, Kogi State, Nigeria, 6 August 2004. [Google Scholar]
- Fadina, A.M.R.; Barjolle, D. ‘Farmers’ adaptation strategies to climate change and their implications in the Zou Department of South Benin. Environments 2018, 5, 15. [Google Scholar] [CrossRef] [Green Version]
- Onyeneke, R.U.; Nwajiuba, C.A.; Emenekwe, C.C.; Nwajiuba, A.; Onyeneke, C.J.; Ohalete, P.; Uwazie, U.I. Climate change adaptation in Nigerian agricultural sector: A systematic review and resilience check of adaptation measures. AIMS Agric. Food 2019, 4, 967–1006. [Google Scholar] [CrossRef]
- Obioha, E.E. Climate change, population drift and violent conflict over land resources in Northeastern Nigeria. J. Hum. Ecol. 2008, 23, 311–324. [Google Scholar] [CrossRef]
- Mburu, B.M.; Kung’u, J.B.; Muriuku, J.N. Climate change adaptation strategies by small-scale farmers in Yatta District, Kenya. Afr. J. Environ. Sci. Technol. 2015, 9, 712–722. [Google Scholar] [CrossRef] [Green Version]
- Amogne, A.; Simane, B.; Hassen, A.; Bantider, A. Variability and time series trend analysis of rainfall and temperature in northcentral Ethiopia: A case study in Woleka sub-basin. Weather Clim. Extrem. 2018, 19, 29–41. [Google Scholar]
- Challinor Andrew, J.; Watson, J.; Lobell, D.B.; Howden, S.M.; Smith, D.R.; Chhetri, N. A meta-analysis of crop yield under climate change and adaptation. Nat. Clim. Chang. 2014, 4, 287–291. [Google Scholar] [CrossRef]
- Thierfelder, C.; Matemba-Mutasa, R.; Rusinamhodz, L. Yield response of maize (Zea mays L.) to conservation agriculture cropping system in Southern Africa. Soil Tillage Res. 2015, 146, 230–242. [Google Scholar] [CrossRef]
- Ojo, T.O.; Baiyegunhi, L.J.S. Impact of climate change adaptation strategies on rice productivity in South-west, Nigeria: An endogeneity corrected stochastic frontier model. Sci. Total Environ. 2020, 745, 141151. [Google Scholar] [CrossRef]
- Rogers, E.M. Diffusion of Innovations: Modifications of a model for telecommunications. In Die Diffusion von Innovationen in der Telekommunikation; Springer: Berlin/Heidelberg, Germany, 1995; pp. 25–38. [Google Scholar]
- Valente, T.W. Social network thresholds in the diffusion of innovations. Soc. Netw. 1996, 18, 69–89. [Google Scholar] [CrossRef]
- Deroıan, F. Formation of social networks and diffusion of innovations. Res. Policy 2002, 31, 835–846. [Google Scholar] [CrossRef]
- Novkovic, S. Defining the co-operative difference. J. Socio-Econ. 2008, 37, 2168–2177. [Google Scholar] [CrossRef]
- Milovanovic, V.; Lubos, S. Cooperative rice farming within rural Bangladesh. J. Co-Oper. Organ. Manag. 2018, 6, 11–19. [Google Scholar] [CrossRef]
- Kolade, O.; Trudy, H. ‘Farmers’ mobilisation of social capital for beneficial uptake of technological innovations in southwest Nigeria. Int. J. Technol. Learn. Innov. Dev. 2014, 7, 147–166. [Google Scholar] [CrossRef]
- Zama, N.I.; Fang, L.; Eric, F.Z. Drivers of adaptation to climate change in vulnerable farming communities: A micro analysis of rice farmers in Ndop, Cameroon. J. Agric. Rural. Dev. Trop. Subtrop. (JARTS) 2021, 122, 231–243. [Google Scholar]
- Awolala, D.O.; Igbekele, A.A.; Kehinde, O.; Ruiqing, M. Integrated assessment of human vulnerability to extreme climate hazards: Emerging outcomes for adaptation finance allocation in Southwest Nigeria. Clim. Dev. 2021, 1–18. [Google Scholar] [CrossRef]
- Ma, W.; Awudu, A. Does cooperative membership improve household welfare? Evidence from apple farmers in China. Food Policy 2016, 58, 94–102. [Google Scholar] [CrossRef]
- Matemilola, S. and Elegbede, I. The challenges of food security in Nigeria. Open Access Libr. J. 2017, 4, 1–22. [Google Scholar]
- Agbola, P.; Fayiga, A.O. Effects of climate change on agricultural production and rural livelihood in Nigeria. J. Agric. Res. Dev. 2016, 15, 71–82. [Google Scholar]
- Birchall, J. A member-owned business approach to the classification of co-operatives and mutuals. Co-Oper. Model. Pract. 2012, 67, 142. [Google Scholar]
- Chuang, Y. Climate variability, rainfall shocks, and farmers’ income diversification in India. Econ. Lett. 2019, 174, 55–61. [Google Scholar] [CrossRef]
- Mahdi, A.; Alamdarlo, H.N.; Mosavi, S.H. The effects of climate change and groundwater salinity on farmers’ income risk. Ecol. Indic. 2020, 110, 105893. [Google Scholar]
- Gardner, B.L.; Lerman, Z. Agricultural Cooperative Enterprise in the Transition from Socialist Collective Farming; No. 888-2016-65064; Econspaper: Orebro, Sweden, 2006. [Google Scholar]
- Yamusa, I.; Adefila, J.O. ‘Farmers’ cooperatives and agricultural development in Kwali area council federal capital territory Abuja, Nigeria. Int. J. Humanit. Soc. Sci. 2014, 4, 161–169. [Google Scholar]
- Gibson, R. The Role of Co-Operatives in Community Economic Development; Working Paper; Rural Development Institute, Brandon University: Brandon, MB, Canada, 2005. [Google Scholar]
- Adekunle, A. Effect of Membership of Group-Farming Cooperatives on Farmers Food Production and Poverty Status in Nigeria. In Proceedings of the 30th International Conference of Agricultural Economists, Vancouver, BC, Canada, 28 July–2 August 2018. [Google Scholar]
- Bhuyan, S. The “people” factor in cooperatives: An analysis of members’ attitudes and behavior. Can. J. Agric. Econ./Rev. Can. D’agroeconomie 2007, 55, 275–298. [Google Scholar] [CrossRef]
- Adego, T.; Simane, B.; Woldie, G.A. The impact of adaptation practices on crop productivity in northwest Ethiopia: An endogenous switching estimation. Dev. Stud. Res. 2019, 6, 129–141. [Google Scholar] [CrossRef] [Green Version]
- Ahmad, M.; Mustafa, G.; Iqbal, M. Impact of farm households’ adaptations to climate change on food security: Evidence from different agro-ecologies of Pakistan. Pak. Dev. Rev. 2016, 55, 561–588. [Google Scholar]
- Khanal, U.; Wilson, C.; Hoang, V.-N.; Lee, B. Farmers’ Adaptation to Climate Change, its Determinants and Impacts on Rice Yield in Nepal. Ecol. Econ. 2018, 144, 139–147. [Google Scholar] [CrossRef]
- Chikaire, J.; Nnadi, F.N.; Anaeto, F.C.; Ejiogu-Okereke, N.; Anyoha, N.O. Analysis of the benefits of sustainable land management practices for climate change adaptation in Imo State Nigeria. Adv. Agric. Sci. Eng. Res. 2012, 2, 72–78. [Google Scholar]
- van Ittersum, M.K.; van Bussel, L.G.J.; Wolf, J.; Grassini, P.; van Wart, J.; Guilpart, N.; Claessens, L.; de Groot, H.; Wiebe, K.; Mason-D’Croz, D.; et al. Can sub-Saharan Africa feed itself? Proc. Natl. Acad. Sci. USA 2016, 113, 14964–14969. [Google Scholar] [CrossRef] [Green Version]
- Elizabeth, A.A.; McGrath, J.M. Direct effects of rising atmospheric carbon dioxide and ozone on crop yields. In Climate Change and Food Security; Springer: Dordrecht, The Netherlands, 2010; pp. 109–130. [Google Scholar]
- Gnanglè, P.C.; Afouda Yabi, J.N.; Yegbemey, R.; Kakaï, R.G.; Sopkon, N. Rentabilité économique des systèmes de production des parcs à Karité dans le contexte de l’adaptation au changement climatique du Nord-Bénin. Afr. Crop Sci. J. 2012, 20, 589–602. [Google Scholar]
- Elisabeth, S.; Quinn, C.H.; Batisani, N.; Dougill, A.J.; Dyer, J.C.; Fraser, E.D.G.; Mkwambisi, D.; Sallu, S.; Stringer, L.C. Is rainfall really changing? Farmers’ perceptions, meteorological data, and policy implications. Clim. Dev. 2013, 5, 123–138. [Google Scholar]
- Assoumana, B.T.; Mbaye, N.; Van Der Puije, G.; Mamourou, D.; Thomas, G. Comparative Assessment of Local Farmers’ Perceptions of Meteorological Events and Adaptations Strategies: Two Case Studies in Niger Republic. 2016. Available online: http://hdl.handle.net/123456789/4513 (accessed on 23 November 2021).
- Asayehegn Gebreeyesus, K.; Temple, L.; Sanchez, B.; Iglesias, A. Perception of climate change and farm level adaptation choices in central Kenya. Cah. Agric. 2017, 26, 1–11. [Google Scholar]
- Issahaku, G.; Awudu, A. Adaptation to Climate Change and its influence on Household Welfare in Ghana. In Proceedings of the Conference: Agricultural & Applied Economics Association’s 2017 AAEA Annual Meeting, Chicago, IL, USA, 30 July–1 August 2017. [Google Scholar]
- Mereu, V.; Santini, M.; Cervigni, R.; Augeard, B.; Bosello, F.; Scoccimarro, E.; Spano, D.; Valentini, R. Robust decision making for a climate-resilient development of the agricultural sector in Nigeria. In Climate Smart Agriculture: Building Resilience to Climate Change; Lipper, L., McCarthy, N., Zilberman, D., Asfaw, S., Branca, G., Eds.; Food and Agriculture Organization of the United Nations (FAO): Rome, Italy, 2018; pp. 277–306. [Google Scholar]
- Adetomiwa, K.; Ologundudu, O.M.; Adekunle, I.A.; Ogunyemi, O.V. Impact Assessment of Fadama III Group Participation on Food Security Status of Rural Households in South West, Nigeria. J. Agric. Sustain. 2020, 13, 1–29. [Google Scholar]
- Omoregbee, E.F.; Ighoro, A. Effect of Agricultural Cooperative Membership on Farmers’ Income and Poverty in Delta State, Nigeria. Open Sci. Repos. Agric. 2012, e70081911. [Google Scholar] [CrossRef]
- Gujarati, D.N.; Porter, D.C. Essentials of Econometrics; Irwin/McGraw-Hill: Singapore, 1999. [Google Scholar]
- O’Halloran, S. Econometrics II. Lecture 9: Logit/Probit. Sustain. Dev. U 2013, 9611. [Google Scholar]
- Agbonlahor, M.U.; Aromolaran, A.B.; Aiboni, V.I. Sustainable soil management practices in small farms of southern Nigeria: A poultry-food crop integrated farming approach. J. Sustain. Agric. 2003, 22, 51–62. [Google Scholar] [CrossRef]
- Osabohien, R.; Wiredu, A.N.; Nguezet, P.M.D.; Mignouna, D.B.; Abdoulaye, T.; Manyong, V.; Bamba, Z.; Awotide, B.A. Youth Participation in Agriculture and Poverty Reduction in Nigeria. Sustainability 2021, 13, 7795. [Google Scholar] [CrossRef]
- Federal Ministry of Agriculture and Rural Development (FMARD). National Agriculture and Food Security Strategy, 2010–2020; Federal Ministry of Agriculture and Rural Development: Abuja, Nigeria, 25 August 2010.
- Odoh, N.E.; Nwibo, S.U. Socio-economic determinants of rural non-farm household’s income diversification in Southeast Nigeria. Int. Res. J. Financ. Econ. 2017, 164, 1450–2887. [Google Scholar]
- Onyeabor, E.N.; Umeh, G.N.; Ashiegbu, G.N. Determinants of Farmers’ Access to Informal Support in Nkanu West Local Government Area, Enugu State, Nigeria. Nig. Agric. J. 2019, 50, 74–80. [Google Scholar]
- Ogundele, O.J.K.; Idris, A.A.; Ahmed-Ogundipeand, K.A. Entrepreneurial succession problems in Nigeria’s family businesses: A threat to sustainability. Eur. Sci. J. 2012, 8, 208–227. [Google Scholar]
- Anyanwu, J.C. Marital status, household size and poverty in Nigeria: Evidence from the 2009/2010 survey data. Afr. Dev. Rev. 2014, 26, 118–137. [Google Scholar] [CrossRef]
- Folayan, J.A. Socio-Economic Analysis of Fadama Farmers in Akure South Local Government Area of Ondo State, Nigeria. Am. J. Humanit. Soc. Sci. 2013, 1, 10–17. [Google Scholar] [CrossRef] [Green Version]
- Omotesho, O.A.; Adewumi, M.O.; Muhammad-Lawal, A.; Ayinde, O.E. Determinants of food security among the rural farming households in Kwara State, Nigeria. Afr. J. Gen. Agric. 2016, 2, 1–9. [Google Scholar]
- Dauda, A. Business continuity and challenge of succession in Nigeria: What happens when the CEO leaves. J. Bus. Manag. 2013, 8, 59–65. [Google Scholar] [CrossRef]
- Ohuabunwa, M.S. The challenge of succession planning in Nigeria. Business Day Newspaper, 11 August 2015. [Google Scholar]
- de Oliveira Dias, M. Agriculture Cooperatives in Brazil and the Importance for The Economic Development. Int. J. Bus. Res. Manag. 2018, 9, 72–81. [Google Scholar]
- Adu, C.A. Cooperative societies in Nigeria: Prospects and problems. Int. J. Behav. Soc. Mov. Sci. 2014, 3, 50–55. [Google Scholar]
- Campbell, O.A.; Isaiah, O.O.; Stephen, O.; Taliat, O.E. Cooperative Society and Employees’welfare. Int. J. Curr. Res. 2017, 9, 50050–50055. [Google Scholar]
- Adesugba, M.A.; Mavrotas, G. Delving Deeper into the Agricultural Transformation and Youth Employment Nexus: The Nigerian Case; NSSP Working Paper 31; International Food Policy Research Institute (IFPRI): Washington, DC, USA, 2016; Available online: http://ebrary.ifpri.org/cdm/ref/collection/p15738coll2/id/130281 (accessed on 23 November 2021).
- Okpachu, A.S.; Okpachu, O.G.; Obijesi, I.K. The Impact of education on agricultural productivity of small scale rural female maize farmers in Potiskum Local Government, Yobe State: A Panacea for Rural Economic Development in Nigeria. Int. J. Res. Agric. Food Sci. 2014, 2, 26–33. [Google Scholar]
Figure 1.
Distribution of Households by Membership of Association.

Figure 2.
Distribution of Households’ Annual Income (N).

Figure 3.
Distribution of Household Production Assets (N).

Table 1.
Distribution of respondents by their demographic characteristics.
| Distribution of respondents by age (%) | ||
| Age of Respondents | Frequency | Percentage |
| 19–32 | 33 | 16.5 |
| 33–45 | 37 | 18.5 |
| 46–59 | 58 | 29.0 |
| 60 and above | 72 | 36.0 |
| Distribution of respondents by gender (%) | ||
| Gender | Frequency | Percentage |
| Male | 101 | 50.74 |
| Female | 99 | 49.35 |
| Distribution of household members by their relationship with the household head (%) | ||
| Other members of the households | Frequency | Percentage |
| Child | 730 | 72 |
| Wife | 96 | 9 |
| Sibling | 48 | 5 |
| Other extended member of the family | 86 | 8 |
| Not related by blood | 58 | 6 |
| Hectares of farmland under cultivation | Frequency | Percentage |
| ≤2.00 ha | 53 | 26.5 |
| 2.01–4.00 ha | 54 | 27 |
| 4.01–6.00 ha | 39 | 19.5 |
| 6.01–8.00 ha | 36 | 18 |
| >8.00 ha | 18 | 9 |
| How the farms were acquired/established | Frequency | Percentage |
| Inherited farm | 24 | 12 |
| Inherited land | 55 | 27.5 |
| Outright purchase | 76 | 38 |
| Lease | 45 | 22.5 |
| Well-defined succession plan to keep the farm going even after the demise of the household head? | ||
| Yes/No/Undecided | 41/57/102 | 20%/29%/51% |
Source: Field Survey, 2020; N = 200.
Table 2.
Paired t-test of Household Income Based on Association.
| Group Association | All Treated Groups | Paired Test | |
|---|---|---|---|
| Household Income | |||
| Mean Difference | S. Error | p-Value | |
| Cooperative society (Yes = 1) | 35,008.90 | 64,288.44 | 0.501 |
| Mutual supports group (Yes = 1) | 50,365.34 | 54,367.16 | 0.0355 ** |
| Religious group (Yes = 1) | 51,935.83 | 53,000.22 | 0.0328 ** |
Source: Computed from a field survey ** Significant at 5% level.
Table 3.
Paired t-test of Value of Production Assets Based on Association.
| Group Association | All Treated Groups | Paired Test | |
|---|---|---|---|
| Value of Production Assets | |||
| Mean Difference | S. Error | p-Value | |
| Cooperative society (Yes = 1) | 29,639.08 | 25,764.51 | 0.0251 ** |
| Mutual supports group (Yes = 1) | 41,145.57 | 21,801.97 | 0.060 *** |
| Religious group (Yes = 1) | 2701.69 | 21,383.44 | 0.899 |
Source: Computed from a field survey, ** Significant at 5% level, *** Significant at 10% level.
Table 4.
Regression Results on the Determinants of the Per Capita Income.
| Estimated Parameters | Per Capita Income | Annual +/− in |
|---|---|---|
| Robust OLS | Per Capita Income % | |
| Age of HH (years) | 0.0015 * | 0.2 |
| Number of years spent in school by HH | 0.0039 * | 0.4 |
| Membership of a mutual support group (Yes = 1) | 0.0102 ** | 1.0 |
| Membership of a religious group (Yes = 1) | 0.0075 *** | 0.8 |
| Number of adult males | −0.0086 *** | −0.9 |
| Number of adult females | 0.0017 *** | 0.2 |
| Male-headed household (Yes = 1) | 0.0030 *** | 0.3 |
| Value of production assets (Naira) | 0.0092 ** | 0.9 |
| Total livestock units (Naira) | 0.0168 * | 1.7 |
| Size of farmland under rain-fed (Hectare) | 0.0205 ** | 2.1 |
| Access to extension services (Yes = 1) | 0.0041 *** | 0.4 |
| Distance to the nearest market | −0.0240 ** | −2.4 |
| Distance to all weathered roads | −0.0071 * | −0.7 |
| R2 = 0.7642 | ||
| Adjusted R2 = 0.7515 |
Source: Computed from a field survey (Dependent Variable = Log of Income). * Significant at 1% level, ** Significant at 5% level, *** Significant at 10% level.
Table 5.
Comparing the adaptation to climate change across the AEZ Zone.
| Adaptation | Humid Forest |
|---|---|
| Adapted to climate change (% yes) | 68.30% |
| Per capita income (Adapted) Per capita income (Not adapted) | N10,224.29 (Mean difference) |
| Paired test (p-value) | 0.029 ** |
| Used SLM to adapt to climate (% yes) | 45.70% |
| Per capita income (With SLM) Per capita income (Without SLM) | N9982.81 (Mean difference) |
| Paired test (p-value) | 0.0417 ** |
Computed from a field survey, 2020, (** significant at 5%). (N stands for Naira).
Table 6.
Drivers of Adaptations to Climate Change.
| Parameters | Adaptation to Climate Change | Adaptation by Using SLM |
|---|---|---|
| Probit (Robust Model) | Probit (Robust Model) | |
| Number of years spent in school | 0.0318 * | 0.0058 ** |
| Membership of a cooperative group | 0.0127 *** | 0.0162 ** |
| Membership of a religious group | 0.0391 * | 0.0340 * |
| Membership of a mutual supports group | 0.0246 * | 0.3161 * |
| Number of adult males | 0.0246 ** | 0.0266 * |
| Number of adult females | −0.0301 | 0.0285 |
| Female-headed household | −0.0324 * | −0.0483 * |
| Value of remittances | 0.0470 | 0.0086 |
| Total livestock units | −0.0109 | −0.1402 |
| Size of farmland rain-fed owned | 0.0226 * | 0.0202 * |
| Access to extension services | 0.0131 ** | 0.0477 * |
| Distance to the nearest market | 0.0801 | 0.0044 |
| Distance to all weathered roads | 0.0168 | −0.0308 |
| R2 = 0.6381 | ||
| Adjusted R2 = 0.6199 |
Source: Computed from a field survey. * Significant at 1% level, ** Significant at 5% level. *** Significant at 10% level.
Publisher’s Note: MDPI stays neutral with regard to jurisdictional claims in published maps and institutional affiliations. |
© 2021 by the authors. Licensee MDPI, Basel, Switzerland. This article is an open access article distributed under the terms and conditions of the Creative Commons Attribution (CC BY) license (https://creativecommons.org/licenses/by/4.0/).
Share and Cite
MDPI and ACS Style
Ikuemonisan, E.S.; Ajibefun, I.A. Economic Implications of Smallholders’ Collaborative Groupings on Household Income and Adaptability to Climate Change in Nigeria. Sustainability 2021, 13, 13668. https://doi.org/10.3390/su132413668
AMA Style
Ikuemonisan ES, Ajibefun IA. Economic Implications of Smallholders’ Collaborative Groupings on Household Income and Adaptability to Climate Change in Nigeria. Sustainability. 2021; 13(24):13668. https://doi.org/10.3390/su132413668
Chicago/Turabian StyleIkuemonisan, Edamisan Stephen, and Igbekele Amos Ajibefun. 2021. "Economic Implications of Smallholders’ Collaborative Groupings on Household Income and Adaptability to Climate Change in Nigeria" Sustainability 13, no. 24: 13668. https://doi.org/10.3390/su132413668
Note that from the first issue of 2016, this journal uses article numbers instead of page numbers. See further details here.