Article

Quantitative Analysis of Farmers Perception of the Constraints to Sunflower Production: A Transverse Study Approach Using Hierarchical Logistic Model (HLM)

by
Ejovi Akpojevwe Abafe
*,
Oluwaseun Samuel Oduniyi
and
Sibongile Sylvia Tekana
Department of Agriculture and Animal Health, University of South Africa, Roodepoort 1709, South Africa
*
Author to whom correspondence should be addressed.
Sustainability 2021, 13(23), 13331; https://doi.org/10.3390/su132313331
Submission received: 3 July 2021 / Revised: 20 October 2021 / Accepted: 25 October 2021 / Published: 2 December 2021

Abstract

:
Sunflower production is an excellent choice for both local and national agribusiness with significant potential in smallholder farming systems due to low input costs, consistent yields, and a short planting window. However, farmers are faced with interrelated constraints in their sunflower production. This study was undertaken to examines the perceptions of the constraints to sunflower production as perceived by smallholder farmers in North West Province, South Africa. The research identifies some factors related to sunflower production constraints. Then, a stratified random sampling technique was used to select 172 sunflower farmers and they were asked to rate their response on these attributes on a 5-points Likert scale. Leveraging principal component analysis (PCA), we agglomerated and condense information from the original datasets of the constraint attributes into three main components (innovation, farm finance, and crop management practice). Because of the hierarchical structure of the dataset with farmers nested within their local municipalities, we use Hierarchical Logistic Modeling techniques to identify the factors that determine farmer’s perceived interest in innovation, farm finance, and crop management practices. Innovation and farm finance emerge to be critical elements for sustainable sunflower production. The findings indicate that age, education, household size, farm size, cooperative membership, and gender are strongly correlated with farmers’ perceived interest in innovation and farm finance characteristics. This study recommends that to promote these elements among smallholder farmers, it is necessary for governments at the local and national level to invest in extension service and education, cooperative organizations, research, and development in disentangling the age, gender, and farm size inequalities existing in the district sunflower production.

1. Introduction

Agricultural sustainability faces hosts of constraints, and if food demands of the growing population are to be met, agriculture will need to undergo significant transformation. Thus, smallholder farmers would play a critical role in the drastic process of transforming the agricultural sector, because some households pose the capacity to participate in high-value agricultural markets and use advanced production inputs. However, the majority are unable to do so due to varying constraints. On the one hand, agricultural operation is daunting for households with profit potential in the presence of climate change, limited credit alternatives, production and market shocks, poor asset holdings, and access to markets barriers. On the other hand, smallholder farmers can effectively adjust their livelihood strategies to these constraints, but it will demand supportive regulatory climates [1].
Smallholder farmers and agripreneurs represent a diverse image, but the innate and social-political terrain in which they are found in South Africa is somewhat common, at least to a certain degree, owing to the country’s racially and economically polarized history and current challenges [2]. This situation is reflected in the several types of research and intervention that aimed to better understand the challenges and opportunities that household farmers face in terms of productivity and access to mainstream agricultural markets [3,4,5,6]. There is no doubting that research on smallholder farmers’ participation in a number of agricultural commodities has been undertaken, thus cannot be unrelated to the fundamental role of sustainable production and market access for households with knitted income to crop and animal production.
In South Africa, several strategies, and interventions to boost productivity in the smallholder farming systems, especially in the sunflower sector have all registered limited impacts. For instance, the Agricultural Policy Action Plan (APAP) and South African Industrial Policy Action Plan (IPAP), both designed to inspire growth in the agricultural sector lacks a precise and effective approach towards the edible oil and oilseed industry, as APAP failed to treat oilseed crops as strategic commodities, while IPAP on the other end was limited to other labor-intensive sectors such as fruit, milling, and poultry [7]. Resulting in the unbreached gap between demand and supply of sunflower oil, oilcake, and the continual decline of the total area of production. Sunflower production accounts for nearly 60 percent of the local oilseed crop produce, making it a favored oilseed crop choice. However, national production is yet to meet the growing demand, despite being earmarked as a beneficial cash crop with great potential in local and national agribusiness operations, owing to its consistent yield and a short growing circle [8,9,10]. Sunflower is a cost-effective and desirable agricultural crop with outstanding characteristics, such as the augmentation of valuable market products, revenue generation, and poverty reduction. Unfortunately, the dearth of viable seeds available to farming households, as well as extreme weather events, have hampered its maximum potential across the food value chains [11]. The crop can be integrated into local cropping systems to improve soil health and boost biodiversity in crop rotation practices. The plant also has excellent adaption responses for growing in harsh environments, unlike other grain crops such as wheat, soybean, and maize.
In 1999, the South Africa sunflower industry experienced a production boom of over a million tons on 828,000 hectares of land with an average output of 1.4/ha similar to the three leading sunflower producing countries i.e., Ukraine, Argentina, and Russia [8,9]. Unfortunately, since the production boom, the total area of land dedicated for domestic sunflower production has followed a downward trend, leading to an average yield decrease per hectare with drastic reductions in the North West Province in contrast to the other provinces [9]. The impacts of this decline in production are expressed in the limited access to high-value markets, lack of market competition, low productivity, increased seed, oil, and oilcake import as well as farmers’ lackadaisical attitudes towards the sunflower crop [7,8,12]. [8] links this decline to the lack of economic inclusion of black farmers (commonly referred to as smallholder farmers) in the sector, as well as in the seed trade business as some of the widespread impediments to farmers entering the sunflower industry, exacerbated by inefficient credit markets and budgetary limitation to purchase the necessary equipment, among other barriers. The constraints to South Africa sunflower production vary significantly but can be traced to the unpredictable rainfall patterns, lack of crop awareness, unreliable markets, insect-pest infestation on the crop, lack of farm machinery, disease attack, high input cost, harsh weather condition, stiff competition, price fluctuation, birds depredation, scarcity of improved seed varieties, as well as poor extension services [11]. Going further, [13] highlighted that one of the most significant challenges facing smallholder sunflower farmers’ in South Africa is the absence of direct links between local producers and consumers.
These constraints pose extreme barriers to entrant smallholder farmers and undermine the production and market capacity of existing households, despite the wide recognition of the sector with regard to job and wealth creation. Given the abundance of arable land, rising domestic demand for healthy vegetable oil and oilcake, we are confident that there are significant economies of scope, among other opportunities for smallholder farmers that are involved in the sunflower production. Therefore, it is imperative to understand some of these barriers in order to foster a sustainable crop production system. Understanding the perceptions of smallholder farmers, particularly those in the sunflower sector, in terms of constraints faced is crucial to government, agricultural scholars, and private sector programs.
While acknowledging the inevitability of constraints in the smallholder farming sector, it is an essential facet of this article to present a robust approach to examine farmers’ perceived interest in sunflower production constraints using empirical data obtained from North West Province, South Africa. We contribute to the growing body of literature on smallholder farming by evaluating the constraints to sunflower production, as perceived by smallholder producers on a variety of attributes. Using econometric techniques, we identify the socio-demographic factors of sunflower-producing households that explain their perceptions. Farmers were asked to rank their perceptions on a range of attributes using Likert scales from 0 to 5. On this scale, a score of 5 indicates that they strongly agree with the constraint attributes, while a score of 1 implies strongly disagrees with the set of statements.
Considering the large numbers of constraint statements gleaned, we invoked a dimension reducing technique to condense the set of attributes into smaller dataset alias principal components while preserving most of the significant information. To further comprehend what explicates variance in constraints to sunflower production, we construct and evaluate a Hierarchical Logistic Model in which variation in the score is dependent on both constraint statements and farmer demographic variables. Overall, the core objective of the study was to investigate the socio-economic attributes of smallholder sunflower farmers that explain their perceived interest in a set of sunflower production constraints in Ngaka Modiri Molema District, North West Province, South Africa.
The rest of the article is structured as follows. Section 2 presents the materials and methods, Section 3 presents summary statistics, while Section 4 and Section 5 present the result, conclusion, and highlights the policy implications.

2. Materials and Methods

2.1. Study Area

The research was carried out in one of the five districts (Ngaka Modiri Molema) of North West Province, South Africa. According to estimates, North West Province is the second largest sunflower producer in the country, accounting for 32 percent of total domestic production [14]. The importance of smallholder farming and the high share of sunflower production in the province were the two factors that influenced the selection of the Ngaka Modiri Molema District Municipality (NMMDM). The district is made up of five Local Municipalities (LMs): Mahikeng (District capital), Ditsobotla, Ramotshere Moiloa, Ratlou, and Tswaing, with a total area of 28,206 km2. NMMDM has a population of 889,108 people, sharing a border with the Republic of Botswana to the north, Limpopo Province to the north-east, and Northern Cape Province to the south-west. Agriculture contributed 4.9 percent of the district’s GDP in 2017, and the industry experienced its maximum annual growth rate of 25.5 percent in 2017. Maize, wheat, sunflower, vegetables, and fruits are the most popular crops grown in the district [15]. Sunflower production is a significant economic contributor in the district, but it is hampered by a number of constraints faced by household producers.

2.2. Data Collection

Data from respondents were gathered with the aid of semi-structured questionnaires. The questionnaire collects information on respondents’ socioeconomic characteristics as well as their awareness and perceptions of the production constraints being faced. Two trained enumerators who are fluent in the native dialect (Setswana) aided data collection in periods from March to October 2020. This method minimized the difficulties associated with survey fatigue while also increasing the data’s reliability. Furthermore, questionnaire was pre-tested to ensure that no questions and items were vague or culturally sensitive. The constraint attributes were measured on a 5-point Likert item, with scores of 5, 4, 3, 2, and 1 for strongly agree, agree, neutral, disagree, and strongly disagree, respectively.
Scaling, as [16] stated, is a method of assigning a numerical value to items based on some principle, thus by specifying scale items, every phenomenon may as well be “measured.” Likert scales, Guttman scales, and Thurstone scales are only a few of the notable scaling techniques that have emerged as a result of the advancement of approaches to quantify perception. Likert items are also regarded to as aggregated (or summated) rating scales because they are part of a broader set of measurements, on the conjecture that some fundamental phenomenon can be quantified by pooling a person’s rating of his or her opinions, perceptions, or behaviors linked to a set of individual statements [16]. Thus, it was deem fit for our study. Respondents were selected using a stratified random sampling technique, and only households engaged in sunflower production were involved in the survey. The sampling frame for sunflower producers was obtained from extension officers and local community chiefs. The survey featured 172 households from a list of 212 sunflower farmers, comprising 103 farmers from Mahikeng, 51 farmers from Ditsobotla, 10, 8, and 5 farmers from Ratlou, Tswaing, and Ramotshere Moiloa, respectively. The sample size was calculated using the formula developed by Krejcie and Morgan (1970) to obtain a district representative sample of 172 farmers.

2.3. Analytical Framework

2.3.1. Principal Component Analysis (PCA)

We highlighted 17 attributes, and farmers were asked to rank their responses on a 5-point Likert—type item. Analytically, it is cumbersome to effectively analyze all 17 attributes since some are interrelated, and we are interested in the most dominating and correlated ones. One strategy to get around this impediment is to randomly group constraints into a smaller number of cases. As a result, we hinge on and use data reduction techniques like principal component analysis (PCA) to condense the constraint statements into a few dominant numbers without compromising the broader image presented by these constraints. PCA is a well-known multivariate method for converting multiple correlated variables into linearly uncorrelated principal components [17]. The prime objective of PCA is to minimize the dimensionality of dataset with a large set of interrelated variables while preserving as much variance as possible [18]. This technique allows structure to be extracted from large dataset by extracting eigenvectors from the input distribution that are associated with the largest eigenvalues λ .
As [19] emphasize PCA attempts to reduce the dimensionality of a dataset with a large number of interrelated variables while also tackling the issues of multicollinearity. The reduction is accomplished by converting the original variables into a new collection of uncorrelated variables called principal components (PC), which are structured such that the first few preserve the majority of the variance contained in all of the original dataset [20]. The computational approach for PCA is referred to as eigen analysis, in which the sums of squares and cross products are used to find the eigenvalues λ and eigenvectors of a square symmetric matrix [21]. The number of relevant PC, based on the Kaiser index, is equivalent to the number of eigenvalues λ of the correlation matrix with values greater than one. The eigenvalue is the aggregate of a factor’s squared loadings, and it shows the magnitude of variance that a factor accounts for.
The first principal component is usually matched with the direction of the eigenvector with the highest eigenvalues. The eigenvector corresponding to the second-highest eigenvalue follows a similar pattern, and so on. It’s worth noting that the first component derived in a principal component analysis account for the highest amount of overall variance in the observed variables, implying that the first component would be associated with at least some or all the observed variables under normal circumstances. The extracted second component will have two key features: first, it will account for the highest number of variances in datasets that the first component did not account for, implying that it will be linked to certain variables that had low correlations with the first component. The percentage of variation decreases with each new component such that the first few components are retained. Following [17], principal component analysis can be generically expressed as follows:
Assuming that the new orthonormal basis is U, that each column of U is a one-dimensional unit vector, and we are interested in retaining the system’s K coordinates. Does not lose generalizability supposing it’s the first K component. The new base U = [ U K ,   U ^ K ] is an orthonormal basis. Where, U K is a sub-matrix generated by the first K columns of U, the data matrix is written;
X = U K   Z + U ^ K   Y
Then
[ Z Y ]   = [ U K T U ^ K T ]   X
where
Z = U K T X ,     a n d   Y = U ^ K T X
PCA aims to find the orthonormal matrix U that retains most of the information, U ^ K T omitted and replaced with a matrix, irrespective of the data point. Y is approximated by a matrix with the same for all columns. Let’s call this column b and is bias, then we can approximate Y b 1 T with 1 T     R 1 × N is a row which contains all elements that are equal to one (1). Let assume we want to find U, meaning we have to find b to satisfy
b = a r g   m i n   | | Y   b 1 T | | 2 F   = a r g   m i n   | | U   ^ T K X b 1 T | | 2 F
Solving the derivative equation using the objective function’s b, which equals 0:
( b 1 T   U ^ T K X ) 1 = 0   N b = U ^ T K X 1   b = U ^ T K x , ¯  
w h e r e   1 T 1   = N     a n d   x ¯     = 1 N X 1   i s   t h e   m e a n   v e c t o r   o f   a l l   c o l u m n   i n   X
Note: the original data approximated by
X = U K Z + U ^ K Y       U K Z + U ^ K b 1 T =   U K Z + U ^ K U ^ T K   x ¯   1 T   Δ = X  
PCA is a method of finding an orthonormal matrix U with the best approximation assuming that the means vector x ¯ = 0 . Subsequently, X   X     X = U K Z . PCA’s optimal problem would become
U K Z = a r g m i n U K Z | | X   U K Z | | F
Satisfies U K T U K = 1 K with 1 k R K × K is the unit matrix in K-dimensional space which ensures that U K is an orthonormal basis.
PCA uses the following algorithm:
  • Determine the mean vector for all data
    x ¯ = 1 / N   n = 1 N x n
  • Subtract the means vector from each of the data points:
    x ^ n   = x ^ n x ¯
  • Assume X ^ = [   x ^ 1 ,   x ^ 2 ,   ,   x ^ D ] is an orthonormal data matrix. Then we have the covariance matrix
    S = 1 N   X ^   X ^ T
  • Calculate the covariance matrix’s eigenvalues and eigenvectors, then structure them in descending sequence of eigenvalues.
  • To generate the U K matrix with columns forming an orthogonal system, select K eigenvectors matching the K highest eigenvalues. The main components, or K vectors, form a subspace that is identical to the orthonormal data matrix.
  • Make an orthonormal data matrix projection to the subspace that is found.
  • The dimensions of the data points on the new space make up the new data.
    Z = U K T X ^
The new data can be used to estimate the actual data in the following way: x     U K Z + x ¯ .
The first principal components of this conversion process account for most of the dataset’s information, and the application was motivated by the desire to minimize the number of variables in the Likert items to a smaller set of different composite factors. The PCA scores obtained are continuous and contain a continuum of ratings. In context, respondents were asked to rank constraint attributes on discrete scales. As a result, it may be highly unlikely that two ratings vary by small delta ( δ ) effectively convey varying perceptions. For this reason and estimation brevity, we dichotomize the continuous score gleaned from the PCA into variables in the components that are of more and less interest to the farmers. The variables constructed are analyzed using Hierarchical Model to account for both district and socio-economic characteristics in the explanation of respondent’s perceived interest. The use of the Hierarchical Logistic Model as an estimation mechanism was prompted by the structure of data with farmers nested within their district municipalities and the likelihood of heterogeneity at the household level.

2.3.2. Hierarchical Logistic Model (HLM)

The Multilevel Approach used to examine the PCA-derived constraints indices is described in this section. Following [22], we choose the multilevel logistics system since the response variable is binary. The response variable includes the aggregate score Yij linked to innovation, finance, and crop management attributes by farmer i of district j. The variable Yij = log(pij/1 − pij) where pij denotes the likelihood that the farmer i ranks positively her district j in line with the composite indicator obtained from the PCA. The perceived interest in innovation, farm finance, and crop management practice depends on the characteristics X of the farmer but also on the characteristics W in the district municipality a farmer belongs. Estimating a logistic or classical linear model given the data structure of the association between Y and X and W poses an econometrics barrier.
In this case, some of the underlying assumptions of OLS are violated. Firstly, the household’s assessment of the interest Y or equivalently the error terms in the regression model are likely to be inter-dependent and correlated. Secondly, the equivalence of the variances of errors for all observations in a classical regression model is also invalidated because farmers from different districts municipalities have differing perceptions of the interest of variables and dissimilar assessments. Moreover, there is an increase in model misspecification problems and Type I error [23,24]. To circumvent these estimate barriers and account for heterogeneity at the household level, we leverage the data’s hierarchical structure to construct a Hierarchical Model, precisely, the HLM. We begin by estimating a blank model to see if farmers from different district municipalities assess their district differently on average. The model can be express as follows:
H o u s e h o l d   l e v e l   1   m o d e l   : Y i j = β 0 j   + U i j
D i s t r i c t s   l e v e l   2   m o d e l   :   β i j = Υ 00   + V 0 j
  F u l l   m o d e l                                         :               Y i j = β 0 j   + U i j
The intercept Υ 00 in this model is a fixed effect that summarizes the mean rating score by farmers, while V 0 j is the random effect from the district level. The variation percent of the outcome variable attributable to the district level attributes is p = σ 2   ( V 0 j ) σ 2 ( U i j ) + σ 2 ( V 0 j ) and the percentage of the variation in the score attributable to farmers characteristics is 1 − p. if p is not too low, then it is necessary to add first-level variable in the model, and If 1 − p is not very low it is necessary to incorporate first-level variables. Adding district-level variable is valuable to compensate for the variation. As a result, we estimate the following Random Intercept Model using level 2 predictors:
H o u s e h o l d   l e v e l   1   m o d e l   : Y i j = β 0 j   + U i j
D i s t r i c t s   l e v e l   2   m o d e l   :   β i j = Υ 00   + Υ 01 W j + ν 0 j
  F u l l   m o d e l                                         :               Y i j = Υ 00   + Υ 01 W j + ν 0 j + u i j
W denotes the district level variable. Υ 00 and Υ 01 are the fixed effects, and ν 0 j is the random effect. Then, we add farmers’ attributes X to account for their effect in the variation of evaluation. The matching model is a Random Intercept Model with both levels 1 and 2 regressors. It can be express as follow:
H o u s e h o l d   l e v e l   1   m o d e l   : Y i j = β 0 j   + β 1 j   X i j   + u i j
  F u l l   m o d e l                                             :       Y i j = Υ 00   + Υ 01 W j + Υ 10 X i j + ν 0 j + u i j
Farmers’ level variables, which include socioeconomic data, are denoted by the X. The fixed effects are Υ 00   ,   Υ 01 ,   a n d   Υ 10 , whereas the random effects are ν 0 j   a n d   ν 1 j . Full Maximum Likelihood can be used to evaluate the models (FML). The random effects are summarized via their covariance and variances, whereas the fixed effects are directly estimated. It is possible to compute a log-likelihood test of the HLM vs. Linear Regression or Logistic Regression. Akaike’s Information Criteria (AIC) as well as Bayesian Information Criteria (BIC), can be used to evaluate the overall model performance.

3. Summary Statistics

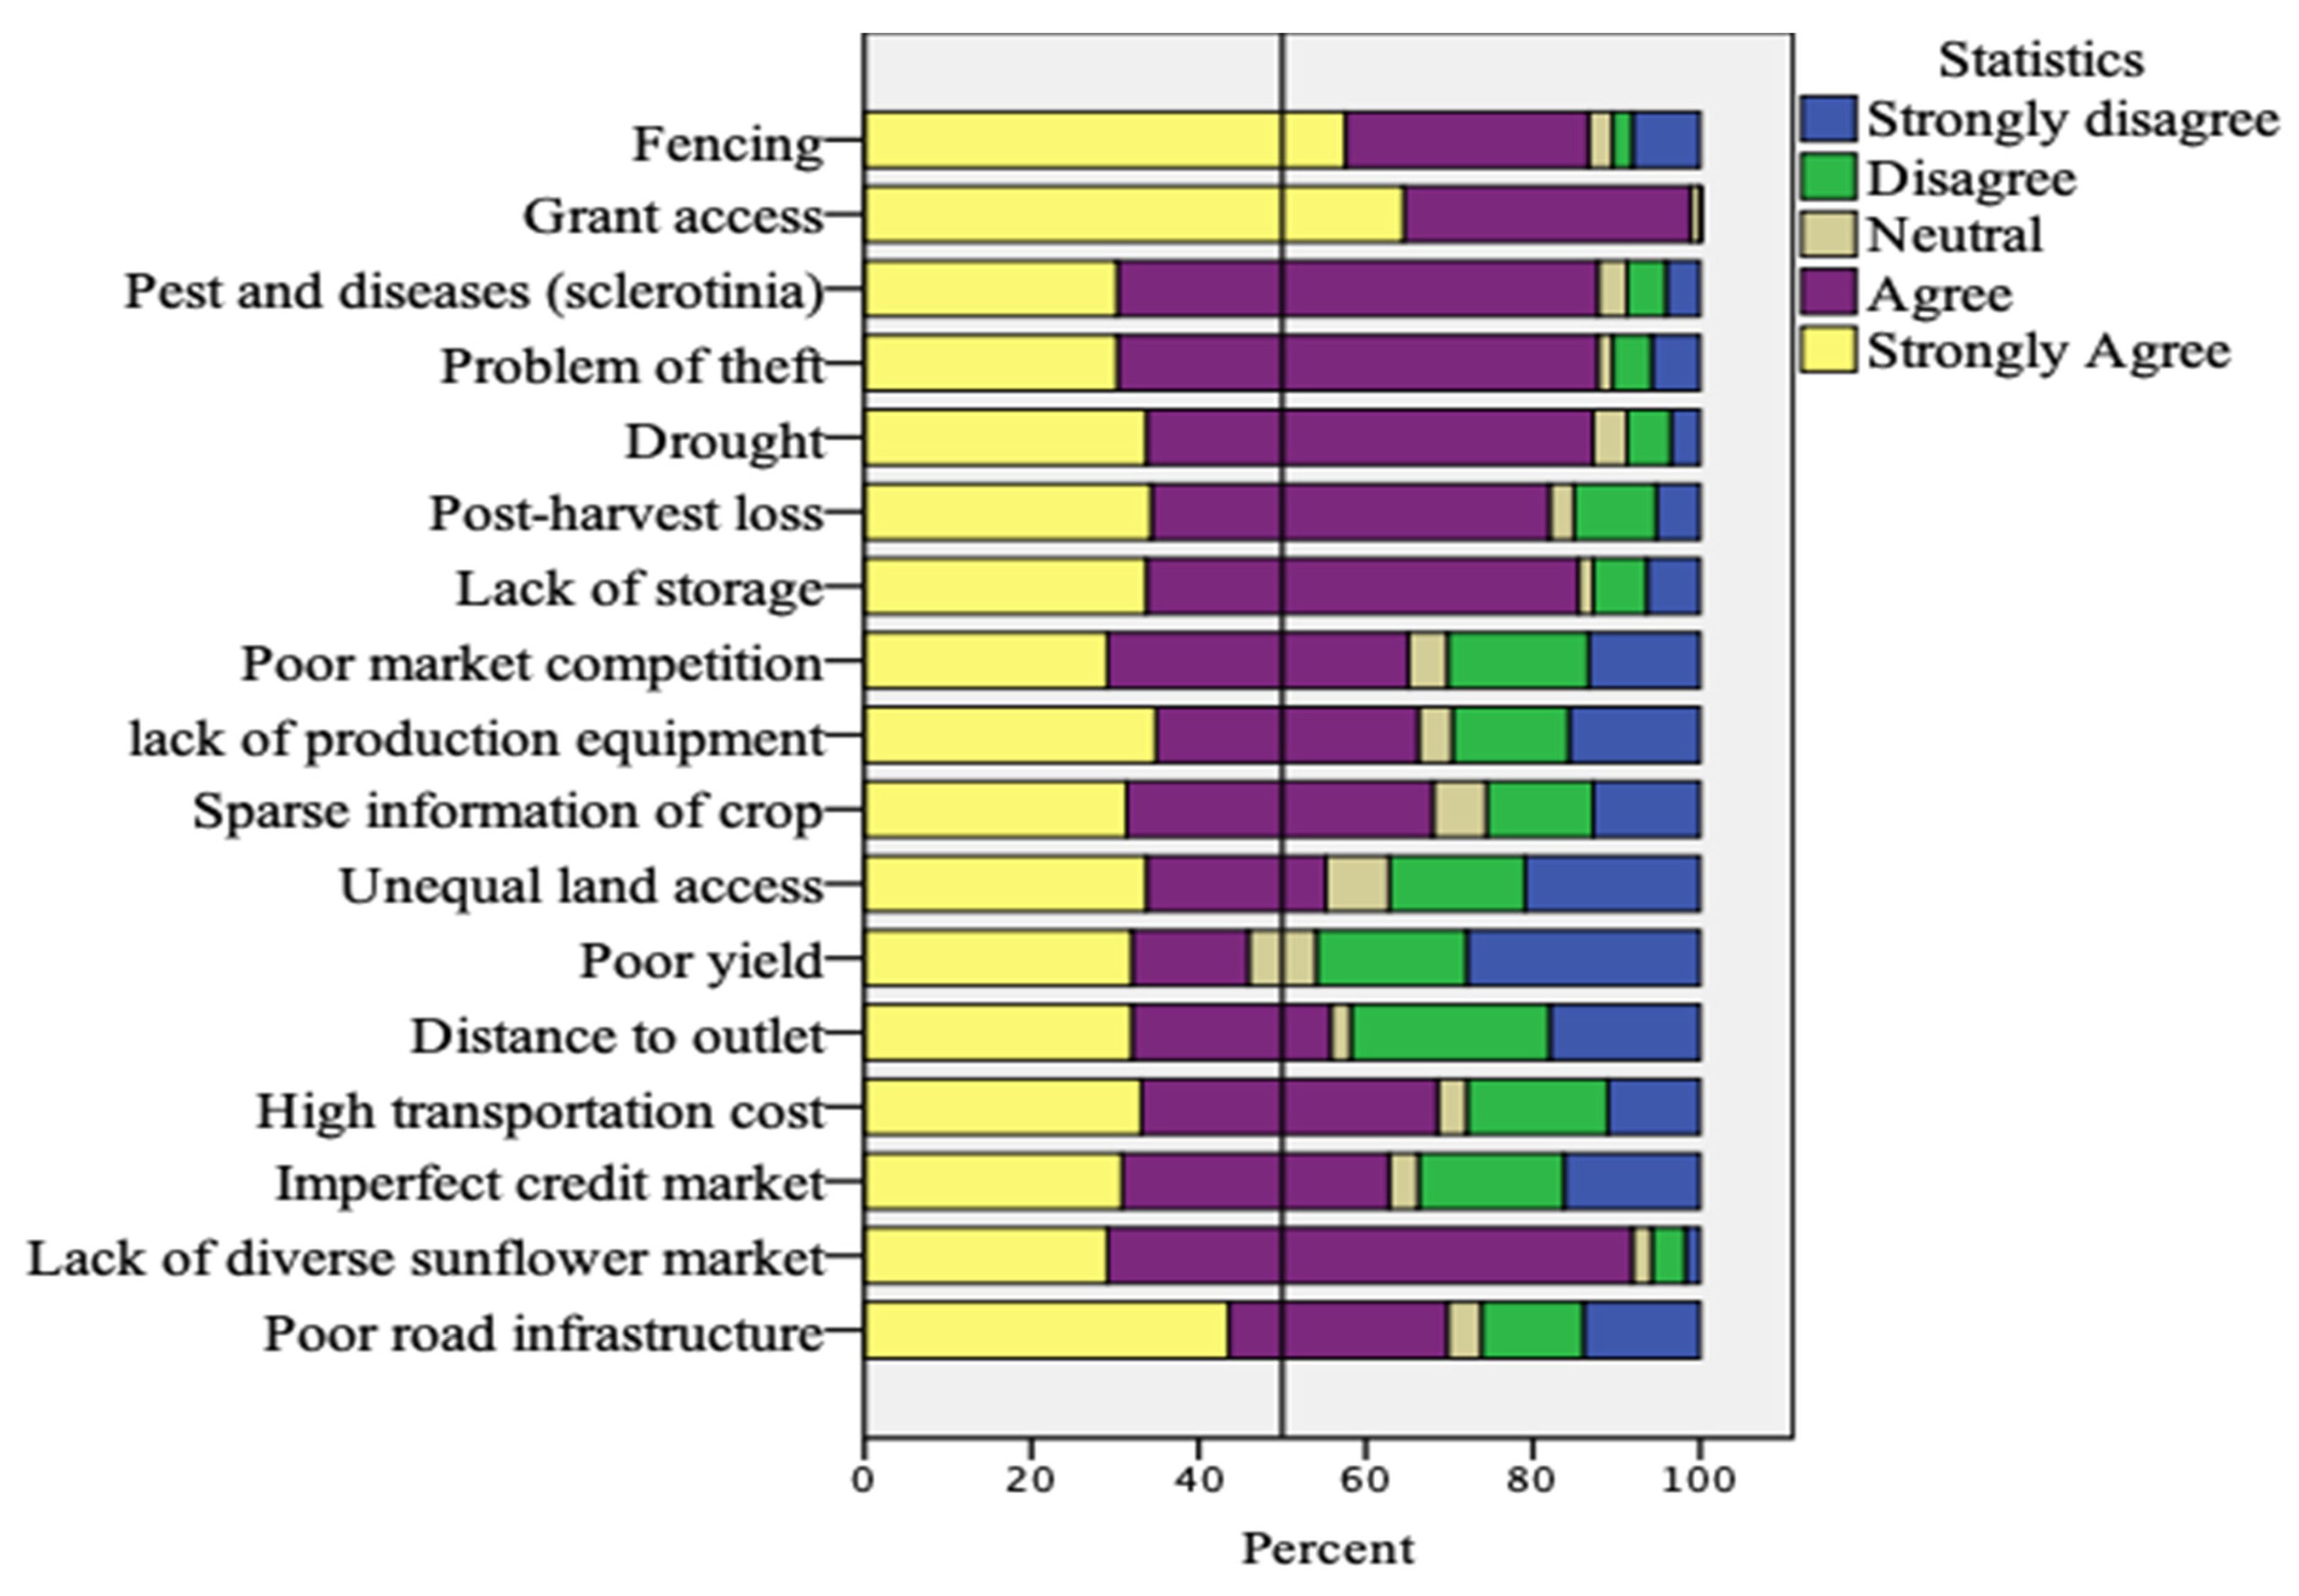
Descriptive Statistics

Table 1 shows descriptive statistics of the respondent’s socio-economic and farm characteristics. We found that about 79.1% of the respondents were male with an average age of 52.55 years, suggesting the existence of gender and age disparities in sunflower production in the study area. This report is similar to [12] findings that women and young people are underrepresented in the sunflower industry in North West Province, South Africa. In many Sub-Saharan African countries, gender and age inequalities cannot be separated from social and cultural imbalances, exclusion from credit markets, unequal resource distribution, and privileges, which are commonly reported by literature as obstacles in integrating into the agricultural sector. Table 1 further presents other household characteristics such as marital status, education, household size, transport and livestock ownership, market distance, access to credit, grant, extension services, market outlet, land size, hectare dedicated for sunflower production, information access, off-farm income, and cooperative membership. Almost 90% of the survey participants have some level of education, and most of them are full-time farmers. Education attainment is a crucial indicator of human capital, as it stimulates the development of skills that would equip a household to earn off-farm income through formal or informal employment, while still having time to engage in farming operations [25,26]. Notwithstanding, when agriculture is not the primary source of income for educated farmers, the variable may yield divergent results. While off-farm earnings is a measure of a household’s reliance on off-farm jobs in its community and surrounding areas, which may impact household labor supply and income earnings [27].
About 77.9% of the households in the polled sample own transportation facilities. Accordingly, transport infrastructure is a measure of a household wealth index and is indispensable for attenuating production and market shocks [25,27,28]. Large landholdings could serve as equity during times of financial distress, while livestock owned, on the other hand, can be marketed to meet immediate working capital requirements of households. At a glimpse, the location characteristics, as described by the distance to market outlets, do not indicate remoteness. The majority of farms (53.5%) in the study area are less than 30 km away from the commonly used market outlet (North West Kooperative [NWK]).
Approximately, 28% are members of agricultural cooperatives. Farmer’s cooperatives are social platforms that promote collaborative engagements, thus play an important role in farming operations. About 58% of the sample households receive grants as input from the government. While grants may facilitate agricultural commercialization by easing farmers’ liquidity and credit pressures, a longer duration of earning social grants may lead to detrimental implications, such as dependency attitude and expectations, which weakens self-reliance and deter farm operations [28,29].
Table 2 presents the frequency distribution of how respondents rated the Likert constraints statement and Figure 1 for graphical representation of responses to constraints statements. One glaring point to take note of is that most respondents rate their responses as “Agree” to most of the constraints statements.

4. Result

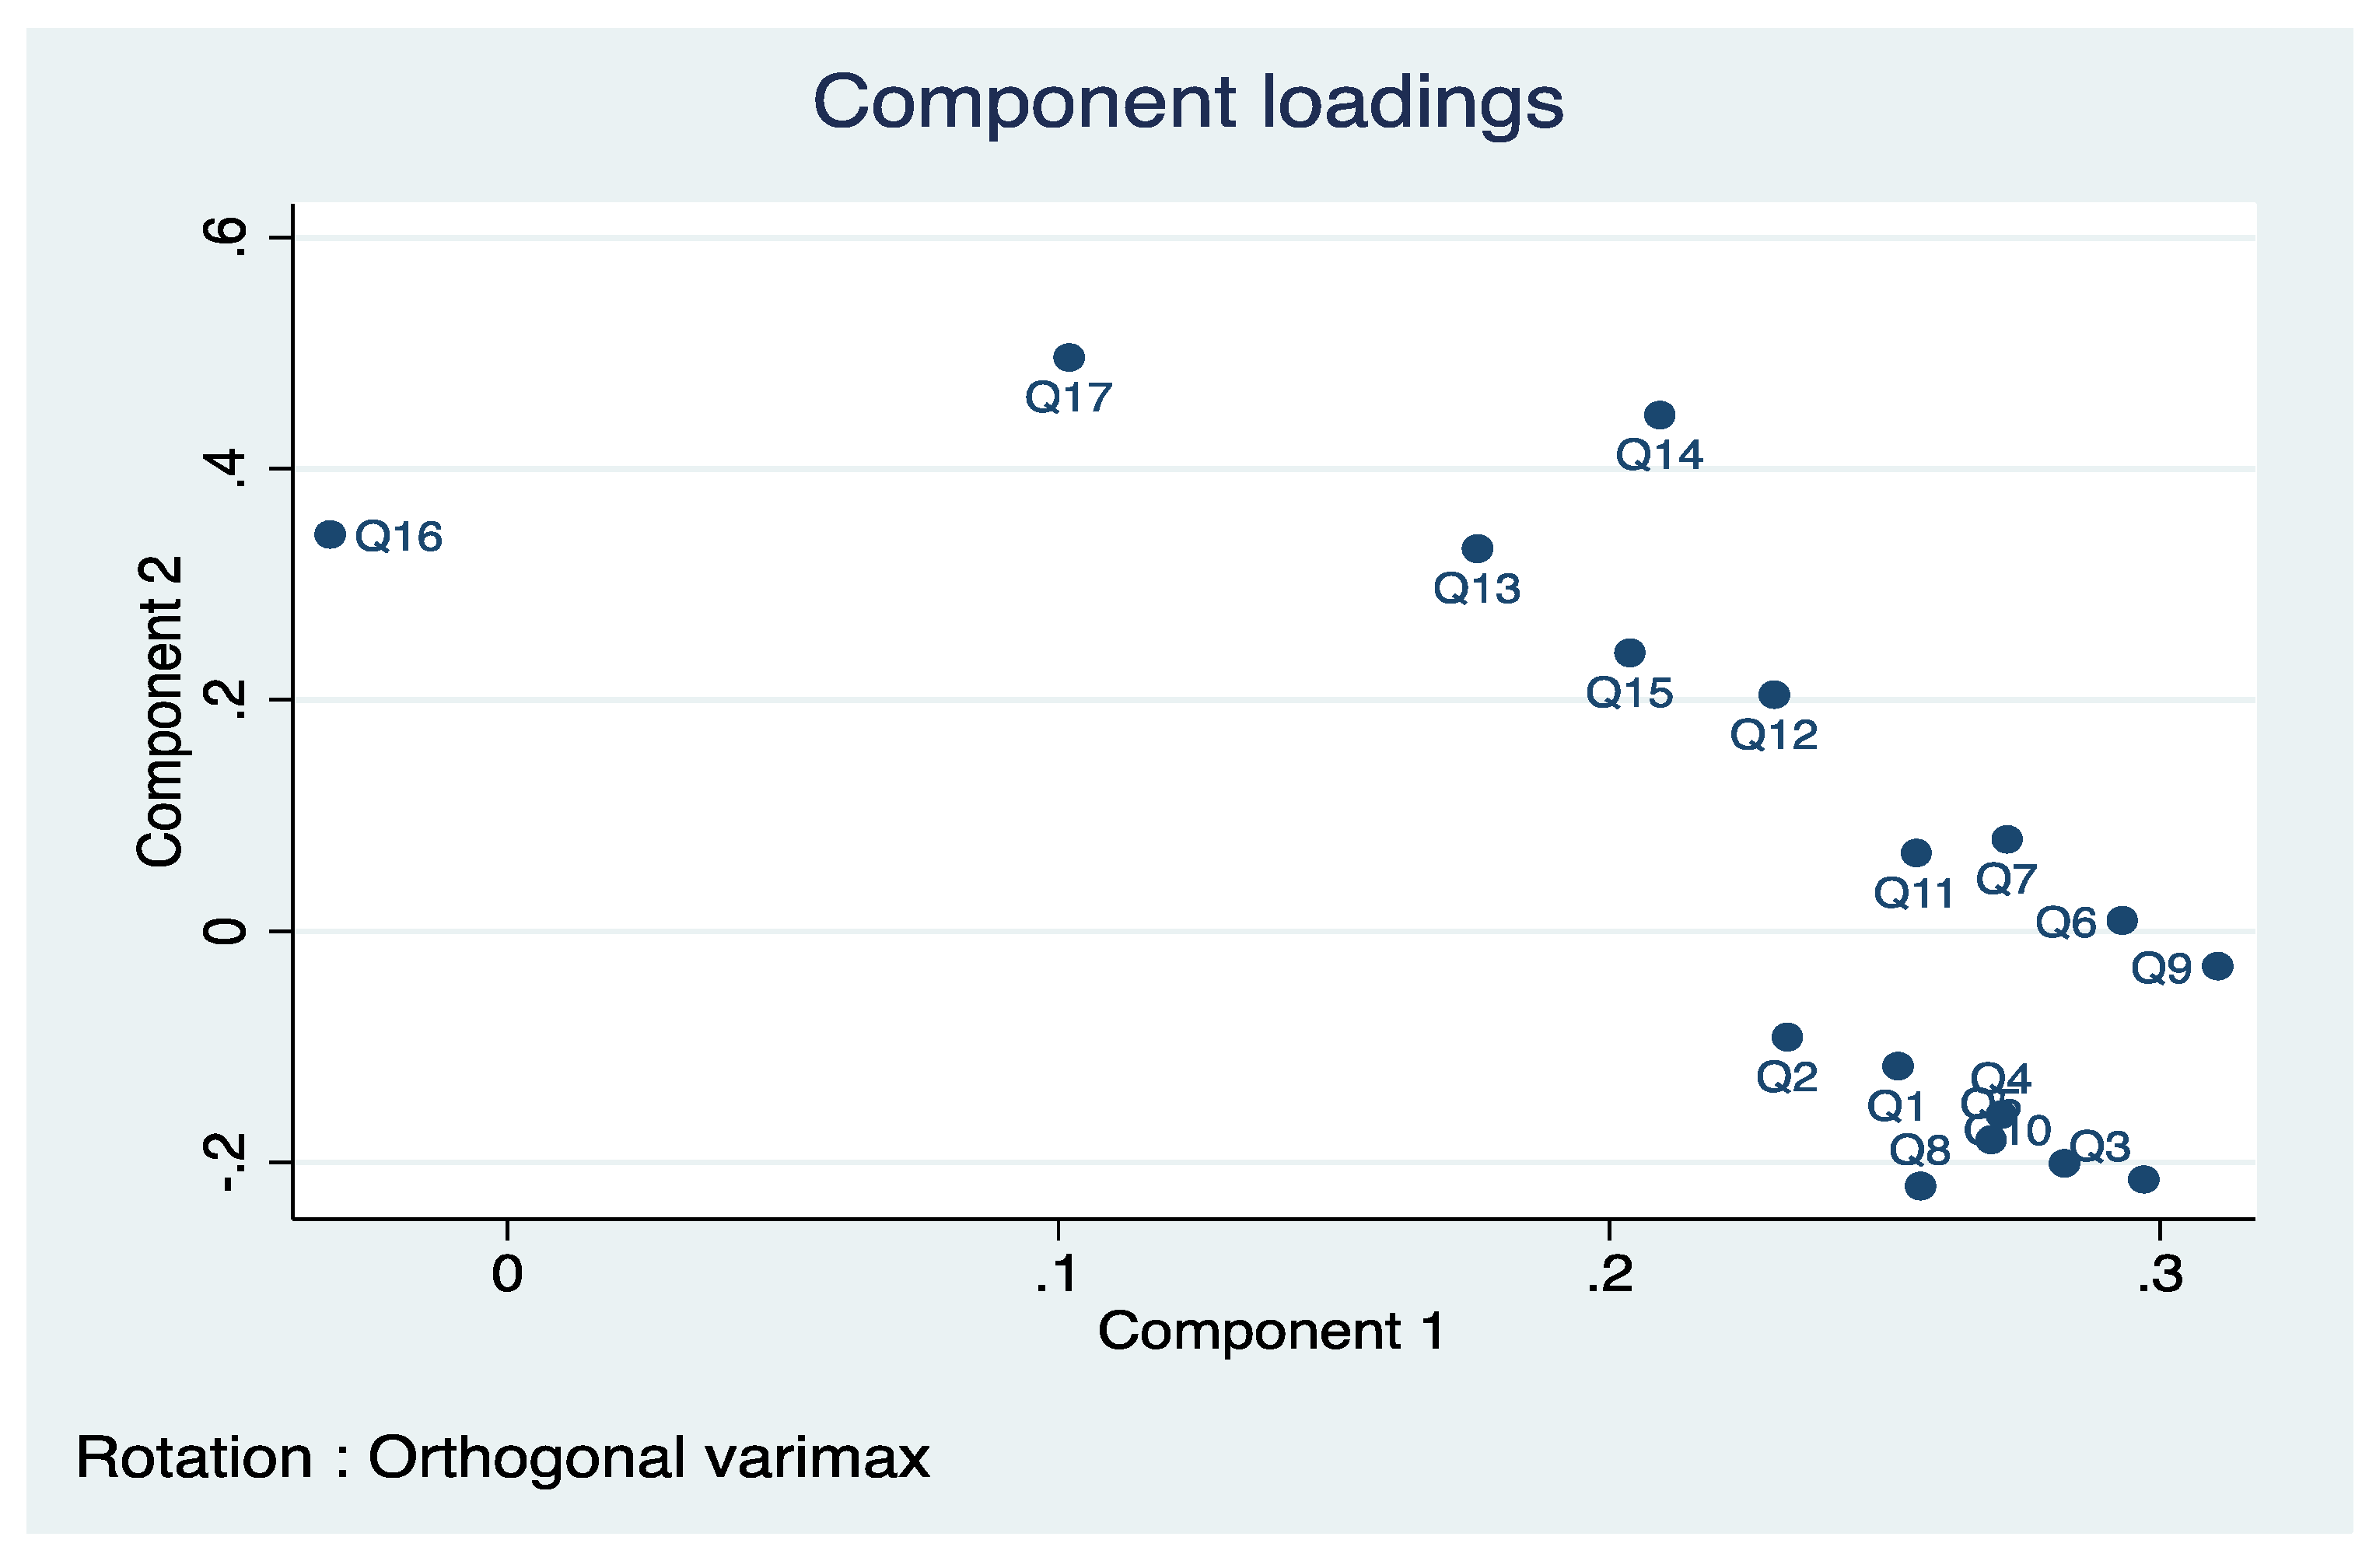
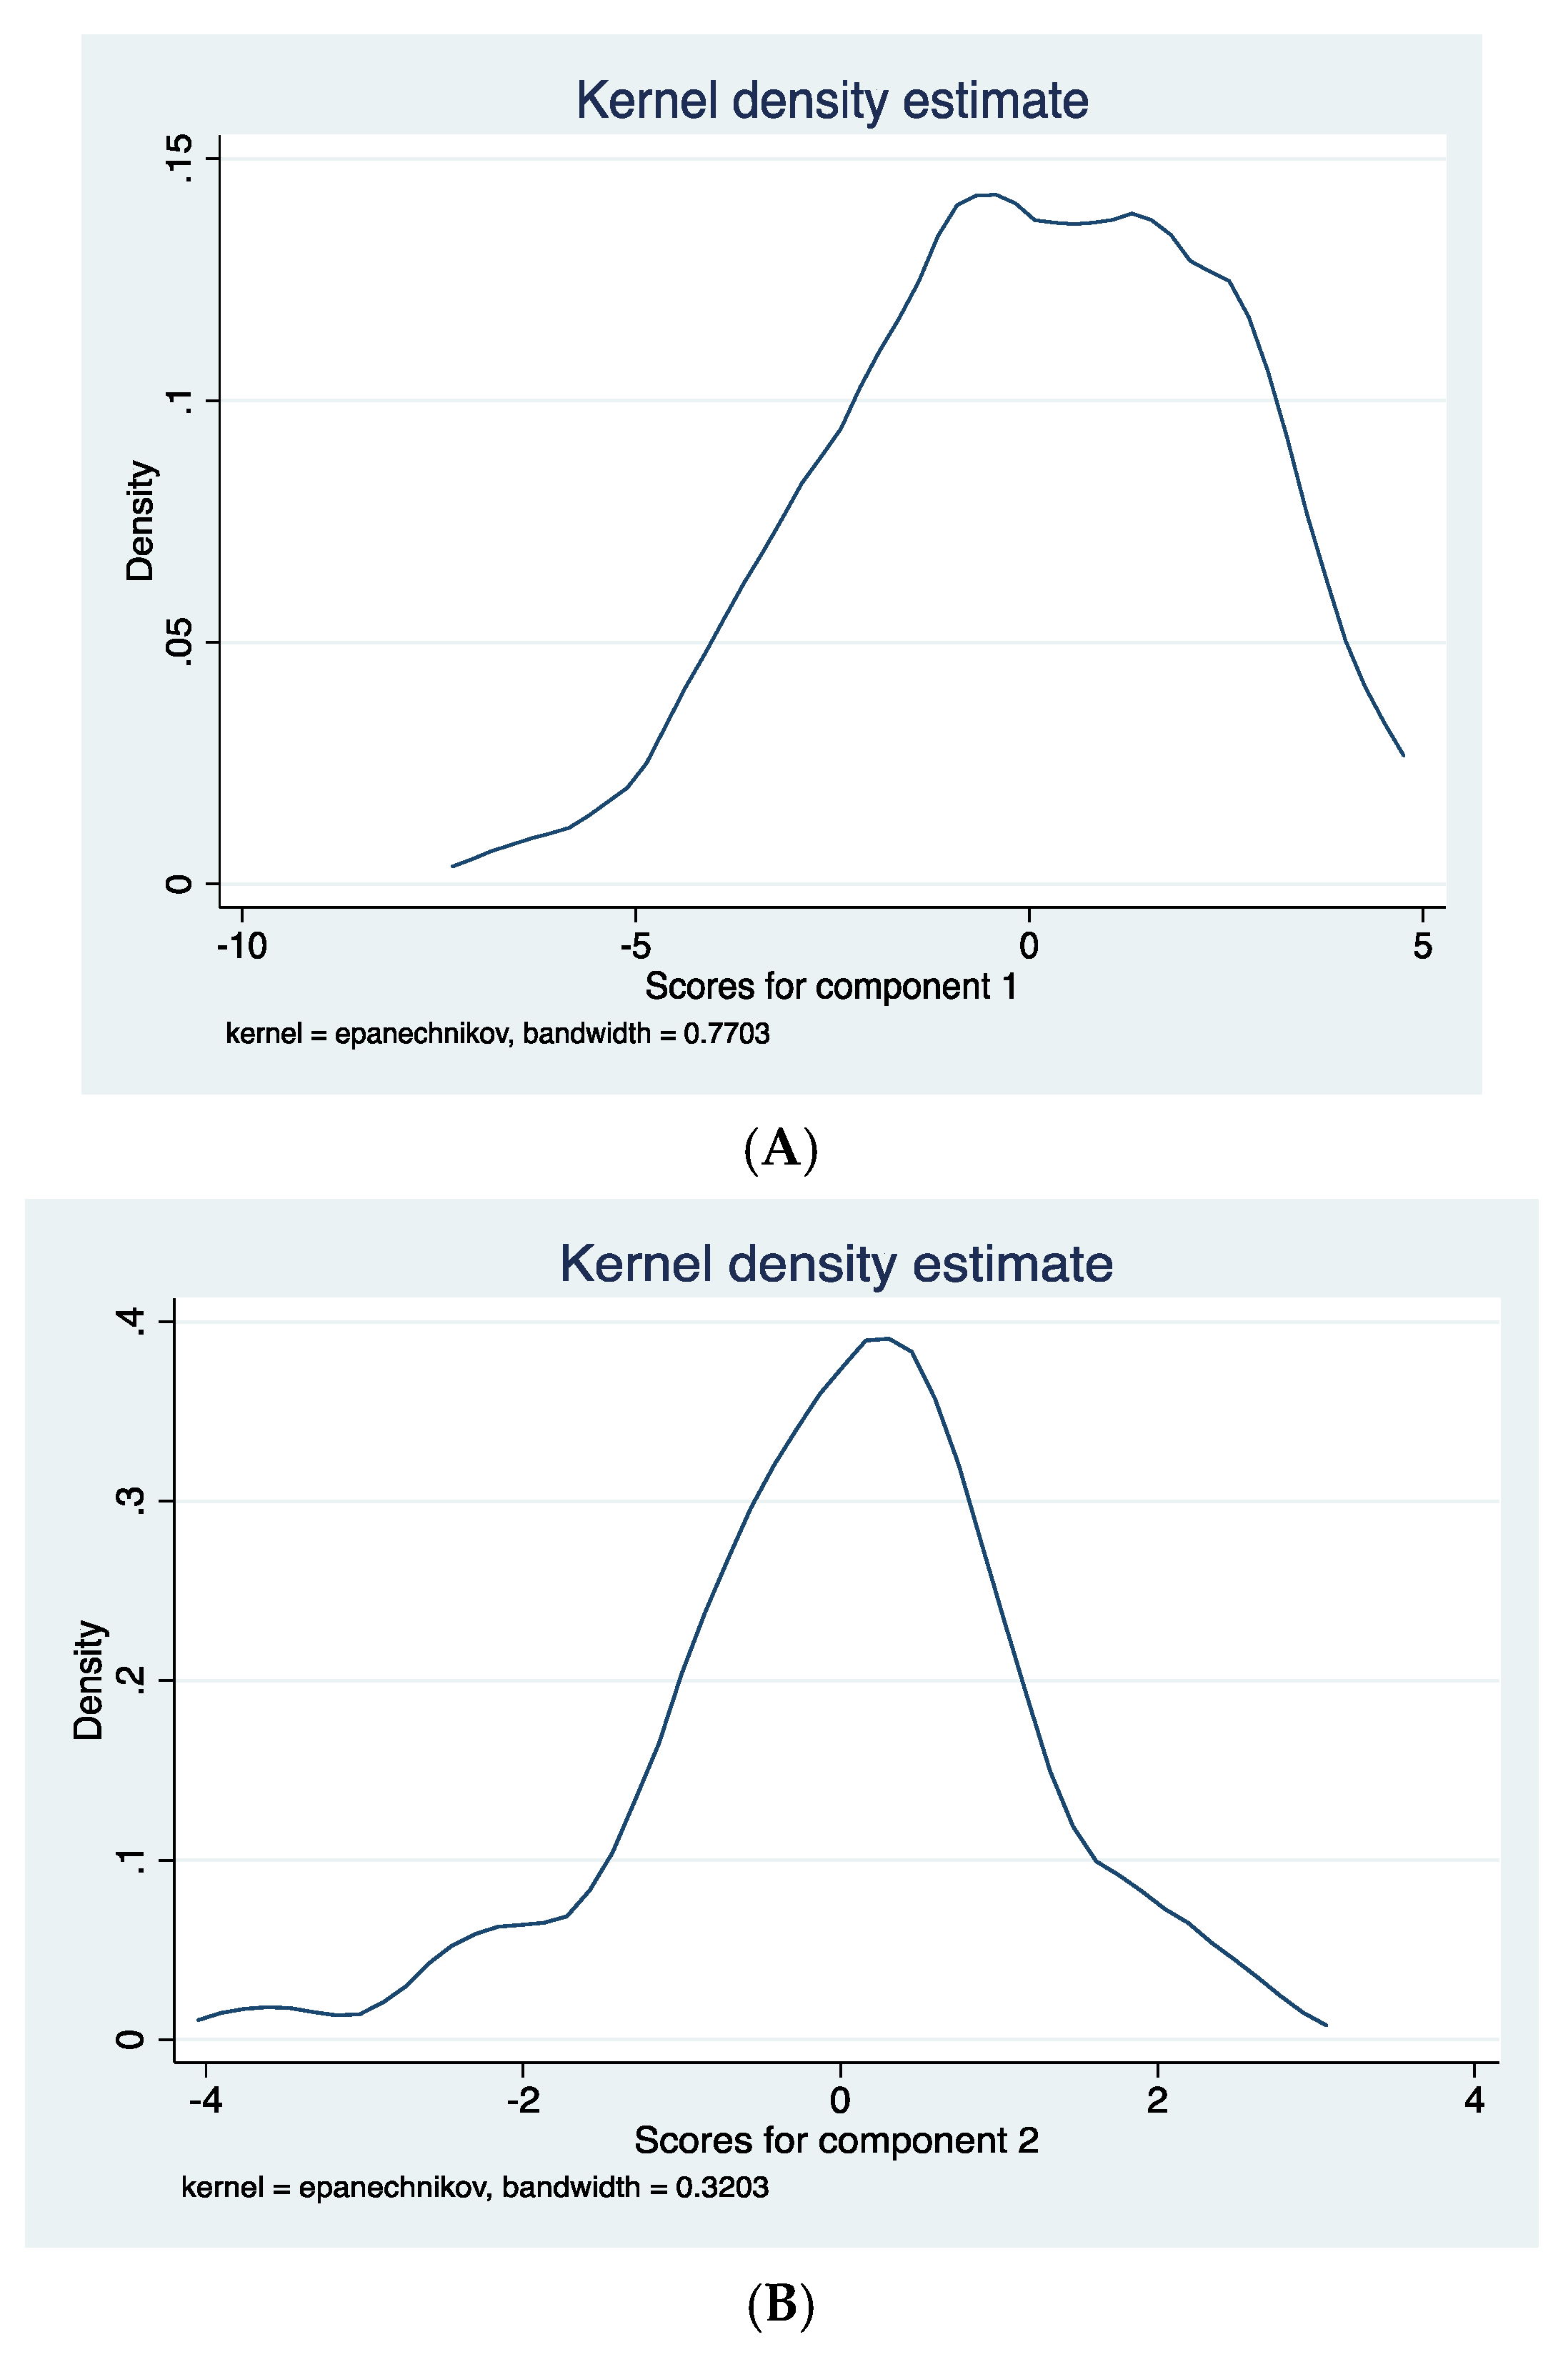
4.1. Aggregation of Factors and Determination of the Dimension of Farmers Perceived Interest in Constraints to Sunflower Production

As stated earlier, Principal Component Analysis (PCA) was used to assess the constraints facing sunflower-producing households. It is essential to note that the score vectors provide the composition of the principal components for the samples (objects), while the loading vectors offer similar compositions for the variables when using PCA. Before PCA, the reliability of the Likert response option (statements) concerning constraint variables was tested using coefficient alpha ( ). The coefficient alpha for the 17 scale attributes employed to capture respondent’s response on constraints is 0.87, which surpassed the threshold level of 0.7, indicating a high degree of reliability. Furthermore, before performing the PCA, we also use the Kaiser- Meyer-Olkin (KMO) sampling adequacy criterion and the Bartlett test of sphericity to examine whether our dataset of 17 variables and 172 surveyed respondents contains sufficient correlation for a justifiable PCA. The cumulative KMO index for our dataset is 0.84, with KMO values higher than the threshold of 0.70 for all individual variables except for unequal access to grants and farmland fencing, while Bartlett’s sphericity test was highly significant as well (p-value 0.001). This indicates that our dataset meets the criteria for a justifiable PCA. Table 3 presents Kaiser–Meyer–Olkin measure of sampling adequacy
The eigenvalues, that represent the actual influence of each factor on the total inertia of the data, are a major output of the PCA. Table 4 shows the eigenvalues and their inputs to the PCA-derived explained variation, while Figure 2 displays the associated scree plots. In effect, the eigenvalues scree plot is inspected to see if there is a “fracture” in the chart, with the residual components representing fewer variations. Following Kaiser’s maxim, which suggests that only retain components with eigenvalues λ which exceed unity in the remainder of the estimation. Subsequently, in our estimation, four components with eigenvalues greater than unity were eventually retained. These four components in the PCA explained 55% of the variation in the original dataset, while the rest components explained relatively less variation.
Considering the number of variables in our datasets, these proportions of the variance explained are widely regarded as permissible. While there is no straightforward criterion for an acceptable explained level of variance, it is plausible and applicable to take into account a solution that explains at least 50% of the overall variance in social sciences where data are not exact and therefore sensitive to random errors [28,30]. We also implemented factor rotation such as orthogonal varimax rotation to the factor loadings index to allow factor loading on the retained components whilst maintaining their autonomy. The objective is to aid interpretation and to optimize the variance of the squared loadings across variables when all factors are added together [31].
Table 5 displays the factor loadings, which show the relationship between the components and the actual variables, and the factor loadings are also shown graphically in Figure 3 and Figure 4 respectively. Perhaps more specifically, it should be noted that Figure 3 and Figure 4 are two-dimensional graphs that represent only components 1 and 2, as much insight cannot be gained from a three-dimensional graph in our context. For the sake of simplicity, factor loadings greater than 0.3 are outlined and deemed reasonably correlated to the relevant components. Principal components are represented by variables with a high correlation (dominant factor loading). For each observation in the data, the scoring coefficients are exploited to predict the values of the four principal components. However, we only offer interpretation for three components, since some of the dominant variables in component four have already emerged in components two and three.
Lack of production facilities (Q9) is the only variable in principal component one (PC1) which explains most of the variance in the constraint statements. This variable has a scoring coefficient of 0.31 exceeding the threshold which represents smallholder sunflower farmers who exhibit high levels of interest on quality production inputs. The variable is better categorized as a component capturing factor relating to innovation. Poor access to agricultural innovation (high-quality inputs) required for production and commercialization, such as farm machinery, automobiles, chemicals, seeds, and fertilizers are major constraints facing households, not only in the sunflower industry but across the smallholding sector. The second principal component (PC2) loads highly on variables Q13, Q14, Q16, and Q17 with scoring coefficients of 0.33, 0.45, 0.34, and 0.46, respectively, as shown in Figure 3. The constraints statement in component 2 represents natural disasters such as drought, high crop theft, unequal access to grants, and lack of fencing. This result signifies their dominance in the constraint statements. The second component is hard to label, but based on the variables with the highest correlation with this component; we can classify it as a factor capturing largely variables related to farm finance. Component 3 loads highly on constraint variables such as poor road infrastructure (Q1), post-harvest loss (Q12), and Sclerotinia sclerotiorum Diseases (Q15), exercising dominance over the remaining original variables. This third component is defined as indicators that capture most of the respondents’ crop management practices. Knowledge and application of optimum crop management strategies are critical in decreasing the effect of post-harvest loss and the prevalence of Sclerotinia sclerotiorum Diseases of sunflower crop.
The kernel density estimates of the scores are shown in Figure 5A–C, and the distribution of the new dimensions derived from PCA appears to be anchored on 0 with significant variations. As previously stated, the new scores are continuous, contrasting with the discrete form of the original datasets. A threshold point of 0 is a worthy contender to categorize the continuous score into variables that are of less interest to farmers i.e., low loadings in components (positive or negative) close to 0 and variables of higher interest to farmers i.e., with higher loadings (positive or negative) greater than 0 in components. We can estimate the binary values to perform a disaggregated analysis of the socioeconomic determinants of farmer’s perceived interest using a Hierarchical Logistic Model. We categorize sets of attributes relating to innovation, finance, and management practices from several features based on farmers’ perceived interest in sunflower production constraints.

4.2. Determinants of Smallholder Sunflower Farmers Perceived Interest in Innovation, Finance, and Crop Management Practice

We build and estimate a Hierarchical Logistic Model in which variance in the score is dependent on both district municipalities and household characteristics to examine the factors that underlie variation in farmers’ perceived interest in the outcome variables. Proceeding with a blank model that is analogous to Equations (1)–(3), highlighted in Section 2.3.2. The result in Table 6, column a, d, and g indicate no significant difference from zero variation from district level variable regarding households perceptions to innovation, finance, and crop management practice dimensions. Cells (b), (e), and (h) feature district-level variable in the model, whereas columns (c), (f), and (i) assess the entire model, including district and household levels regressors. It can be notice that when more controls variables are included, the variance of the residual decreases. The AIC and BIC indicate that the full model is more suitable for the data. As a result, we will focus the interpretation on these models.
The result of the determinants of innovation, finance, and crop management practice of households indicates that there are a number of variables that have significant explanatory power of farmer’s perceived interest. We find that the district level variable has no statistically significant relationship in terms of innovation and farm finance characteristics. On the one hand, the age of household head, household size, and farm size are negatively associated with farmers perceived interest regarding innovation characteristics. The result indicates that since most of the respondents are middle-aged and some clustered within communal land tenure systems, acquiring innovative practices and obtaining production inputs from adjacent farm families will not be a barrier, triggering the negative relationship between farmers’ perceived interest in innovation and age variable. This also implies age disparities in the district sunflower production, with farmers’ interest declining as they get older in terms of their innovation constraints attributes. The result concurs with the findings of [32] studying the adoption of improved maize variety among farming households which revealed an inverse relationship between age and technological innovation. Large farming households pose the capacity to relax labor constraints involved during production, which might have resulted in the negative association with farmer’s perceived interest regarding innovation. Generally, farmers with large farm sizes tend to have better access to technological progress, therefore, justify the lower rating and the negative relationship. This is consistent with [33] study, which reported a negative relationship between farmers with large landholdings and innovation. On the other hand, we find that the age of household heads is the only variable that is statistically significant and positively associated with farmers’ perceived interest in the dimension of farm finance characteristics.
In terms of cooperative membership, the rating is higher and positively associated with farmers perceived interest relating to innovation characteristics but with no significance for the dimension of crop management practice. The role of cooperative membership and dispersion of innovations in agriculture has been studied by several researchers, and it is frequently cited by experts when addressing access, speed, and uptake of innovation. It has been argued, inter alia, that the presence of information and knowledge about innovations among cooperative members increase credence about innovative practices, leading to efficient access, application, and implementation. This validates the positive relationship for farmers belonging to agricultural cooperatives.
We also find that older male sunflower farmers with education, belonging to cooperatives tend to have higher interests (positively associated) in farm finance characteristics. This is not surprising, given that male farmers dominate the sunflower production in the district municipality and are more likely to be keen on attributes regarding farm finance. Since education is a predictor of literacy, it is tenable that the positive association is due to the farmers’ awareness and grasp of financing sources. Surprisingly, none of the household level variables, besides the farming system were found to be statistically significant in determining smallholder sunflower farmers’ perceived interest in crop management practices. However, the municipality level variable appears to be statistically significant and negatively associated with crop management characteristics.

5. Conclusions and Policy Recommendations

Sunflower production is an excellent choice for both local and national agribusiness with significant potential in smallholder farming systems due to low input costs, consistent yields, and a short planting window. However, farmers are faced with interrelated constraints to sustainable and profitable sunflower production. The study examined the socio-economic attributes of smallholder farmers that explain their perceived interest in a set of sunflower production constraints using data from Ngaka Modiri Molema District Municipality, North West Province, South Africa. The research used extant works of literature to design sets of constraints attributes relevant to sunflower production and respondents were asked to rank their responses on these statements.
The study uses principal component analysis (PCA) to agglomerate and condenses information from a large dataset of constraint statements into three main components. The three retain components explained most of the variance in the original dataset. Leveraging the hierarchical structure of the data with farmers nested within their respective local municipalities, we invoke the hierarchical logistic model (HLM) technique to identify the factors that explicate farmer’s perceived interest in innovation, finance, and crop management practices. The findings indicate that farmer’s perceived interest in innovation, finance, and crop management practices are strongly correlated with some of the socioeconomic attributes such as age, education, household size, farm size, farming system, cooperative membership, and gender.
Innovation and farm finance characteristics emerge to be critical elements for sustainable sunflower production. The findings of this study recommend that to promote these elements among smallholder farmers, it is necessary for governments at the district, provincial, and national levels to invest in extension services and education, cooperative organizations, research, and development in disentangling the age, gender, and farm size inequalities existing in the district sunflower production. This will help to boost youth and women participation in sunflower farming operations and stimulate equitable access to land, thus increase farmers’ resilience. Going forward, the result of this study cannot be broadly generalizable as the sample was obtained from a single district due to financial and budgetary limitations, further research incorporating the other district municipalities is needed to comprehend farmers’ perceptions of sunflower production constraints within the province.

Author Contributions

Conceptualization, E.A.A., O.S.O. and S.S.T.; methodology, E.A.A. and O.S.O.; software, E.A.A.; validation, E.A.A.; formal analysis, E.A.A.; investigation, E.A.A.; resources, E.A.A.; data curation, E.A.A.; writing—original draft preparation, E.A.A.; writing—review and editing, E.A.A., O.S.O. and S.S.T.; visualization, E.A.A.; supervision, O.S.O. and S.S.T.; project administration, E.A.A.; funding acquisition, E.A.A., S.S.T. and O.S.O. All authors have read and agreed to the published version of the manuscript.

Funding

This research received no external funding.

Institutional Review Board Statement

Ethical approval and clearance were granted by UNISA-CAES Health Research Ethics Committee (reference number 2020/CAES_HREC/006). The research project adhered to all the values and principles outlined in the Unisa Policy on Research Ethics and Standard Operating Procedure on Research Ethics Risk Assessment.

Informed Consent Statement

Informed consent was obtained from all subjects involved in the study.

Data Availability Statement

The data used in this research are available on request from the corresponding author.

Acknowledgments

The authors would like to express their gratitude to UNISA for partial funding of the study, as well as the cooperation of agricultural officials (Matshidiso Thobatsi) and research participants.

Conflicts of Interest

The authors declare no conflict of interest.

References

  1. Fan, S.; Brzeska, J.; Keyzer, M.; Halsema, A. Subsistence to Profit: Transforming Smallholder Farms; International Food Policy Research Institute: Washington, DC, USA, 2013. [Google Scholar]
  2. Mbaya, E.; Tihanyi, K.; Karaan, M.; Van Rooyen, J. (Eds.) Case Studies of Emerging Farmers and Agribusinesses in South Africa, 1st ed.; Sun Media: Stellenbosch, South Africa, 2011; ISBN 978-1-920338-66. [Google Scholar]
  3. Aliber, M.; Kirsten, M.; Maharajh, R.; Nhlapo-Hlope, J.; Nkoane, O. Overcoming Underdevelopment in South Africa’s Second Economy. Dev. South Afr. 2006, 23, 45–61. [Google Scholar] [CrossRef]
  4. Davison, C.; Paradza, G. Institute for Poverty, Land and Agrarian Studies (PLAAS). Institute for Poverty, Land and Agrarian Studies, University of the Western Cape: Cape Town, South Africa. Available online: https://www.PLAAS_WorkingPaper27ChikazungaParadza.Pdf. (accessed on 16 April 2021).
  5. Louw, A.; Chikazunga, D.; Jordaan, D.; Bienabe, E. Restructuring Food Markets in South Africa Dynamics in Context of the Tomato Sub Sector; Department of Agricultural Economics, Extension and Rural Development University of Pretoria: Pretoira, South Africa, 2006. [Google Scholar]
  6. Matlou, M. Challenges and Constraints for Small-Scale Farmers. Available online: https://www.arc.agric.za/arc-iscw/News%20Articles%20Library/Challenges%20and%20constraints%20for%20small-scale%20farmers.pdf (accessed on 22 April 2021).
  7. Jahari, C.; Kilama, B.; Dube, S.; Paremoer, T. Growth and Development of the Oilseeds-Edible-Oils Value Chain in Tanzania and South Africa. CCRED Working Paper No. 3. 2018. Available online: https://ssrn.com/abstract=3115940or (accessed on 20 April 2021). [CrossRef]
  8. A Profile of the South. African Sunflower Market. Value Chain. Available online: https://www.dalrrd.gov.za/doaDev/sideMenu/Marketing/Annual%20Publications/Commodity%20Profiles/field%20crops/Sunflower%20Market%20Value%20Chain%20Profile%202019.pdf (accessed on 19 November 2020).
  9. Ferdi, M.; Gerhard, V.D.B. The Future of Sunflower Production in South Africa. Available online: https://www.grainsa.co.za/the-future-of-sunflower-production-in-south-africa (accessed on 18 February 2021).
  10. Driving A Sunflower Value Chain in Malawi: Challenges and Opportunities. Available online: https://saiia.org.za/research/driving-a-sunflower-value-chain-in-malawi-challenges-and-opportunities/ (accessed on 2 January 2021).
  11. Adeleke, B.S.; Babalola, O.O. Oilseed crop sunflower (Helianthus annuus) as a source of food: Nutritional and health benefits. Food Sci. Nutr. 2020, 8, 4666–4684. [Google Scholar] [CrossRef] [PubMed]
  12. Lekunze, J.; Antwi, M.A.; Oladele, O.I. Socio-Economic Constraints to Sunflower Production in Bojanala Farming Community of the North-West Province, South Africa. Life Sci. J. 2011, 8, 502–506. [Google Scholar]
  13. Mathagu, H.; Belete, A.; Oluwatayo, I.; Nesamvuni, A. Market Participation of Smallholder Sunflower Farmers in Sekhukhune District of Limpopo Province, South Africa. Agri. Res. Technol. OAJ 2018, 15, 555938. [Google Scholar]
  14. Statistics South Africa. Community Survey 2016 in Brief; Statistics South Africa: Pretoria, South Africa, 2016. Available online: http://www.statssa.gov.za/?page_id=6283 (accessed on 27 April 2021).
  15. Tlholoe, M.M. Smallholder Livestock Farmers’ Willingness to Buy Index-Based Insurance in South Africa: Evidence from Ngaka Modiri Molema District Municipality, North West Province. Master’s Dissertation, North-West University, Potchefstroom, South Africa, 2016. [Google Scholar]
  16. Harpe, S.E. How to Analyze Likert and Other Rating Scale Data. Curr. Pharm. Teach. Learn. 2015, 7, 836–850. [Google Scholar] [CrossRef]
  17. Mahmoudi, M.R.; Heydari, M.H.; Qasem, S.N.; Mosavi, A.; Band, S.S. Principal Component Analysis to Study the Relations between the Spread Rates of COVID-19 in High Risks Countries. Alex. Eng. J. 2021, 60, 457–464. [Google Scholar] [CrossRef]
  18. Jolliffe, I.T. Principal Component Analysis, 2nd ed.; Springer Series in Statistics; Springer: New York, NY, USA, 2002; ISBN 978-0-387-95442-4. [Google Scholar]
  19. Paragas, E.J.S.; Barrios, E.B. Multilevel Principal Component Regression Model for High Dimensional Data: A Simulation Study. Available online: https://psa.gov.ph/content/multilevel-principal-component-regression-model-high-dimensional-data-simulation-study (accessed on 10 May 2021).
  20. Mishra, S.; Sarkar, U.; Taraphder, S.; Datta, S.; Swain, D.; Saikhom, R.; Panda, S.; Laishram, M. Principal Component Analysis. Int. J. Livest. Res. 2017, 7, 60–78. [Google Scholar] [CrossRef]
  21. Paul, L.C.; Suman, A.A.; Sultan, N. Methodological Analysis of Principal Component Analysis (PCA) Method. Int. J. Comput. Eng. Manag. 2013, 16, 32–38. [Google Scholar]
  22. Wong, G.Y.; Mason, W.M. The Hierarchical Logistic Regression Model for Multilevel Analysis. J. Am. Stat. Assoc. 1985, 80, 513–524. [Google Scholar] [CrossRef]
  23. Alia, D.Y.; Kacthova, A.; Woods, T.A. Assessing the Performance of Food Co-ops in the US; Southern Agricultural Economics Association: San Antonio, TX, USA, 2016. [Google Scholar]
  24. Feldstain, A.; Woltman, H.; MacKay, J.; Rocci, M. Introduction to Hierarchical Linear Modeling. Tutor. Quant. Methods Psychol. 2012, 8, 62–69. [Google Scholar] [CrossRef] [Green Version]
  25. Kondo, E. Market Participation Intensity Effect on Productivity of Smallholder Cowpea Farmers: Evidence from The Northern Region of Ghana. RAAE 2019, 22, 14–23. [Google Scholar] [CrossRef] [Green Version]
  26. Mugandani, R.; Mafongoya, P. Behaviour of Smallholder Farmers towards Adoption of Conservation Agriculture in Zimbabwe. Soil Use Manag. 2019, 35, 561–575. [Google Scholar] [CrossRef]
  27. Manda, J.; Alene, A.D.; Tufa, A.H.; Feleke, S.; Abdoulaye, T.; Omoigui, L.O.; Manyong, V. Market Participation, Household Food Security, and Income: The Case of Cowpea Producers in Northern Nigeria. Food Energy Secur. 2020, 9, e211. [Google Scholar] [CrossRef] [PubMed]
  28. Wale, E.; Chipfupa, U.; Nolwazi, H. Towards Identifying Enablers and Inhibitors to On-Farm Entrepreneurship: Evidence from Smallholders in KwaZulu-Natal, South Africa. Heliyon 2021, 7, e05660. [Google Scholar] [CrossRef] [PubMed]
  29. Sinyolo, S.; Mudhara, M.; Wale, E. The Role of Social Grants on Commercialization among Smallholder Farmers in South Africa: Evidence from a Continuous Treatment Approach. Agribusiness 2019, 35, 457–470. [Google Scholar] [CrossRef]
  30. Peterson, R.A. A Meta-Analysis of Variance Accounted for and Factor Loadings in Exploratory Factor Analysis. Mark. Lett. 2000, 11, 261–275. [Google Scholar] [CrossRef]
  31. Osborne, J.W. What Is Rotating in Exploratory Factor Analysis? Pract. Assess. Res. Eval. 2015, 20, 2. [Google Scholar] [CrossRef]
  32. Danso-Abbeam, G.; Bosiako, J.A.; Ehiakpor, D.S.; Mabe, F.N. Adoption of Improved Maize Variety among Farm Households in the Northern Region of Ghana. Cogent Econ. Financ. 2017, 5, 1416896. [Google Scholar] [CrossRef]
  33. Msangi, H.; Mdoe, N. Examining the Inverse Relationship between Farm Size and Technical Efficiency in Tanzanian Agriculture. Master’s Dissertation, Sokoine University of Agriculture, Morogoro, Tanzania, 2016. [Google Scholar]
Figure 1. Graphical representation of Likert scale responses.
Sustainability 13 13331 g001
Figure 2. Scree plot of eigenvalues after PCA.
Sustainability 13 13331 g002
Figure 3. Component loadings after rotation.
Sustainability 13 13331 g003
Figure 4. Respondents’ loadings after rotation.
Sustainability 13 13331 g004
Figure 5. (AC). Kernel density plot of the scores derived from PCA.
Sustainability 13 13331 g005aSustainability 13 13331 g005b
Table 1. Shows some of the survey households’ demographic characteristics.
Socio-Economic AttributesMinimumMaximumMeanStandard Deviation
Age219052.5512.324
Household size0205.762.556
Hectare dedicated for sunflower11241113.39140.23
Tons produce190882.12114.64
Variables Frequency Percent (%)
Gender
Male 79.1 136
Female 20.9 36
Marital Status
Single 21.5 37
Married 61.0 105
Divorced 2.9 5
Widowed 9.3 16
Education Level
Educated 89.5 154
Not Educated 10.5 18
Land size
Less than 1 hectare 10 5.8
1–100 ha 93 54.1
101–200 ha 50 29.1
201–300 ha 11 6.4
Above 300 ha 8 4.7
Means of Transport
Private vehicle 134 77.9
Hires transport 38 22.1
Market Outlet
NWK 142 82.6
NWK/Others 30 17.2
Market Distance
0–30 km 92 53.5
31–60 km 52 30.2
61–90 km 24 14.0
Above 90 km 4 2.3
Access to Grant (Subsides)
Yes 101 58.7
No 71 41.3
Cooperative membership
Yes 47 27.3
No 125 72.7
Farming system
Dry land 143 83.14
Irrigated 29 16.86
Livestock owned
Yes 114 66.28
No 58 33.72
Land tenure system
Communal 81 47.1
Others 91 52.9
Table 2. Distribution (%) of Likert item responses of the constraint statements.
VariablesStrongly AgreeAgreeNeutralDisagreeStrongly Disagree
Poor road infrastructure (Q1)43.626.24.112.214.0
Lack of diverse market for sunflower (Q3)29.162.82.34.11.7
Imperfect credit market (Q2)30.832.03.517.416.3
High cost of transport (Q4)33.135.53.516.911.0
Distance to market (Q5)32.023.82.323.818.0
Poor yield of sunflower crop (Q6)32.014.08.118.027.9
Unequal land allocation (Q7)33.721.57.616.320.9
Sparse information of crop (Q8)31.436.66.412.812.8
Lack of production facilities (Q9)34.931.44.114.015.7
Poor market competition (Q10)29.136.04.716.913.4
Lack of storage infrastructure (Q11)33.751.71.76.46.4
Post-harvest loss (Q12)34.347.72.99.95.2
Natural disaster ([drought], Q13)33.754.54.15.23.5
High theft (Q14)30.257.61.74.75.8
Problem of pest and diseases ([sclerotinia], Q15)30.257.63.54.74.1
Unequal access to grant ([subsidies and inputs], Q16)64.534.31.200
Lack of farmland fencing (Q17)57.629.12.92.38.1
Table 3. Kaiser–Meyer–Olkin measure of sampling adequacy.
VariableKMO
Poor road infrastructure (Q1)0.8762
Lack of diverse market for sunflower (Q3)0.8467
Imperfect credit market (Q2)0.8285
High cost of transport (Q4)0.8206
Distance to market (Q5)0.8437
Poor yield of sunflower crop (Q6)0.8535
Unequal land allocation (Q7)0.9144
Sparse information of crop (Q8)0.8729
Lack of production facilities (Q9)0.8436
Poor market competition (Q10)0.8612
Lack of storage infrastructure (Q11)0.8605
Post-harvest loss (Q12)0.7978
Natural disaster ([drought], Q13)0.8911
High theft (Q14)0.7807
Problem of pest and diseases ([sclerotinia], Q15)0.7884
Unequal access to grant ([subsidies and inputs], Q16)0.4456
Lack of farmland fencing (Q17)0.6514
Overall0.8398
Table 4. Principal components, eigenvalues, and proportion of variance explained by PCA.
ComponentsEigenvalueDifference% of VarianceCumulative
Comp15.744.400.340.38
Comp21.340.170.080.42
Comp31.170.080.070.48
Comp41.090.130.060.55
Comp50.960.020.060.60
Comp60.930.160.050.66
Comp70.770.010.040.70
Comp80.760.050.040.75
Comp90.710.030.040.79
Comp100.670.050.040.83
Comp110.630.130.040.87
Comp120.490.050.030.89
Comp130.450.040.030.92
Comp140.400.050.020.95
Comp150.360.710.020.97
Comp160.280.060.020.99
Comp170.22 0.011.00
Table 5. Factor loadings and proportion of variance unexplained by PCA.
Description and VariablesComp1Comp2Comp3Comp4Unexplained
Poor road infrastructure (Q1)0.25−0.120.31−0.180.46
Imperfect credit market (Q2)0.23−0.090.07−0.270.59
Lack of diverse market for sunflower (Q3)0.29−0.210.04−0.140.41
High cost of transport (Q4)0.27−0.160.29−0.050.44
Distance to market (Q5)0.27−0.180.260.100.45
Poor yield of sunflower crop (Q6)0.290.010.160.160.45
Unequal land allocation (Q7)0.270.080.120.100.54
Sparse information of crop (Q8)0.26−0.22−0.310.130.42
Lack of production facilities (Q9)0.31−0.030.010.20040
Poor market competition (Q10)0.28−0.20−0.120.050.46
Lack of storage infrastructure (Q11)0.250.07−0.260.220.48
Post-harvest loss (Q12)0.230.20−0.380.200.46
Natural disaster ([drought, wildfire and flood], Q13)0.180.330.04−0.050.67
High sunflower products theft (Q14)0.210.45−0.09−0.350.33
Problem of Sclerotinia sclerotiorum Diseases (Q15)0.200.24−0.45−0.120.43
Unequal access to grant ([subsidies and inputs], Q16)−0.030.340.290.690.22
Lack of farmland fencing (Q17)0.100.460.33−0.240.42
Table 6. Hierarchical Logistic Model of the drivers for perceptions to innovation, finance, and crop management practice.
InnovationFarm FinanceCrop Management Practice
ABCDEFGHI
Fixed Effect Constant0.50850.6037 **0.34310.1433 **0.04010.24850.1109 **0.2097 ***−0.0234
(0.1159)(0.3075)(0.2669)(0.0467)(0.1000)(0.2314)(0.0395)(0.0463)(0.2211)
Muncipality −0.03110.0088 0.04010.0267 −0.0374 **−0.0374 **
(0.0982)(0.0328)(0.0344)(0.0232)(0.0177)(0.0183)
Age −0.0065 ** 0.0052 ** −0.0003
(0.0026)(0.0023)(0.0023)
Household Size −0.0376 ** 0.0012 −0.0082
(0.0125)(0.0113)(0.0110)
Farm size −0.0005 ** 0.0001 −0.0001
(0.0002)(0.0001)(0.0002)
Marital status −0.0369 −0.0133 0.0271
(0.0627)(0.5668)(0.0553)
Education −0.1218 0.1599 * 0.0219
(0.1019)(0.0921)(0.0897)
Market outlet −0.3141 −0.0682 0.0999
(0.0817)(0.0739)(0.0721)
Gender 0.1561 0.1137 *** −0.0268
(0.0395)(0.0357)(0.0349)
Cooperative Membership 0.1384 ** 0.1176 ** 0.0018
(0.0679)(0.0613)(0.0598)
Farm system 0.1305 −0.1459 0.1377 *
(0.0887)(0.0801)(0.0781)
Random effect
Var (_cons)
0.04720.07070.00160.00420.00480.00190.00251.44 × 10−22.63 × 10⁻²
(0.0480)(0.0730)(0.0119)(0.008)(0.0123)(0.0908)(0.0042)(2.93 × 10²)(5.83 × 10⁻²)
AIC247.3252.1243.9145.3150.8211.5121.2126.2203.7
BIC256.7264.7291.1154.7163.4258.7130.7138.8250.9
The outcome variables are dummy variables with 1 corresponding to farmers having higher interest (positive score). Standard errors in parentheses, * p < 0.1, ** p < 0.05, *** p < 0.01.
Publisher’s Note: MDPI stays neutral with regard to jurisdictional claims in published maps and institutional affiliations.

