Proceeding Paper

Quantitative Estimation of Land Surface Temperature and Its Relationship with Land Use/Cover around Sonipat District, Haryana, India †

1
Amity School of Natural Resources & Sustainable Development, Amity University Uttar Pradesh, Sector 125, Noida 201301, Uttar Pradesh, India
2
School of Environment and Sustainable Development, Central University of Gujarat, Sector 30, Gandhinagar 382030, Gujarat, India
*
Author to whom correspondence should be addressed.
Presented at the 16th International Workshop on Advanced Infrared Technology & Applications, 26–28 October 2021; Available online: https://aita2021.sciforum.net/.
Eng. Proc. 2021, 8(1), 31; https://doi.org/10.3390/engproc2021008031
Published: 8 December 2021

Abstract

:
Urbanization is a human activity that changes the surface of the earth and degrades the surroundings of major cities all over the world. The problem is more acute in many developing cities with a high population and rapid economic growth. The present study focuses on the effect of land use/land cover (LULC) on the land surface temperature (LST) in Sonipat district, Haryana India. The LULC derived from multispectral satellite data of two periods, 2011 and 2021, indicated a significant increase in urban areas by (3%) and barren and fallow land by (7%), whereas crop land has decreased by (11%) and water bodies have remained the same, in comparison with 2011. The LST, derived from a thermal infrared sensor, showed an overall increase in LST by 5 °C from 2011 to 2021. The results also showed that there was a significant LST difference across the LULC units. Pearson’s correlation analysis results showed an inverse correlation between LST and NDVI across urban areas and other land use classes, whereas a positive correlation over water bodies were observed in the study area. Therefore, LST and its relationship with NDVI via LULC, is a key parameter to investigate the thermal glitches in an urban ecosystem. This can be adopted as a useful tool for analyzing the environmental influence on the ecological unit.

1. Introduction

The implications of the changes in land use and land cover affect all regions and sectors. Land cover is a remarkable feature on the earth’s surface that is influenced by several present-day human activities. Climate is greatly affected by the human activities through changes in land use/land cover (LULC) at spatio-temporal level [1], such as growing food, cutting trees, building cities or covering the physical characteristics of the land surface in other ways, e.g., comprising grain crops, trees, or concrete [2]. This change in land can have positive and negative effects on human well-being [3]. The review of the link between land surface temperature (LST) and land use/cover has immense relevance in understanding the changing dynamics of the environment [4]. Various factors contribute to LST, varying from direct to indirect. The most visible effect of anthropogenic activities, at regional and local levels, are therefore changes in the LULC, which changes the surface energy balance, in turn influencing the surface temperature and changing the microclimate of the region [5]. Previously, scientists used the meteorological temperature of weather stations, which was discontinuous and necessitated extrapolation [6]. Today, however, the LULC change can be measured continuously over time and space, utilizing remote sensing techniques [7]. Remote sensing is a relatively cost effective and easier way of achieving up-to-date data about a large geographic area, and providing data about remote areas that are inaccessible [8]. The focus of this study was to investigate the connection between LULC and LST, defined by the temporal and spatial variations in the Sonipat District of Haryana. A quantitative analysis of the link between LULC and LST showed the cause-effect analysis and the statistical relationship between these two parameters, and the land surface temperature rises in one decade.

2. Study Area

The Sonipat district was chosen as the study area for this work. It falls under the National Capital Region. The district headquarters are in the city of Sonipat. Sonipat borders the states of Delhi and Uttar Pradesh. The overall climate of the Sonipat district remains dry with a hot summer, cold winter, and a rainy season for 3 months in July, August, and September. Winter starts in December. January is the coldest month, and the summer months are May and June with the maximum temperatures. Light rains appear in December, January, and February.

3. Methodology

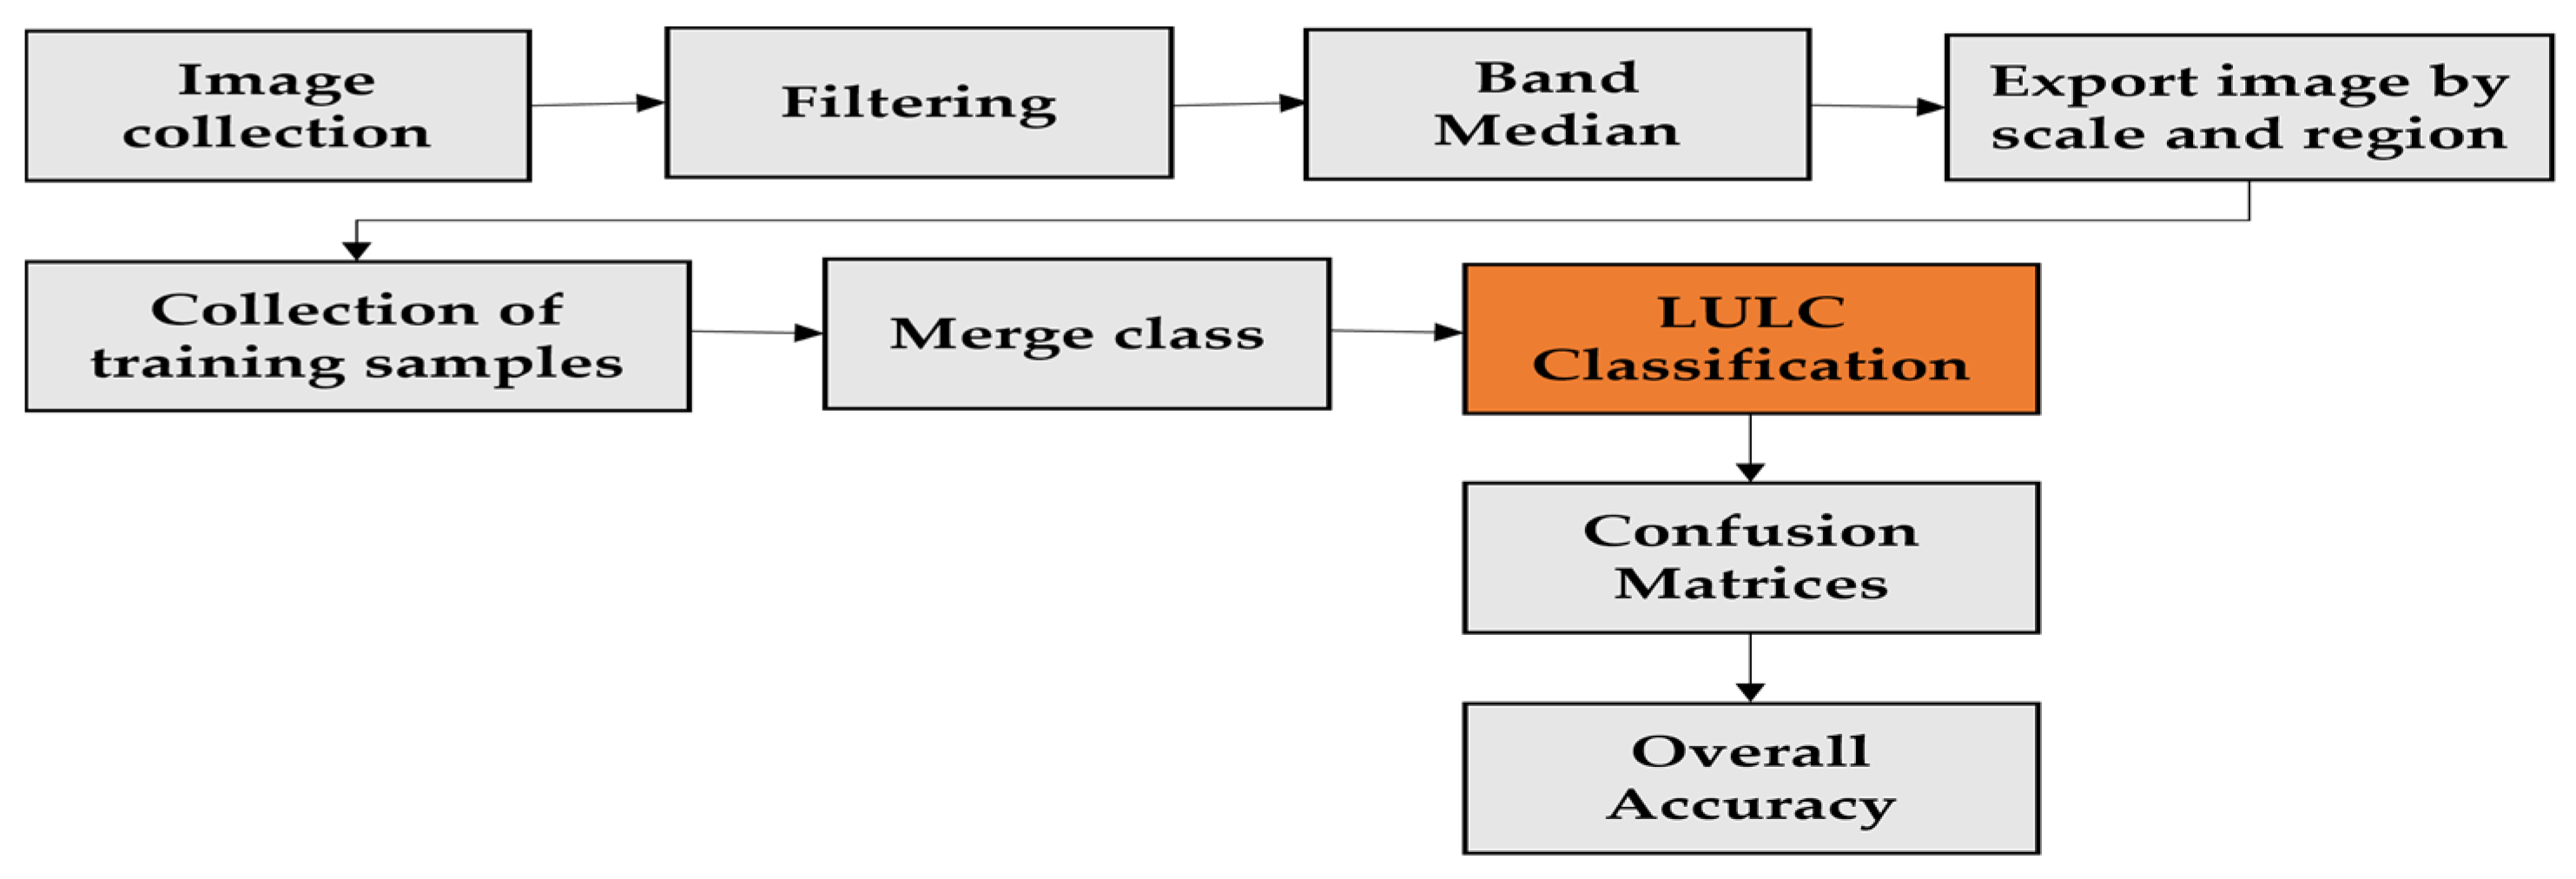
3.1. Object-Based LULC Classification in Google Earth Engine (GEE)

The general steps for creating a LULC classification are summarized in a Figure 1.

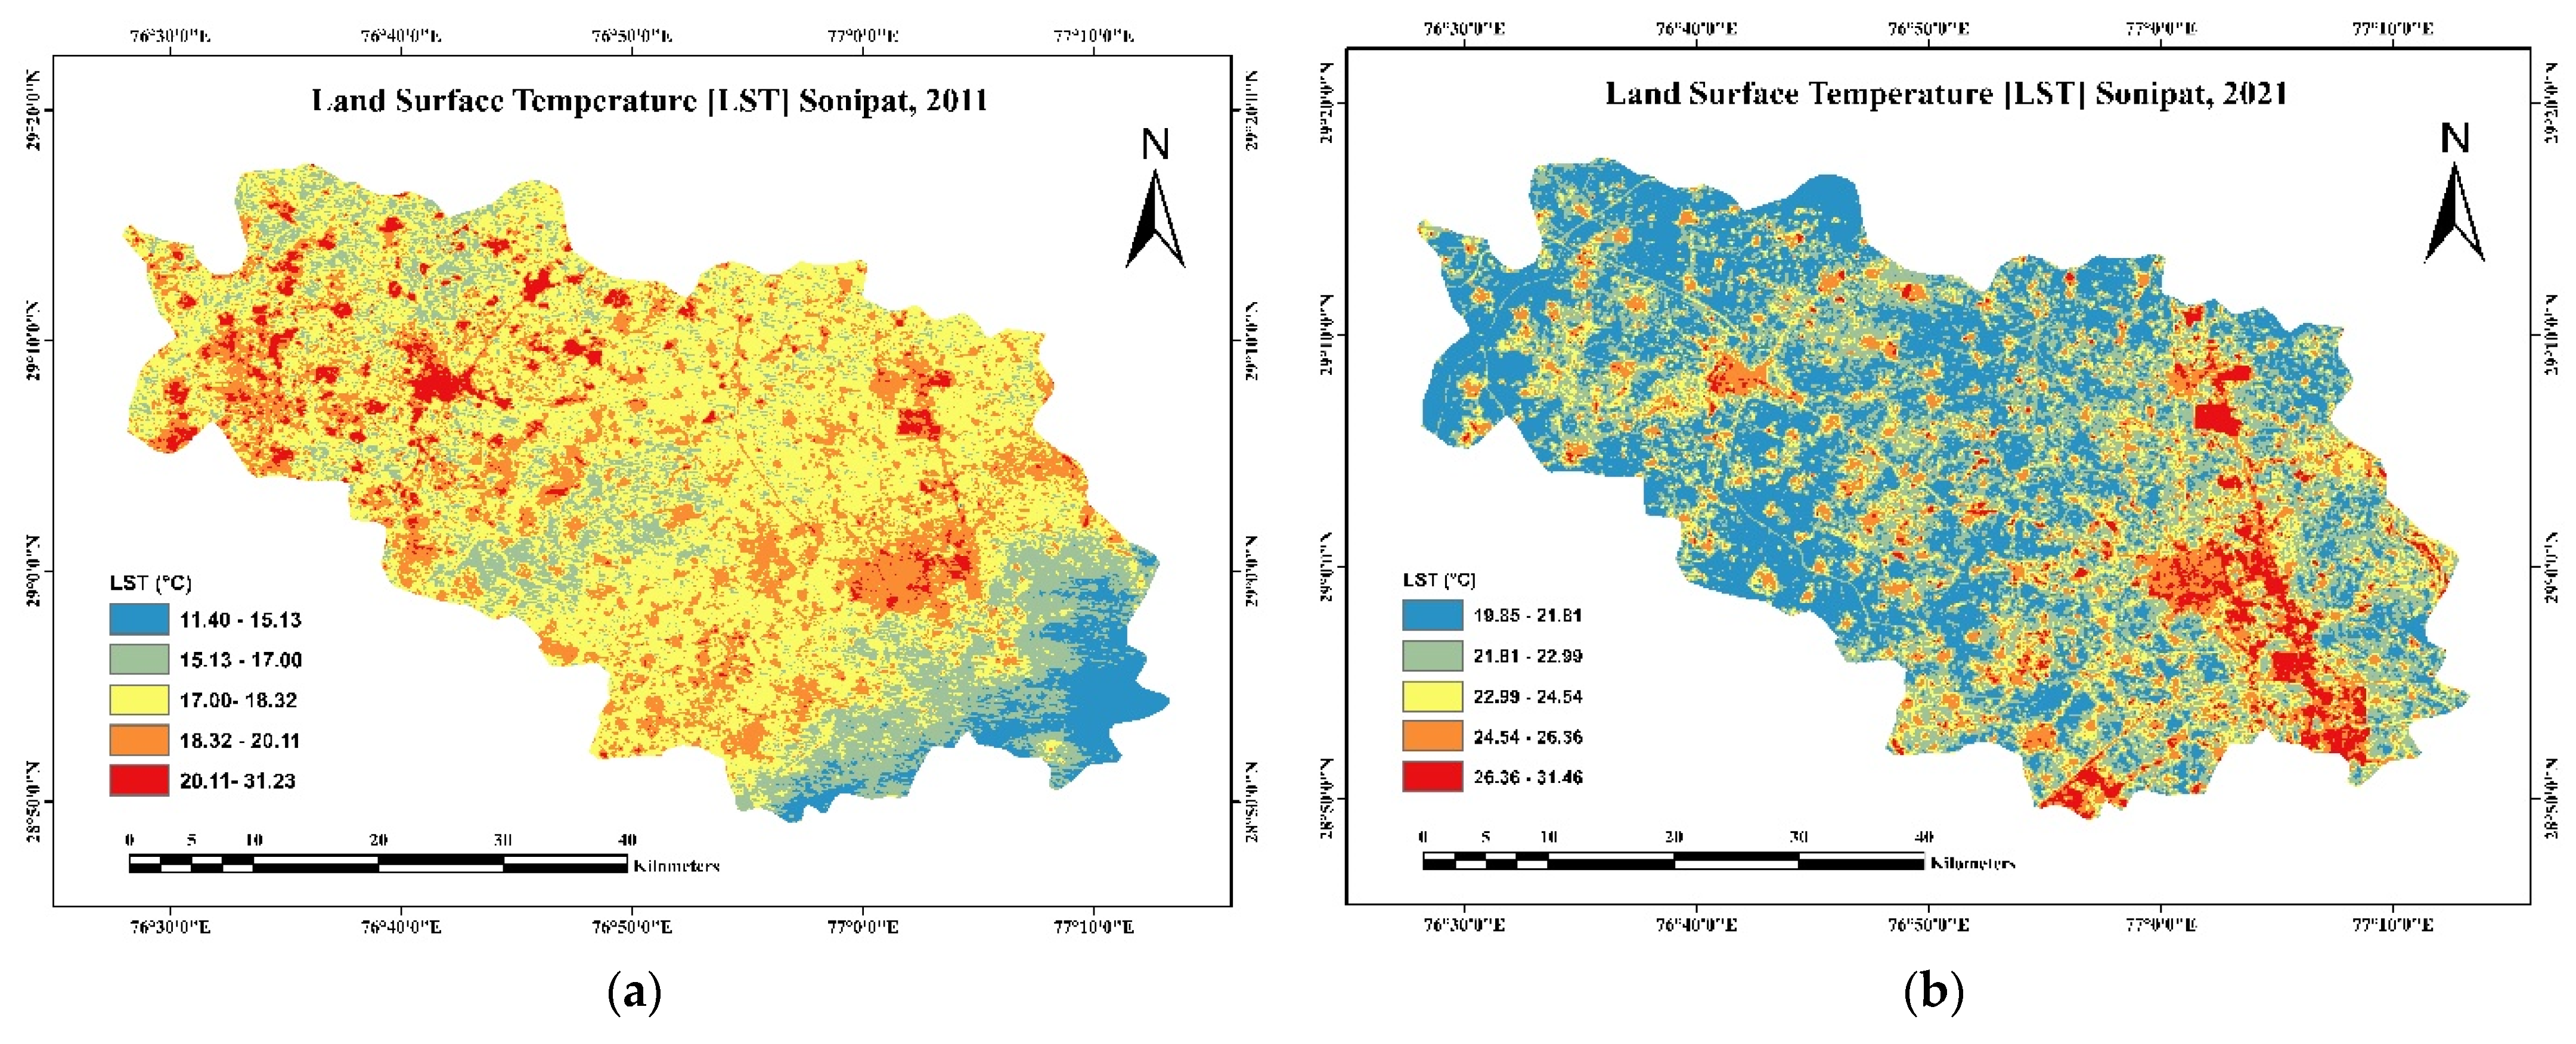
3.2. Estimation of LST

LST was quantified using the Landsat 8 and 5 thermal bands. This simply requires applying a set of equations of a mono-window algorithm through a raster calculator with ArcMap.

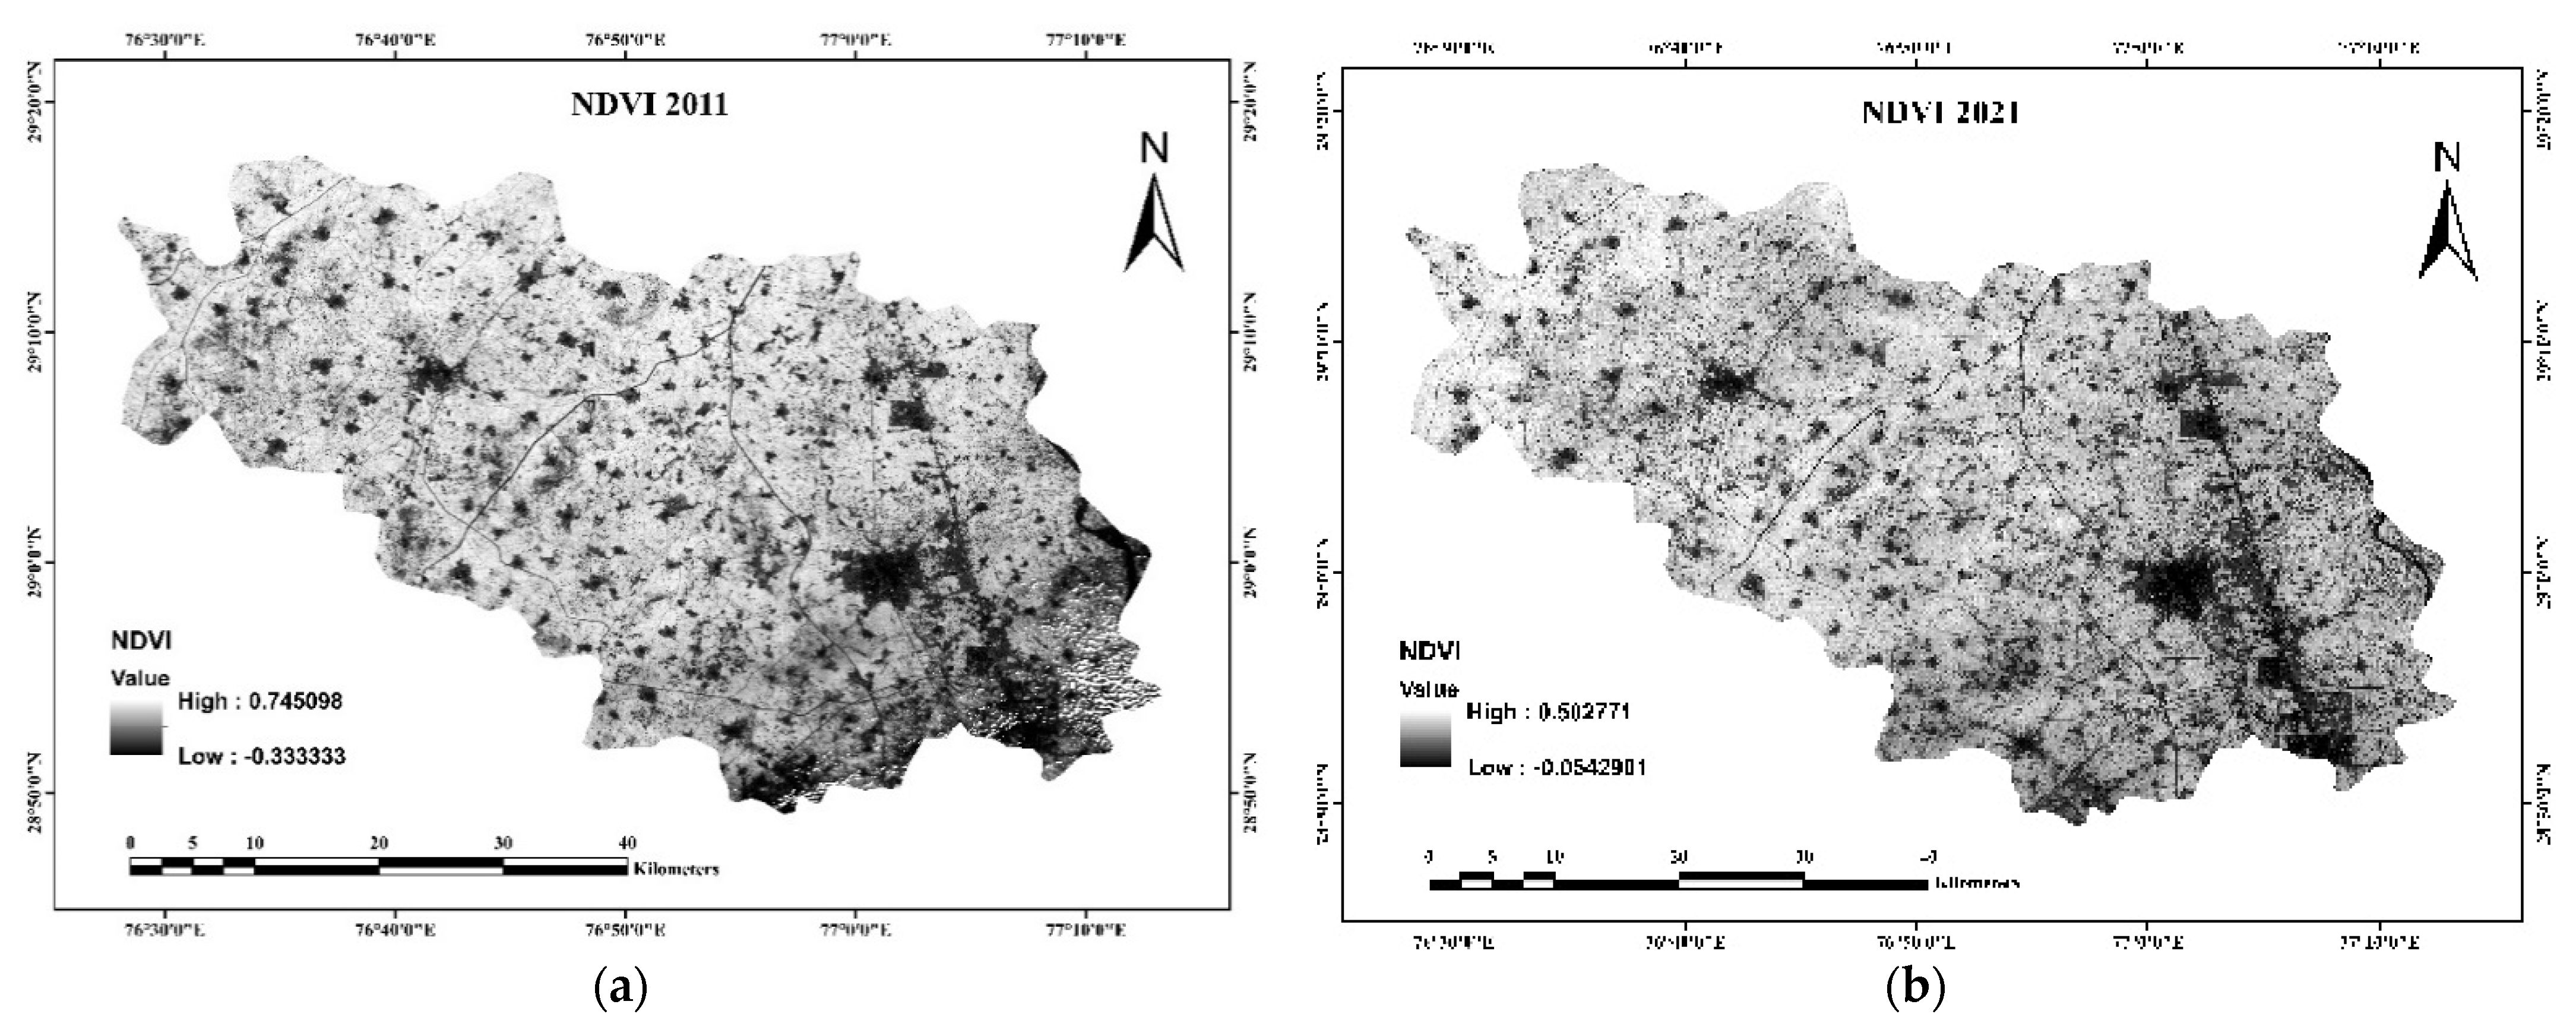
3.3. NDVI Calculations

The NDVI ratio is the normalized difference between near-infra-red (NIR) and red color band, which can be calculated using the formula below:
NDVI = ( B a n d   5 B a n d   4 )   /   ( B a n d   5 + B a n d   4 ) ,

4. Result and Discussion

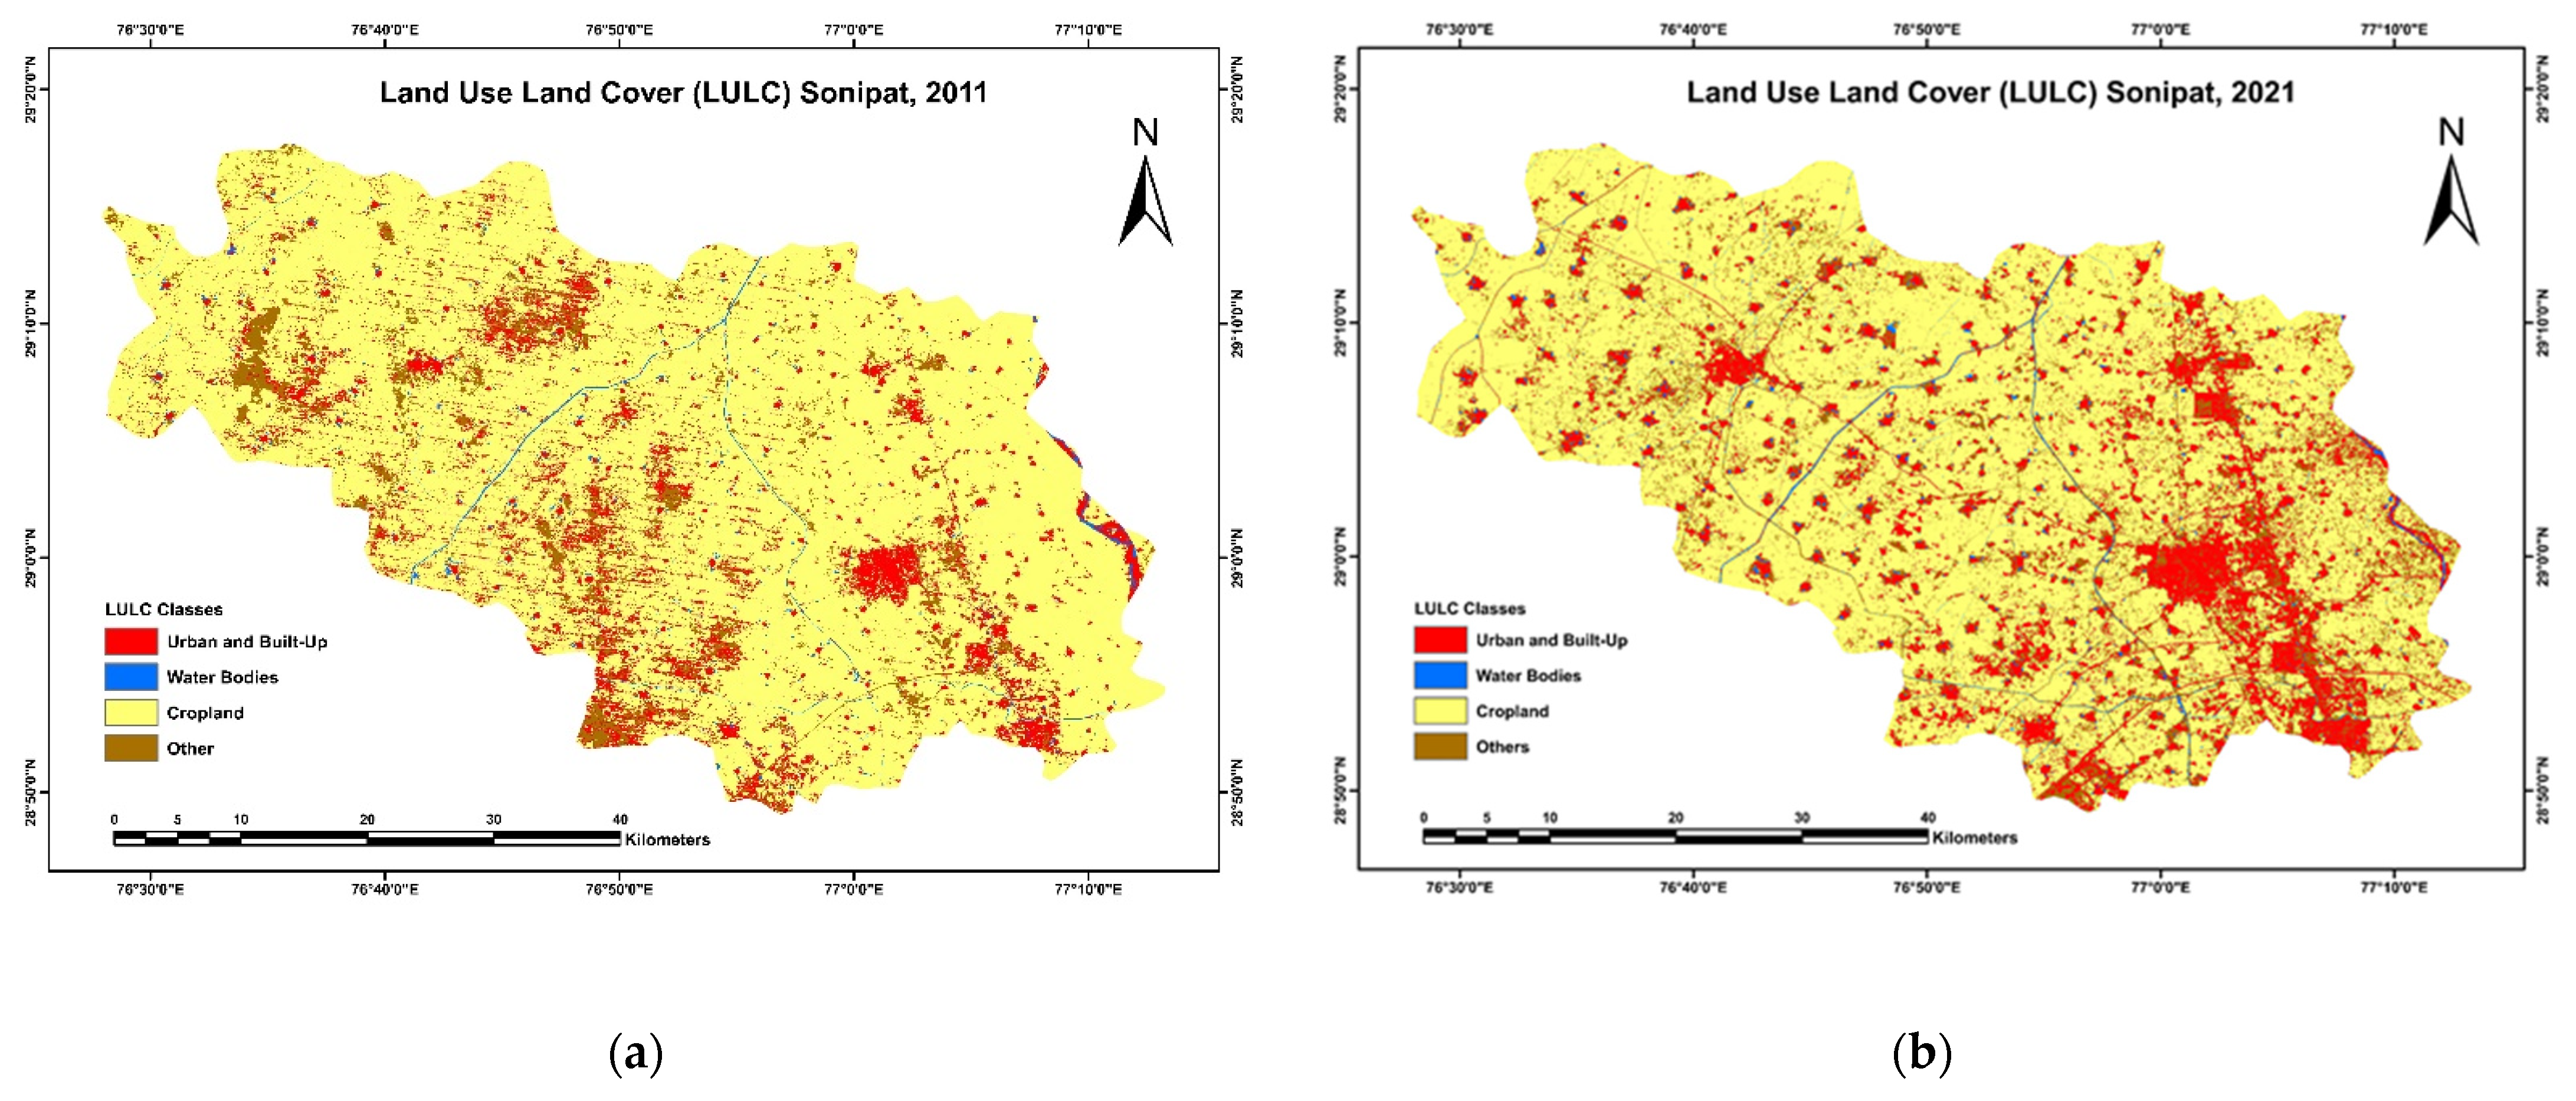
4.1. LULC Classification

The LULC classification for the Sonipat district obtained from the analysis using Sentinel and Landsat data is shown in Figure 2a,b. The figures indicate that there was less fallow land, barren land, and water bodies than built-up and agricultural land. Most of the surrounding region comprised cropland and fallow land.

4.2. The Relationship between LST and NDVI by Land Use/Cover Types

Karl Pearson’s correlation coefficients were computed between LST, with NDVI for the LULC classes. Table 1 shows the correlation between LST and NDVI for LULC types for the study area (Figure 3 and Figure 4).
All the correlation coefficients were significant, at a 0.01 level of significance, and the (n) values in Table 1 show the total numbers of a polygon taken for selected LULC types for calculating the correlation between LST and NDVI. NDVI values tended to be negatively correlated with LST of all LULC, except for waterbodies for both the years. In 2011, the strongest negative correlation between LST and NDVI was found over the others: fallow/barren (–0.846), followed by cropland (−0.759) and urban and built-up (−0.341). In the 2021, the same trend of correlation between NDVI and LST was observed, LULC-wise.

5. Conclusions

This study examined the LULC changes in the Sonipat District of Haryana from 2011 to 2021. The results indicated that urban and built-up land, and the supporting infrastructure, has expanded by 3%, whereas cropland has declined by 11%. Fallow/barren land has increased by 7%. The observed changes in LULC were largely attributed to rapidly growing infrastructure and poor land-use planning. Changes in LULC were accompanied by changes in LST. An identification of such hotpots in the urban environment can be useful in strategic planning for more resilient and sustainable cities.

Institutional Review Board Statement

Not applicable.

Informed Consent Statement

Not applicable.

Conflicts of Interest

The authors declare no conflict of interest.

References

  1. Abd El-Hamid, H.T.; Caiyong, W.; Hafiz, M.A.; Mustafa, E.K. Effects of land use/land cover and climatic change on the ecosystem of North Ningxia, China. Arab. J. Geosci. 2020, 13, 1099. [Google Scholar] [CrossRef]
  2. Pal, S.; Ziaul, S. Detection of land use and land cover change and land surface temperature in English Bazar urban centre. Egypt. J. Remote Sens. Space Sci. 2017, 20, 125–145. [Google Scholar] [CrossRef] [Green Version]
  3. Imran, H.M.; Hossain, A.; Islam, A.K.M.; Rahman, A.; Bhuiyan, M.A.E.; Paul, S.; Alam, A. Impact of Land Cover Changes on Land Surface Temperature and Human Thermal Comfort in Dhaka City of Bangladesh. Earth Syst. Environ. 2021, 5, 667–693. [Google Scholar] [CrossRef]
  4. Das, S.; Angadi, D.P. Land use-land cover (LULC) transformation and its relation with land surface temperature changes: A case study of Barrackpore Subdivision, West Bengal, India. Remote Sens. Appl. Soc. Environ. 2020, 19, 100322. [Google Scholar] [CrossRef]
  5. Gogoi, P.P.; Vinoj, V.; Swain, D.; Roberts, G.; Dash, J.; Tripathy, S. Land use and land cover change effect on surface temperature over Eastern India. Sci. Rep. 2019, 9, 8859. [Google Scholar] [CrossRef] [PubMed] [Green Version]
  6. Quantitative estimation of Land Surface Temperature and Its Relationship with Land Use/Cover around Mahan Essar Thermal Power Plant in Singrauli District, Madhya Pradesh, India. Available online: https://www.researchgate.net/publication/321492270_Quantitative_estimation_of_Land_Surface_Temperature_and_its_relationship_with_Land_UseCover_around_Mahan_Essar_Thermal_Power_Plant_in_Singrauli_District_Madhya_Pradesh_India (accessed on 25 September 2021).
  7. Aboelnour, M.; Engel, B.A.; Aboelnour, M.; Engel, B.A. Application of Remote Sensing Techniques and Geographic Information Systems to Analyze Land Surface Temperature in Response to Land Use/Land Cover Change in Greater Cairo Region, Egypt. J. Geogr. Inf. Syst. 2018, 10, 57–88. [Google Scholar] [CrossRef] [Green Version]
  8. Nguyen, H.T.T.; Doan, T.M.; Tomppo, E.; McRoberts, R.E. Land Use/Land Cover Mapping Using Multitemporal Sentinel-2 Imagery and Four Classification Methods—A Case Study from Dak Nong, Vietnam. Remote Sens. 2020, 12, 1367. [Google Scholar] [CrossRef]
Figure 1. The LULC classification workflow integrated in Google Earth Engine (GEE).
Engproc 08 00031 g001
Figure 2. (a) LULC Map of the Sonipat district, 2011; (b) LULC.
Engproc 08 00031 g002
Figure 3. Mean NDVI values (a) NDVI image 2011; (b) NDVI image 2021.
Engproc 08 00031 g003
Figure 4. Mean LST values (a) LST image 2011; (b) LST image 2021.
Engproc 08 00031 g004
Table 1. The correlation between LST and NDVI for selected LULC types.
YearLand UsenRR2Significance Level
2011Urban and Built-Up20−0.341R² = 0.11660.01
Water Bodies150.159R² = 0.02550.01
Cropland30−0.759R² = 0.57610.01
Others Fallow/Barren12−0.846R² = 0.71580.01
2021Urban and Built-Up20−0.490R² = 0.24040.01
Water Bodies150.537R² = 0.28840.01
Cropland30−0.598R² = 0.35850.01
Others Fallow/Barren15−0.752R² = 0.56550.01
Publisher’s Note: MDPI stays neutral with regard to jurisdictional claims in published maps and institutional affiliations.

