Article

Numerical and Non-Destructive Analysis of an Aluminum-CFRP Hybrid 3D Structure

by
Leandro Soares Silva
1,†,
Henrique Fernandes
2,3,†,
Michael Schwarz
3,4,
Hans-Georg Herrmann
3,4,* and
Aldemir Cavalini
1
1
LMEst—Structural Mechanics Laboratory, School of Mechanical Engineering, Federal University of Uberlândia, Av. João Naves de Ávila 2121, Uberlândia 38408-100, Brazil
2
Faculty of Computing, Federal University of Uberlândia, Av. João Naves de Ávila 2121, Uberlândia 38408-100, Brazil
3
Fraunhofer IZFP Institute for Nondestructive Testing, Campus E3 1, 66123 Saarbrücken, Germany
4
Chair for Lightweight Systems, Saarland University, Campus E3 1, 66123 Saarbrücken, Germany
*
Author to whom correspondence should be addressed.
These authors contributed equally to this work.
Metals 2021, 11(12), 1938; https://doi.org/10.3390/met11121938
Submission received: 29 October 2021 / Revised: 26 November 2021 / Accepted: 28 November 2021 / Published: 30 November 2021
(This article belongs to the Special Issue Characterization and Monitoring of Metal-CFRP-Hybrid Structures)

Abstract

:
Advanced materials are widely used in many industries. They play an important role especially in the aeronautic and automotive sectors where weight reduction is required in order to reduce fuel consumption. Composite materials have a high strength to weight ratio and are applied in airplane construction. Nevertheless, sometimes it is not viable to replace all metal parts by composite ones due to the cost factor. In this sense, hybrid structures are highly welcome. In order to ensure the safety of these hybrid components during their entire life cycle, non-destructive testing evaluation (NDT&E) methods are used and sometimes they are the only option. In this study, we use infrared thermography (IRT) to inspect an aluminum-composite hybrid structure with a 3D shape. The sample has a composite part with a small metal inlay (EN AW-6082) overmolded with a thermoplastic layer. The inlay is bended to reach the desired 3D geometry. This sample was design to be used for the connection between an A- or B-pillar and a car roof made of carbon fiber reinforced polymer (CFRP). A dual-band infrared camera is used in order to capture images in two different spectral ranges. In addition, two data processing techniques for infrared images are applied to enhance the images: principal component thermography (PCT) and partial least squares thermography (PLST). Then, a signal-to-noise ratio analysis is performed with three randomly chosen previous known defects to assess the quality of the images and detected defects. Results showed that principal component thermography has a slight advantage over partial least squares thermography in our specific experiments. Specifically, for the long-wave infrared band, PCT presented, among the defects analyzed, PCT presented a mean value 12.5% higher while the standard deviation was almost three times lower than PLST. In parallel to the non-detructive analysis, a numerical finite element model was formulated in ANSYS® to analyze the total deformations to which the metal-composite-hybrid structure is subjected during a possible use. Results obtained with the numerical model indicate that the interface region between composite and metal parts is where the highest degree of deformation occur, which indicates possible regions where defects and failures may occur in real use cases.

1. Introduction

Advanced materials are widely used in aeronautical and automotive industries. Carbon fiber reinforced polymer (CFRP), one of the most used, has excellent specific mechanical properties (i.e., property/density ratio) such as stiffness and strength, as well as relatively high temperature and oxidation resistances. Another advantage is that they are usually lighter than 100% metallic material that have traditionally been used in these industries [
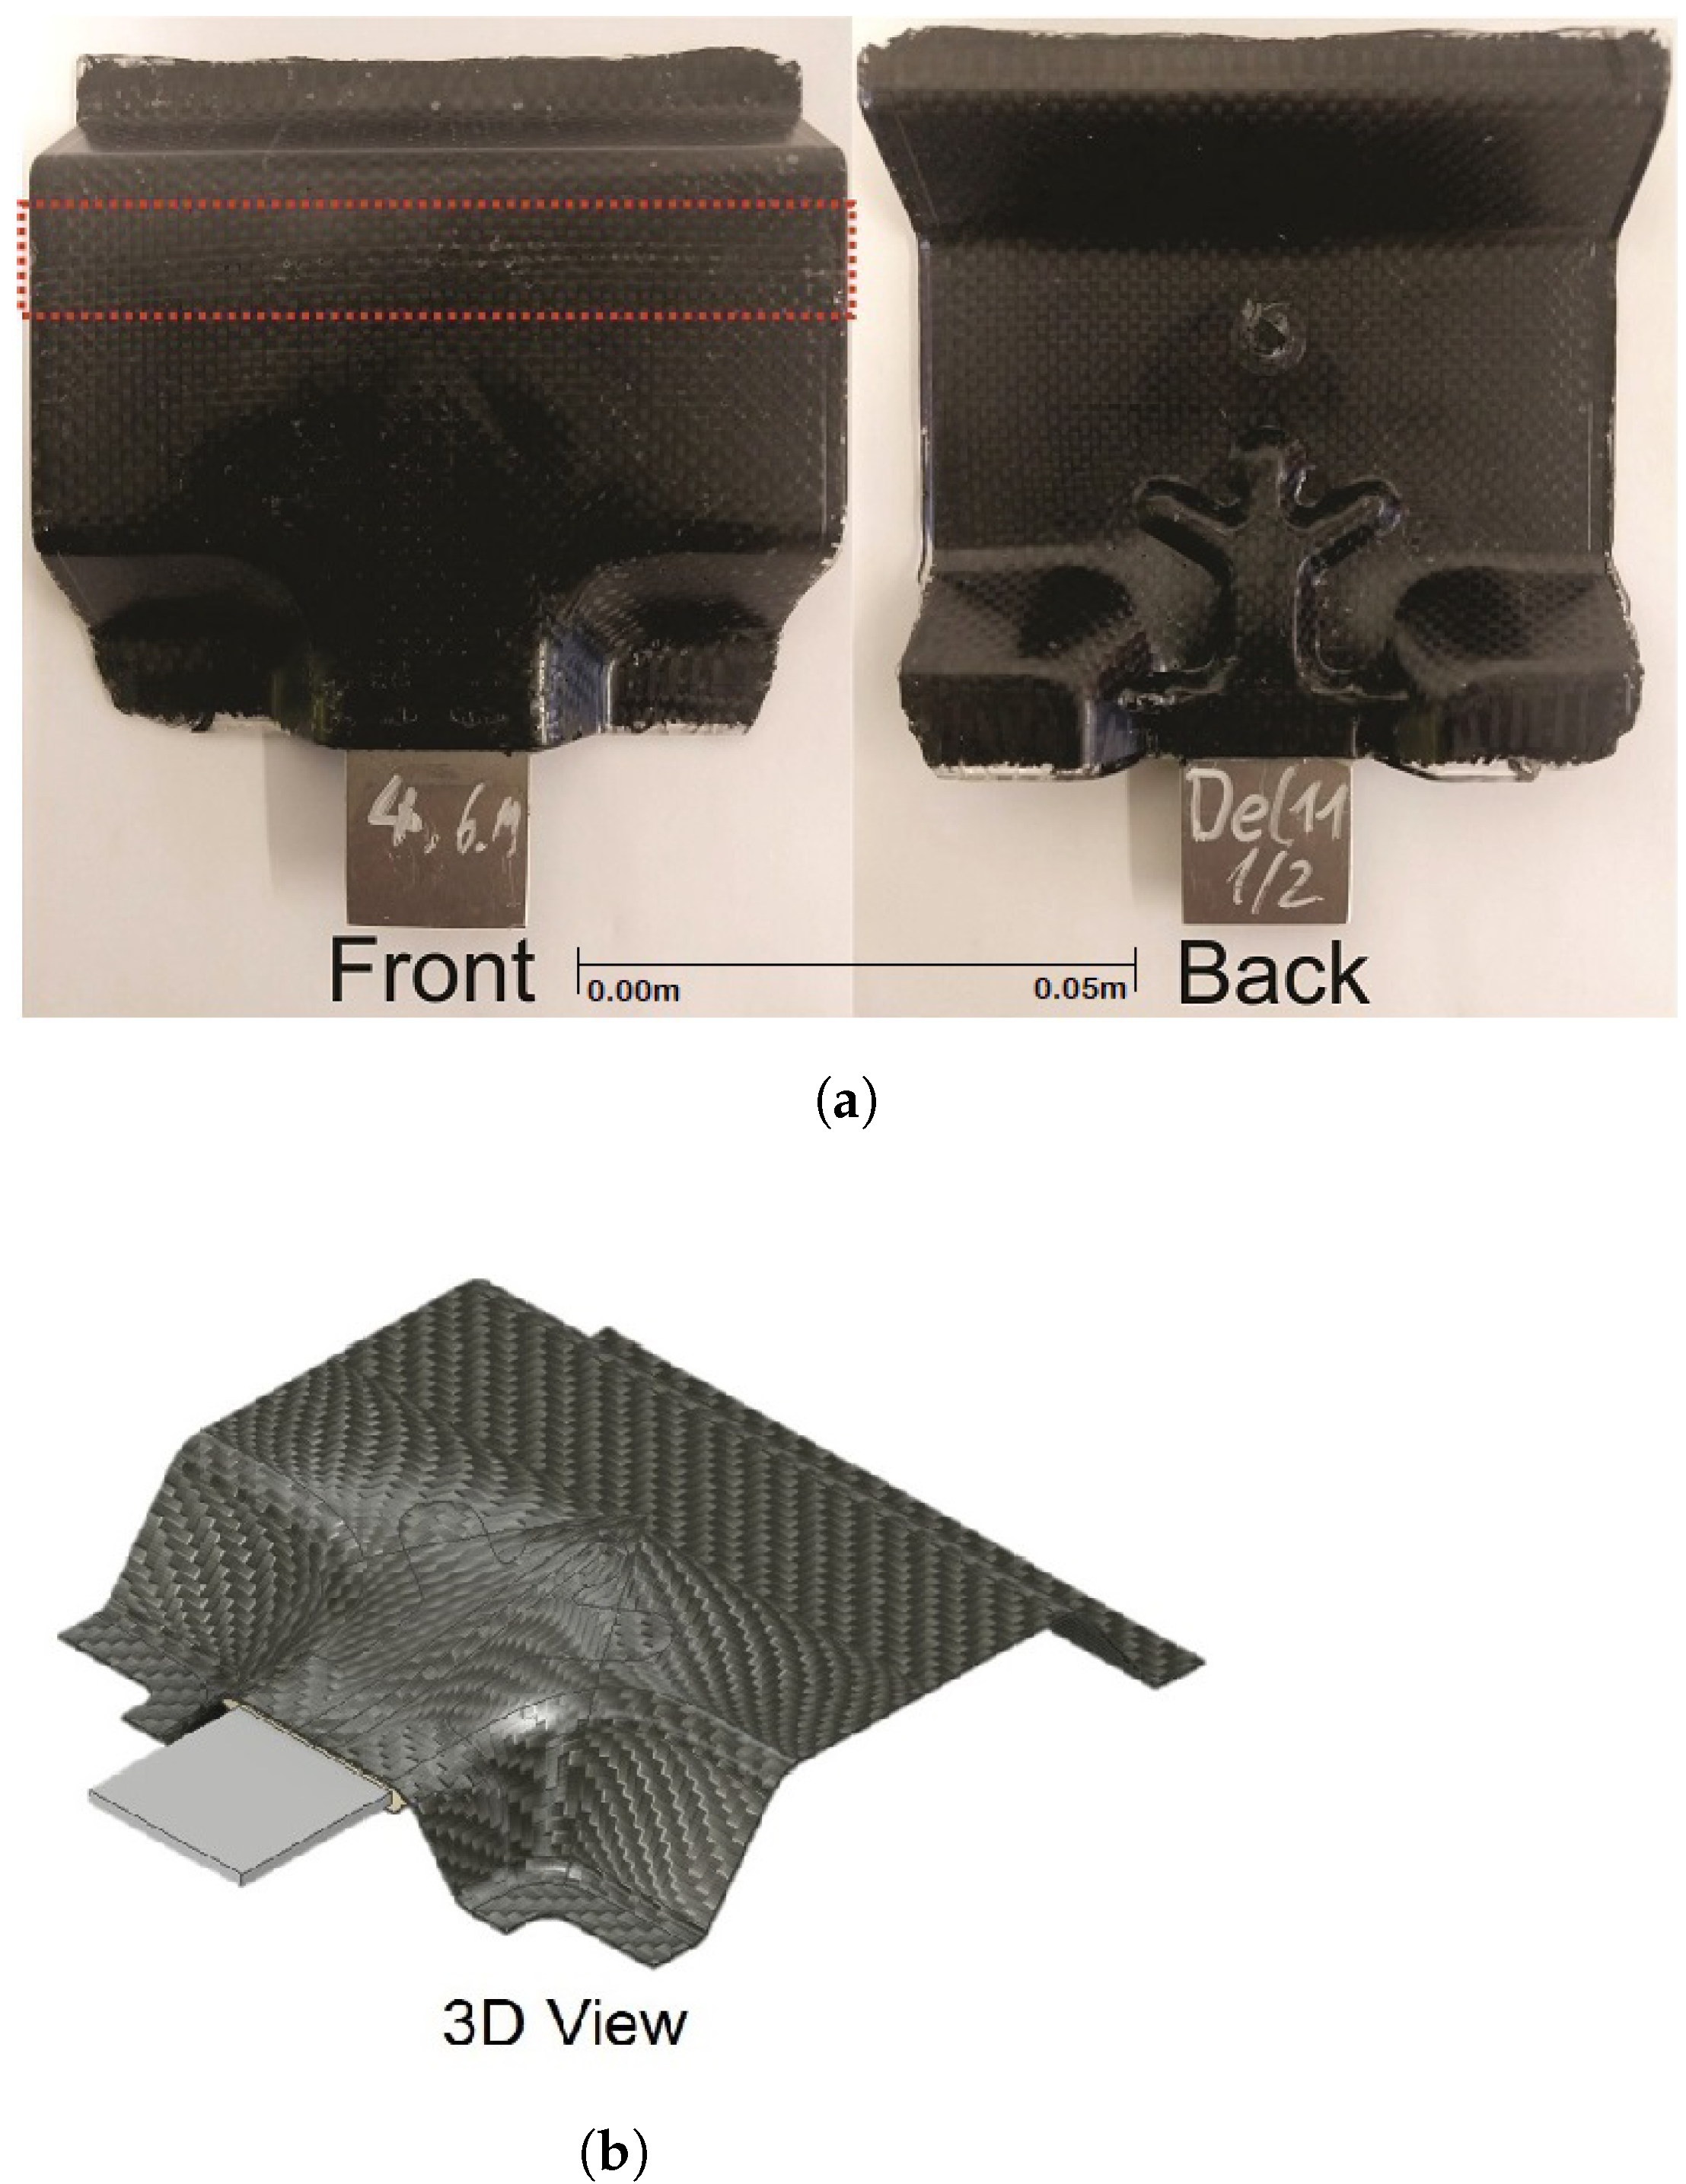
1]. However, to substitute all metal structures by CFRP structures is not a viable option due to the cost factor. Ergo, hybrid structures are typically used in these cases. Here, an aluminum-CFRP hybrid 3D sample is studied. This hybrid is manufactured by injection molding and the aluminum component in the CFRP creates an additional interface where defects are likely to occur. These defects may occur during fabrication or during their life cycle caused by deformation due to mechanical load. It is very important to assess these defects and detect them to guarantee the safety of the advanced structures manufactured with such hybrid materials. In addition, for this sample, an artificial insert was placed prior to molding for academic reasons.
In addition to efficient manufacturing techniques, to ensure the quality of these materials, it is also important to asses their quality and soundness throughout their entire life-cycle. In this sense, non-destructive testing and evaluation (NDT&E) techniques are vital since they guarantee the sample’s integrity after the inspection. Infrared thermography (IRT) is a valuable NDT&E approach usually used to assess different kinds of discontinuities. IRT is a tool broadly used to inspect composite materials for many years now, especially CFRP. It is fast technique, which is non-contact and does not emit any harmful radiation. This topic has been explored extensively with several papers available in the literature.
Yousefi et al. [2] proposed in their work an improved way for the calculation of the principal component analysis called candid covariance-free incremental principal component thermography (CCIPCT). The method applies a technique for computation of eigen-decomposition of thermographic sequences which ultimately segments the defects in the specimens applying color based K-medoids clustering approach. They tested their approach with CFRP, plexiglas and aluminum specimens. In [3], Summa et al. introduced a plane hybrid-structure composed of a metal and a CFRP. Further, they used thermography for quantitative damage characterization under quasi-static and fatigue loading of the sample. Meng et al. [4] used a combination of IRT and 3D structural optical imaging to inspect a curved clad composites with subsurface defects. They presented experimental results that show that their method can reliably inspect and detect defects position in curved parts. In [5], Zhang et al. used IRT to inspect natural fiber reinforced material. They evaluate and characterize basalt, jute/hemp and bagasse fibers composite panels using pulsed phase thermography (PPT) [6] and principal component thermography (PCT) [7]. PPT and PCT are two of the most used data processing techniques used in IRT. Wei et al. [8] analyzed curved impacted CFRP samples using deep neural networks. They inspected impacted samples and then segment barely visible defects caused by the impact using deep learning methods. Both mid-wave and long-wave spectrum were used in their study. The model trained with mid-wave images achieved an F1-score of 92.74% and the model trained with long-wave images achieved an F1-score of 87.39%.
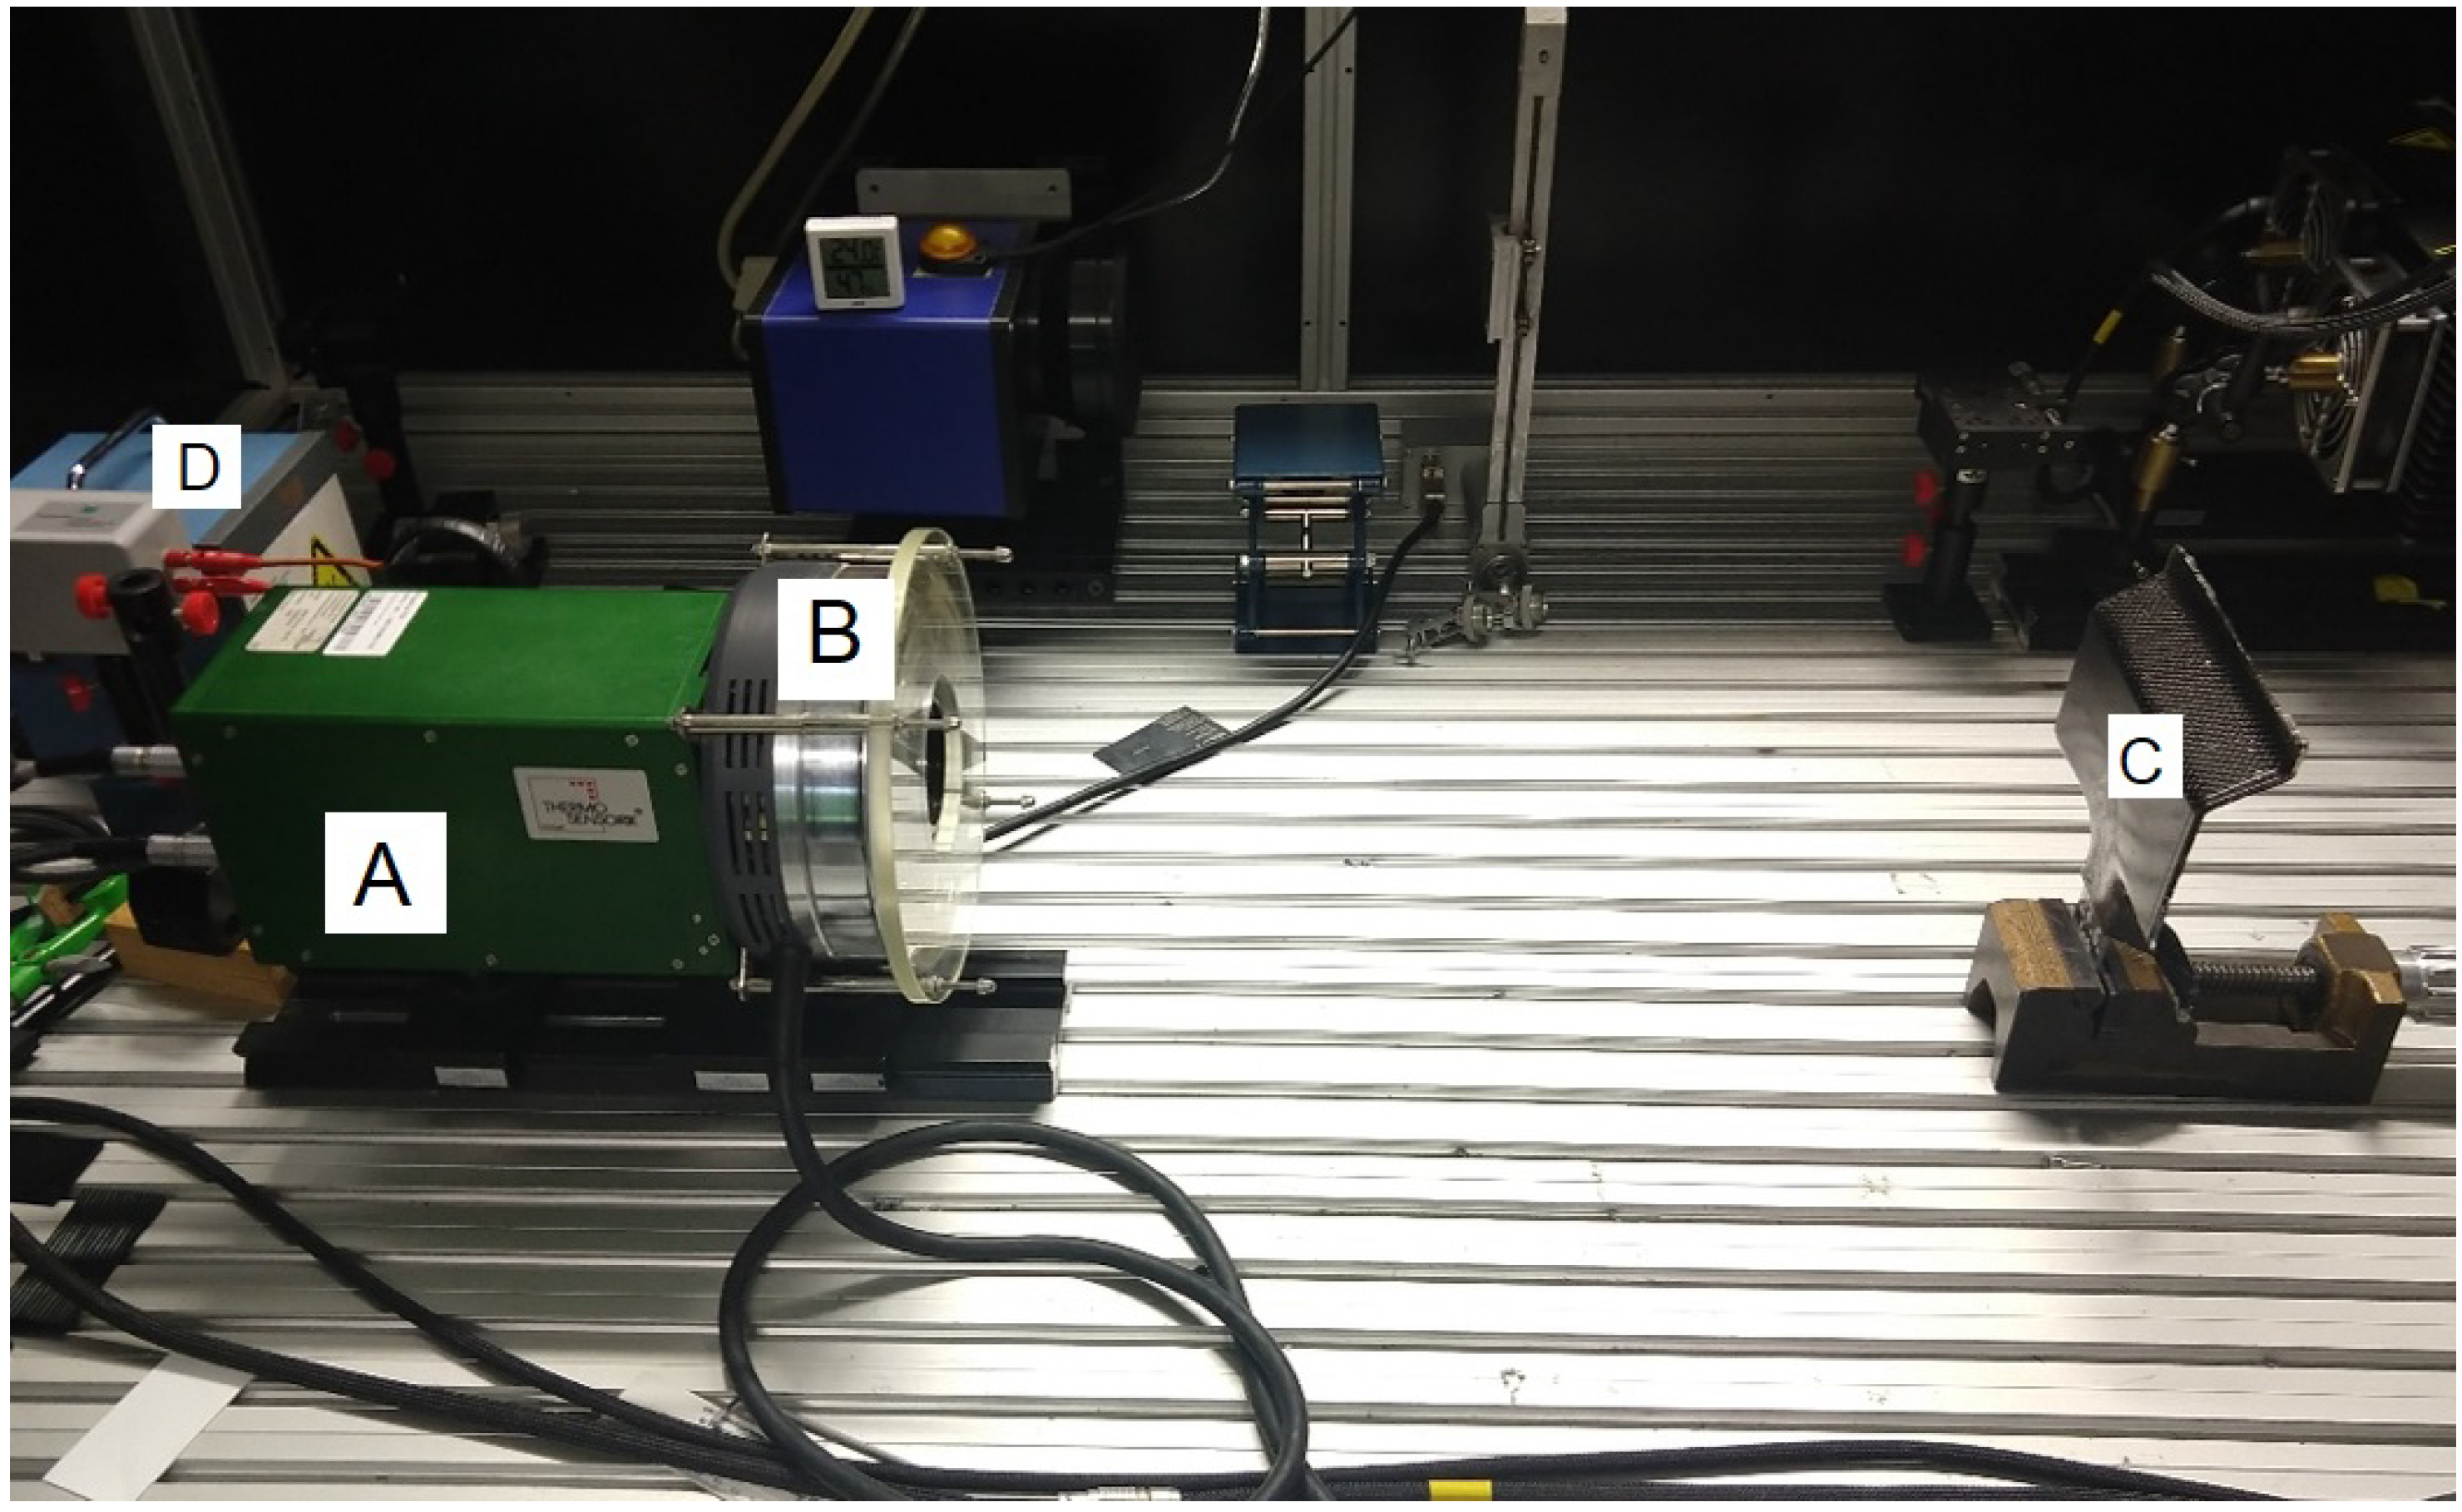
In this study, IRT is applied to inspect an aluminum-CFRP hybrid 3D sample. This sample was design to be used for the connection between an A- or B-pillar and a car roof made of CFRP. The CFRP has a thermoplastic layer between it and metal component. Additionally, for this specific study, an artificial insert is added to guarantee the presence of internal defects in the sample to enable the quantitative analysis of the data processing techniques that will be used in this work. First, a pulsed thermography (PT) experiment in reflection mode is conducted. Then, a radiometric calibration is performed in the raw data which is acquired with the camera. With the calibrated data, partial least squares thermography (PLST) [9] (which is based on a statistical correlation method) and principal component thermography (PCT) [7] (which relies on the single value decomposition method), two processing techniques specifically designed for IRT, are then applied to enhance the obtained PT signal, which is very attenuated and sometimes quite weak due to the transient nature of the heat transfer phenomenon, for better discontinuity (defect or damage) identification. The main advantage, for both techniques, is that they reduce the amount of data to be handled from thousand images (for a single PT experiment) to approximately 5 to 10 images. A quantitative analysis is then performed in the known defective region (artificial insert) via a signal-to-noise ratio comparison to compare and quantify archived results. Finally, a finite element model of the metal-composite-hybrid structure was formulated in ANSYS® so that it could be possible to investigate the total deformation of the structure subjected to bending, compression, tension, and torsion loads. With this information it is possible to point weak regions in the sample and estimate regions that defects may likely occur during the component life cycle.

2. Materials and Methods

2.1. Inspected Sample

The sample inspected in this study is a metal-composite-hybrid structure. The composite part is CFRP with a thermoplastic layer between it and metal component [3,10]. The metal inlay is an aluminum alloy (EN AW-6082) with thickness of 3 m m . The inlay is bended to reach the desired 3D geometry. The characteristic form is produced in a stamping process. In a additional step, the metal insert is overmolded with the thermoplastic component in an injection molding process.
The thermoplastic used is a polyphthalamide (PPA) with 30 vol% of glass fiber (Vestamid® HT plus M1033). In the last step, the overmolded inlay is draped in the middle of four layers C-fiber canvas fabric. This composite is cured in a Resin Transfer molding (RTM) process for 20 min with a temperature of 75 C and a pressure of 8 bar to a thickness of 1 m m . The fibers that used are Torayca T300/ FT300, and the CFRP-layers have a layup configuration of [ 0 / 90 , ± 45 ] s . A 2 K hot curing epoxy system from SIKA (Biresin CR170/CH 150-3) is used in the process. This hybrid structure reaches its strength due to a mechanical interlocking. The thermoplastic layer reduces the gap of stiffness between metal and CFRP and prevents corrosion as well.
In this sample, displayed in Figure 1, interfaces, that are weak points in the structure, occur and must be characterized by non-destructive testing and evaluation methods as well as suited via numerical simulations. The dotted red box depicted in the left image of Figure 1 indicates the region of a wide Teflon tape included above the inlay between the first and the second layer to induced voids in the region during molding.

2.2. Numerical Model

The finite element model of the structure was conducted using the Workbench platform of the software ANSYS®. As a first step of this study, only numerical models for the structural analysis were performed. In a second step, experimental tests are going to be performed to confirm this numerical analysis. The tool used within ANSYS® to model the laminate composite material part (CFRP) was the Composite PrepPost (ACP), which is a dedicated tool for composite layup modeling and failure analysis.
ACP provides efficient layup and best-in-class solid element modeling capabilities and a platform that offers many ways to exchange model information. After modeling the complete structure, the mesh was generated adopting an intermediate mesh refinement in the software ANSYS®. In this case, the mesh is composed of 17,199 elements and 24,652 nodes. Then, a static structural analysis was performed, where some regions of the structure were considered as fixed (boundary conditions). Figure 2 shows the regions in red where the structure was clamped.
Thus, forces of 5 N magnitude were applied to the edge of the metal inlay. Bending, compression, traction, lateral bending, and torsion loads were considered separately and the total deformation in the entire structure was determined by using the static analysis type in the software ANSYS®. Figure 3 shows how these forces were applied for each case. These forces are related to real loads that the component could undergo during its life cycle.
All properties referring to composite, aluminum and polyphthalamide materials used in the analysis of the considered sample are presented in Table 1. Properties were provided by the manufactures.

2.3. PT Set-Up

In this study, thermographic inspections were performed using a classical pulsed thermography (PT) setup in reflection mode. Such setup is showed in Figure 4. Camera and flash were around 60 cm from the inspected sample. It had a 2009 Thermosensorik QWIP Dualband 384, an infrared dual-band camera which works, simultaneously, in two spectral bands: the 4.4 5.2   μ m (known as mid-wave infrared, or MWIR) and the 7.8 8.8   μ m (know as long-wave infrared, or LWIR). Camera’s detector material is Quantum Well IR Photodetector (QWIP), detector cooler is Stirling cooler while cool-down time is under 8 min (for 20 C operating temperature). Each detector in the camera has an individual frame size of 384 × 288 pixels, i.e., image size. In order to heat up the inspected sample, a circular flash device with several Xenon lamps ( 6 k J ) was used. Only half of its power was employed during experiments. A short flash was fired for a period of 10 μ s and the infrared camera recorded approximately 5 s of images, i.e., frames, at a frame rate of around 145 fps. Thus, a total of 725 images were available for each thermographic inspection.

2.4. Radiometric Calibration

A radiometric calibration has been performed on the raw data acquired with the camera in the two different spectral bands. To get homogeneous radiance at different temperatures, a black body radiation source is used as reference. The main advantage of using the raw data is that you can include the calibration procedure wherever you like in your experiment and transfer it to all measurements performed with this particular acquisition system, taken before and after the calibration procedure.
The effort to acquire the calibration points is further reduced by the method based on Planck’s law proposed in [10,11,12]. This particular method needs only a couple of calibration images. One of these images has to be acquired close to room temperature. The characteristic of a quantum detector is represented better by radiance than temperature values. Furthermore, the pixel-by-pixel calculation leads to sharper images because of its quality as a non-uniformity correction (NUC).

2.5. Image Processing Techniques

IR sequences often have a low signal-to-noise ratio and consequently low contrast between background and feature of interest. Thus, often, one needs to be enhanced for better visualization. In this work, two well-known processing technique are used: partial least squares thermography (PLST) and principal component thermography (PCT).

2.5.1. Principal Component Thermography (PCT)

PCT, originally proposed by Rajic in [7], extracts the image features and reduces the undesirable signals. It relies on Singular Value Decomposition (SVD), which is a tool to extract spatial and temporal data from a matrix in a compact manner by projecting original data onto a system of orthogonal components known as Empirical Orthogonal Functions (EOF). By sorting the principal components in such way that the first EOF represents the most characteristic variability of the data, the second EOF contains the second most important variability, and so on, the original data can be adequately represented with only a few EOFs.

2.5.2. Partial Least Squares Thermography (PLST)

Based on a statistical correlation method, partial least squares thermography (PLST) has been proposed as a technique for the treatment of thermographic images [9]. PLST computes loading P and score T vectors that are correlated to the predicted block Y (as in maximum redundancy analysis), while describing a large amount of the variation in the predictor matrix X (as in principal component regression). The matrix X corresponds to the surface temperature matrix obtained during the PT inspection, while Y is defined by the observation time during which the thermal images were captured. The PLS model is achieved by decomposing X and Y into a combination of loadings P and Q (formed by orthogonal vectors), scores T and U (the projections of the loading vectors associated with the singular values) and residuals E and F. One of the main attractions of PLST is the separation of physical effects. This is because of the orthogonality between each latent variable obtained from the decomposition of the thermal sequence.

2.6. Signal-to-Noise Ration (SNR)

A SNR value is used to determine which processing algorithm is more suitable for a certain application. It basically describes the contrast between a defective area and its neighborhood, establishing a dynamic range measured in decibels (dB) [13].
In order to determine this S N R value, two areas in the resulting image obtained with the processing algorithm are selected: an area inside the defect and an area around it (sound area). In this work the following equation to compute S N R is used [14]:
S N R = 20 × l o g 10 a b s ( a v g ( a r e a d e f e c t ) a v g ( a r e a s o u n d ) ) σ [ d B ]
where a v g ( a r e a d e f e c t ) is the average value of the pixels of the defect, a v g ( a r e a s o u n d ) is the average value of the pixels of a sound area and σ is the standard deviation of the sound area.

3. Results

3.1. Numerical Results

Considering the forces applied to the metal inlay, the structure was prone to the effects of bending, compression, traction, lateral bending, and torsion. Figure 5 shows the total deformation of the regions of the metal-composite-hybrid structure when disposed to these effects.

3.2. Experimental Results

The sample was inspected with the PT setup shown in Figure 4. Since a dual-band IR camera is used, two different sets of images are acquired: LWIR sequence and MWIR sequence. Each sequence had 725 invidual images acquired over a period of 5 s. Each sequence is then radiometrically calibrated [10]. The resulting image sequences are then processed with PCT and PSLT. To quantitatively compare the processed sequences, three defects are chosen and SNR values are calculated for them for comparison. Figure 6 shows the obtained results.
The PCT and PLST results showed that both approaches were able to identify several discontinuities throughout the sample, including the insertion on the upper part and, especially problems with the aluminum and CFRP interface which were also detected in the numerical simulations. Table 2 shows the SNR values of the three defects chosen from the upper part of the sample. For each SNR value, the area considered was formed by 9 pixels. SNR values are shown for both techniques (PCT and PLST) and for the different sequences (MWIR and LWIR). Results show that, for our experiment, PCT provided a clearer image than PLST.
Additionally, mean and standard deviation values of the obtained SNRs could also be calculated. If only the SNR values obtained with PCT are considered, LWIR sequence has greater values. Mean and standard deviation for MWIR is 13.81 and 4.26 dB, respectively, while for LWIR they are 15.55 and 1.49 dB, respectively.

4. Discussion

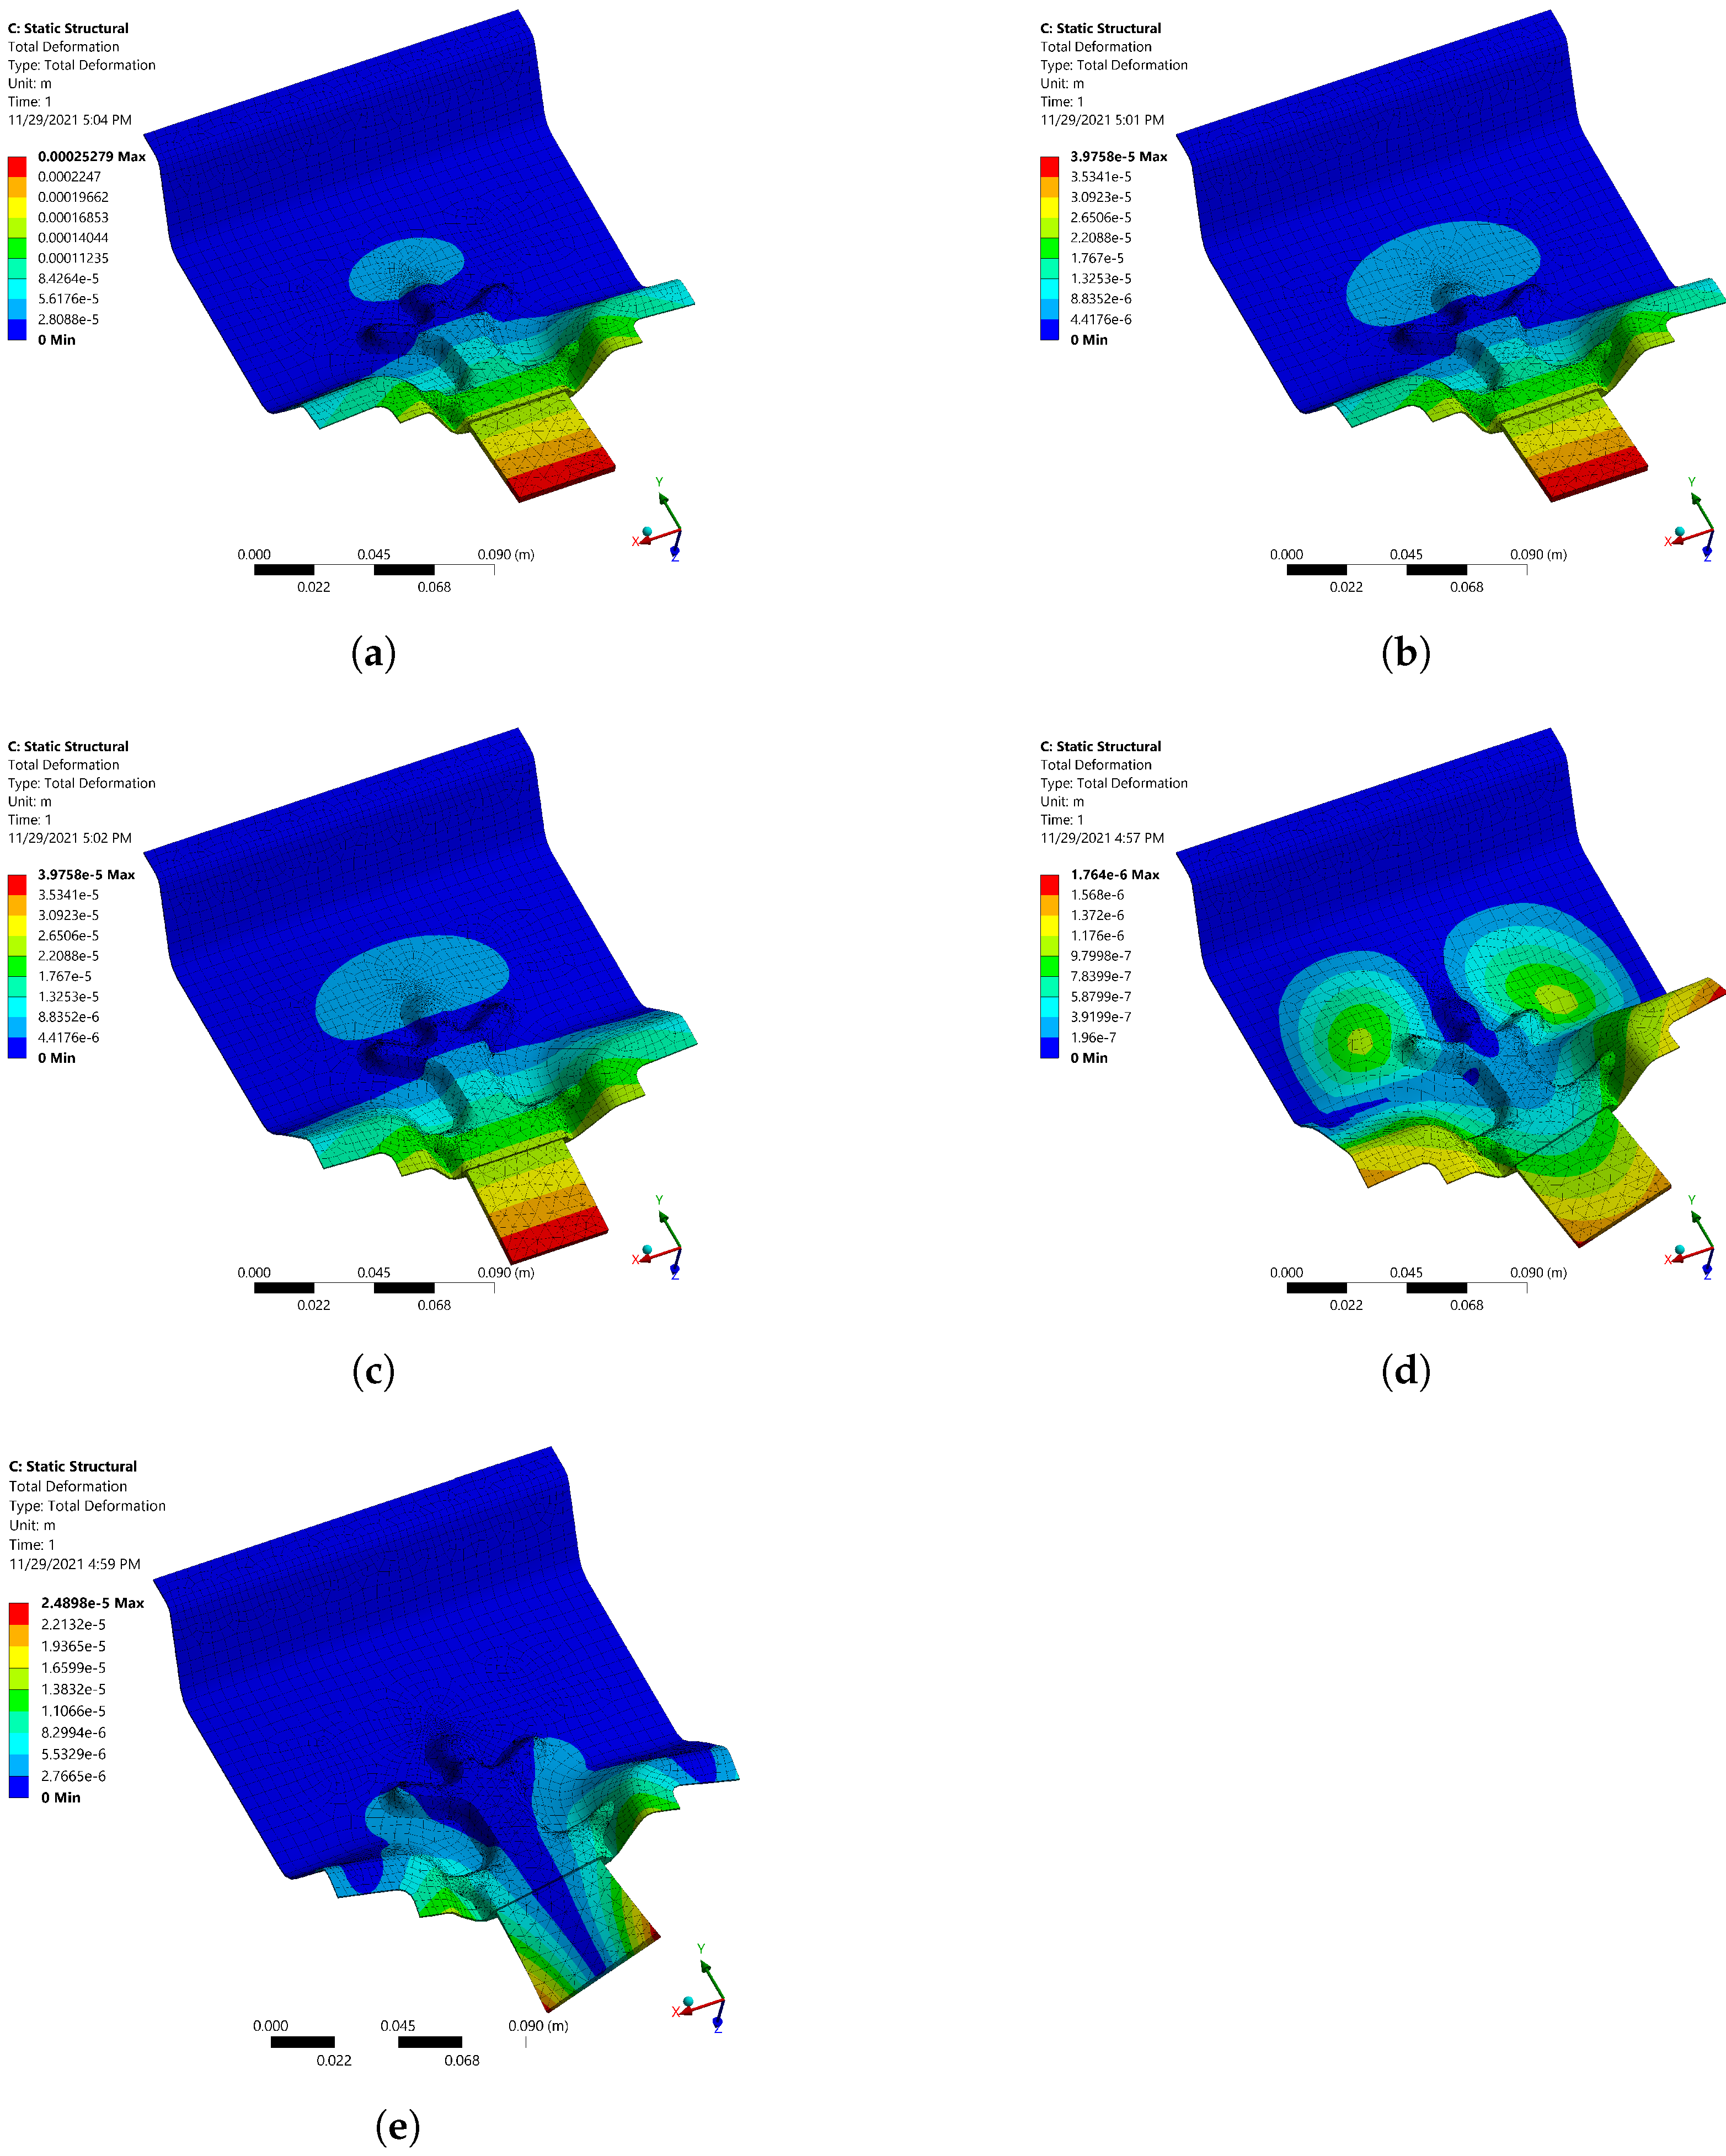
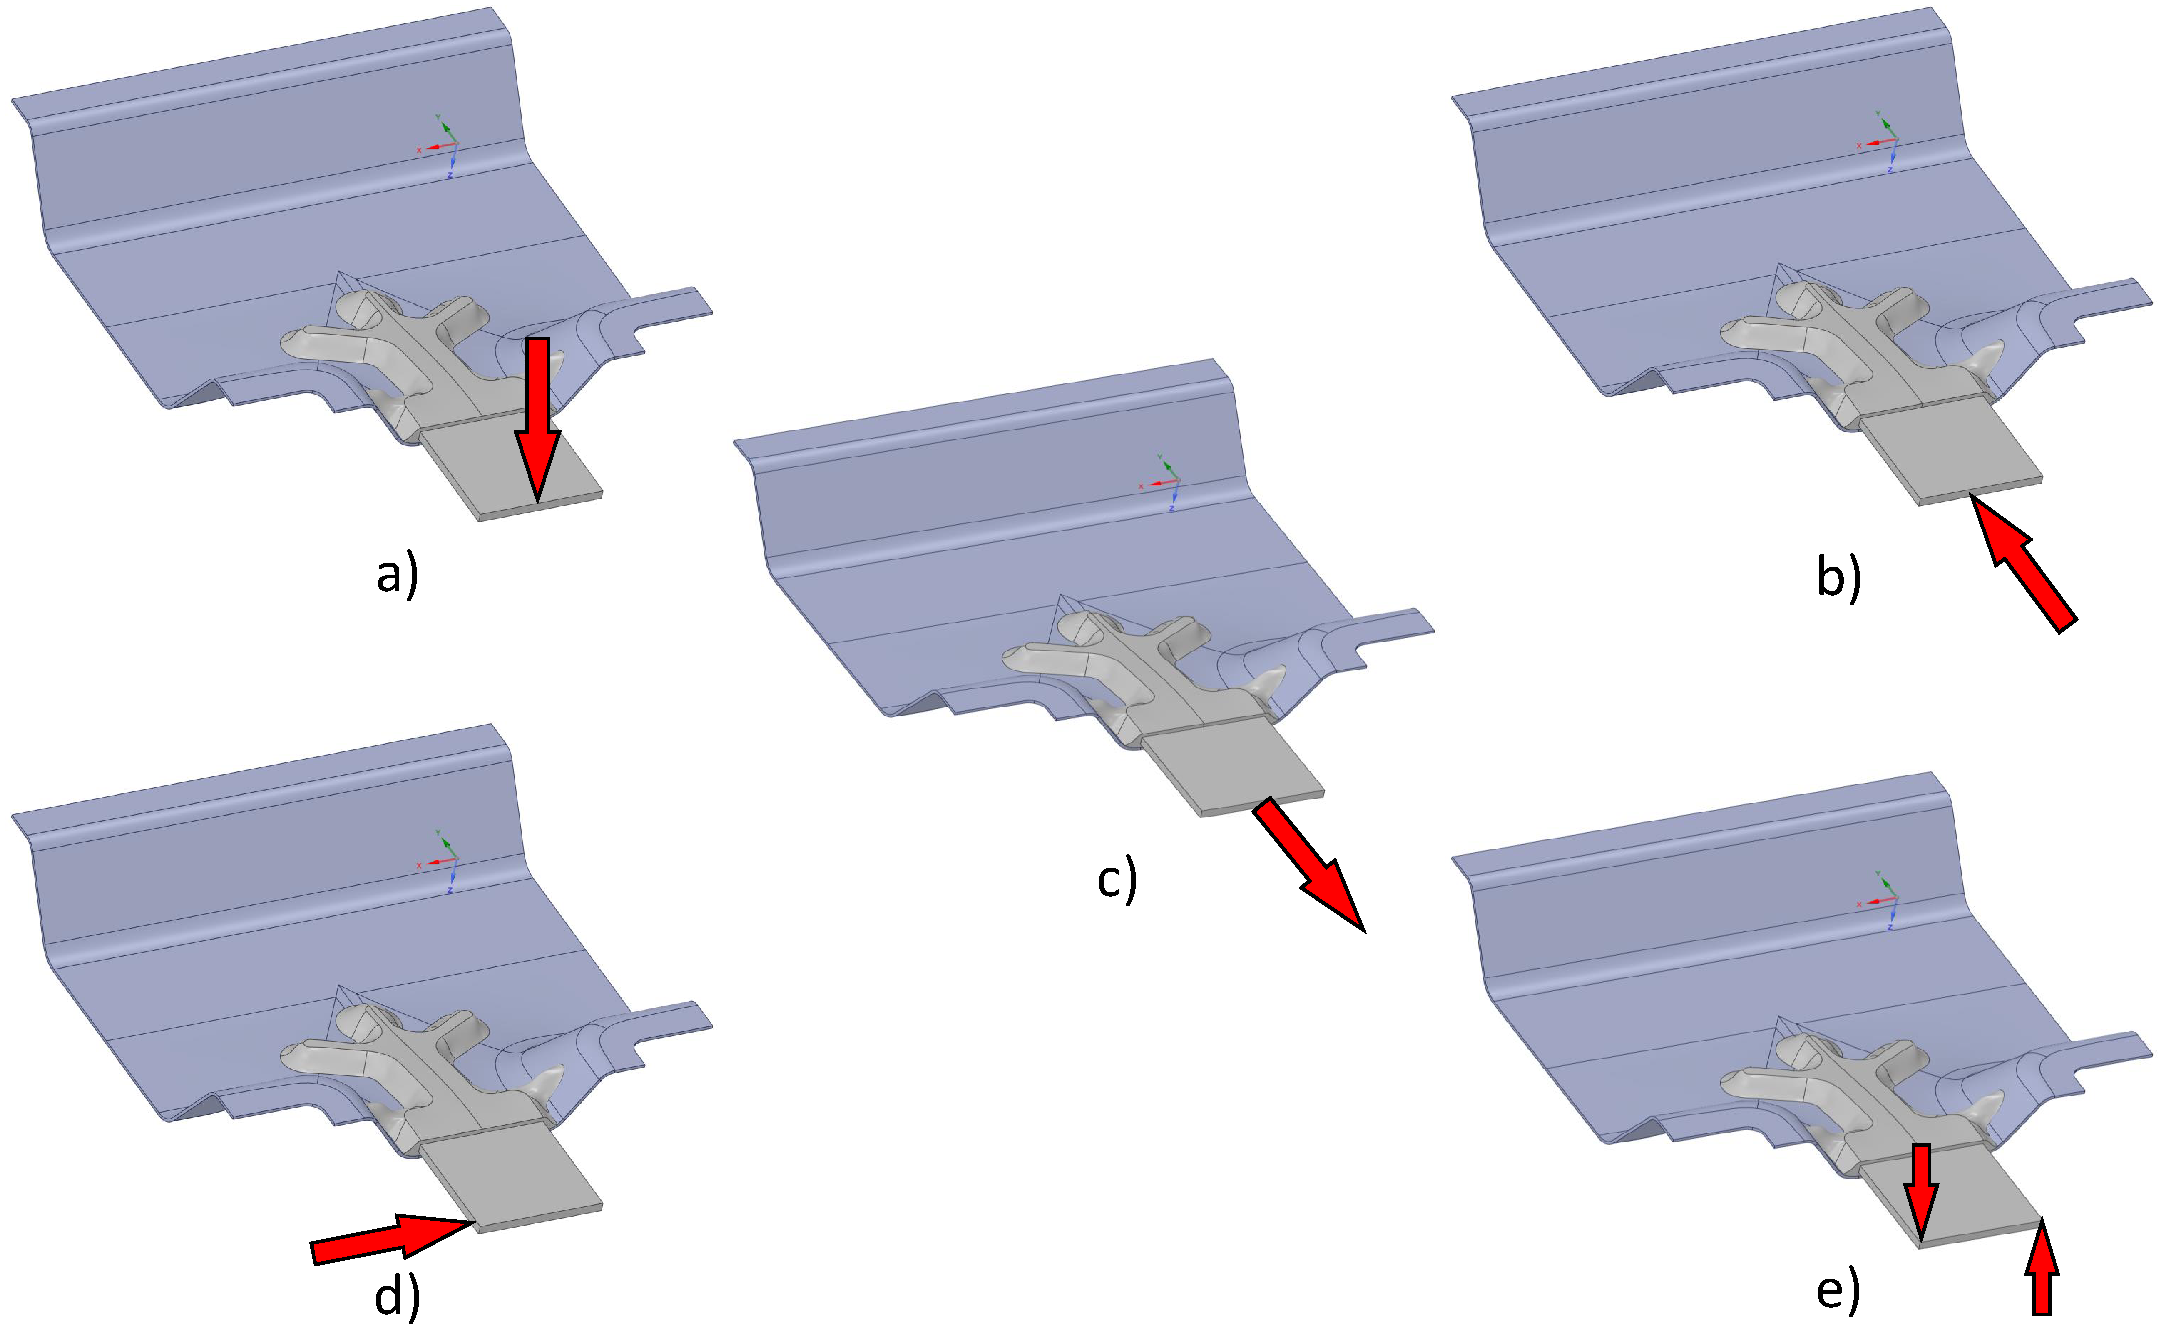
The simulation results shown in Figure 5 revealed that, for all cases where different forces were applied, the total deformation was concentrated in the interfaces regions between the aluminum inlay the the composite structure as it was expected.
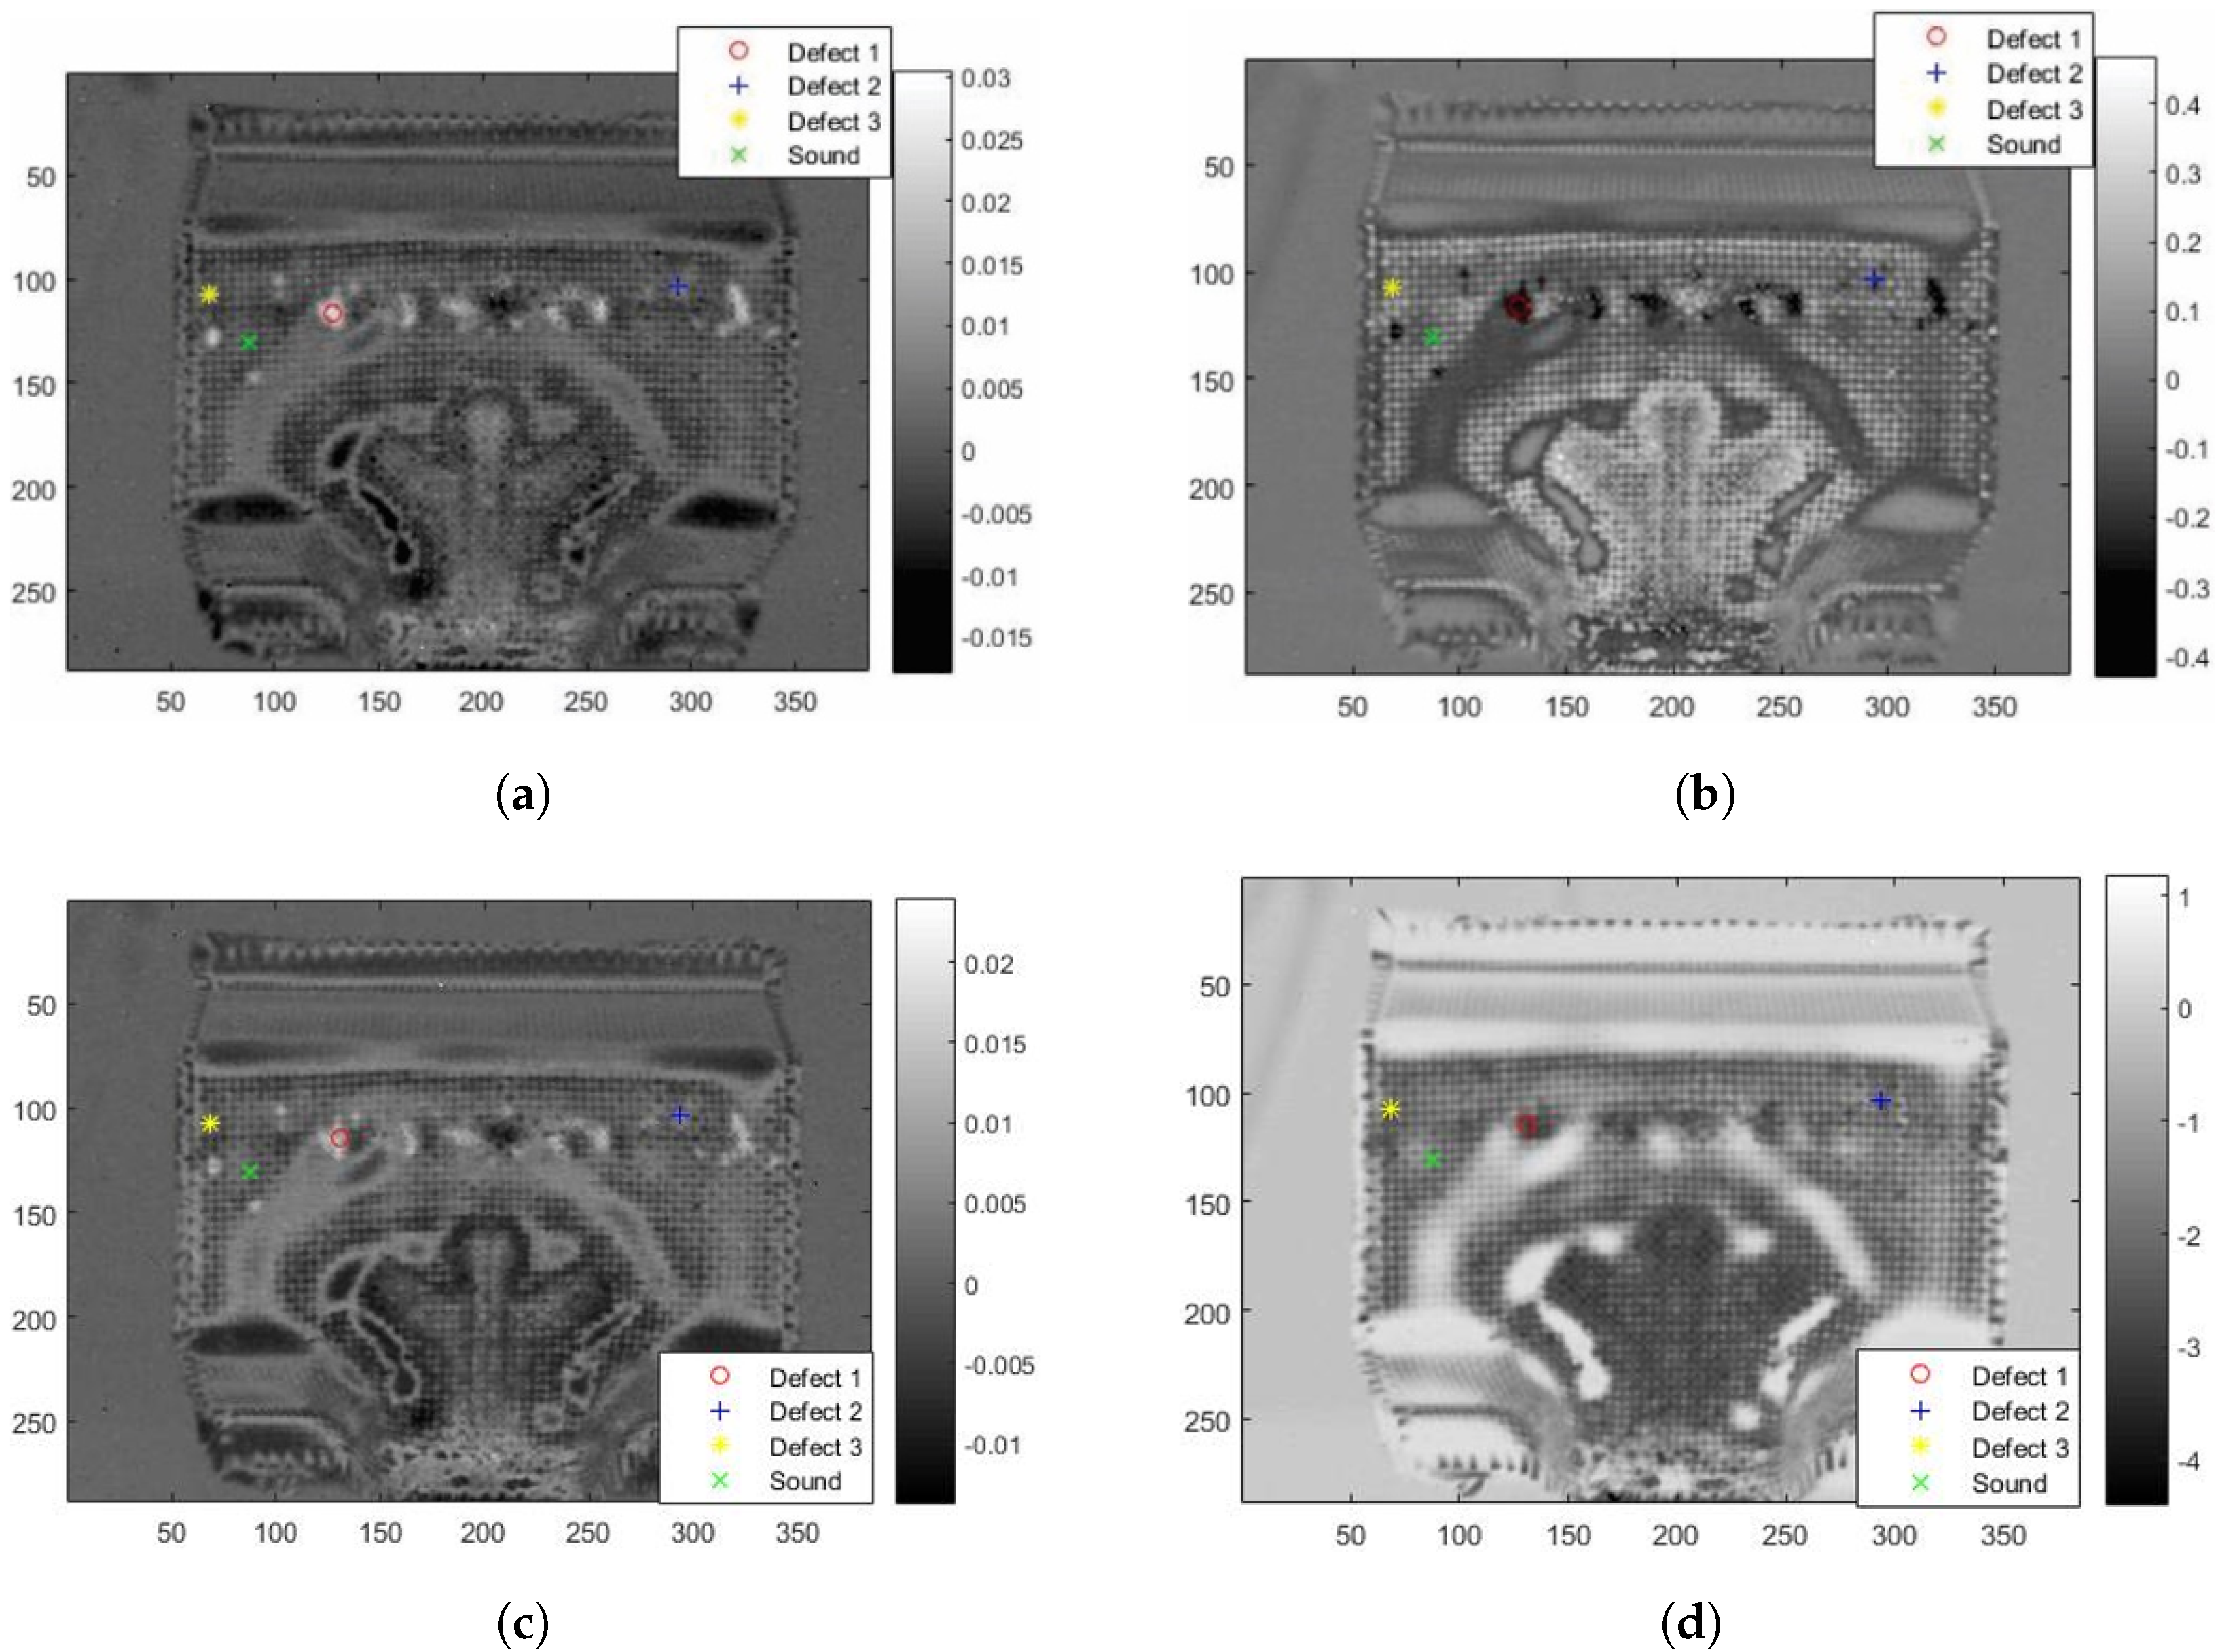
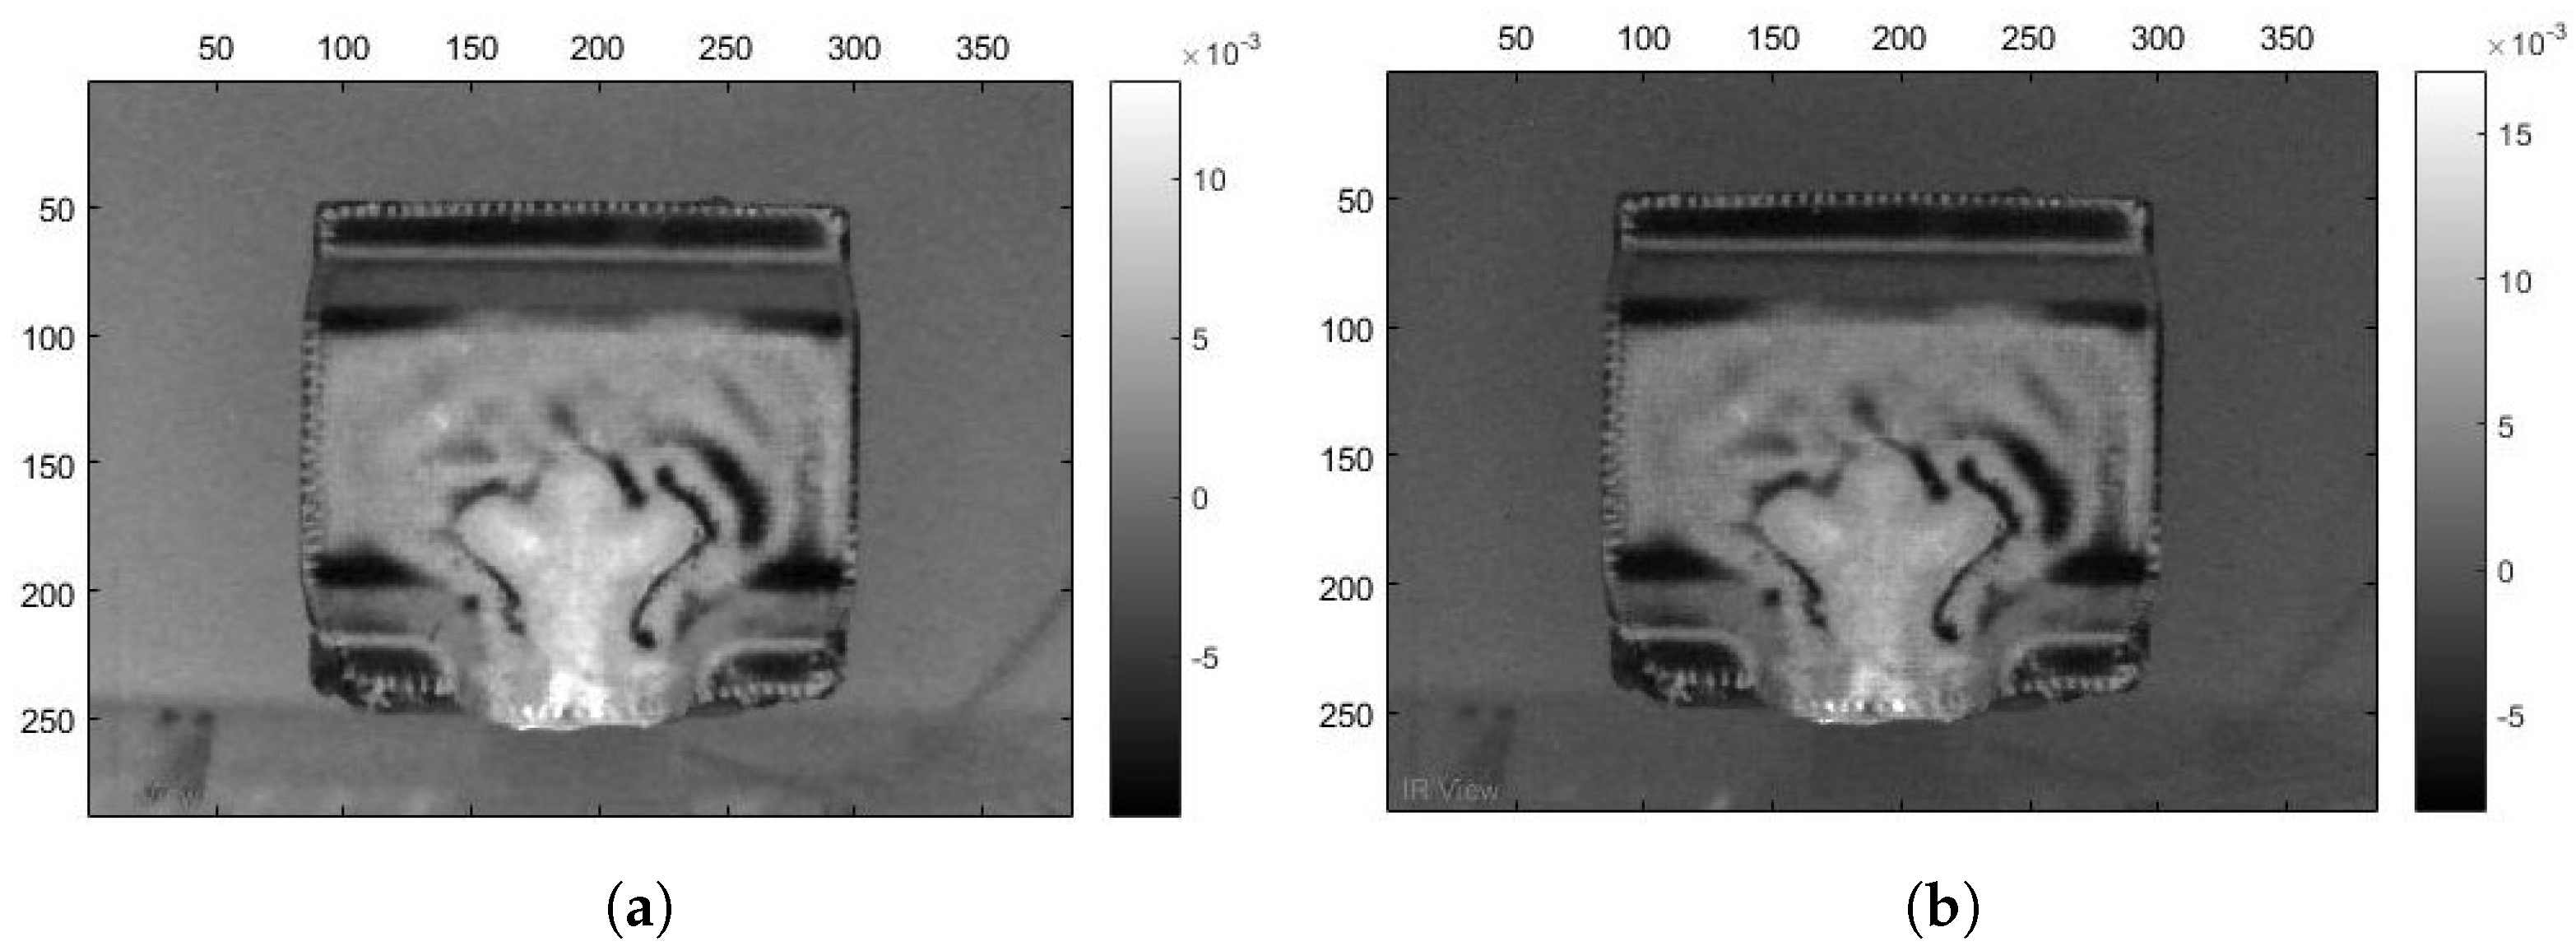
Moreover, IRT results revealed delaminations (parts of the big tape) and voids in the region where the artificial insert was placed. These defects probably occurred due to the resin flow during the molding process. It is worth to mention that the defects in this upper region have no relation to the simulation that were previously performed. IRT results were processed in two different spectral bands. In both bands, i.e., MWIR and LWIR, these delaminations are clearly visible, and, visually, images look alike. However, quantitative analysis performed with SNR comparison of the three randomly picked defects, two out of the three defects showed higher SNR value for the LWIR band. In addition, mean and standard deviation values are also higher for the LWIR images, e.g., when processed with PCT, LWIR results showed a mean value 12.5% higher while the standard deviation was almost three times lower. When one compare results within the spectral bands, but change the image processing technique, PCT showed a better performance in our study case. Nevertheless, both techniques, i.e., PCT and PLST, were capable of qualitatively pointing out the same discontinuities. First loading and first component of PLST and PCT, respectively, are not used because they have the most variation in the transient data, i.e., the flash pulse. Thus, it is highly saturated and does not present the better contrast to distinguish the discontinuities of interest from the background of the sample.
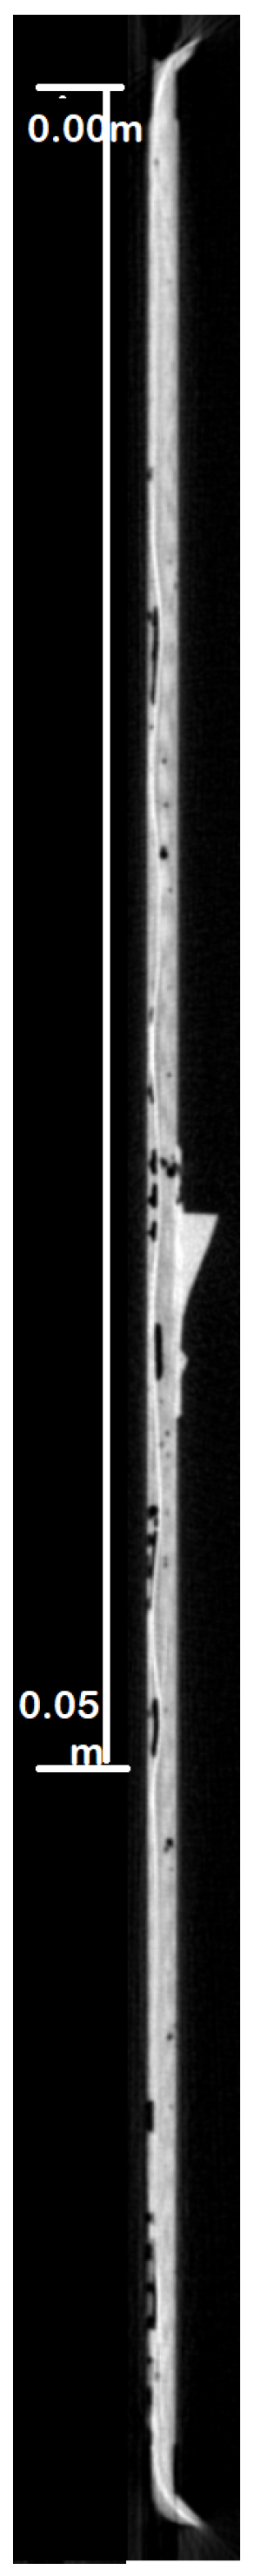
The inspected sample has a rectangular Teflon tape on its upper part. Its exact region is showed in Figure 1. This tape does not lay perfectly flat on the surface of the composite layer and consequently, it appears that there is no tape in some points. In fact, during molding process, the tape assumes a wavy shape. For the PCT results, bright spots in the tape region are caused by the tape and dark spots are cause by voids that appeared over the tape (air trapped between tape and composite). Bright and dark spots are inverted for PLST results. This behavior is confirmed by CT-Scan inspection of the sample. Figure 7 shows this wavy behavior and the voids over the tape. In addition, one can observe that, when there is no tape present, there is no defect in the region, as it is confirmed by PCT results of the inspection of another sample which has no tape inserted. These results are shown in Figure 8. Nevertheless, defects around the inlay aluminum part are also present confirming the results obtained during simulations.
Finally, areas that showed the highest degree of deformation in the numerical model, are likely resin-rich areas. These regions were all around the aluminum inlay. IRT results, in all spectral bands and processed with the two techniques, reveled solid colors in these areas, different to the fibers visible in the rest of the background (sound area) of the sample. Thus, these regions are clearly resin-rich areas. The highest deformation in the simulations occurred in these regions because resin is not the composite constituent that confers resistance to the composite structure, but, the fiber. Once there is no fiber, or, not enough fibers, the regions becomes weak and likely to be a point of failure.
This is a very new design and there are few works in the literature that dealt with this design. Bretz et al. [15] introduced the optimized design for connecting metal and CFRP. In their work, qualitative assessment was performed using cooperative data fusion of thermography and laser light section. While our work presented and quantitative assessment of artificial defects using infrared thermography, Bretz el al. [15] performed only a qualitative analysis before, during and after mechanical test of the sample. Jost et al. [16] also studied a similar hybrid structure. They, as Bretz et al. did, only qualitatively analyzed their results. Jost et al. [16] performed thermography and EMAT (electromagnetic acoustic transducers) inspections of the sample. Finally, Fernandes et al. [10] performed thermography inspections of this hybrid sample, but, instead of using PCT and PLST as it was done in the present work, Fernandes et al. [10] used an unsupervised probabilistic low-rank component factorization model. They also performed a quantitative analysis of detected defects. However, they did not performed a numerical analysis as it was done in this work. The present study is the only one to numerically analyze the deformation of the sample under mechanical forces which could happen during a real use case.

5. Conclusions

In this study, an aluminum-CFRP hybrid 3D sample with an artificial insert was inspected using pulsed thermography. In addition, a numerical finite element model was formulated in ANSYS® to analyze the total deformations to which the metal-composite-hybrid structure is subjected during a possible use, assessing possible regions where defects and failures may occur.
For the experimental analysis, two sets of images were used from two different spectral bands (mid- and long-wave infrared). A radiometric calibration was performed so that the data could be as closest as possible to what was happening in the sample. Treated data was then processed with two well-known IR processing techniques: PCT and PLST. Both techniques were able to detect the defects present in the region above the artificial tape as well as resin-rich areas around the metal inlay. A SNR analysis was performed with three randomly chosen defects in the tape region which indicated that, for this experiment, LWIR sequences processed with PCT produced better results. Nevertheless, MWIR band also provided satisfactory results as well as the PLST technique did produced results that can be used for damage assessment.
When one compares numerical results and the infrared images obtained with PCT and PLST, the regions where the highest degree of deformation on the numerical results coincide with discontinuities visible in the IRT image results that are likely to be resin-rich areas. These regions are all around the inlay aluminum part. Therefore, it indicates that the manufacturing process should be enhanced focusing on these regions to avoid these possible regions of failure to keep the advantages of the hybrid structure. For the infrared non-destructive inspection, the next steps of the research will include adding a 3D geometric model of the sample for better defect visualization of the defects detected in the 2D infrared image.

Author Contributions

Numerical model and writing, L.S.S.; experiments, analysis and writing, H.F.; manufacture and calibration, M.S.; co-supervision and revision, H.-G.H.; supervision and revision, A.C. All authors have read and agreed to the published version of the manuscript.

Funding

This research was funded by the Coordenacao de Aperfeicoamento de Pessoal de Nivel Superior—Brazil (CAPES)—Finance Code 001, by Fundacao de Amparo a Pesquisa do Estado Minas Gerais—Brazil (FAPEMIG)—Finance Code APQ-01576-18, and by the Deutsche Forschungsgemeinschaft (DFG) and by the Alexander von Humboldt Stiftung—Germany.

Institutional Review Board Statement

Not applicable.

Informed Consent Statement

Not applicable.

Data Availability Statement

All data generated or appeared in this study are available upon request by contact with the corresponding author.

Conflicts of Interest

The authors declare no conflict of interest.

References

  1. Richter, J.; Kuhtz, M.; Hornig, A.; Harhash, M.; Palkowski, H.; Gude, M. A Mixed Numerical-Experimental Method to Characterize Metal-Polymer Interfaces for Crash Applications. Metals 2021, 11, 818. [Google Scholar] [CrossRef]
  2. Yousefi, B.; Sfarra, S.; Ibarra Castanedo, C.; Maldague, X.P. Comparative analysis on thermal non-destructive testing imagery applying Candid Covariance-Free Incremental Principal Component Thermography (CCIPCT). Infrared Phys. Technol. 2017, 85, 163–169. [Google Scholar] [CrossRef]
  3. Summa, J.; Becker, M.; Grossmann, F.; Pohl, M.; Stommel, M.; Herrmann, H.G. Fracture analysis of a metal to CFRP hybrid with thermoplastic interlayers for interfacial stress relaxation using in situ thermography. Compos. Struct. 2018, 193, 19–28. [Google Scholar] [CrossRef]
  4. Meng, X.; Wang, Y.; Liu, J.; He, W. Nondestructive inspection of curved clad composites with subsurface defects by combination active thermography and three-dimensional (3D) structural optical imaging. Infrared Phys. Technol. 2019, 97, 424–431. [Google Scholar] [CrossRef]
  5. Zhang, H.; Sfarra, S.; Sarasini, F.; Santulli, C.; Fernandes, H.; Avdelidis, N.P.; Ibarra-Castanedo, C.; Maldague, X.P.V. Thermographic Non-Destructive Evaluation for Natural Fiber-Reinforced Composite Laminates. Appl. Sci. 2018, 8, 240. [Google Scholar] [CrossRef] [Green Version]
  6. Maldague, X.; Marinetti, S. Pulse phase infrared thermography. J. Appl. Phys. 1996, 79, 2694–2698. [Google Scholar] [CrossRef]
  7. Rajic, N. Principal component thermography for flaw contrast enhancement and flaw depth characterisation in composite structures. Compos. Struct. 2002, 58, 521–528. [Google Scholar] [CrossRef]
  8. Wei, Z.; Fernandes, H.; Herrmann, H.G.; Tarpani, J.R.; Osman, A. A Deep Learning Method for the Impact Damage Segmentation of Curve-Shaped CFRP Specimens Inspected by Infrared Thermography. Sensors 2021, 21, 395. [Google Scholar] [CrossRef] [PubMed]
  9. Lopez, F.; Ibarra-Castanedo, C.; de Paulo Nicolau, V.; Maldague, X. Optimization of pulsed thermography inspection by partial least-squares regression. NDT E Int. 2014, 66, 128–138. [Google Scholar] [CrossRef]
  10. Fernandes, H.; Zhang, H.; Quirin, S.; Hu, J.; Schwarz, M.; Jost, H.; Herrmann, H.G. Infrared thermographic inspection of 3D hybrid aluminium-CFRP composite using different spectral bands and new unsupervised probabilistic low-rank component factorization model. NDT E Int. 2022, 125, 102561. [Google Scholar] [CrossRef]
  11. Quirin, S.; Herrmann, H.G. Combining the spectral information of Dual-Band images to enhance contrast and reveal details. In Proceedings of the 14th International Conference on Quantitative Infrared Thermography 2018, (QIRT 2018), Berlin, Germany, 25–29 June 2018; Creative Commons (QIRT Council): Québec, QC, Canada, 2018; pp. 779–785. [Google Scholar] [CrossRef]
  12. Quirin, S. Multispektraler Ansatz zur Verbesserung der thermografischen Prüfbarkeit von Werkstoffverbunden. Ph.D. Thesis, Saarländische Universitäts und Landesbibliothek, Saarbrucken, Germany, 2020. [Google Scholar] [CrossRef]
  13. Hidalgo-Gato García, R.; Andrés Álvarez, J.R.; López Higuera, J.M.; Madruga Saavedra, F.J. Quantification by Signal to Noise Ratio of Active Infrared Thermography Data Processing Techniques; Scientific Research Publishing: Wuhan, China, 2013. [Google Scholar] [CrossRef]
  14. Albendea, P.; Madruga, F.; Cobo, A.; López-Higuera, M. Signal to noise ratio (SNR) comparison for pulsed thermographic data processing methods applied to welding defect detection. In Proceedings of the 10th International Conference on Quantitative Infrared Thermography 2010, (QIRT 2010), Quebec City, QC, Canada, 27–29 July 2010; Creative Commons (QIRT Council): Québec, QC, Canada, 2010; pp. 27–30. [Google Scholar]
  15. Bretz, L.; Günther, F.; Jost, H.; Schwarz, M.; Kretzschmar, V.; Pohl, M.; Weiser, L.; Haefner, B.; Summa, J.; Herrmann, H.; et al. Design and quality assurance of intrinsic hybrid metal-CFRP lightweight structures. In Proceedings of the 4th International Conference Hybrid Materials and Structures (Hybrid 2020), Web-Conference, Karlsruhe, Germany, 28–29 April 2020; pp. 144–156. [Google Scholar]
  16. Jost, H.; Schwarz, M.; Grossmann, F.; Sauer, J.; Hell, A.; Herrmann, H.G. Nondestructive and Destructive Testing on Intrinsic Metal-CFRP Hybrids. In Technologies for Economic and Functional Lightweight Design; Dröder, K., Vietor, T., Eds.; Springer: Berlin/Heidelberg, Germany, 2021; pp. 279–289. [Google Scholar] [CrossRef]
Figure 1. Inspected sample. (a) Front, back, and (b) 3D view. The red box indicates the position of the artificial delamination.
Metals 11 01938 g001
Figure 2. Fixed areas of the structure in red.
Metals 11 01938 g002
Figure 3. Forces applied to the metal inlay. (a) bending, (b) compression, (c) traction load, (d) lateral bending, (e) torsion.
Metals 11 01938 g003
Figure 4. PT set-up used during the experiments. (A) IR camera, (B) flash (heat source), (C) inspected sample, (D) black body.
Metals 11 01938 g004
Figure 5. Total deformation of the metal-composite-hybrid structure: (a) bending; (b) compression; (c) traction load; (d) lateral bending; (e) torsion.
Metals 11 01938 g005
Figure 6. IR result images. In the MWIR band: (a) PCT 3rd EOF, and (b) PLST: 2nd loading. LWIR: (c) PCT 3rd EOF, and (d) PLST: 2nd loading.
Metals 11 01938 g006
Figure 7. CT-Scan result image showing the wavy shape of the Teflon tape.
Metals 11 01938 g007
Figure 8. PCT results of sample without Teflon tape. (a) 2nd EOF of MWIR sequence, and (b) 2nd EOF of LWIR sequence.
Metals 11 01938 g008
Table 1. Properties of the materials.
Epoxy Carbon WovenProperties
Density1512 kg/m 3
Young’s modulus × direction2.3 × 10 11 Pa
Young’s modulus Y direction2.3 × 10 11 Pa
Poisson’s ratio XY0.04
Shear modulus XY3.3 × 10 9 Pa
AluminumProperties
Density2770 kg/m 3
Young’s modulus0.7 × 10 11 Pa
Polyphthalamide (PPA)Properties
Density1272 kg/m 3
Young’s modulus × direction1.12 × 10 10 Pa
Young’s modulus Y direction3.5 × 10 9 Pa
Poisson’s ratio XY0.3
Shear modulus XY5 × 10 9 Pa
Table 2. SNR results.
MWIRLWIR
DefectPCTPLSTPCTPLST
#119.7 dB17.1 dB17.6 dB13.2 dB
#210.0 dB9.1 dB14.2 dB5.7 dB
#311.7 dB9.8 dB14.8 dB12.3 dB
Publisher’s Note: MDPI stays neutral with regard to jurisdictional claims in published maps and institutional affiliations.

